Luke Schmidt, Maria Smorgonskaya, & James Sprow | Blue Vault
When investors or financial advisors think about front-end loads, what comes to mind? Front-end loads in the alternative investment industry are typically thought of as fees charged to purchase common shares in public offerings, whether they be nontraded REITs, nontraded BDCs, or interval funds. These loads in most offerings of nontraded REIT Class T shares, for example, consist of both a selling commission and a dealer-manager fee, which combined make the front-end load. Among the current nontraded REIT offerings with multiple share classes, the loads can vary by share class. The nontraded REIT Class D and Class I shares, for example, may not have front loads, and at least two nontraded REIT offerings have no front loads for any share class. The exact fees charged are listed by each program in their respective prospectuses for investors to review prior to purchasing shares.
In the case of nontraded REITs, these loads have historically been upwards of 10.00% of the stated offering price, resulting in a final sales price that made the products less attractive to potential investors. More recently the front-end loads in the latest open offerings have been reduced for the majority of REITs with Class T shares. With the total of dealer manager fees and selling commissions currently 3.50% for many open Class T offerings, front loads are much less of a burden for investors.
While parts of these loads are sometimes paid by the program’s sponsor or advisor, most of these fees are paid by the investor when the shares are purchased. There may be volume discounts available to the investor depending on the number of shares purchased. Not all investors will pay the full front-end load listed in the prospectus, but for the purposes of the following examples, we will assume the investor receives neither sponsor support nor volume discounts and pays the full front-end load.
Looking more specifically at how front-end loads are calculated and applied, it would seem like a straightforward calculation at first glance. If a fund has an estimated NAV of $10.00 and charges a front-end load of 5.00%, simple math implies that an investor would be charged $10.50 per share. This calculation is basic: $10.00 x (1 + 0.05) = $10.50 per share. However, that is not always how these loads are calculated. Instead the load can be applied so that it is 5.00% of the final purchase price, which ends up being $10.5263 per share. For example, the final price may be calculated as: $10.00 / (1- 0.05) = $10.5263 per share, which means that the formula for the final price is effectively $10.00 + ($10.5263 x 0.05). This method of calculating the final offering price is made very clear by most interval funds, as many show this calculation explicitly in their semi-annual or annual statements. Nontraded REITs and nontraded BDCs, however, make it much less clear when it comes to their offering price calculations.1
For those offerings that charge the front load as a percentage of the estimated NAV, the math is simply: Price = NAV x (1 + % Load).
For those offerings that charge the front load as a percentage of the final price, the math is different: Price = NAV + (Price x % Load).
When the front-end load is calculated as a percentage of the total purchase price, the method used to calculate the load may appear to be confusing and potentially deceptive. To illustrate this, we can look at two different cases where front-end loads are being charged which may help clarify the differences:
(1) The investor purchases a specific number of shares
(2) The investor invests a specific amount of money
The differences between these two scenarios are the total initial out-of-pocket costs and the total number of shares owned after the transaction. Looking at two hypothetical scenarios, we can assume NTR ABC currently has a recent estimated NAV of $10.00 that is the stated price per share and a 5.00% front-end load. Rather than 5.00% of the NAV, the load is calculated as 5.00% of the total cost per share (TC).
Under the first scenario, an investor informs his financial advisor his desire to purchase 1,000 shares of NTR ABC’s common stock. The investor’s initial out-of-pocket price would be $10,526.32.
The calculation is done so that the front-end load is 5.00% of the total cost of the shares. The NAV is $10.00 and the total cost per share (TC) can be shown as TC = $10.00 + (5% x TC). Re-arranging to solve for TC, we have:
$10.00 / (1 – 0.05) = TC
$10.00 / (1 – 0.05) = $10.52632 price paid per share
$10.52632 x 1,000 shares = $10,526.32 total price paid
After this purchase, the investor would have paid $10,526.32 and would own 1,000 shares of NTR ABC’s common stock. He would have paid a total of $526.32 in front-end load fees. The front-end load appears to be 5.26% rather than 5.00% described by the fund. A second scenario illustrates how the 5.00% load might be explained to the investor.
Under the second scenario, instead of wishing to purchase a specific number of shares, the investor informs his financial advisor of their desire is to invest $10,000 in shares of NTR ABC’s common stock. The investor’s out-of-pocket cost would be exactly that amount, $10,000, but they would own fewer shares of common stock compared to the first scenario.
$10.00 / (1 – 0.05) = $10.52632 price paid per share
$10,000 / $10.52632 = 950 shares
After this purchase, the investor would have paid $10,000 and would own 950 shares of NTR ABC’s common stock. They would have paid a total of $500.00 in front-end load fees. Under this scenario, it could be said that 5.00% of the investment of $10,000 is going to pay the front load, but that $500 is still 5.26% of $9,500, the cost of the shares before the load is added.
The differences in these two scenarios illustrate the importance of understanding all fees charged and how they are charged for each product. All fees can be found in the prospectus that is filed with the SEC by each fund. While this article only touches on one portion of fees that are charged by funds, there are many other fees and charges that ultimately have a direct impact on returns experienced by the investor. For more information and a thorough analysis of all other fees being charged by different nontraded REITs, please see Blue Vault’s Third Edition Nontraded REIT Fee Study.
Below is a table that shows the front-end loads for 21 open nontraded REIT offerings as of September 30, 2019, and the method of calculating and applying those loads contained in their respective S-11s (Offering Prospectuses) filed with the SEC.
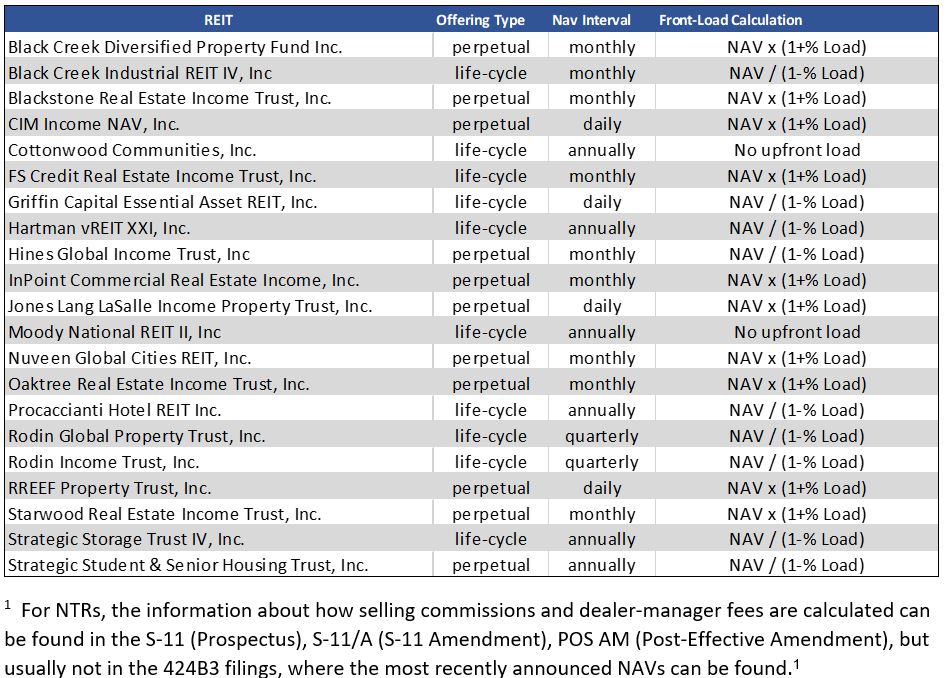
Source: SEC