
File:Diagramma adattamento indotto.svg

Size of this PNG preview of this SVG file: 648 × 253 pixels. Other resolutions: 320 × 125 pixels | 640 × 250 pixels | 1,024 × 400 pixels | 1,280 × 500 pixels | 2,560 × 1,000 pixels.
Original file (SVG file, nominally 648 × 253 pixels, file size: 18 KB)
| This is a file from the Wikimedia Commons. Information from its description page there is shown below. Commons is a freely licensed media file repository. You can help. |
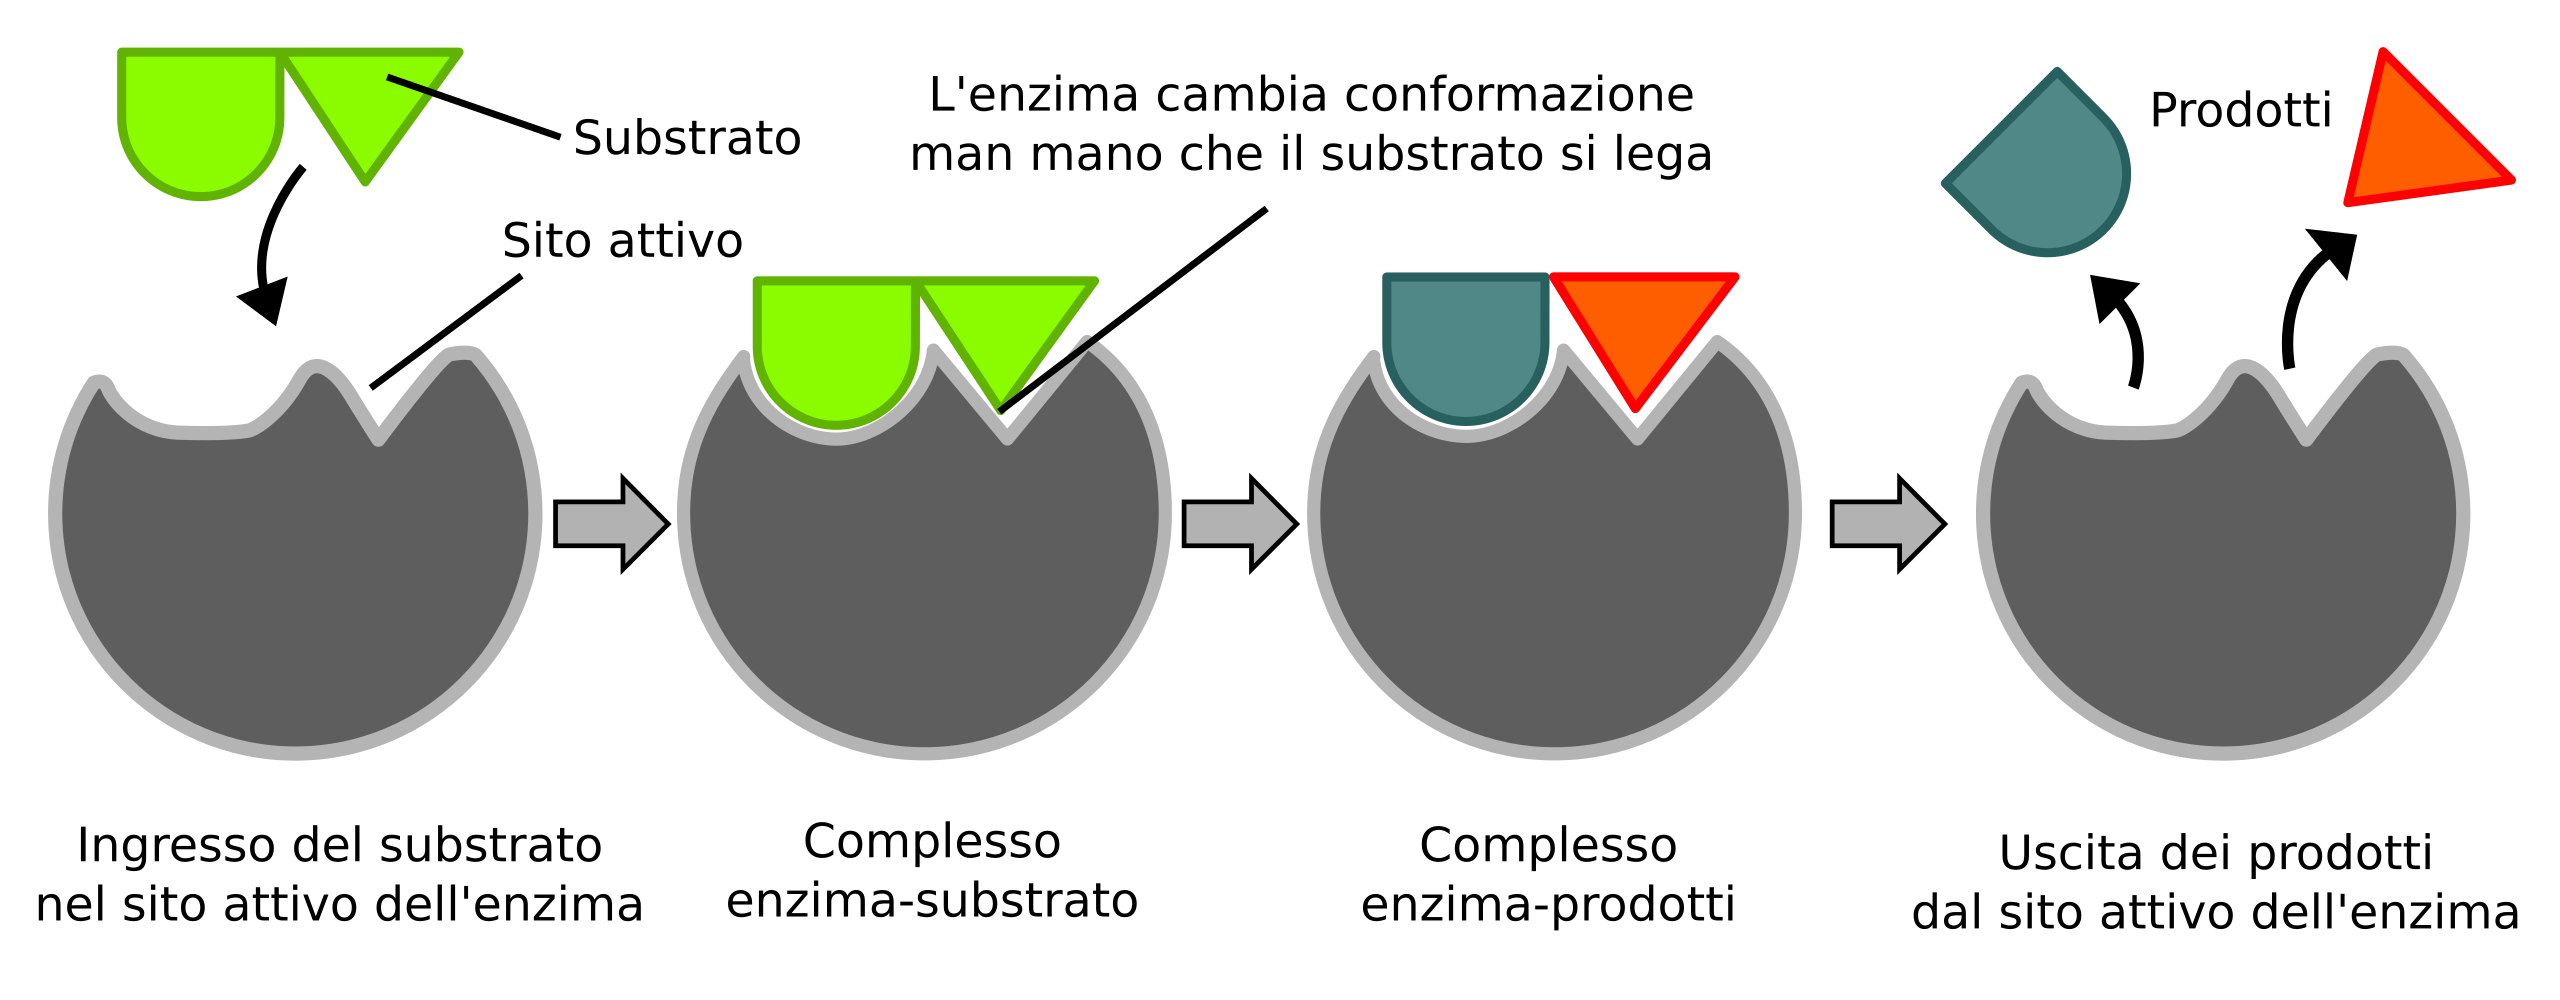
| Description | Diagram illustrating the induced fit model of enzyme activity. | ||
| Date | |||
| Source | Translation from Image:Induced fit diagram.svg by TimVickers | ||
| Author | Created by TimVickers, vectorized by Fvasconcellos | ||
| Permission (Reusing this file) |
|
||
| Other versions | en:Image:Induced fit diagram mod 2.png |
File history
Click on a date/time to view the file as it appeared at that time.
| Date/Time | Thumbnail | Dimensions | User | Comment | |
|---|---|---|---|---|---|
| current | 18:42, 2 May 2007 | 648 × 253 (18 KB) | Giac83 | {{Information |Description=Diagram illustrating the induced fit model of enzyme activity. |Source=Translation from Image:Induced fit diagram.svg by TimVickers |Date=October 11, 2006 |Author=Created by Ti |
File usage
No pages on the English Wikipedia use this file (pages on other projects are not listed).
Global file usage
The following other wikis use this file:
- Usage on it.wikipedia.org