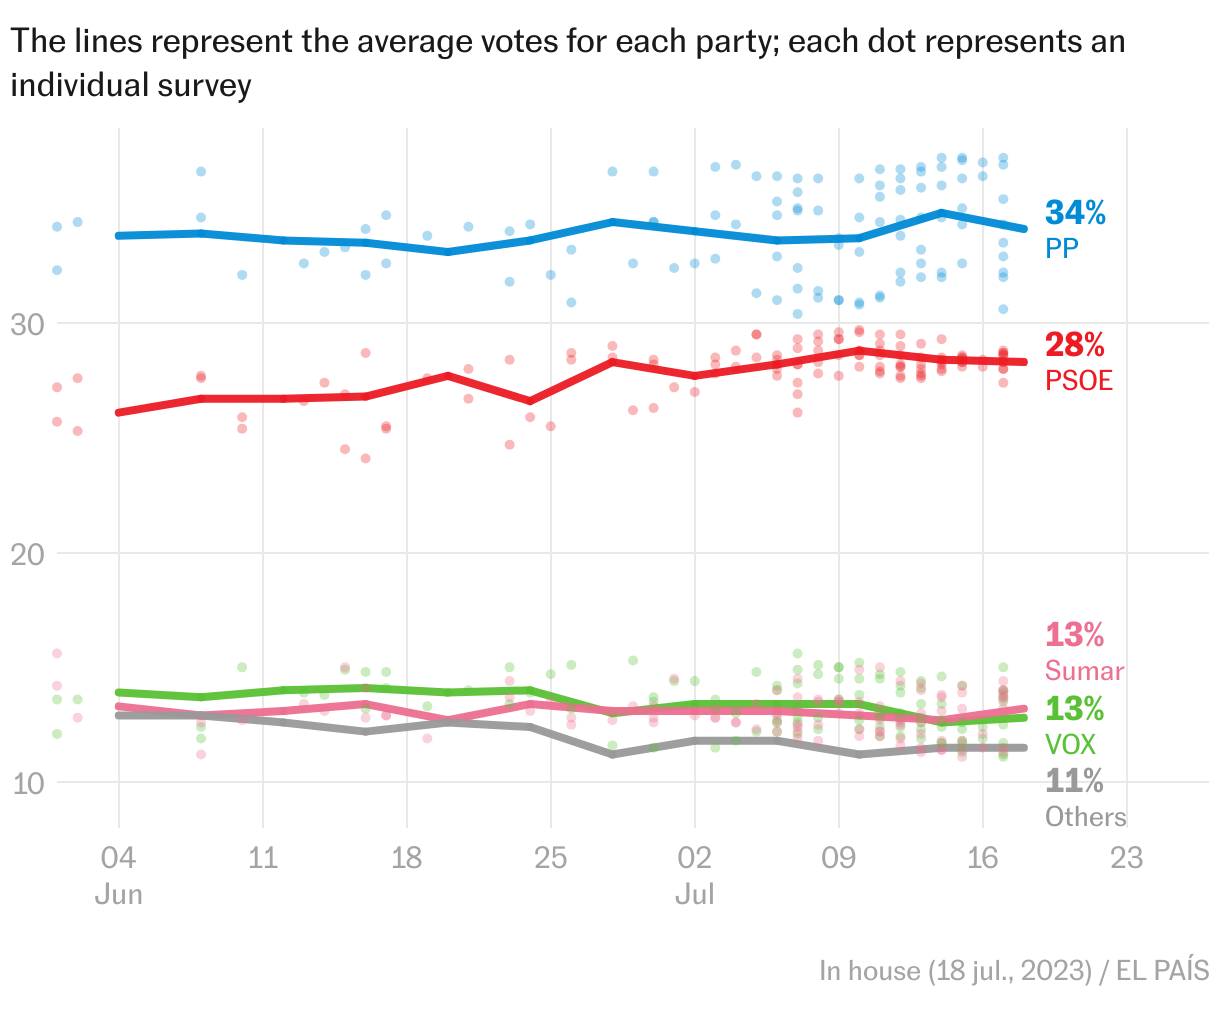
Who will win Spain’s national election on Sunday? This is what the polls are saying
The following is the prediction of seats and majorities of our statistical model, based on polls and 15,000 simulations. The most likely outcome is that PP and Vox will have a majority (55% of the time), but it would not be entirely surprising to see a tight result and a left-wing government
Spaniards have been asked to vote in an early national election that will take place this coming Sunday. The polls ended on Monday with mixed forecasts. Some see a clear majority for the right, others give it a narrow majority and some see a left-wing government as more likely. Taking into account all this data and the natural error of the polls, what are the probabilities of each event? This is the question answered by our classic probabilistic electoral model, which EL PAÍS has been publishing since 2016.
The following graph represents our estimate of seats based on the average of polls. The conservative Popular Party (PP) would have around 142 seats, followed by the Socialist Party (PSOE) with 108, the far-right Vox with 35 and the left-wing Sumar with 34. The rest of the political forces would have around 31 seats in total.
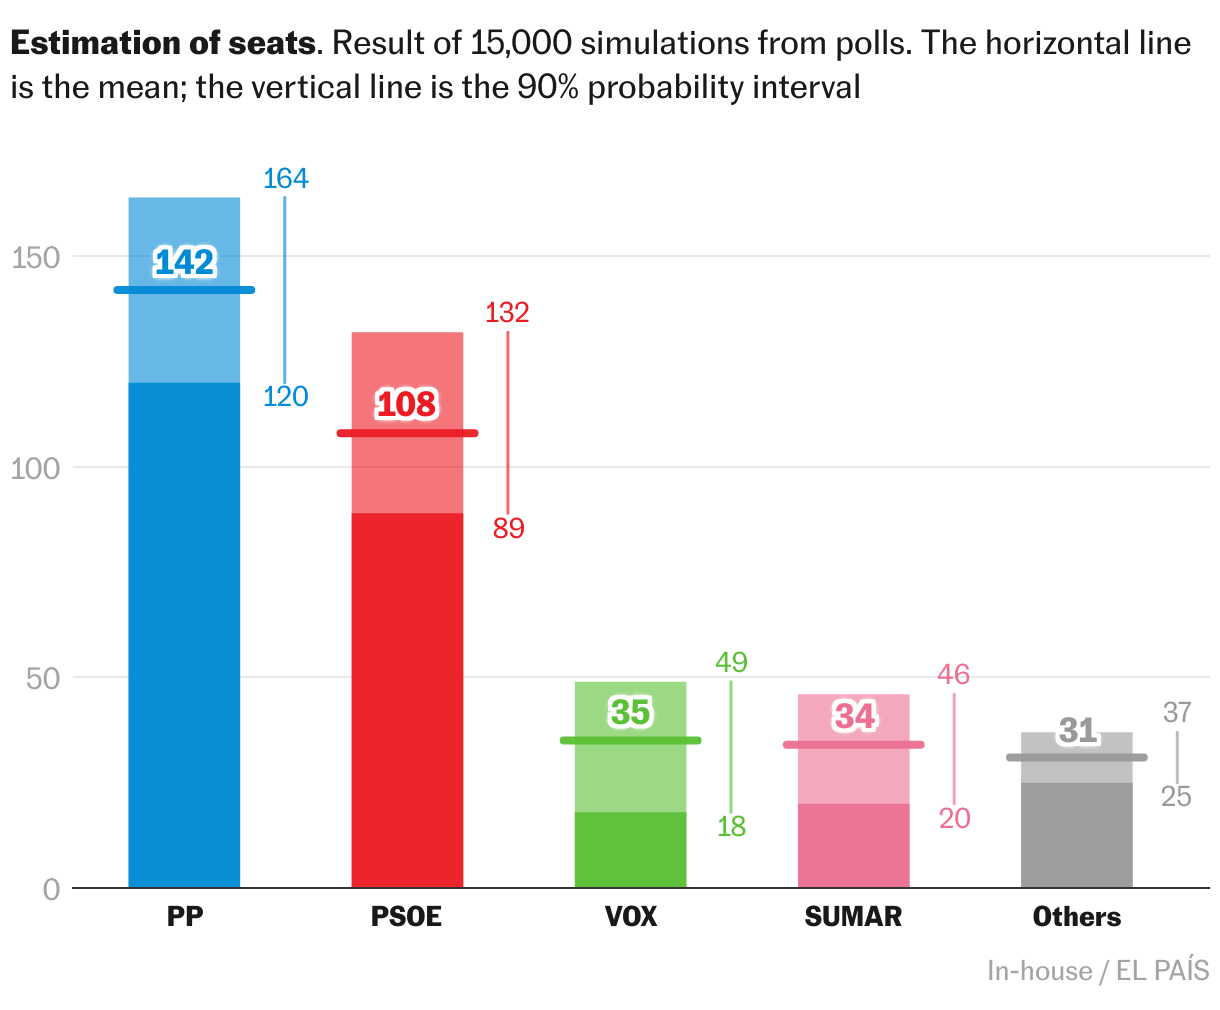
To make this estimate we used a statistical model and simulated the elections 15,000 times, as explained in the methodology at the end of the article. The model is fed by polls and incorporates a key piece of information: its historical accuracy.
In Spain, polls typically deviate from the outcome by about two points per party on average, and it is not uncommon for them to make errors of three or more points with some of these. In other words: our ranges are wide but not capricious, because they represent the accuracy of past polls.
It is easy to see the uncertainty that still surrounds these elections. For example, according to our calculations, the PP’s most likely outcome would be around 142 seats, but its 90% probability range is from 119 to 164 seats. And there is still a one in 20 chance that the PP would end up above (or below) that huge range.
The key: who will achieve a majority
The main advantage of having a prediction model is that it allows us to attribute probabilities to different results, something that polls alone cannot do. This makes it possible to address the fundamental question of a general election: which parties have a chance of winning the 176 seats required for a majority? The graph shows the summary:
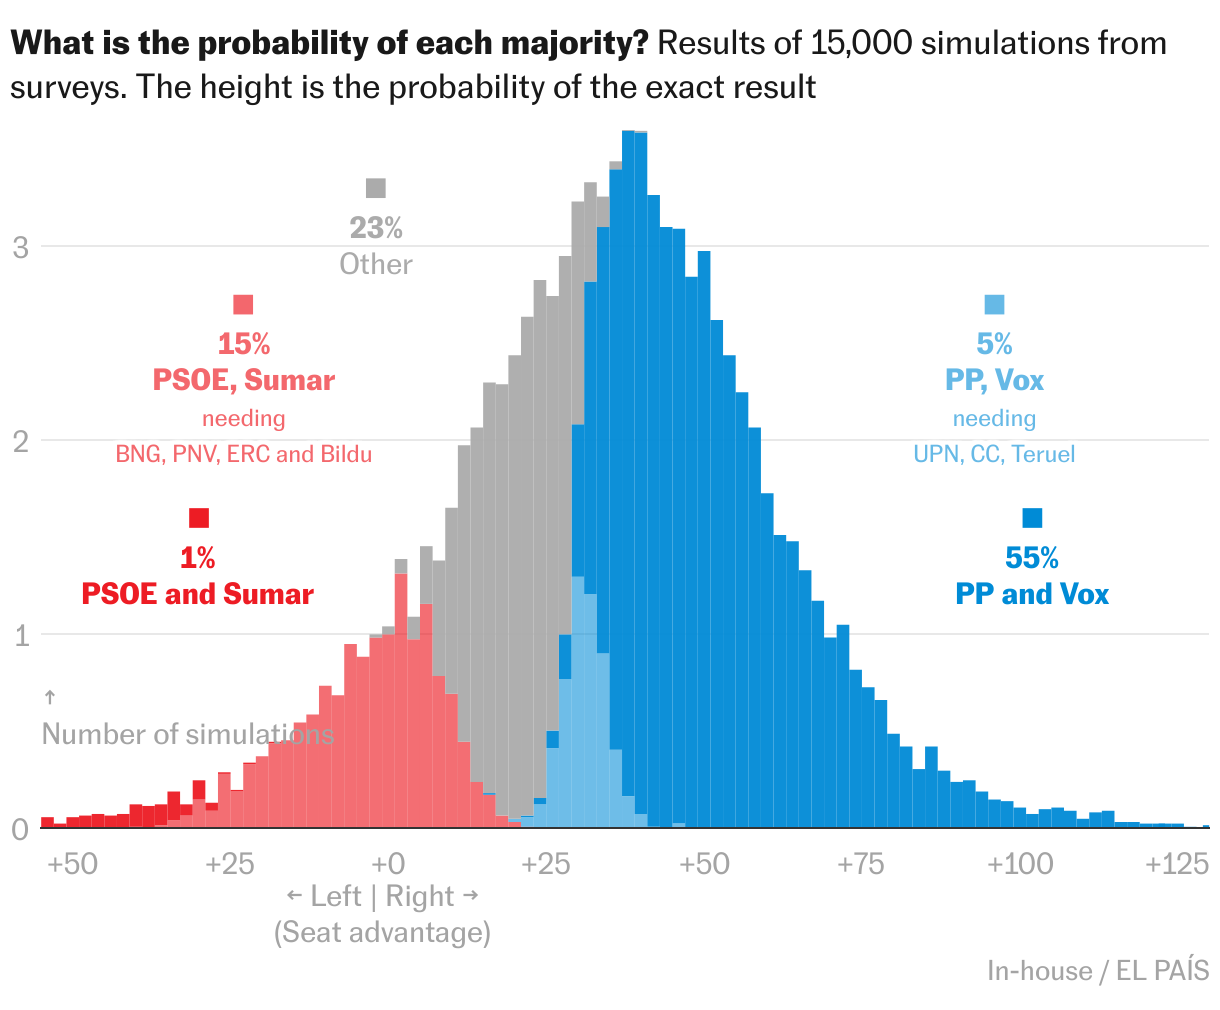
- 55% of the time PP and Vox will add up to a majority. In the 15,000 simulations, that is the frequency with which the two parties reach the 176 seats they need. The PP’s solitary majority only occurs in 1 out of 100 occasions (1%). In another 5% of the simulations there could be a PP government, if in addition to getting support from Vox in an investiture vote, the party also secures backing from Coalición Canaria, Unión del Pueblo Navarro and Teruel Existe.
- In another 15% of the simulations (1 of 7) there would probably be a left-wing majority, if the PSOE were to obtain the support of the same parties that voted in favor or abstained when Pedro Sánchez was confirmed as the new PM by parliament after the 2019 elections: BNG, PNV, ERC and Bildu, in addition to Sumar. And then there is 1% of possibilities for PSOE and Sumar to reach the majority alone.
- In 23% of the remaining simulations, none of the above sums is possible. These are almost always scenarios where the PSOE would also need the support of the Catalan pro-independence parties Junts, CUP or both to exceed 176 seats (20% of the time). But also included here are ties at 175 seats between that group (PSOE, Sumar, BNG, PNV, ERC, Bildu, Junts and CUP) and the one formed by PP, Vox, UPN, CC and Teruel Existe (3%).
What does this data mean? The above figures are probabilities: the probabilities that each majority is likely to occur. They say that a majority of PP and Vox is the most likely outcome, although it happens approximately half of the time. In a way, these forecasts are a warning against possible surprises. Another way of looking at it is to imagine a tree of alternatives. Out of every 100 possible futures, the numbers at the top say in how many the right wins and in how many the left wins. What we don’t know is which of those futures will be ours.
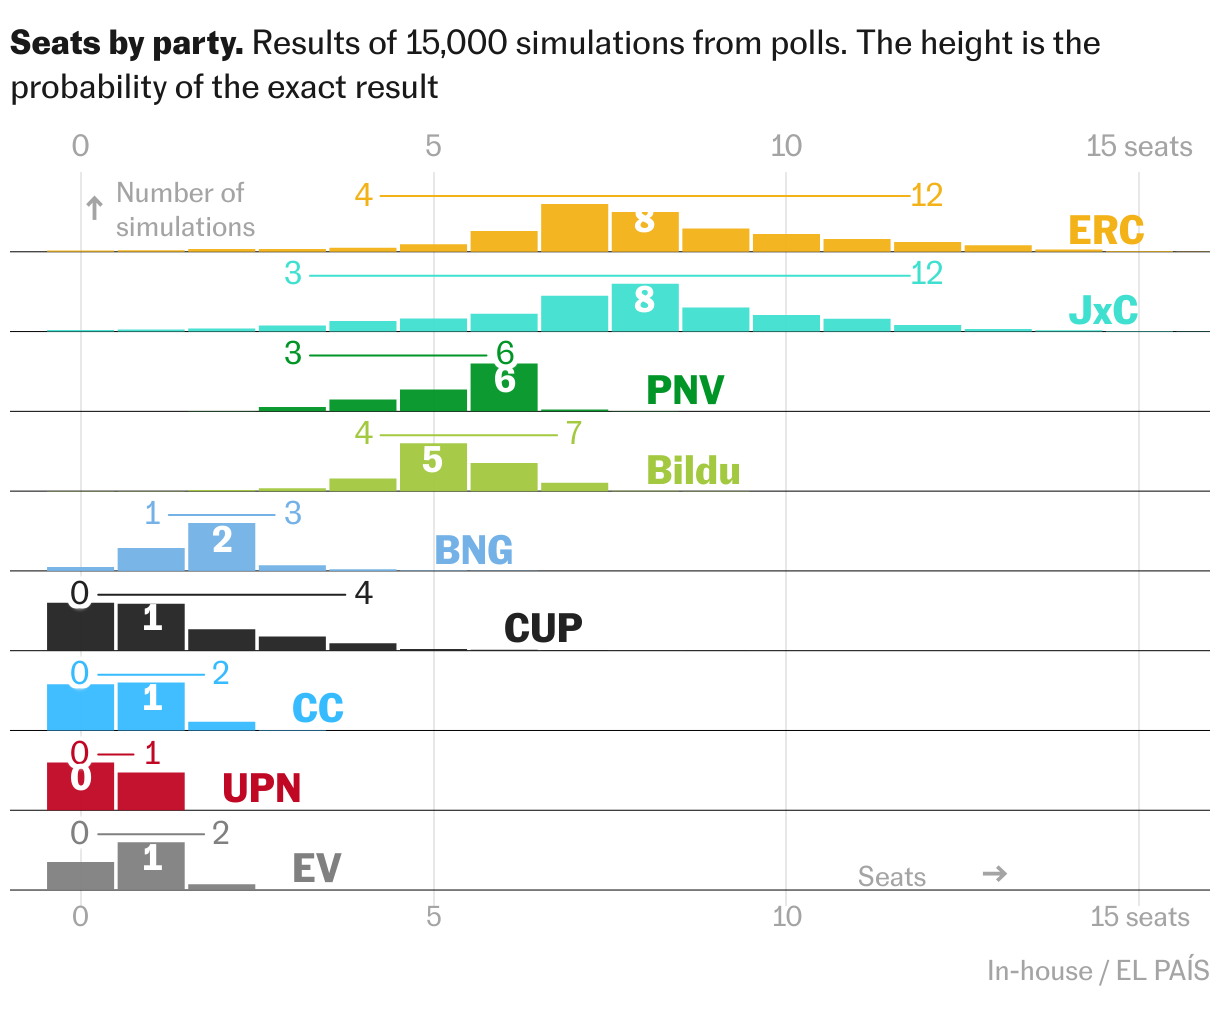
The 15,000 simulations for each party
The following graph shows the distribution of seats for each party in our 15,000 simulations. First we look at the big four. Besides noting that the uncertainty is considerable, it is interesting to see that the distributions are not symmetrical, due to the effect of the electoral system. For example, it will be easier for Sumar and Vox to become smaller than to grow. And the opposite happens with the PSOE, because if it grows enough it would threaten the PP’s first position in many provinces.
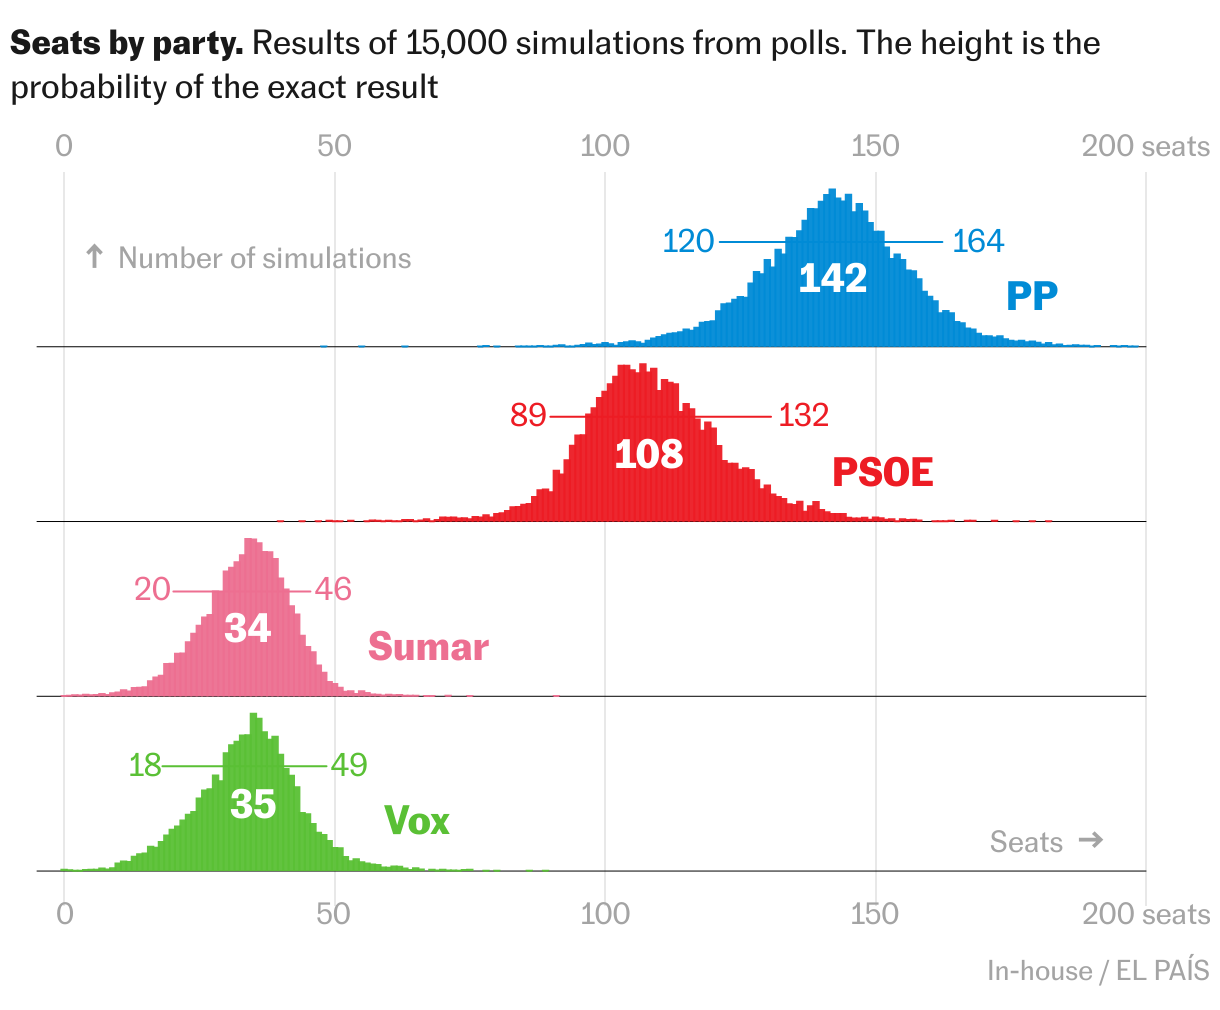
Finally, these are the seat distributions for the small parties.
Methodology
Predictions are produced by a statistical model based on surveys and their historical accuracy. The model is similar to the one we used in the elections of April and November 2019, in Mexico, France, the United Kingdom, and in Spain’s regional elections of Andalusia, Catalonia or Madrid. It works in four steps: 1) aggregate and average the polls, 2) project that average over each province, 3) incorporate expected uncertainty, and 4) simulate 15,000 elections to allocate seats and calculate probabilities.
Step 1. Average of surveys. Our average takes into account dozens of polls to improve its accuracy. The average is weighted to give different weight to each survey according to three factors: the sample size, the polling company and the date. You can read details here.
Step 2. Project the vote to each province. Before calculating the seats, it is necessary to estimate the percentage of votes for each party in each province. To do so, the results of the 2019 elections and some adjustments with provincial polls are used. This is a common, simple method that works reasonably well (if a party grows, it stands to reason that it will grow where it was already strongest). The greatest difficulty lies in finding the right numbers with very small parties that could have options for seats, but about which we have very little data.
Step 3. Incorporate survey uncertainty. This is the most complicated and important step. You need to estimate the expected accuracy of the probes. How large are the usual errors? How likely are 2, 3, or 5 point errors to occur? To answer these questions, hundreds of surveys in Spain and thousands internationally are studied.
Calibrate expected errors. First, the error of the surveys in Spain is estimated. A database is built with all the elections since 1986. The median absolute error (MAE) of the poll averages has been around 2 points per party. This means that deviations of 3 or 4 points were common and that the margin of error (95%) is close to seven points for parties around 30% of votes. Those errors depend on at least two things: the size of the party and the closeness of the elections. To take these two factors into account, we used the database by Jennings and Wlezien, published in Nature. The errors of more than 4,100 polls in 241 elections in 19 Western countries have been analyzed. Thus, a simple model is built that estimates the MAE error of the average vote estimated by the polls for each party, taking into account: 1) its size (it is easier to estimate a party that is around 5% in votes than one that exceeds 30%), and 2) the days remaining until the elections (because the polls improve at the end).
Choice of distribution type. In order to incorporate the uncertainty of the vote of each party in each simulation, a multivariable distribution is used. Student-t distributions are used instead of normal ones so that they have longer tails (kurtosis): this makes it more likely that very extreme events will occur. The advantages of this hypothesis explained by Nate Silver: “I have estimated the level of kurtosis with the database. I then define the covariance matrix of these distributions so that the sum of the votes does not exceed 100% (a idea from Chris Hanretty). Uncertainty is incorporated with 53 distributions, one at the national level and another in each province. The first distribution introduces equal errors for the vote of a party in all of Spain. It is important to do so because in general the errors in the surveys are systemic and the same in all territories. If we assume them to be independent, the errors cancel out between provinces and the model fails due to overconfidence. This happened with some models of the US elections in 2016. The second part of the uncertainty is incorporated for each province. Finally, the amplitude of the covariance matrices must be scaled so that the resulting vote distributions have the expected MAE and standard deviation according to the calibration.
Step 4. Simulate. The last step is to run the model 15,000 times. Each iteration is a simulation of the elections with vote percentages, which vary according to the distribution defined in the previous step. The results in these simulations make it possible to calculate the probabilities that each party has of winning a certain number of seats, reaching a majority, coming first, and so on.
Why surveys. This model is entirely based on surveys. There is a perception that the polls are not reliable, but the truth is that the polls have not done badly lately. In the last five years they have been quite accurate in Spain, although with exceptions such as the 2018 Andalusian elections. Polls are rarely perfect, but there is no alternative that has been shown to be better.
Montse Hidalgo Pérez contributed to this story.
Do you want more information? Subscribe here to the Kiko Llaneras newsletter where he analyzes and explains current events with data and graphs.