ECR 2020 / C-09814
Ovarian tumors in pediatric patients: do US, CT and MRI findings correlate with one another?
Congress:
ECR 2020
Poster Number:
C-09814
Type:
Educational Exhibit
Keywords:
Performed at one institution, Diagnostic or prognostic study, Retrospective, Neoplasia, Cysts, Calcifications / Calculi, Contrast agent-oral, Contrast agent-intravenous, Ultrasound, MR, CT, Pelvis, Paediatric, Genital / Reproductive system female
Authors:
A. Grosu 1, V. Ştefănescu1, S. Pintilie-Gherghe1, D. G. Panait2; 1Galati/RO, 2Braila/RO
DOI:
10.26044/ecr2020/C-09814

Fig. 1:
Pathology and classification of ovarian tumors

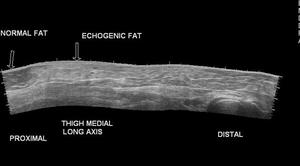
Fig. 2:
Ultrasound ecogenity of tissues
 (white arrows) References: https://www.opensciencepublications.com/fulltextarticles/IJAR-2581-3919-3-116.html")
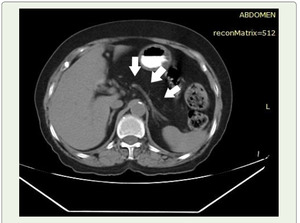
Fig. 3:
Plain CT shows hypodensity of entire pancreatic parenchyma with CT value of fat...

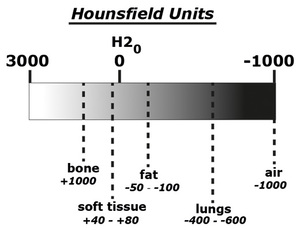
Fig. 4:
The Hounsfield scale for radiodensity

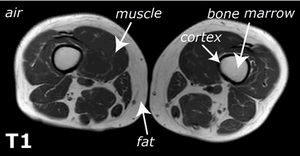
Fig. 5:
MRI T1 sequence intensity of structures