


NBA Prop of the Day

Jake Silverman


Our understanding of football is constantly evolving. With growth in analytics spaces, the increasing ubiquity of data literacy, and the continued work of game-charting teams, data-literate NFL fans are finding new ways to process and interpret the game we love.
While quarterbacks are by far the most visible position in football, our tools for evaluating quarterback play are still incomplete. DVOA and DYAR can provide a great holistic overview of a player’s relative performance. We have ways to contextualize pass depth and pocket awareness. There are rate stats for scoring. However, for one of the most frequent metrics used against quarterbacks – interceptions – all we have are volume and rate stats. Void of context, an interception rate can only take you so far.
Today, we will explore one of FTN Data’s charting stats for quarterbacks: interception-worthy throws. IWTs are a pretty self-explanatory metric. It’s right in the name: throws that could have likely been intercepted. These are most often passes thrown to a well-defended receiver. 237 of the IWTs are balls thrown into tight coverage; the next most common result involves misreading a closing defender. Of those 237 tight window throws, 141 were targeting the quarterback’s first read.
Interception-worthy throws is a more useful statistic for an offense than, say, the count of passes successfully defended by the defense. There are far too many definitions of a successfully-defended pass, and a charted pass defense does not necessarily illustrate that the quarterback made a bad decision. IWTs, on the other hand, specifically chart plays where the quarterback was at fault.
For these observations, we have narrowed our sample size down to quarterbacks with at least 100 passing attempts.
| Most Interception Worthy Throws, 2023 Weeks 1-7 | |||||||||
| Player | Team | GP | Att | INT | INT Rate | IWT | IWT Rate | PD | PD Rate |
| Mac Jones | NE | 7 | 231 | 7 | 3.03% | 18 | 7.8% | 33 | 14.3% |
| Desmond Ridder | ATL | 7 | 228 | 6 | 2.63% | 15 | 6.6% | 36 | 15.8% |
| Joshua Dobbs | ARI | 7 | 229 | 3 | 1.31% | 15 | 6.6% | 28 | 12.2% |
| Jordan Love | GB | 6 | 193 | 7 | 3.63% | 12 | 6.2% | 34 | 17.6% |
| Sam Howell | WAS | 7 | 256 | 7 | 2.73% | 12 | 4.7% | 33 | 12.9% |
| Ryan Tannehill | TEN | 6 | 158 | 6 | 3.80% | 12 | 7.6% | 25 | 15.8% |
Leading the league with 18 interception-worthy throws and a 7.8% IWT rate, we have New England Patriots quarterback Mac Jones. I touched on Jones’ struggles as a passer during last week’s column on the end of the Patriots dynasty, but this may be a bit of a misleading way to start this piece. One-third of all Jones’ IWTs come from New England’s season opener against the Philadelphia Eagles. That’s the second-most IWTs in a game this season, behind Gardner Minshew’s eight IWTs in Week 6. Jones does, however, hold the title for the highest single-game IWT rate. During the Patriots’ Week 4 drubbing against the Dallas Cowboys, Jones threw four IWTs on 22 dropbacks before getting pulled, an 18.18% IWT rate.
Most of this top end is full of names one might assume would be at the top of a stat quantifying bad throws. Four of the next five players in IWTs – Josh Dobbs (15), Desmond Ridder (15), Jordan Love (12), and Sam Howell (12) – are in their first full-time starting roles and really show it during certain stretches. That’s okay, though. There is some level of understanding that these are quarterbacks still learning the game.
You know who doesn’t get that benefit of the doubt? 11-year veteran Ryan Tannehill. The Titans veteran quarterback just looks spent. He certainly hasn’t gotten a ton of help in the passing game. The Titans offensive line has the fourth-highest adjusted sack rate (11.6%) in the league, and Tennessee has one receiver (Nick Westbrook-Ikhine) with a positive receiving DVOA. Regardless of the situation, Tannehill currently sits tied for fourth-most IWTs while throwing the fourth-fewest passes in this sample size. His 7.6% IWT rate ranks second in the league.
Quarterbacks, sorted by Asc. Interception Worthy Throws (IWT)
| Fewest Interception Worthy Throws, 2023 Weeks 1-7 | |||||||||
| Player | Team | GP | Att | INT | INT Rate | IWT | IWT Rate | PD | PD Rate |
| Matthew Stafford | LA | 7 | 256 | 6 | 2.34% | 4 | 1.6% | 23 | 9.0% |
| Jared Goff | DET | 7 | 256 | 4 | 1.56% | 5 | 2.0% | 22 | 8.6% |
| Deshaun Watson | CLE | 4 | 107 | 3 | 2.80% | 5 | 4.7% | 19 | 17.8% |
| C.J. Stroud | HOU | 6 | 213 | 1 | 0.47% | 5 | 2.3% | 13 | 6.1% |
| Zach Wilson | NYJ | 6 | 182 | 5 | 2.75% | 6 | 3.3% | 24 | 13.2% |
| Bryce Young | CAR | 5 | 182 | 4 | 2.20% | 6 | 3.3% | 15 | 8.2% |
On the other end of this chart, we get a real mixed bag. Deshaun Watson sneaks down here on a lack of volume, while Zach Wilson and Bryce Young have played some safe-if-uninspired football.
We do have some legit gems, though. Matthew Stafford leads this sample size with just four IWTs and an extremely low 1.6% IWT rate. No other quarterback on this list falls below an IWT rate of 2.0%. Stafford is also the only quarterback in this sample size with more interceptions than interception-worthy throws. We’ll get to that in a moment.
Jared Goff is leading one of the best offensive seasons in Lions history, and he’s able to do so while mitigating mistakes. C.J. Stroud is the runaway quarterback candidate for Offensive Rookie of the Year, and this list reflects that. Not only is Stroud one of four starting quarterbacks with five IWTs or fewer, his lone interception is the fewest in this sample size.
| Most Passes Defensed for QB, 2023 Weeks 1-7 | ||||||||||
| Player | Team | GP | Att | INT | INT Rate | IWT | IWT Rate | PD | PD Rate | PD – IWT Diff |
| Desmond Ridder | ATL | 7 | 228 | 6 | 2.63% | 15 | 6.6% | 36 | 15.8% | 21 |
| Jordan Love | GB | 6 | 193 | 7 | 3.63% | 12 | 6.2% | 34 | 17.6% | 22 |
| Sam Howell | WAS | 7 | 256 | 7 | 2.73% | 12 | 4.7% | 33 | 12.9% | 21 |
| Mac Jones | NE | 7 | 231 | 7 | 3.03% | 18 | 7.8% | 33 | 14.3% | 15 |
| Tua Tagovailoa | MIA | 7 | 229 | 6 | 2.62% | 8 | 3.5% | 31 | 13.5% | 23 |
| Josh Allen | BUF | 7 | 246 | 7 | 2.85% | 11 | 4.5% | 30 | 12.2% | 19 |
| Fewest Passes Defensed for QB, 2023 Weeks 1-7 | ||||||||||
| Player | Team | GP | Att | INT | INT Rate | IWT | IWT Rate | PD | PD Rate | PD – IWT Diff |
| C.J. Stroud | HOU | 6 | 213 | 1 | 0.47% | 5 | 2.3% | 13 | 6.1% | 8 |
| Bryce Young | CAR | 5 | 182 | 4 | 2.20% | 6 | 3.3% | 15 | 8.2% | 9 |
| Lamar Jackson | BAL | 7 | 200 | 3 | 1.50% | 6 | 3.0% | 15 | 7.5% | 9 |
| Deshaun Watson | CLE | 4 | 107 | 3 | 2.80% | 5 | 4.7% | 19 | 17.8% | 14 |
| Derek Carr | NO | 7 | 255 | 4 | 1.57% | 9 | 3.5% | 19 | 7.5% | 10 |
| Gardner Minshew | IND | 6 | 161 | 4 | 2.48% | 10 | 6.2% | 19 | 11.8% | 9 |
Organizing these players by passes defensed doesn’t tell the same story. You get mostly the same names as discussed on the high-end of the IWT chart. However, this ordering moves Dobbs and Tannehill both out of the top ten. The IWT data highlights a batch of quarterbacks struggling in their roles. A player like Dobbs, with a high IWT total and just three interceptions, helps us observe that a quarterback doesn’t have to turn the ball over to struggle. The PD data robs us of that and instead inserts the top two quarterbacks by passing DYAR into the conversation. We will talk about Josh Allen once we have some additional context, but he doesn’t belong up here right now.
In the ascending chart, sorting by PD data removes Goff and Stafford in favor of Derek Carr and Gardner Minshew. It got rid of two of the more interesting examples in our dataset without addressing the issues we had with our IWT ascending data. Watson still looks like an albatross, with a higher PD rate than our entire top table. Now we’ve added two quarterbacks with relatively low passes defensed and a similar number of interceptions, but a much higher rate of interception-worthy throws.
When looking at interceptions, couching it alongside IWT can help give much-needed context to a player’s performance that passes defensed cannot.
| Quarterbacks with Multiple non-IWT Interceptions, 2023 Weeks 1-7 | |||||||
| Player | Team | GP | Att | Int | IWT | Int No IWT |
% Ints At Fault |
| Matthew Stafford | LA | 7 | 256 | 6 | 4 | 3 | 50.0% |
| Kirk Cousins | MIN | 7 | 280 | 5 | 7 | 3 | 40.0% |
| Daniel Jones | NYG | 5 | 151 | 6 | 7 | 2 | 66.7% |
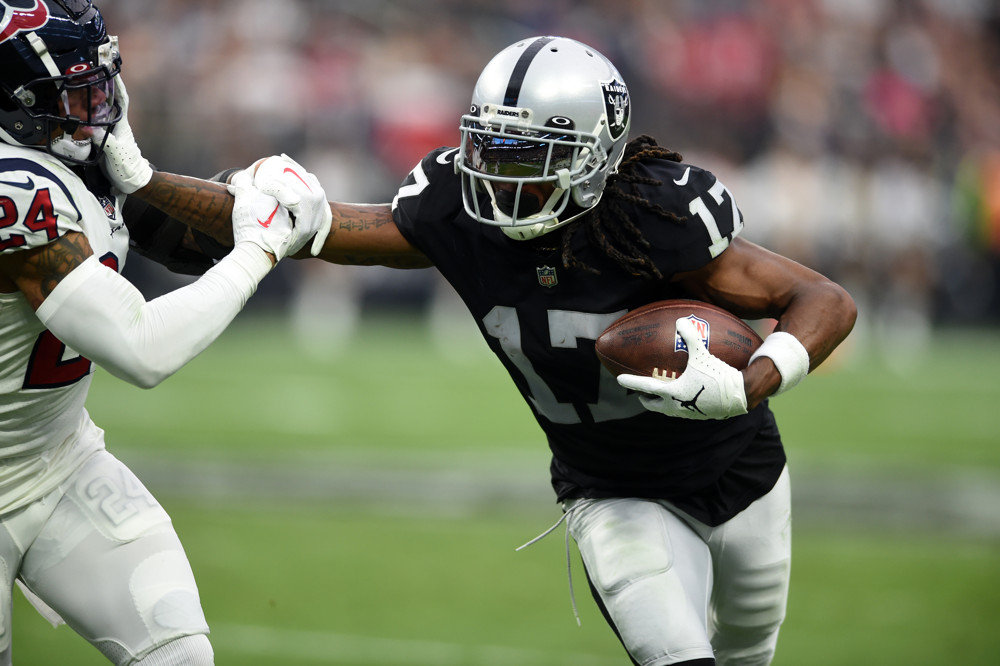
| Jimmy Garoppolo | LV | 5 | 147 | 8 | 9 | 2 | 75.0% |
| Jalen Hurts | PHI | 7 | 244 | 8 | 11 | 2 | 75.0% |
| Mac Jones | NE | 7 | 231 | 7 | 18 | 2 | 71.4% |
While IWTs may be useful in how we can contextualize a quarterback’s decision-making, they can also help us know when a quarterback shouldn’t be blamed. Not all IWTs lead to interceptions, obviously, but the same goes the other way: not all interceptions happen on throws worthy of an interception. A lineman could bat the ball at the line of scrimmage. A defender could rip the ball out of a receiver’s hands. A dropped pass could lead to a ricocheting circus turnover. Whatever the cause, certain plays end in interceptions that aren’t the quarterback’s fault. A turnover’s a turnover, but it helps to assign blame and provide context.
These kinds of plays are somewhat uncommon. Of the 156 interceptions in this sample size, 23 of them happened on plays not tagged as interception-worthy. 15 of 32 qualifying quarterbacks have at least one such turnover. Just six have multiple.
Somehow, Stafford looks even better after adjustments. His six interceptions were high relative to the rest of the league, but he only gets real blame for half of them in FTN charting data. Converting 75% of your interception-worthy throws into interceptions is a high mark, but it’s more manageable when Stafford is making so few dangerous plays.
The two quarterbacks tied for the league lead in interceptions – Jalen Hurts and Jimmy Garoppolo – both drop their totals down. Even Mac Jones’ numbers look better. The 18 IWTs don’t change of course, but removing two turnovers from the pool means Jones’ interception worthy throws convert to interceptions less than one-third of the time.
| Converting IWT into Interceptions | |||||||
| Player | Team | GP | Att | Int | Int on IWTs |
IWT | Convert to Int % |
| Mac Jones | NE | 7 | 231 | 7 | 5 | 18 | 27.8% |
| Desmond Ridder | ATL | 7 | 228 | 6 | 6 | 15 | 40.0% |
| Joshua Dobbs | ARI | 7 | 229 | 3 | 2 | 15 | 13.3% |
| Sam Howell | WAS | 7 | 256 | 7 | 7 | 12 | 58.3% |
| Jordan Love | GB | 6 | 193 | 7 | 7 | 12 | 58.3% |
| Ryan Tannehill | TEN | 6 | 158 | 6 | 6 | 12 | 50.0% |
| Josh Allen | BUF | 7 | 246 | 7 | 7 | 11 | 63.6% |
| Jalen Hurts | PHI | 7 | 244 | 8 | 6 | 11 | 54.6% |
| Patrick Mahomes | KC | 7 | 266 | 6 | 5 | 10 | 50.0% |
| Gardner Minshew | IND | 6 | 161 | 4 | 4 | 10 | 40.0% |
Removing non-IWT interceptions not only changes some of the context around quarterback performance, but it allows us to find a true IWT-to-INT conversion rate.
Jones and Dobbs are benefitting from some very good luck at the moment. Dobbs’ 13.33% IWT-to-INT rate is the lowest in the sample size. Jones ranks fourth, behind Dobbs, Stroud (1-for-5, 20.0%), and Trevor Lawrence (2-for-8, 25.0%).
Some difficult conversations arise for Garoppolo, Justin Fields, and Josh Allen. All three quarterbacks are to blame for 100% of their interceptions, and all have IWT-to-INT rates north of 60%.
Allen is under particular scrutiny as the only quarterback in this trio with double-digit IWTs. The Bills quarterback has oscillated between nuclear, post-leap Josh Allen and head-scratching, early-years Josh Allen. Buffalo’s offense ranks 24th in variance thus far, not including last night’s Week 8 game. The Bills still rank third in total offensive DVOA and second in offensive passing DVOA. It’s just that when Josh Allen isn’t on his game, it’s not just bad. It’s costing his team possessions.
Next week, we’ll turn around and look at these numbers for defenses.