MORPHOLOGY OF THE SKULL OF INIA GEOFFRENSIS HUMBOLDTIANA PILLERI & GIHR, 1977 (CETACEA: INIIDAE): A MORPHOMETRIC AND TAXONOMIC ANALYSIS.
Israel Cañizales
Instituto de Zoología y Ecología Tropical, Facultad de Ciencias, Universidad Central de Venezuela. Apartado Postal 47058. Caracas 1041-A, Venezuela.
Email: israel.canizales@ciens.ucv.ve – ORCID iD: http://orcid.org/0000-0001-6553-9494
| |
ABSTRACT
The morphology and anatomy of the two current subspecies of Inia geoffrensis (Blainville, 1817) are very similar. For this reason, the taxonomic validity of these has been the subject of discussion among different researchers. To provide additional information to clarify this situation, the analysis of the shape, external appearance and proportions in 20 skulls of Orinoco river dolphin, Inia geoffrensis humboldtiana Pilleri & Gihr, 1977, was carried out. For the morphometric analysis, 28 anatomical characters plus the count of the number of dental alveoli were selected. All values obtained in this study were analyzed and compared using univariate and multivariate statistics with published data from Inia geoffrensis geoffrensis (Blainville, 1817). Both skull ‘shape’ and ‘size’ are important components of the morphological differentiation between I. g. humboldtiana and I. g. geoffrensis. The analysis of the cranial morphology allowed the identification of 10 characters that differentiate I. g. humboldtiana from the other subspecies and species of the genus. Univariate and multivariate analyses demonstrated clear differences in cranial morphometry. The facial region concentrates 45.46% off this variation and the cranium region presents 54.54%. 60.00% of skulls variables, directly associated with the feeding function, in I. g. humboldtiana are smaller than I. g. geoffrensis. In contrast, 24.00% of variables associated with the setting of the skull showed higher average values. Discriminant analysis was used to examine how well each subspecies can be differentiated. The percentage of correct classification by discriminant functions was 62.16%. The variation obtained in this study allows suggesting that in I. g. humboldtiana the cranial variables have been modified possibly as a response to selective pressures of the type environmental and ecological. Despite some overlap, the results reveal sufficient evidence to affirm that the subspecies geoffrensis and humboldtiana are manifestly different. Therefore, and based on the morphological and genetic differences that exist between these taxa, it is recommended that the Inia of the Orinoco be considered a distinct or independent species.
Keywords. Cranial; dolphin; multivariate analysis; Orinoco, Venezuela.
|
| |
RESUMEN
Morfología del cráneo de Inia geoffrensis humboldtiana Pilleri & Gihr, 1977 (Cetacea: Iniidae): un análisis morfométrico y taxonómico
La morfología y anatomía de las dos subespecies actuales de Inia geoffrensis (Blainville, 1817) son muy similares. Debido a esto varios investigadores han evaluado la validez taxonómica de éstas. Con el fin de proporcionar información adicional para aclarar esta situación, se analizó la forma, el aspecto externo y las proporciones en 20 cráneos del delfín del río Orinoco, Inia geoffrensis humboldtiana Pilleri & Gihr, 1977. Para el análisis morfométrico, se seleccionaron 28 caracteres anatómicos más el recuento del número de alvéolos dentales. Todos los valores obtenidos en este estudio fueron analizados y comparados utilizando estadística univariada y multivariada con los datos publicados de Inia geoffrensis geoffrensis (Blainville, 1817). Tanto la “forma” como el “tamaño” del cráneo son componentes importantes de la diferenciación morfológica entre I. g. humboldtiana e I. g. geoffrensis. El análisis de la morfología craneal permitió identificar 10 caracteres que diferencian a I. g. humboldtiana de las demás subespecies y especies del género. Los análisis univariantes y multivariantes demostraron claras diferencias en la morfología craneal. La región facial concentra el 45,46% de esta variación y la región del cráneo presenta el 54,54%. 60,00% de las variables relacionadas directamente con la función de alimentación, en I. g. humboldtiana son más pequeñas que en I. g. geoffrensis. Mientras que el 24,00% de las variables asociadas a la configuración del cráneo presentan valores medios más altos. Para evaluar la diferenciación de cada subespecie se utilizó el análisis discriminante. El porcentaje de clasificación correcta por funciones discriminantes fue del 62,16%. La variación obtenida en este estudio permite sugerir que en I. g. humboldtiana las variables craneales han sido modificadas posiblemente como respuesta a presiones selectivas de tipo ambiental y ecológico. A pesar de cierta superposición, los resultados revelan suficientes pruebas para afirmar que las subespecies geoffrensis y humboldtiana son manifiestamente diferentes. Por lo tanto, y con base en las diferencias morfológicas y genéticas que existen entre estos taxones, se recomienda que el Inia del Orinoco sea considerado como una especie distinta o independiente
Palabras clave. Análisis multivariado; cráneo; delfín, Orinoco, Venezuela.
|
IntroductionTOP
The genus Inia d’ Orbigny, 1834 for a long time was considered monospecific (Hershkovitz, 1966; Casinos & Ocaña, 1979; Best & Da Silva, 1989, 1993), with three subspecies: I. g. boliviensis (Brazil and Bolivia), I. g. geoffrensis (Blainville, 1817) (central Amazon of Colombia, Ecuador, Peru, Brazil, and Bolivia), and I. g. humboldtiana Pilleri & Gihr, 1977 (Colombia and Venezuela). Were Pilleri & Gihr (1977) who propose the division of the genus into two species: I. boliviensis d’Orbigny, 1834 (Madeira river basin, Bolivia) and I. geoffrensis with two subspecies: I. g. geoffrensis and I. g. humboldtiana (Amazon and Orinoco basins). Subsequently, Casinos & Ocaña (1979) do not recognize the validity of the two species and accept the three subspecies of I. geoffrensis, arguing that the differences found are clinal. The main reason for this apparent taxonomic deficit is that, traditionally, the evidence to recognize cetacean subspecies has been primarily a combination of morphological differences and geographic
separation. A subspecies is generally considered a population or populations within a species that are found at different breeding sites (allopatry) and have been compared with “geographical varieties”. A common point among the definition of most, if not all, is that subspecies represent groups that are distinct rather than showing differences in their mean. However, Pilleri & Gihr (1980) and later Da Silva (1994), restore I. boliviensis and I. geoffrensis as valid species based on coloration, length-mass ratio, cranial characters, and the number of teeth, brain size, cephalic index, and sternum shape. Furthermore, the study by Ruiz-García et al. (2006) on the external morphometry of the body revealed the separation of the Bolivian from the Colombian form and overlapping of the Amazonian and Orinoco forms, with a considerable differentiation higher in males than in females. Later, Hrbek et al. (2014) describe the species I. araguaiaensis for the central region of Brazil, in the Araguaia river basin.
Moreover, the Taxonomy Committee of the Society for Marine Mammals (Committee on Taxonomy, 2016) in its list of species and subspecies, which includes freshwater dolphins, does not recognize I. boliviensis and rescues the subspecies I. g. boliviensis based on an erroneous interpretation of the study of Gravena et al. (2014) and ignoring what was published by Gravena et al. (2015) who, through the use of nuclear and mitochondrial DNA from individuals in the Madeira River, were able to unequivocally identify I. boliviensis. Similarly, they qualify the work of Hrbek et al. (2014) on I. araguaiaensis as unconvincing, provisionally leaving both species off the list.
In response to this controversy, in the last decade, and to find evidence to support or invalidate the existence of the two subspecies of I. geoffrensis, several molecular analyses of the different populations have been developed to solve this taxonomic problem. Ruiz-García et al. (2008) and Ruiz-García (2010) carried out several studies, with different types of markers, which allows them to corroborate that Inia has two species: I. boliviensis in Bolivia and I. geoffrensis for the Amazon basin and the Orinoco, without the existence of a subspecies. Likewise, Goncalves Farias (2015), using markers (nuclear and mitochondrial), analyzed the phylogenetic relationships of I. g. geoffrensis and I. g. humboldtiana finding two well-differentiated lineages, allowing her to propose to eliminate the subspecies I. g. humboldtiana and elevate it to full species as Inia humboldtiana stat. nov.
The discrepancy presented by the aforementioned authors about the validity or not of the different subspecies is largely based on the initial information used for their description. Body parameters such as body weight, face external morphology, melon, and dorsal and pectoral fins, as well as dental alveolar count and published craniometric data, have been used as discriminatory analyzes. Moreover, the scarcity of skulls of the Orinoco river dolphin preserved in museums or reference collections since its description, added with the fact that the holotype of the subspecies is a skull of an adult female deposited in the Museum of Biology of the Central University of Venezuela by Trebbau & van Bree in 1966 (Fig. 1), has favored over the time the validity of this subspecies designated for Venezuela.
|
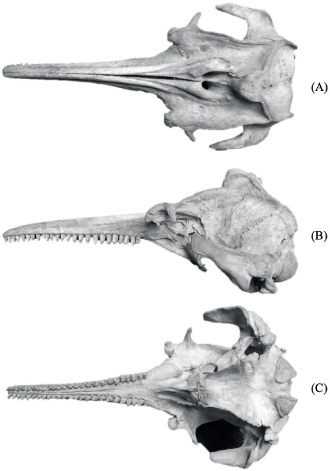 Fig. 1.— Dorsal (A), lateral (B) and ventral (C) view of the holotype Inia geoffrensis humboldtiana MBUCV I-135 (Photo: I. Cañizales). Fig. 1.— Dorsal (A), lateral (B) and ventral (C) view of the holotype Inia geoffrensis humboldtiana MBUCV I-135 (Photo: I. Cañizales).
Fig. 1.— Vista dorsal (A), lateral (B) y ventral (C) del holotipo Inia geoffrensis humboldtiana MBUCV I-135 (Foto: I. Cañizales).
|
|
Therefore, the objectives of the present study are to describe the morphology of the skulls identified as I. g. humboldtiana, deposited in museums and different collections in Venezuela and abroad obtained during the last 40 years from the tributaries of the Orinoco River, and their differences with I. g. geoffrensis and to determine whether or not the morphometric values support the taxonomic validity of the subspecies.
Material and methodsTOP
SamplesTOP
A total of 20 skulls identified as I. g. humboldtiana deposited in museums in Colombia, Switzerland, and museums and a private collection in Venezuela from the Apure river basin
and other regions were examined (Table 1). For the general analysis and comparison, the data published by van Bree & Robineau (1973), Trebbau & van Bree (1974), Pilleri & Gihr (1977) and Casinos & Ocaña (1979) of cranial morphometry of I. g. humboldtiana and I. g. geoffrensis was included.
Table 1.— Material examined (n = 20).
Tabla 1.— Material examinado (n = 20).
| Locality |
Identification code |
Observations |
Collectors |
| San Fernando de Apure |
MBUCV I-135 |
Complete skull with mandible, missing tympanic bullas. |
P. Trebbau |
| San Fernando de Apure |
MBUCV 251 |
Complete skull with mandible, missing tympanic bullas. |
|
| Río Apure |
MBUCV 78 |
Mandible without a skull. |
|
| Caño Guaritico, Apure |
MHNLS 6886 |
Complete skull with mandible, missing tympanic bullas. |
J. Ayarzagüena |
| San Fernando de Apure |
MCN b |
Complete skull without mandible missing tympanic bullas. |
P. Trebbau |
| San Fernando de Apure |
MCN d |
Complete skull with mandible, missing tympanic bullas. |
|
| San Fernando de Apure |
MCN e |
Complete skull with mandible, missing tympanic bullas. |
|
| Isla de Margarita |
MCN 521 |
Mandible without a skull. |
M. Grisol |
| Santa María del Orinoco, Apure |
EBRG 17458 |
Complete skull with mandible, missing tympanic bullas. |
F. Bisbal |
| Caño Guaritico, Apure |
EBRG 21042 |
Incomplete skull without mandible, missing tympanic bullas. Broken maxillae at its tip. |
J. González |
| El Samán de Apure |
EBRG 21071 |
Complete skull with mandible, with left tympanic bulla. |
|
| Río Arauca, Apure |
EBRG 29794 |
Complete skull without mandible, missing tympanic bullas. |
E. Boede |
| Tamatama, Amazonas |
EBRG 4128 |
Complete skull with mandible, missing tympanic bullas. Left orbital arch missing. |
Smithsonian Project |
| Caño Guaritico, Apure |
AJVS 001 |
Complete skull with mandible and tympanic bullas. |
E. Boede |
| San Fernando de Apure |
AJVS 002 |
Complete skull with mandible and tympanic bullas. |
E. Boede |
| Caño Guaritico, Apure |
CPEB 001 |
Complete skull with mandible and tympanic bullas. |
E. Boede |
| Río Guaviare |
ICN 538 |
Incomplete skull with mandible, missing tympanic bullas. |
F. Medem |
| Río Guaviare |
ICN 539 |
Complete skull without mandible, missing tympanic bullas. |
F. Medem |
| Río Güejar |
ICN 3703 |
Complete skull with mandible, missing tympanic bullas. |
F. Medem |
| Guayana Francesa |
MHNG 832/56 |
Complete skull with mandible, missing tympanic bullas. |
H. Larsien |
| (MBUCV) Museum of Biology of the Central University of Venezuela, (MHNLS) Museum of Natural History La Salle, (MCN) Museum of Natural Sciences, (EBRG) Biological Station of Rancho Grande, (AJVS) Aquarium J.V Seijas, (CPEB) Private collection of Ernesto Boede, (ICN) Institute of Natural Sciences – National University of Colombia, (MHNG) Natural History Museum of Geneva. |
General morphologyTOP
In this study, all skulls were from adult animals. To define this category, the criteria used were the fusion of the premaxillaries to the maxilla at the distal end of the rostrum, following van Bree & Gallagher (1971), and the total fusion of the joint sutures of the different cranial bones. For descriptive purposes of shape, proportions, external appearance, and asymmetry, the analysis of cranial morphology were carried out by direct visual examination and photographic comparison of the skulls of I. g. humboldtiana used in this study with those specimens deposited in different collections identified as I. geoffrensis (Catalog No.: EBD CSIC 22170, Estación Biológica Doñana, Sevilla, Spain; Catalog No.: UF 7818, The Florida Museum, University of Florida, USA).
Linear morphometryTOP
Following the linear measurement criteria published by van Bree & Robineau (1973), Trebbau & van Bree (1974), Perrin (1975) and Cañizales & Alvarado (2013) a total of 28 measurements (23 cranial, 5 mandibular) plus the counting of dental alveoli were performed (Table 2). All measurements were quantified with two or three repetitions in each one of the specimens; likewise, the measurement of the morphometric variables was made in duplicate employing a digital caliper on graph paper to diminish the error and the bias in its estimation between 0.05 and 0.10 mm. Because the skull of odontocete cetaceans presents directional asymmetry particularly in the elements associated with the airways, the bilateral measurement of some variables does not represent a redundancy in the morphometric estimation.
Table 2.— List of cranial measurements and meristic for Orinoco River Dolphin (I. g. humboldtiana).
Tabla 2.— Lista de mediciones craneales y merísticas para el delfín del río Orinoco (I. g. humboldtiana).
| Variable |
Acronym |
| Condylobasal length |
CBL |
| Length of rostrum |
LR |
| Width of rostrum at base |
WRB |
| Width of rostrum at midlength |
WRM |
| Width of rostrum at ¾length |
WR¾L |
| Width of rostrum at 60 mm length |
WR60mm |
| Greatest width of premaxillaries |
GWPm |
| Width of premaxillaries at midlength of rostrum |
WPmMR |
| Width of premaxillaries at ¾ length |
WPm¾ |
| Width of premaxillaries at 60 mm length |
WPm60mm |
| Greatest preorbital width |
GPrW |
| Greatest postorbital width |
GPoW |
| Width of skull at the zygomatic processes |
WZP |
| Greatest parietal width |
GPW |
| Length of left temporal fossa |
LLTF |
| Length of right temporal fossa |
LRTF |
| Height of left temporal fossa |
HLTF |
| Height of right temporal fossa |
HRTF |
| Distance from tip of rostrum to external nares |
DTREN |
| Distance from tip of rostrum to internal nares |
DTRIN |
| Length of upper right tooth row |
LURTR |
| Length of upper left tooth row |
LULTR |
| Number of dental alveoli of upper right maxilla |
NDAURMx |
| Number of dental alveoli of upper left maxilla |
NDAULMx |
| Alveolar diameter |
AD |
| Greatest length of left ramus |
GLLR |
| Greatest height of left ramus at coronoid process |
GHLRCP |
| Length of mandibular symphysis |
LMS |
| Length of lower right tooth row |
LLRTR |
| Length of lower left tooth row |
LLLTR |
| Number of dental alveoli of right mandible |
NDARM |
| Number of dental alveoli of left mandible |
NDALM |
Statistical analysisTOP
All data were used for the calculation of basic statistics (Mean, Standard Deviation, Minimum and Maximum, Coefficient of Variation). Associations between morphometric measurements within each subspecies were compared using the correlation coefficient (van Belle et al., 2004). Coefficients > 0.7 were considered to have a strong positive correlation and coefficients < - 0.7 were considered to have a strong negative coefficient. To determine the possible differences between I. g. humboldtiana and I. g. geoffrensis, the measures of length versus (vs.) measures of width were analyzed by linear regression (LR vs. CBL, WRB vs. WRM, CBL vs. WRB, LURTR vs. GPrW). Each of the craniomandibular measurements was individually examined with an analysis of variance (ANOVA), to determine which are different at the interspecific level. Besides, and as an exploratory descriptive tool, a principal component analysis (PCA) was carried out. This multivariate technique considers different variables to determine the patterns of morphometric variation between groups, as well as to evaluate the degree of separation between them, trying to achieve maximum homogeneity so that the forms are grouped according to the degree of similarity. An important aspect of PCA, as opposed to discriminant analysis, is that it does not use any information on group membership and, thus, only accounts for the variation observed in the data. A Discriminant Analysis (DA) was performed to examine whether cranial variables allow for specific and sub-specific differentiation and to evaluate classification errors. A cluster analysis was obtained using the Euclidean distance adjusted with its respective dendrogram through the unweighted pair group with arithmetic mean (UPGMA) with the Paleontological Statistics PAST 3.0 program (Hammer et al., 2001). The error level taken into account for all statistical tests was α = 0.05.
Although sexual dimorphism exists in Inia (Ruiz-García et al., 2006) all analyses were conducted independently of gender (moreover, these data were lacking in most of the individuals studied). Notwithstanding the above and in the absence of a study supporting or denying the existence of differences in <<cranial measures >> between males and females of the genus Inia, the proposals for marine dolphins of the genera Tursiops Gervais, 1855 and Stenella Gray, 1866 are considered valid; where it is indicated that when there are inconsistencies these are concentrated in the width of the skull and the middle portion of the rostrum (Perrin, 1975; Perrin et al., 1981).
Taxonomic analysisTOP
The use of indices or complementary coefficients for the identification of odontocete cetaceans has been used for a long time and in different species (Perrin, 1975; Pilleri & Gihr, 1977; Murphy et al., 2006; Westgate, 2007). They allow the assessment of variability between species of the same genus (Perrin, 1975; Murphy et al., 2006; Westgate, 2007) and are a useful tool when small samples are involved and as a reference for people with little experience in craniometric measurement (Wang et al., 2000). To assess the variability between I. g. humboldtiana and I. g. geoffrensis, the following indices were used as taxonomic evaluators: (i) cephalic (LR/WZP), (ii) facial (LR/WRB), (iii) cranial (CBL/WZP), (iv) mandibular (GLLR/GHLRCP) plus dental alveolar count following Jefferson & VanWaerebeek (2002). Traditionally the cephalic index has been used as a taxonomic evaluator in dolphins. The other indexes commonly used in other mammal taxa are used here for the first time. Indices that include the length of the rostrum and condilobasal length provide a clear separation between populations and related species (Banks & Brownell, 1969). Also, the WRM/WRB, WRB/CBL and LR/CBL ratios and the %LR/CBL, and %LMS/GLLR ratios are introduced for taxonomic analysis. The expressing of measurements in both exact numbers and percentages is common in skull analysis (Perrin, 1975; Wang et al., 2000). The indices were compared with the Kruskall-Wallis test. Finally, the most common operational definition to conclusively diagnose a subspecies is based on the arbitrary ‘75% rule’. According to this rule, differences in the mean of some variables alone are not sufficient to support the allocation of a population to a new taxon. To qualify as a subspecies, if, and only if, ≥75% of the population A must be separable from all (99+%) members of overlapping population B for the characteristic or set of characteristics under consideration (Patten & Unitt 2002).
ResultsTOP
General morphologyTOP
The species of the genus Inia share several similar cranial characteristics, such as (1) the shape of the skull, (2) the slight asymmetry with different degrees of lateral and dorsoventral torsion of the snout, (3) incomplete zygomatic arches, (4) the degree of fusion of the mandibular symphysis, (5) heterodont dentition and (6) the occipital region. However, variations in the proportions of the characters make it possible to provide a general description for I. g. humboldtiana. These descriptions are based on views obtained from various directions.
In its dorsal view (Figs. 1A, 2) in the skull two distinct regions are differentiated; an anterior or rostrum and a posterior or cranium. The rostrum is 3/5th the length of the skull. The rostrum is straight, with a narrow blunt tip and a slightly wide subtriangular base that continues with the posterior region or cranium that is rectangular in appearance. It has two salient lateral bony projections of flat aspect in the form of L, which correspond to the zygomatic processes of the temporal bone. Behind the nostrils, in the midline, there is a thick structure that protrudes dorsally by 2 to 3 cm with an inverted D aspect (cranial vertex) formed by the posterior extension of the maxillary and nasal bones that rest on a semicircular transversal bone crest formed by the fusion of the frontal, parietal and supraoccipital bones. The fusion of the mandibular branches up to the middle of its length gives the mandible a Y-shape.
|
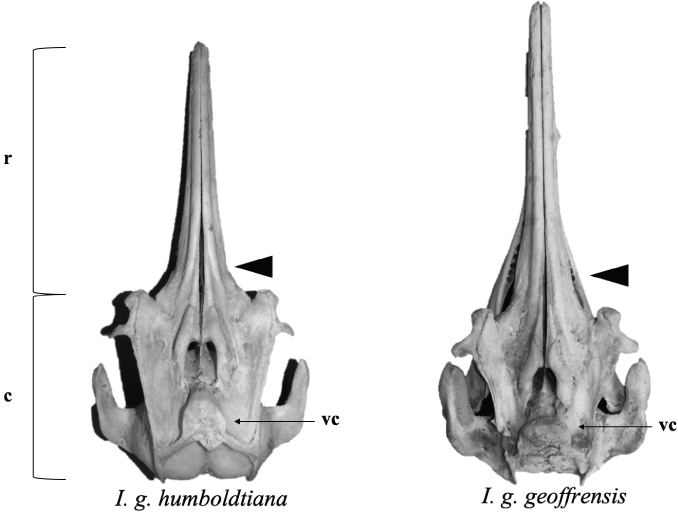 Fig. 2.— Dorsal view of skull of I. g. humboldtiana and I. g. geoffrensis. Black arrows signal the structures. Abbreviations: c = cranium; r = rostrum; vc = cranial vertex (Photo: I. Cañizales). Fig. 2.— Dorsal view of skull of I. g. humboldtiana and I. g. geoffrensis. Black arrows signal the structures. Abbreviations: c = cranium; r = rostrum; vc = cranial vertex (Photo: I. Cañizales).
Fig. 2.— Vista dorsal del cráneo de I. g. humboldtiana e I. g. geoffrensis. Las flechas negras señalan las estructuras. Abreviaturas: c = cráneo; r = rostro; vc = vértice craneal (Foto: I. Cañizales).
|
|
From a lateral view (Figs. 1B, 3), two distinct regions can be recognized; the rostrum of elongated triangular appearance, whose dorsal and ventral lines, almost parallel, form an angle at the anterior end no greater than 15° until its connection at the base with the cranium of ellipsoidal appearance, in which the temporal fossa and the cranial vertex stand out. In front of the rostral edge of the nostrils, a convex semicircular bone protrusion, slightly bulging and prominent, known as premaxillary protrusions, is present in each premaxilla. The orbit is incomplete with a semicircular shape. The zygomatic bone is shorter, thicker and more tuberous and contributes to the formation of the rounded anteorbital prominence. The temporal fossa is much larger in proportion to the size of the cranium, not only occupying more space on the lateral surface but extending forward at the expense of the orbit. Its shape is that of a large oval, with the smaller end facing forward. Its almost semicircular posterior limit is formed by the crest of the union of the occipital with the temporal and parietal. The upper limit continued forward from the latter, is an almost straight ridge, sharp and thin, which projects outward and upward, formed by the jawbone that joins with the edge of the front, and later with the parietal. The squamous portion of the temporal bone extends dorsally, covering two-thirds of the parietal (Fig. 3).
|
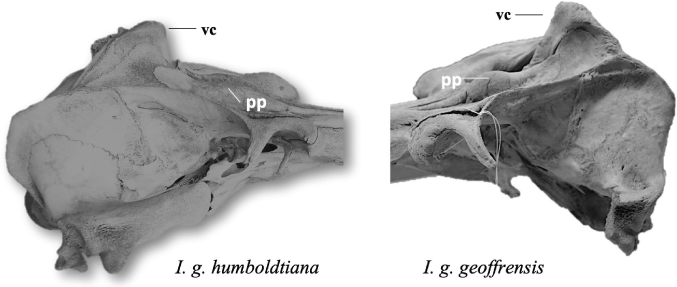 Fig. 3.— Lateral view of skull of I. g. humboldtiana and I. g. geoffrensis. Black arrows signal the structures. Abbreviations: pp = premaxillary protuberances; vc = cranial vertex (Photo: I. Cañizales). Fig. 3.— Lateral view of skull of I. g. humboldtiana and I. g. geoffrensis. Black arrows signal the structures. Abbreviations: pp = premaxillary protuberances; vc = cranial vertex (Photo: I. Cañizales).
Fig. 3.— Vista lateral del cráneo de I. g. humboldtiana e I. g. geoffrensis. Las flechas negras señalan las estructuras. Abreviatura: vc = vértice craneal; pp = protuberancias premaxilares (Foto: I. Cañizales).
|
|
In the ventral view (Figs. 1C, 4) three regions are distinguished: the base of the skull, a middle portion where the nasal cavities open to the pharynx, and the hard palate. The first, at its caudal limit, shows part of the ovoid occipital condyles, facing backwards, flanking the foramen magnum. On each side are the salient L-shaped bony projections. The rostral border of the basioccipital fused with the caudal border of the vomer in the middle portion, bordered by the wings of the pterygoid, takes the form of a trapezium with straight lines and a wider base without the presence of an anterior waist. The foramen oval is located behind the lower nasal opening, parallel to the free end of the zygomatic process. The hard palate, with a slightly subtriangular posterior base, joins the mid-portion and is straight forward. It is bordered by the upper dental alveoli. The distance between the rear edge of the last tooth alveoli and the preorbital notch is twice as large as that of the other species in the genus.
|
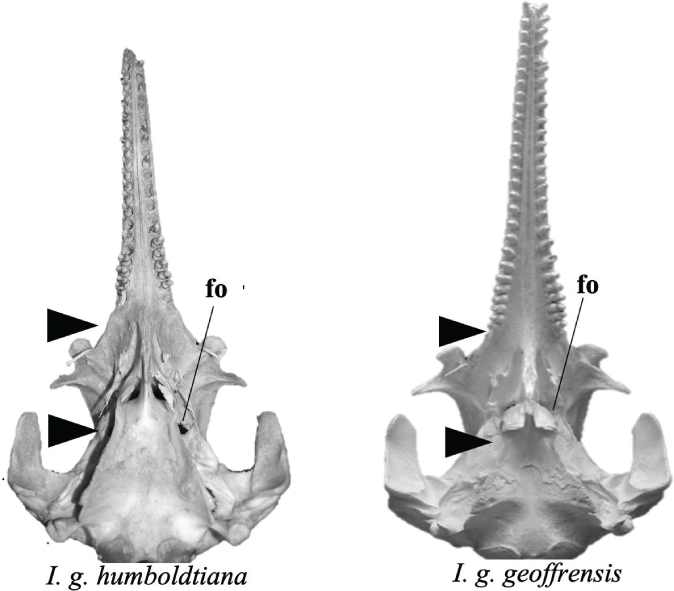 Fig. 4.— Ventral view of skull of I. g. humboldtiana and I. g. geoffrensis. Black arrows signal the structures. Abbreviation: fo = foramen oval (Photo: I. Cañizales). Fig. 4.— Ventral view of skull of I. g. humboldtiana and I. g. geoffrensis. Black arrows signal the structures. Abbreviation: fo = foramen oval (Photo: I. Cañizales).
Fig. 4.— Vista ventral del cráneo de I. g. humboldtiana e I. g. geoffrensis. Las flechas negras señalan las estructuras. Abreviatura: fo = foramen oval (Foto: I. Cañizales).
|
|
In the posterior view (Fig. 5), unlike the typical circular shape of marine dolphins, the cranium has a trapezoidal shape due to the lateral projections of the zygomatic arch. In the lower portion is the subcircular foramen magnum, the vertical and transverse diameters are the same, but it is much wider at the top than at the bottom. Its plane is almost vertical when the skull is held horizontally. On each side are the occipital condyles. Large and prominent, they are located in a more ventral position around the median plane. Eventually, a third condyle may be present (Condylus tertius) located in the basioccipital, between the two occipital condyles. Its size and shape vary greatly. It may appear as a small, non-functional bony protrusion, but may also be present in the form of a small, functional condyle covered with cartilage, which articulates with the front edge of the atlas. The supra-occipital in its midline, just above the margin of the foramen magnum, there is a deep, continuous triangular depression with a shallow, middle groove rising almost to the apex, and with lateral grooves passing along the upper edge of the condyle to the concave surface of the exoccipitals. Some small foramina can be found in the supra-occipital above the foramen magnum. The number and location of these small foramina are subject to variation.
|
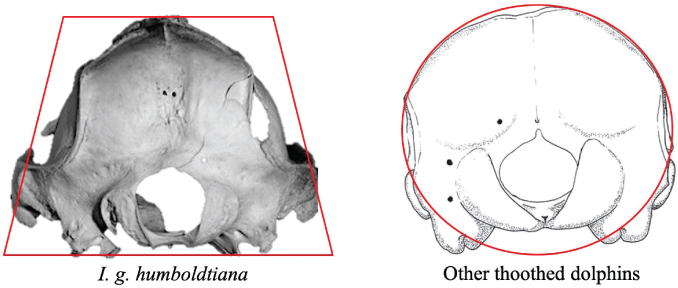 Fig. 5.— Posterior view of skull of I. g. humboldtiana and other dolphins. Lines red were plotted around skulls to aid visualization (Photo: I. Cañizales). Fig. 5.— Posterior view of skull of I. g. humboldtiana and other dolphins. Lines red were plotted around skulls to aid visualization (Photo: I. Cañizales).
Fig. 5.— Vista posterior del cráneo de I. g. humboldtiana y otros delfines. Se trazaron líneas rojas alrededor de los cráneos para ayudar a la visualización (Foto: I. Cañizales).
|
|
Linear morphometryTOP
Appendix 1 summarizes the cranial measurements in millimeters for all the variables of the material evaluated in this study.
Statistical analysisTOP
Table 3 summarizes the descriptive statistics of the cranial variables for I. g. humboldtiana obtained in this study and for I. g. geoffrensis calculated with the data published by van Bree & Robineau (1973), Pilleri & Gihr (1977), and Casinos & Ocaña (1979). WR60mm, WPm60mm and AD could not be compared. 72.00% of the variables of I. g. humboldtiana present mean values lower than those of I. g. geoffrensis. 60.00% (15) directly associated with the feeding function. In contrast, 28.00% of the variables present greater average values. Six (24.00%) of them are associated with the setting of the skull. The variable with the highest percentage variation were GWPm = 45.49%. Coefficients of variation revealed significant differences (t = 3.64; DF = 27; p = 0.0005) between I. g. humboldtiana (15 values ≥ 10%) and I. g. geoffrensis (6 values ≥ 10%).
Table 3.— Descriptive statistic of I. g. humboldtiana and I. g. geoffrensis. For acronyms see Material and methods.
Tabla 3.— Estadística descriptiva de I. g. humboldtiana e I. g. geoffrensis. Para las siglas ver Material y métodos.
| I. g. humboldtiana |
I. g. geoffrensis |
| This study |
van Bree & Robineau (1973) Pilleri & Gihr (1977) |
| Variable |
mean ± standard deviation |
minimum - maximum (sample size) |
CV |
mean ± standard deviation |
minimum - maximum (sample size) |
CV |
| CBL |
450.44±38.19 |
363.00-503.00 (17) |
0.085 |
476.44±37.24 |
415.00-525.00 (9) |
0.078 |
| LR |
283.06±29.53 |
218.00-337.00 (17) |
0.104 |
313.00±25.60 |
274.00-347.00 (10) |
0.082 |
| WRB |
86.11±9.53 |
70.00-100.22 (17) |
0.111 |
84.30±6.98 |
76.00-100.00 (10) |
0.083 |
| WRM |
28.37±4.74 |
21.00-37.20 (17) |
0.167 |
28.60±2.37 |
26.00-34.00 (10) |
0.083 |
| WRL¾L |
22.56±5.65 |
11.00-31.39 (17) |
0.251 |
23.57±1.72 |
22.00-27.00 (7) |
0.073 |
| WR60mm |
42.31±7.28 |
32.00-54.09 (14) |
0.172 |
44.00 (1) |
|
|
| GWPm |
33.16±8.26 |
21.61-49.00 (14) |
0.249 |
60.83±7.33 |
28.00-41.00 (6) |
0.121 |
| WPmMR |
19.38±3.21 |
15.20-25.52 (14) |
0.166 |
20.44±1.74 |
18.00-23.00 (9) |
0.085 |
| WPm¾ |
17.95±3.76 |
12.70-24.62 (14) |
0.209 |
18.67±1.63 |
17.00-21.00 (6) |
0.087 |
| WPm60mm |
23.33±4.66 |
18.43-34.21 (11) |
0.200 |
|
|
|
| GPrW |
137.02±13.97 |
110.00-159.00 (15) |
0.102 |
131.17±14.44 |
113.00-154.00 (6) |
0.110 |
| GPoW |
170.18±17.82 |
136.00-200.00 (15) |
0.105 |
167.33±16.80 |
144.00-194.00 (6) |
0.100 |
| WZP |
205.53±30.05 |
166.00-243.00 (15) |
0.116 |
203.00±18.29 |
172.00-239.00 (10) |
0.090 |
| GPW |
98.27±9.76 |
80.00-123.00 (16) |
0.099 |
107.00±9.11 |
87.00-113.00 (7) |
0.085 |
| LLTF* |
141.25±24.39 |
106.00-212.00 (15) |
0.173 |
140.17±10.98 |
122.00-153.00 (6) |
0.078 |
| LRTF* |
143.33±13.31 |
122.76-162.00 (11) |
0.093 |
138.29±11.51 |
121.00-154.00 (7) |
0.083 |
| HLTF* |
80.84±11.49 |
64.00-108.56 (16) |
0.142 |
87.33±10.69 |
70.00-102.00 (6) |
0.122 |
| HRTF* |
86.57±9.68 |
72.85-103.00 (12) |
0.112 |
81.71±8.60 |
68.00-92.00 (7) |
0.105 |
| DTREN |
327.82±32.26 |
256.00-376.00 (17) |
0.098 |
358.14±27.70 |
310.00-392.00 (7) |
0.077 |
| DTRIN |
329.75±32.76 |
265.00-382.00 (12) |
0.099 |
374.50±23.97 |
344.00-402.00 (4) |
0.064 |
| LURTR* |
254.41±25.51 |
200.00-300.00 (17) |
0.102 |
279.10±25.32 |
238.00-312.00 (10) |
0.091 |
| LULTR* |
252.59±24.74 |
200.00-294.00 (17) |
0.099 |
278.50±24.68 |
239.00-310.00 (10) |
0.089 |
| AD |
8.45±0.76 |
6.96-9.15 (12) |
0.090 |
6.40 (1) |
|
|
| GLLR |
380.50±30.87 |
311.00-432.00 (16) |
0.081 |
423.22±30.80 |
358.00-463.00 (9) |
0.073 |
| GHLRCP |
83.04±9.31 |
66.00-100.00 (16) |
0.112 |
86.60±8.95 |
69.00-101.00 (10) |
0.103 |
| LMS |
188.13±16.74 |
141.00-215.00 (16) |
0.089 |
224.78±17.66 |
189.00-246.00 (9) |
0.079 |
| LLRTR* |
243.63±19.72 |
200.00-277.00 (16) |
0.081 |
282.00±20.17 |
238.00-306.00 (9) |
0.072 |
| LLLTR* |
242.69±19.87 |
200.00-277.00 (16) |
0.082 |
281.44±20.24 |
238.00-306.00 (9) |
0.072 |
| CV = coefficient of variation (Bold = lower variation) *Values (mm) determined bilaterally. |
The correlation coefficient matrices of 20 cranial measurements in I. g. humboldtiana, and I. g. geoffrensis are shown in Appendix 2 and 3. For I. g. humboldtiana, 108 of the 190 strongly positively correlated pairs are revealed, suggesting that changes in dimensions of one part of the skull are uniformly reflected in other parts of the skull. The proportion of pairs is higher than in the case of I. g. geoffrensis where 65 of the 190 pairs are strongly positively correlated. Linear regression was used to model the relationship between selected measurements of length versus (vs.) measures of width that had a particularly strong correlation (Fig. 6). The linear regression scatterplots show a slightly heterogeneous distribution of points of different intensity, although with a certain linear trend. This is most evident in the points representing I. g. geoffrensis at (A) and (B). The differences found may be due to biological and environmental factors, including measurement errors. When trend lines are drawn, the variables show a positive upward slope. Although some points are slightly off the line, for example at (B), (C) and (D) this suggests that there is some relationship between variables of a linear type. Although the variables studied are part of an integral whole, the evidence does not allow us to affirm that this is the authentic form of relationship, but it does allow us to understand this relationship. Therefore, it is reasonable to have an increase in variables in larger skulls. In (A) the different slopes of the trend line show that the mean values in many specimens of I. g. humboldtiana are lower than those of I. g. geoffrensis. In (C) the slopes indicate that the mean values in all specimens of I. g. humboldtiana are lower than in I. g. geoffrensis. On the other hand, in all cases, there is a clear separation between I. g. humboldtiana vs. I. g. geoffrensis for each measure of length versus (vs.) measure of width.
|
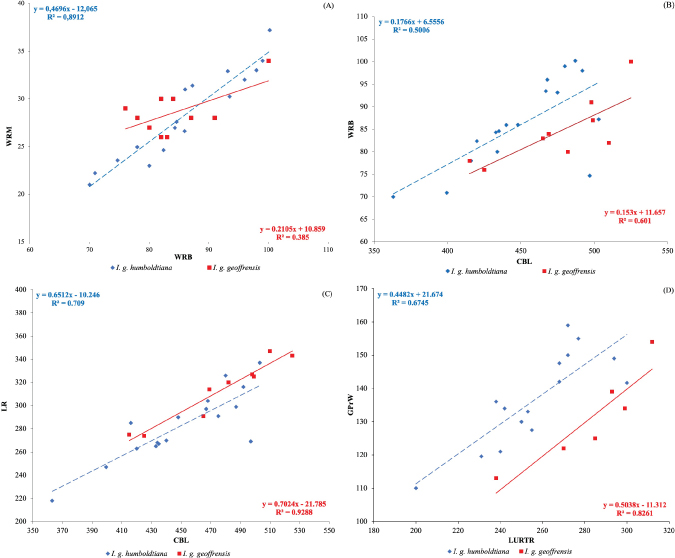 Fig. 6.— Scatterplots of width vs. lenght of skull for I. g. humboldtiana and I. g. geoffrensis - WRM vs. WRB (A), WRB vs. CBL (B), LR vs. CBL (C) and GPrW vs. LURTR (D). The determination coefficients R2 are reported. For acronyms see Material and methods. Fig. 6.— Scatterplots of width vs. lenght of skull for I. g. humboldtiana and I. g. geoffrensis - WRM vs. WRB (A), WRB vs. CBL (B), LR vs. CBL (C) and GPrW vs. LURTR (D). The determination coefficients R2 are reported. For acronyms see Material and methods.
Fig. 6.— Diagramas de dispersión de ancho vs. largo del cráneo para I. g. humboldtiana e I. g. geoffrensis - WRM vs. WRB (A), WRB vs. CBL (B), LR vs. CBL (C) y GPrW vs. LURTR (D). Se indican los coeficientes de determinación R2. Para las siglas ver Material y métodos.
|
|
The coefficients of determination (R2) for I. g. humboldtiana, vary from 0.5006 (B) to 0.8912 (A). That is, 50.06% of the variation in can be attributed to the relationship with CBL, while 67.45% of the variation in GPrW can be attributed to the relationship with LURTR, so the relationship between these variables is considered moderate. Likewise, 70.90% of the variation in LR can be attributed to the relationship with CBL, while 89.12% of the variation in WRM can be attributed to the relationship with WRB, so the relationship between these variables is considered to be strong. In the case of I. g. geoffrensis the calculated R2 values vary from 0.385 (A) to 0.9288 (C). This means that 38.50% of the variation in the WRM can be attributed to the relationship with the WRB, while 60.10% of the variation in the WRB can be attributed to the relationship with the CBL, so the relationship between these variables is considered weak to moderate, respectively. Likewise, 82.61% of the variation in GPrW can be attributed to the relationship with LURTR, while 92.88% of the variation in LR can be attributed to the relationship with CBL, so the relationship between these variables is considered strong. The analysis of variance (ANOVA) determined that nine of 25 craniomandibular variables are significantly different between I. g. humboldtiana and I. g. geoffrensis (Table 4).
Table 4.— Analysis of variance of cranio-mandibular measurements at subspecific level (Bold: p ≤ 0.05). For acronyms see Material and methods
Tabla 4.— Análisis de varianza de las mediciones craneomandibulares a nivel subespecífico (Negrita: p ≤ 0,05). Para las siglas ver Material y métodos.
| Variable |
df |
F |
P |
F critical |
| CBL |
24 |
3.067 |
0.093 |
4.279 |
| LR |
26 |
7.108 |
0.013 |
4.241 |
| WRB |
26 |
0.272 |
0.605 |
4.241 |
| WRM |
26 |
0.020 |
0.886 |
4.241 |
| WR¾L |
23 |
0.212 |
0.649 |
4.300 |
| GWPm |
19 |
50.090 |
1.340 |
4.413 |
| WPmMR |
22 |
0.830 |
0.372 |
4.324 |
| WPm¾ |
19 |
0.197 |
0.662 |
4.413 |
| GPrW |
20 |
0.738 |
0.400 |
4.380 |
| GPoW |
20 |
0.112 |
0.740 |
4.380 |
| WZP |
24 |
0.080 |
0.779 |
4.279 |
| GPW |
22 |
4.052 |
0.057 |
4.324 |
| LLTF |
20 |
0.010 |
0.919 |
4.380 |
| LRTF |
17 |
0.678 |
0.422 |
4.493 |
| HLTF |
21 |
1.442 |
0.243 |
4.351 |
| HRTF |
19 |
1.230 |
0.281 |
4.413 |
| DTREN |
23 |
4.717 |
0.040 |
4.300 |
| DTRIN |
14 |
6.218 |
0.025 |
4.600 |
| LURTR |
26 |
5.929 |
0.022 |
4.241 |
| LULTR |
26 |
6.920 |
0.014 |
4.241 |
| GLLR |
21 |
11.704 |
0.002 |
4.351 |
| GHLRCP |
22 |
1.901 |
0.182 |
4.234 |
| LMS |
21 |
28.796 |
2.979 |
4.351 |
| LLRTR |
21 |
22.416 |
0.0001 |
4.351 |
| LLLTR |
21 |
21.852 |
0.0001 |
4.351 |
The PCA resulted in the calculation of 20 variables of I. g. humboldtiana and I. g. geoffrensis (Fig. 7 with Table). The percentage of the total variation that best explains the results is concentrated in the first six components (96.85%). PC1 is interpreted as a size component and explains 77.61% of the total variation, suggested by the positive and relatively high coefficients for almost all measurements, indicating a positive correlation between them. PC2 explains 7.11% and is usually interpreted as a shape component, suggested by the positive and negative coefficients. This component was influenced by GPrW, GPoW, and WZP. The PC3 also a shape component explains 4.35% and was influenced by GPrW, GPoW, and DTRIN. The DA achieved significant separation for the 20 most informative variables selected from the 28 morphometric characters measured. The histogram of the discriminant scores revealed clear discrimination between the two subspecies (Fig. 8A-B). One significant discriminant function is responsible for 100% of the total variance explained by LR, LULTR, LCB, LURTR, DTREN with the highest coefficients in descending order (3.933, 3.404, 3.347, 3.243, 3.136). The discriminant analysis showed a total classification error of 33,33%
|
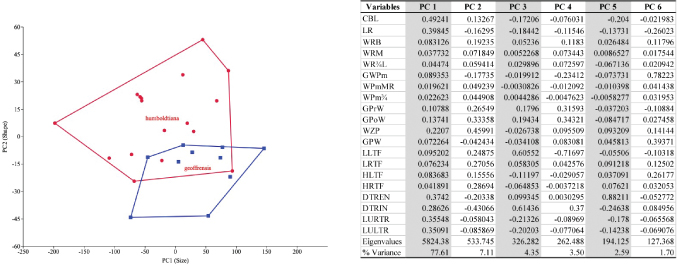 Fig. 7.— Principal Components Analysis: (Left) Scatterplots of size and shape of the skulls of I. g. humboldtiana (•) and I. g. geoffrensis (■). Lines were plotted around each group to aid visualization. (Right) Loadings on 20 morphometrics variables. For acronyms see Material and methods. Fig. 7.— Principal Components Analysis: (Left) Scatterplots of size and shape of the skulls of I. g. humboldtiana (•) and I. g. geoffrensis (■). Lines were plotted around each group to aid visualization. (Right) Loadings on 20 morphometrics variables. For acronyms see Material and methods.
Fig. 7.— Análisis de Componentes Principales: (Izquierda) Diagramas de dispersión de tamaño y forma de los cráneos de I. g. humboldtiana (•) e I. g. geoffrensis (■). Se dibujaron líneas alrededor de cada grupo para ayudar a la visualización. (Derecha) Cargas de 20 variables morfométricas. Para las siglas ver Material y métodos.
|
|
|
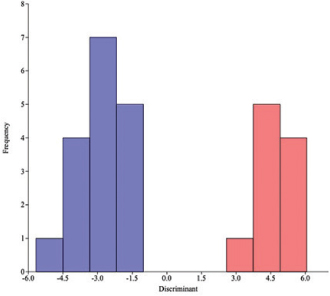 Fig. 8.— Frecuency distribution of discriminant scores for I. g. humboldtiana (A = Blue bars) and I. g. geoffrensis (B = Red bars). Eigenvalue = 14.592. Fig. 8.— Frecuency distribution of discriminant scores for I. g. humboldtiana (A = Blue bars) and I. g. geoffrensis (B = Red bars). Eigenvalue = 14.592.
Fig. 8.— Distribución de frecuencias de las puntuaciones discriminantes para I. g. humboldtiana (A = barras azules) e I. g. geoffrensis (B = barras rojas). Autovalor = 14.592.
|
|
In the cluster analysis, all the cranial variables of 27 specimens identified as I. g. humboldtiana (n = 17) and I. g. geoffrensis (n = 10) were considered. The resulting clustering shows a first group formed by specimens identified as I. g. humboldtiana and a second group composed of two subgroups corresponding to specimens identified as I. g. humboldtiana and I. g. geoffrensis (Fig. 9).
|
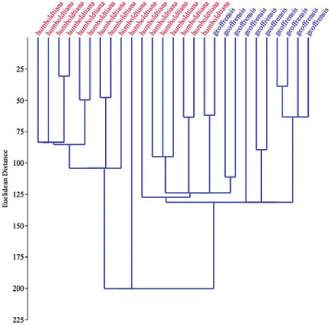 Fig. 9.— Multivariate cluster analysis on cranial morphological traits of I. g. humboldtiana and I. g. geoffrensis showing different slightly supported groups (cophenetic correlation 0.2575). Dendrograms were obtained using the unweighted pair group with arithmetic mean (UPGMA). Fig. 9.— Multivariate cluster analysis on cranial morphological traits of I. g. humboldtiana and I. g. geoffrensis showing different slightly supported groups (cophenetic correlation 0.2575). Dendrograms were obtained using the unweighted pair group with arithmetic mean (UPGMA).
Fig. 9.— Análisis de agrupamientos multivariado sobre los rasgos morfológicos craneales de I. g. humboldtiana e I. g. geoffrensis que muestran diferentes grupos ligeramente apoyados (correlación cofenética 0,2575). Se obtuvieron dendrogramas utilizando el grupo de pares no ponderados con media aritmética (UPGMA).
|
|
Taxonomic analysisTOP
The number of dental alveoli in each hemimaxillary and hemimandibular row is respectively between 22 and 28 and 19 and 27 in I. g. humboldtiana with an average of 25 and an alveolar diameter ranging from 6.96 to 9.64 mm (8.54 ± 0.46). For I. g. geoffrensis it varies from 26 to 31 uppers left hemimaxilla, 26 to 30 uppers right hemimaxilla / (25 to 31 lowers left hemimandibule) (25 to 30 lowers right hemimandibule). With a relative difference in their average values of 7.41% between I. g. humboldtiana and I. g. geoffrensis.
As for the facial index I. g. humboldtiana (n= 16) it varied between 2.98 to 3.86 (3.30 ± 0.24) and I. g. geoffrensis (n = 10) between 3.43 and 4.23 (3.72 ± 0.25). The cephalic index I. g. humboldtiana ranged from 1.26 to 1.56 (1.38 ± 0.08) and I. g. geoffrensis from 1.43 to 1.65 (1.54 ± 0.07). The cranial index I. g. humboldtiana ranged from 2.05 to 2.36 (2.19 ± 0.10) and I. g. geoffrensis from 2.20 to 2.43 (2.36 ± 0.08). These indexes show a variation of 11.29%, 10.39% and 7.20% between I. g. humboldtiana and I. g. geoffrensis. Furthermore, facial index, cranial index and cephalic index showed a significant difference between I. g. humboldtiana and I. g. geoffrensis (Kruskal-Wallis, H = 12.48; p = 0.00041, H = 10.64; p = 0.00110; H= 12.43; p = 0.00042). The %LR/CBL ratio in all cases exceeds 60%, with average values of 62.98 ± 2.02% for I. g. humboldtiana and 65.65 ± 1.56% for I. g. geoffrensis. From the average values, I obtain percentages of relative difference for this proportion of 4.07% between I. g. humboldtiana and I. g. geoffrensis. The mandibular index I. g. humboldtiana (n= 15) ranged from 3.92 to 4.86 (4.60 ± 0.26) and I. g. geoffrensis (n = 9) from 4.44 to 5.37 (4.88 ± 0.34). For % LMS/GLLR ratio all cases exceed 45%, with a variation from 45.34% to 52.37% for I. g. humboldtiana and from 52.07% to 54.94% for I. g. geoffrensis. From the average values, the percentages of relative difference for this proportion was 6.91% between I. g. humboldtiana and I. g. geoffrensis. Similarly, the mandibular index shows a variation of 5.74% between I. g. humboldtiana and I. g. geoffrensis.
The boxplots are particularly useful to clearly illustrate the ‘75% rule’. The “box edges” represent quartiles and thus 75% of the sample is to the right of the leftmost box edge, and vice versa. The “whiskers” represent the maximum and minimum of the sample. Boxplots prepared with the facial, cephalic and cranial indexes show the differentiation between I. g. humboldtiana and I. g. geoffrensis (Fig. 10). Altogether cases, within the boxes representing I. g. humboldtiana, the “whiskers” slightly overlap with the closest edge of the nearest boxes, which is ≤ 75% of I. g. geoffrensis is outside the range of I. g. humboldtiana.
|
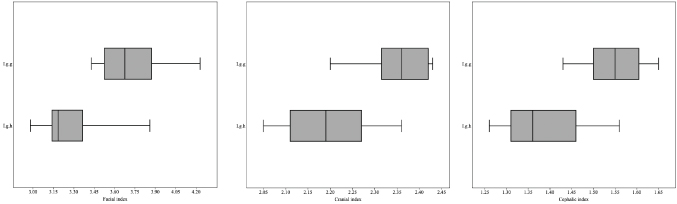 Fig. 10.— Box-plot diagram of the facial, cranial and cephalic indexes. The black lines inside the boxes correspond to the mean. The gray areas upper and lower quartiles. The left and right horizontal lines intervals with minimum and maximum values. I. g. h. = I. g. humboldtiana, I. g. g. = I. g. geoffrensis. The Kruskall-Wallis test reflected statistical differences (H = 12.48; p = 0.00041, H = 10.64; p = 0.00110; H= 12.43; p = 0.00042). Fig. 10.— Box-plot diagram of the facial, cranial and cephalic indexes. The black lines inside the boxes correspond to the mean. The gray areas upper and lower quartiles. The left and right horizontal lines intervals with minimum and maximum values. I. g. h. = I. g. humboldtiana, I. g. g. = I. g. geoffrensis. The Kruskall-Wallis test reflected statistical differences (H = 12.48; p = 0.00041, H = 10.64; p = 0.00110; H= 12.43; p = 0.00042).
Fig. 10.— Diagrama de cajas de los índices facial, craneal y cefálico. Las líneas negras dentro de los recuadros corresponden a la media. Las áreas grises equivales a los cuartiles superiores e inferiores. Las líneas horizontales izquierda y derecha los intervalos de valores mínimos y máximos. I. g. h. = I. g. humboldtiana, I. g. g. = I. g. geoffrensis. El test de Mann-Whitney reflejó diferencias estadísticamente significativas (H = 12.48; p = 0.00041, H = 10.64; p = 0.00110; H= 12.43; p = 0.00042).
|
|
DiscussionTOP
General morphologyTOP
In the absence of molecular studies, mammalian skulls are a strong tool for biogeographic, phylogenetic, and systematic investigations (Loy, 2007). The cranial morphology of genus Inia is conservative which is reflected in the relatively low level of differentiation. Part of this lack of distinguishing characteristics can be attributed to the common cranial configuration of all species, which indicates the adaptations of the group. Despite this anatomical uniformity, some characteristics may identify different groups within the genus.
As far as is known, all members of Inia share similar ecological characteristics, inhabiting the same type of aquatic environment and feeding on the same types of prey, which may imply a lack of ecomorphological differentiation. However, in several species with large geographic areas, the pattern of morphological variation of the skull could be an adaptation to the variability of environmental conditions present (Zelditch et al., 2004). This pattern has been observed in both terrestrial mammals (Gay & Best, 1996; Mazák, 2011) as in aquatic species (Langerhans et al., 2003)
In general, the skulls of I. g. humboldtiana resemble those of I. g. geoffrensis. However, the analysis of the cranial morphology identified 10 characteristics that differentiate I. g. humboldtiana from the other subspecies and species of the genus. The rostrum represents 45.46% of this variation and the cranium 54.54%. The premaxillary protuberances are much less bulky and prominent. The dorsal extension squamous portion of the temporal, the absence of an anterior basioccipital waist, the position of foramen oval and the shape of the cranium are some main traits considered. The observed presence of foramina (fenestrae) in the occipital region has been commonly reported in Pontoporia blainvillei (Gervais & d’Orbigny, 1844), endemic to the west coast of Brazil, Uruguay and Argentina (Pinedo, 1991) and in Sotalia fluviatilis (Gervais & Deville, 1853) of the Orinoco and Amazon Basin (Fettucia et al. 2009). The origin and function of these foramina are unknown. Condylus tertius, (the third condyle, it may range from a small non-functional small bony protrusion to a small cartilage-covered condyle that articulates with the atlas), is an eventual finding that has been little reported in Venezuelan specimens (van Bree & Trebbau, 1974). However, Pilleri & Gihr (1977) and Ruiz-García (2010) mention that in the Amazon populations it is very frequent.
Although morphological variation is not always associated with geographical distance, in some cases it can be explained by the presence of different evolutionary units that are delimited by geographical barriers, such as waterfalls, rapids and dams that could limit the distribution and that successively give origin to vicariance events (De Queiroz & Good 1997; Smith et al., 1997). It is believed that barriers such as the rapids (Raudales) of the Upper Orinoco and the Rio Negro along the Casiquiare branch keep I. g. humboldtiana from I. g. geoffrensis separate. It is a fact that there are no records of I. g. humboldtiana in the Caroní River basin (Best & Da Silva, 1993) and beyond San Fernando de Atabapo or in the Casiquiare branch of the Amazon, Venezuela. This type of geographical barrier occurs in the Madeira River keeping I. geoffrensis separate from I. boliviensis (Pilleri & Gihr, 1977) and in the Araguaia-Tocantins River basin I. geoffrensis of I. araguaiaensis (Hrbek et al., 2014).
Therefore, the morphological differences found between the Inia of the Orinoco and Amazon Rivers could be attributed to (1) the environmental effect; in particular water surface temperature, solar insolation and the depth of the river. The seasonal variation in the depth of the rivers is one of the most relevant aspects. During the dry season, the depth in the Orinoco varies from 1/25 to 1/30 while in the Amazon the depth varies from 1/2 to 1/3 compared to the rainy season (Ruiz-García et al., 2006). This variation in the level of flow of the Orinoco could cause morphological modifications, such as a smaller body and a more developed melon. Börjesson & Berggren (1997) and Krützen et al. (2004) present evidence that philopatric females of Tursiops truncatus (Montagu, 1821) and Phocoena phocoena (Linnaeus, 1758) in reproductive isolation show a variation in size compared to males that swim freely between groups, and (2) the differences in prey types (ecological effect) that eventually exert different forms of selective pressure on the dolphins. Because of the complex interdependence between anatomy and function, changes in cranial anatomy are likely to occur only if there are differential selective pressures. Perrin (1975) suggests that changes in the rostrum bone base are likely to be influenced more rapidly by selective pressure because of their almost exclusive association with diet. The variables that explained the degree of morphometric variation are directly related to feeding as they are part of the masticatory apparatus. The temporal fossa gives rise to the muscle responsible for opening and closing the mouth to capture prey, which is strengthened while increasing the dimensions of the temporal fossa, the number of teeth, the size of the brain box that is related to the development of the communication and echolocation system, so important for its survival, may also have been subjected to evolutionary forces according to the characteristics of the habitat and the inherent social structure. These changes may reflect the evolutionary processes of the species in response to events of local selection over time. This phenomenon has been identified in coastal and marine dolphins previously (Perrin, 1975, 1984; Perrin et al., 1981; Schnell et al., 1986; Cañizales & Alvarado, 2013). The variation obtained in this study added to the information published previously, allows us to suggest that in I. g. humboldtiana the cranial variables have possibly been modified in response to selective pressures of the type indicated above. More detailed analyses, perhaps using new technologies to access morphological variation, such as computerized tomography, could uncover more distinctive characteristics and complement those described here.
Linear morphometryTOP
The data used for the comparison of I. g. humboldtiana and I. g. geoffrensis determined a high degree of variation in cranial morphometry. At first sight, there is a pattern in which, as we move geographically in a north-south direction, the animals increase in size. As mentioned above, this argument was used by Casinos & Ocaña (1979) to explain the differences within the genus. Examination of the results presented in Table 3 shows that the condylobasal (total) length of adult I. g. humboldtiana in this study ranges from 363 to 503 mm compared to 415 to 525 mm in I. g. geoffrensis as indicated by van Bree & Robineau (1973) and Pilleri & Gihr (1977). The specimens examined for I. g. humboldtiana have an average of 25 teeth in each hemimaxilla with an alveolar diameter of 7 to 9 mm, a wider rostrum and a longer temporal fossa than those described for I. g. geoffrensis. The values obtained for GPrW, GPoW, and WZP for I. g. humboldtiana vary between 2.07, 2.65, and 5.92 mm above the values reported for I. g. geoffrensis. In summary, we have a shorter and wider skull in I. g. humboldtiana along with smaller feeding apparatus, a smaller number of teeth but with a larger alveolar diameter. To explain the variability in skull size in dolphins, it has been suggested that when two congeneric species live sympatrically, one of them tends to have smaller biometry, possibly due to displacement of characters (Perrin, 1984). More detailed analyses, such as geometric morphometry, could clarify more unique features and complement those described here.
Statistic analysisTOP
Although some of the values of the coefficients of variation reflect a low morphological variability, it should be noted that in I. g. humboldtiana the values related to the width of the rostrum have relatively higher variability. As for the values of the correlation coefficient, they are not entirely unexpected. What is unexpected is the weakness of the significant correlations between the other measurements. Perhaps the increase in sample size could bring greater variability in the data that explain the poor correlations. In Figure 6 (B) and (C) there is a gap for certain CBL values; there is nothing special about this, there is simply no skull of this size.
Inia geoffrensis geoffrensis and I. g. humboldtiana differ significantly in nine craniomandibular variables, as shown in the ANOVA. However, when the remaining variables are considered for comparison, there is an important contribution to interspecific discrimination, as demonstrated in the combined Principal Component Analysis for both subspecies. It is important to mention that variables CBL, LR, LURTR, LULTR, LLRTR, LLLTR distinctively describe a shorter and moderately wider chewing apparatus in I. g. humboldtiana. In PCA, the eigenvalues of the first principal component PC1 are positive, which supports the hypothesis that this component is representing size in our data. The separation between the two groups is given by the combination of the first and second principal components (PC2=shape). Similarly, in cluster analysis, two groups with a degree of similarity < 0.45 are observed between the groups and the samples that compose them. Although the branching pattern of the cluster analysis shows overlap in some cranial traits, of some I.g. geoffrensis and I.g. humboldtiana, it suggests a separation between them.
Therefore, our samples could be grouped into one species in northern South America, which includes specimens from the Orinoco basin and another species from the Amazon basin. In the DA histogram, the pattern found for all the animals analyzed suggests the existence of two well-differentiated groups. It can be counter-argument that the existence of sexual dimorphism in Inia species should be reflected in the shape and size of the skull, forgetting that this was determined in live animals through the study of external body morphology in which soft tissues predominate over bone structures, and also that the size of the sample used can be considered small. However, the analysis would not be affected at all by the sample size, since the morphological variation between taxa is much greater than any intraspecific differences in shape. Something similar using geometric morphometry is reported by Amaral et al. (2009) for the Delphinus-Stenella-Tursiops marine dolphin complex.
Taxonomic analysisTOP
The results of this study have shown that the Orinoco basin dolphin population differs morphologically from the Amazon basin population, but is this differentiation, along with known genetic differences (see below), sufficient to classify the Orinoco population as a separate species or subspecies? First, a species is distinguished from all others by essential differences
in its morphology (see Morphological Concept of Species, Mayr, 1982, 2000); here the criterion for species status is the degree of phenotypic difference. Secondly, the designation of a subspecies is historically based on the analysis of one or a few specimens. Beyond these theoretical concepts, morphological differences will always be fundamental to the recognition and definition of a species or subspecies. In this sense, cranial morphometry has been fundamental to define taxonomic differences in a wide variety of smalls toothed cetaceans (odontocetes) (Börjesson & Berggren, 1997; Wang et al., 2000).
However, the main disadvantages faced by taxonomic studies of any vertebrate, especially large mammals, are related to obtaining a sufficient number of specimens, in some cases difficult or almost impossible given their size and often their rarity which depends not only on time, effort and money available, but also on the availability of specimens in collections or museums to obtain the data or quantitative information on their morphological variation. Additionally, any available evidence or information that directly questions the acceptance of the taxonomic status of a species or subspecies generates the concept of “inertial species”, in which simply by academic resistance two or more species are still treated as one (Zamudio & Greene, 1997). In this regard, Reeves et al. (2004) note that the ‘ideal’ data set needed to demonstrate ‘irreversible divergence’ and provide strong evidence for delimitation, especially in cetacean species, should include morphological and genetic or molecular data.
In the original description by I. g. humboldtiana Pillery & Gihr (1977), they base their conclusions using only the data published by Trebbau & van Bree (1974) and indicate as diagnostic characteristics for the subspecies a cephalic index of 1.29 to 1.42 (mean = 1.35) and the number of teeth between 24 and 26 (mean = 25). They also define for I. g. geoffrensis values of 1.42 to 1.65 (mean = 1.54) and a number of teeth between 25 and 31 (mean = 28). Here the mean cephalic index for I. g. humboldtiana differs slightly from the values mentioned above, with a variation from 1.26 to 1.56. With 56.25% of the sample below the average and 25% slightly overlapping with the variation of the cephalic index determined for I. g. geoffrensis. The values of the facial, cephalic, cranial, and mandibular indices overlap by 18.75%, 25%, 37.50%, and 6.25% respectively. Approximately the values corresponding to %LR/CBL and %LMS/GLLR for I. g. geoffrensis are on average 2.67% and 3.67% higher than for I. g. humboldtiana. To date, only two studies have used the “75% rule” to identify or validate subspecies in cetaceans Cephalorhynchus hectori maui Baker, Smith & Pichler, 2002 and Sousa chinensis taiwanensis Wang, Chu Yang & Hung, 2015 (Baker et al., 2002; Wang et al., 2015). Despite the clear separation between I. g. humboldtiana for the different variables with I. g. geoffrensis, some do not meet the 75% criterion. With the possible exception of characters that do not clearly and completely overlap between two groups, diagnosability tests should be performed to determine the status of the subspecies in an objectively and quantitatively. Although 28.57% of the characteristics assessed have partial overlaps, two taxa are distinguished. In general, when differences in one or more characteristics do not overlap, this supports separation at species level, while overlapping modal differences support separation at a subspecies level (Westgate, 2007).
Finally, morphological and genetic studies by Pilleri & Gihr (1980), Da Silva (1994), and Hrbek et al. (2014) have provided the evidence necessary to achieve the current number of recognized Inia species. Similarly, and although there is no information or data associated with the appendicular and axial skeleton because
there is not enough material deposited for its evaluation; the data on external morphology and osteology published by Trebbau & van Bree (1974), Trebbau (1975), Pilleri & Gihr (1977, 1980) and Da Silva (1994), together with the craniometry provided by the present study plus the molecular data provided by Ruiz-García et al. (2006, 2008), Ruiz-García (2010) and Goncalves Farias (2015) for individuals in the Apure-Orinoco axis, noting that they differ from all their congeners by having the following unique characteristics: 11 diagnostic sites (apomorphy) based in the cytochrome b sequences and 6 from the mitochondrial DNA control region provide sufficient evidence to conclude that individuals of Inia geoffrensis humboldtiana are different from I. g. geoffrensis and clearly constitute a distinct species, and according to Gonçalves Farias (2015), it is not considered valid to use I. g. humboldtiana Pilleri & Gihr, 1977 to identify this taxon.
AcknowledgementsTOP
To La Salle Natural History Museum, Museum of Biology of the Central University of Venezuela, Biological Station Rancho Grande, J.V. Seijas Aquarium for allowing me access to biological material. To Olga Herrera, Ygrein Roos and Esmeralda Mujica for their collaboration and interest in the initial phases of the work. To Ernesto Boede (†) for making available the biological material in his possession. To Pedro Trebbau for his comments and for providing a copy of the original field data. To Jorge M. González, for his review and criticism of the manuscript.
ReferencesTOP
| ○ |
Amaral, A. C., Coelho, M. M., Marugan-Lobón, J. & Rohlf, F. J., 2009. Cranial shape differentiation in three closely related delphinid cetacean species: insights into evolutionary history. Zoology, 112: 38–47. https://doi.org/10.1016/j.zool.2008.03.001 |
| ○ |
Banks, R. C. & Brownell, R. L., 1969. Taxonomy of the common dolphins of the Eastern Pacific Ocean. Journal of Mammalogy, 50(2): 262–271. https://doi.org/10.2307/1378342 |
| ○ |
Baker, A. N., Smith, A. N. H. & Pichler, F. B., 2002. Geographical variation in Hector’s dolphin: recognition of new subspecies of Cephalorhynchus hectori. Journal of The Royal Society of New Zealand, 32(4):713–727. https://doi.org/10.1080/03014223.2002.9517717 |
| ○ |
Best, R. C. & Da Silva, V. M. F., 1989. Amazon river dolphin, boto Inia geoffrensis (de Blainville, 1817). In: S. H. Ridgway & R. Harrison (eds.). Handbook of marine mammals, Vol. 4. Academic Press, New York: l–23. |
| ○ |
Best, R. C. & Da Silva, V. M. F., 1993. Inia geoffrensis. Mammalian Species, 426: 1–8. https://doi.org/10.2307/3504090 |
| ○ |
Börjesson, P. & Berggren, P., 1997. Morphometrics comparisons of skulls of harbour porpoises (Phocoena phocoena) from the Baltic, Kattegat, and Skagerrak Seas. Canadian Journal of Zoology, 75: 280–287. https://doi.org/10.1139/z97-035 |
| ○ |
Cañizales, I. & Alvarado, M., 2013. Morfometría craneana del delfín manchado del Atlántico, (Stenella frontalis Cuvier, 1829) en el noroeste del estado Zulia, Venezuela. Boletín de la Academia de Ciencias Físicas, Matemáticas y Naturales de Venezuela, 58(2): 35–50. |
| ○ |
Casinos, A. & Ocaña, J. 1979. A Craniometrical Study of The Genus Inia D’Orbigny, 1834, Cetacea, Platanistoidea. Säugetierkundliche Mitteilungen, 27: 194–206. |
| ○ |
Committee on Taxonomy. 2016. List of marine mammal species and subspecies. Society for Marine Mammalogy. Available from https://marinemammalscience.org/species-information/list-marine-mammal-species-subspecies/ [accessed 10.08.2020]. |
| ○ |
Da Silva, V. 1994. Aspects of the biology of the Amazonian dolphin genus Inia and Sotalia fluviatilis. PhD. Dissertation. University of Cambridge. 327 pp. |
| ○ |
De Queiroz, K. & Good, D. A., 1997. Phenetic clustering in biology: a critique. The Quarterly Review of Biology, 72: 3–30. https://doi.org/10.1086/419656 |
| ○ |
Fettuccia, D. C., da Silva, V. M. F. & Simões-Lopes, P. C. 2009. Non-metric characters in two species of Sotalia (Gray, 1866) (Cetacea, Delphinidae). Brazilian Journal of Biology, 69(3): 631–637. https://doi.org/10.1590/S1519-69842009000400020 |
| ○ |
Gay, S. W. & Best, T. L., 1996. Relationships between abiotic variables and geographic variation in skulls of pumas (Puma concolor: Mammalia, Felidae) in North and South America. Zoological Journal of the Linnean Society, 117: 259–282. https://doi.org/10.1006/zjls.1996.0039 |
| ○ |
Goncalves Farias, J., 2015. Filogeografia e genética de populações de Inia geoffrensis (Cetartiodactyla: Iniidae) nos rios Negro e Branco e evidência de linhagem evolutiva independente na bacia do Orinoco. Universidade Federal do Amazonas. Trabajo Especial de Grado no publicado. Maestría en Diversidad Biológica. 123 pp. |
| ○ |
Gravena, W., Farias, I. P., Da Silva, M. N. F., Da Silva, V. M. F. & Hrbek, T., 2014. Looking to the past and the future: were the Madeira River rapids a geographical barrier to the boto (Cetacea: Iniidae)? Conservation Genetics, 15: 619–629. https://doi.org/10.1007/s10592-014-0565-4 |
| ○ |
Gravena, W., Da Silva, V. M. F., Da Silva, M. N. F., Farias, I. P. & Hrbek, T., 2015. Living between rapids: genetic structure and hybridization in botos (Cetacea: Iniidae: Inia spp.) of the Madeira River, Brazil. Biological Journal of the Linnean Society, 114: 764–777. https://doi.org/10.1111/bij.12463 |
| ○ |
Hammer, O., Harper, D. A. T. & Ryan, P. D., 2001. PAST: Paleontological Statistic software package for education and data analysis. Paleontologia Electronica, 4(1): 1–9. |
| ○ |
Hershkovitz, P., 1966. Catalog of living whales. Bulletin of the United States Natural Museum, 246: 1–259. https://doi.org/10.5479/si.03629236.246 |
| ○ |
Hrbek, T., Da Silva, V. M. F., Dutra, N., Gravena, W., Martin, A. R. et al. 2014. A new species of river dolphin from Brazil or: how little do we know our biodiversity. PLoS ONE, 9(1): e83623. https://doi.org/10.1371/journal.pone.0083623 |
| ○ |
Jefferson, T. A. & Van Waerebeek, K., 2002. The taxonomic status of the nominal dolphin species, Delphinus tropicalis Van Bree, 1971. Marine Mammal Science, 18: 787–818. https://doi.org/10.1111/j.1748-7692.2002.tb01074.x |
| ○ |
Krutzen, M., Sherwin, W. B., Berggren, P. & Gales, N.. 2004. Population structure in an inshore cetacean revealed by microsatellite and mtDNA analysis: Bottlenose dolphins (Tursiops sp.) in Shark Bay, Western Australia. Marine Mammal Science, 20: 28–47. https://doi.org/10.1111/j.1748-7692.2004.tb01139.x |
| ○ |
Langerhans, B. R., Layman, C. A., Langerhans, A. K. & Dewitt, T. J., 2003. Habitat-associated morphological divergence in two Neotropical fish species. Biological Journal of the Linnean Society, 80:689–698. https://doi.org/10.1111/j.1095-8312.2003.00266.x |
| ○ |
Loy, A., 2007. Morphometrics and theriology: Homage to Marco Corti. Hystrix, Italian Journal of Mammalogy, 18(2): 115–136. https://doi.org/10.4404/hystrix-18.2-4398 |
| ○ |
Mayr, E., 1982. The growth of biological thought: diversity, evolution, and inheritance. Cambridge, Belknap Press. |
| ○ |
Mayr, E., 2000. The biological species concept. In: Q. Wheeler & R. Meier (eds.). Species concepts and phylogenetic theory. New York, Columbia University Press: 2–29. |
| ○ |
Mazák, J. H., 2011. Craniometric variation in the tiger (Panthera tigris): implications for patterns of diversity, taxonomy and conservation. Mammalian Biology, 75: 45–68. https://doi.org/10.1016/j.mambio.2008.06.003 |
| ○ |
Murphy, S., Herman, J. S., Pierce, G. J., Rogan, E. & Kitchener, A. C.. 2006. Taxonomic status and geographical cranial variation of common dolphins (Delphinus) in the eastern North Atlantic. Marine Mammal Science. 22(3): 573–599. https://doi.org/10.1111/j.1748-7692.2006.00037.x |
| ○ |
Patten, M. A & Unitt, P., 2002. Diagnosability versus mean differences of Sage sparrow subspecies. The Auk, 119(1): 26–35. https://doi.org/10.1093/auk/119.1.26 |
| ○ |
Pilleri, G. & Gihr, M., 1977. Observations on the Bolivian (Inia boliviensis d’Orbigny, 1834) and the Amazonian Bufeo (Inia geoffrensis De Blainville, 1817) with description of a new subspecies (Inia geoffrensis humboldtiana). Investigations on Cetacea, 8: 11–76. |
| ○ |
Perrin, W. F., 1975. Variation of spotted and spinner porpoise (genus Stenella) in the eastern tropical Pacific and Hawaii. Bulletin of the Scripps Institution of Oceanography of the University of California, 21: 1–206. |
| ○ |
Perrin, W. F., 1984. Patterns of geographical variation in small cetaceans. Acta Zoologica Fennica, 172: 137–140. |
| ○ |
Perrin, W. F., Mitchell, E. D., Mead, J. G., Caldwell, D. K. & van Bree, P. J. H.. 1981. Stenella clymene, a rediscovered tropical dolphin of the Atlantic. Journal of Mammalogy, 62(3): 583–598. https://doi.org/10.2307/1380405 |
| ○ |
Pilleri, G. & Gihr, M., 1980. Additional considerations on the Taxonomy of the genus Inia. Investigations on Cetacea, 11: 15–27. |
| ○ |
Pinedo, M. C., 1991. Development and variation of the franciscana (Pontoporia blainvillei). PhD. Thesis, University of California, Santa Cruz, USA. 406 pp. |
| ○ |
Reeves, R. R., Perrin, W. F., Taylor, B. L., Baker, C. S. & Mesnick, S. L., 2004. Report of the workshop on shortcomings of cetacean taxonomy in relation to needs of conservation and management. La Jolla CA. Southwest Fisheries Science Centre. U.S. Department of Commerce. 94 pp. |
| ○ |
Ruiz-García M., 2010. Changes in the demographic trends of pink river dolphins (Inia) at the microgeographical level in Peruvian and Bolivian rivers and within the upper Amazon: microsatellites and mtDNA analysis and insights into Inia´s origin. In: M. Ruiz-García & J. Shostell (eds.). Biology, evolution, and conservation of river dolphins within South America and Asia. Nova Science Publisher. Hauppauge: 161–192. |
| ○ |
Ruiz-García M., Banguera E. & Cárdenas, H., 2006. Morphological analysis of three Inia (Cetacea: Iniidae) populations from Colombia and Bolivia. Acta Theriologica, 51: 411–426. https://doi.org/10.1007/BF03195188 |
| ○ |
Ruiz-García M., Caballero, S., Martínez-Agüero, A. & Shostell, J., 2008. Molecular differentiation among Inia geoffrensis and Inia boliviensis (Iniidae, Cetacea) by means of nuclear intron sequences. In: V. T. Koven (ed.). Population Genetics Research Progress. Nova Science Publisher: 1–27. |
| ○ |
Schnell, G. D., Douglas, M. E. & Hough, D. J., 1986. Geographic patterns of variation in offshore spotted dolphins (Stenella attenuata) of the Eastern Tropical Pacific Ocean. Marine Mammal Science, 2(3): 186–213. https://doi.org/10.1111/j.1748-7692.1986.tb00040.x |
| ○ |
Smith, H.M., Chiszar, D. & Montanucci, R. R., 1997. Subspecies and classification. Herpetological Review, 28: 13–16. |
| ○ |
Trebbau, P., 1975. Measurements and some observations on the freshwater dolphin, Inia geoffrensis, in the Apure River, Venezuela. Der Zoologischer Garten, 45(3): 153–167. |
| ○ |
Trebbau, P. & van Bree, P. J. H., 1974. Notes concerning the freshwater dolphin Inia geoffrensis (De Blainville, 1817) in Venezuela. Zeitschrift für Saugetierkunde, 39: 50–57. |
| ○ |
van Belle, G., Fisher, L. D., Heagerty, P. J. & Lumley, T., 2004. Biostatistics A Methodology for the Health Sciences. Second Edition. John Wiley & Sons. |
| ○ |
van Bree, P. J. H. & Gallagher, M. D., 1971. On the taxonomic status of Delphinus tropicalis van Bree, 1971. (Notes on Cetacea, Delphinoidea 9). Beaufortia, 28: 1–8. |
| ○ |
van Bree, P. J. H. & Robineau, D., 1973. Notes sur les holotypes de Inia geoffrensis geoffrensis (DeBlainville, 1817) et de Inia geoffrensis boliviensis (d’Orbjgny, 1834) (Cetacea, Platinistidae). Mammalia 37: 658–664. |
| ○ |
van Bree, P. J. H. & P. Trebbau. 1974. Sobre algunas anomalías del esqueleto de la tonina de agua dulce, Inia geoffrensis Blainville 1817. Boletín de la Academia de Ciencias Físicas, Matemáticas y Naturales de Venezuela, 33: 3–9. |
| ○ |
Wang, J. Y., Chou, L. S. & White, B. N., 2000. Osteological differences between two sympatric forms of bottlenose dolphins (genus Tursiops) in Chinese waters. Journal of Zoology, 252: 147–162. https://doi.org/10.1111/j.1469-7998.2000.tb00611.x |
| ○ |
Wang, J. Y., Chu Yang, S. & Hung, S. K., 2015. Diagnosability and description of a new subspecies of Indo-Pacific humpback dolphin, Sousa chinensis (Osbeck, 1765), from the Taiwan Strait. Zoological Studies, 54: 36. https://doi.org/10.1186/s40555-015-0115-x |
| ○ |
Westgate, A. J., 2007. Geographic variation in cranial morphology of short-beaked common dolphins (Delphinus delphis) from the North Atlantic. Journal of Mammalogy, 88(3): 678–688. https://doi.org/10.1644/06-MAMM-A-177R.1 |
| ○ |
Zamudio, K. R. & Greene, H. W., 1997. Phylogeography of the bushmaster (Lachesis muta: Viperidae): implications for Neotropical biogeography, systematics, and conservation. Biological Journal of the Linnean Society, 62: 421–442. https://doi.org/10.1111/j.1095-8312.1997.tb01634.x |
| ○ |
Zelditch, M. L., Swidwerski, D. L. & Sheets, H. D. 2004. Geometric morphometrics for biologists: a primer. Academic Press, Second edition. 488 pp. |
Appendix 1.— Cranial measurements (mm) and meristics for I. g. humboldtiana in this study. For acronyms see Material and methods.
Apéndice 1.— Mediciones craneales (mm) y merísticas para I. g. humboldtiana en este estudio. Para las siglas ver Material y métodos.TOP
| Variable |
MBUCV I-135 |
MBUCV 78 |
MBUCV 251 |
MHNLS 6886 |
MCN b |
MCN d |
MCN e |
MCN 251 |
EBRG 21071 |
EBRG 17458 |
EBRG 21042 |
EBRG 29794 |
EBRG 4128 |
AJVS 001 |
AJVS 002 |
CPEB 001 |
ICN 3703 |
ICN 538 |
ICN 539 |
MHNG 832/56 |
| CBL |
435 |
|
467 |
433 |
468 |
363 |
434 |
|
440 |
487 |
475 |
420 |
399.5 |
416 |
|
503 |
448 |
480 |
497 |
492 |
| LR |
267 |
|
297 |
265 |
304 |
218 |
268 |
|
270 |
299 |
291 |
263 |
247 |
269 |
285 |
337 |
290 |
|
326 |
316 |
| WRB |
84.58 |
|
93.49 |
84.32 |
96 |
70 |
80 |
|
85.93 |
100.22 |
93.16 |
82.39 |
70.9 |
74.69 |
77.98 |
87.23 |
86 |
|
99 |
98 |
| WRM |
27.58 |
|
30.24 |
26.97 |
32 |
21 |
23 |
|
26.62 |
37.2 |
32.9 |
24.64 |
22.21 |
23.56 |
24.96 |
31.38 |
31 |
|
34 |
33 |
| WRL¾ |
23.62 |
|
25.31 |
23.26 |
27 |
11 |
18 |
|
22.6 |
31.39 |
23.69 |
20.47 |
18.29 |
11.26 |
20.73 |
29.85 |
23 |
|
28 |
26 |
| WR60mm |
44.87 |
|
46.8 |
40.62 |
53 |
32 |
32 |
|
42.35 |
54.09 |
47.51 |
40.44 |
37.12 |
36.49 |
35.38 |
49.68 |
|
|
|
|
| GWPm |
29.16 |
|
31.4 |
27.91 |
|
|
|
|
27.07 |
36.94 |
33.32 |
27.19 |
24.74 |
21.61 |
44.35 |
28.55 |
39 |
|
49 |
44 |
| WPmMR |
18.14 |
|
20.44 |
17.79 |
|
|
|
|
17.18 |
25.52 |
21.68 |
15.74 |
15.55 |
15.2 |
17.62 |
21.4 |
19 |
|
24 |
22 |
| WPm¾ |
16.85 |
|
18.5 |
16.74 |
|
|
|
|
15.62 |
24.62 |
19.84 |
15.34 |
14.69 |
12.7 |
15.18 |
23.22 |
15 |
|
24 |
19 |
| WPm60mm |
23.5 |
|
25.29 |
22.68 |
|
|
|
|
21.28 |
34.21 |
27.71 |
19.48 |
19.11 |
18.43 |
19.93 |
25 |
|
|
|
|
| GPrW |
136 |
|
147.57 |
133.96 |
150 |
110 |
121 |
|
130 |
159 |
142 |
|
|
119.58 |
127.49 |
141.67 |
133 |
|
149 |
155 |
| GPoW |
173 |
|
179 |
162 |
180 |
136 |
153 |
|
165 |
200 |
183 |
|
|
145.44 |
153.24 |
172 |
172 |
|
190 |
189 |
| WZP |
212 |
|
213 |
202 |
214 |
166 |
196 |
|
198 |
235 |
225 |
178 |
169 |
183 |
|
216 |
|
|
243 |
233 |
| GPW |
106.81 |
|
99.81 |
104.3 |
90 |
80 |
86 |
|
94.03 |
96.45 |
100.01 |
94.44 |
96.99 |
96 |
94.5 |
103.9 |
|
|
123 |
106 |
| LLTF |
128 |
|
143.17 |
132.38 |
146 |
106 |
212 |
|
130.49 |
158 |
131.71 |
121.47 |
|
124.79 |
129.1 |
141.58 |
|
|
159 |
155 |
| LRTF |
138.28 |
|
147 |
|
|
|
|
|
131.35 |
162 |
145.52 |
|
122.76 |
130.91 |
132.59 |
147.23 |
|
|
161 |
158 |
| HLTF |
79.77 |
|
75.45 |
86.14 |
78 |
64 |
76 |
|
108.56 |
90.58 |
87.76 |
68.89 |
69.65 |
70.98 |
73.7 |
81.94 |
|
|
97 |
85 |
| HRTF |
85.68 |
|
84.93 |
90.49 |
|
|
|
|
85.49 |
99.55 |
98.48 |
76.72 |
72.85 |
75.03 |
77.44 |
84.73 |
|
|
103 |
91 |
| DTREN |
305 |
|
343 |
311 |
348 |
256 |
312 |
|
304 |
349 |
339 |
302 |
285 |
363 |
324 |
376 |
329 |
|
368 |
359 |
| DTRIN |
322 |
|
356 |
305 |
361 |
265 |
323 |
|
306 |
335 |
319 |
|
|
314 |
|
382 |
|
|
|
369 |
| LURTR |
238 |
|
268 |
242 |
272 |
200 |
240 |
|
250 |
272 |
268 |
241 |
224 |
231 |
255 |
300 |
253 |
|
294 |
277 |
| LULTR |
236 |
|
266 |
240 |
270 |
200 |
237 |
|
245 |
272 |
266 |
239 |
225 |
234 |
251 |
294 |
249 |
|
293 |
277 |
| NDAURMx |
25 |
|
25 |
24 |
25 |
25 |
24 |
|
26 |
22 |
26 |
26 |
27 |
26 |
27 |
28 |
25 |
|
24 |
25 |
| NDAULMx |
25 |
|
25 |
25 |
25 |
26 |
25 |
|
25 |
21 |
25 |
27 |
25 |
26 |
26 |
27 |
25 |
|
23 |
24 |
| AD |
9.64 |
8.03 |
9.15 |
8.79 |
|
|
|
|
8.43 |
8.87 |
8.31 |
8.92 |
7.85 |
7.49 |
6.96 |
8.96 |
|
|
|
|
| GLLR |
375 |
372 |
394 |
376 |
|
311 |
374 |
398 |
358 |
389 |
|
|
338 |
360 |
376 |
419 |
395 |
421 |
|
432 |
| GHLRCP |
80.54 |
78 |
86.27 |
78.9 |
|
66 |
77 |
91 |
79.73 |
99.3 |
|
|
70.81 |
77.1 |
79.68 |
89.35 |
85 |
100 |
|
90 |
| LMS |
183 |
187 |
197 |
187 |
|
141 |
183 |
199 |
182 |
190 |
|
|
177 |
174 |
187 |
202 |
201 |
215 |
|
205 |
| LLRTR |
236 |
242 |
252 |
240 |
|
200 |
238 |
254 |
241 |
230 |
|
|
219 |
229 |
249 |
269 |
250 |
272 |
|
277 |
| LLLTR |
234 |
241 |
248 |
246 |
|
200 |
237 |
255 |
236 |
234 |
|
|
220 |
223 |
243 |
274 |
248 |
267 |
|
277 |
| NDARM |
26 |
25 |
27 |
24 |
|
25 |
24 |
27 |
27 |
19 |
|
|
26 |
26 |
26 |
25 |
25 |
22 |
|
24 |
| NDALM |
25 |
24 |
26 |
25 |
|
26 |
25 |
26 |
25 |
19 |
|
|
26 |
25 |
26 |
25 |
24 |
22 |
|
24 |
Appendix 2.— Correlation matrix of cranial measurements for I. g. humboldtiana. For acronyms see Material and methods. Bold = strong positive correlation.
Apéndice 2.— Matriz de correlación de las mediciones
craneales para I. g. humboldtiana. Para las siglas ver Material y métodos. Negrita = fuerte correlación positiva.TOP
| VARIABLE |
CBL |
LR |
WRB |
WRM |
WR¾L |
GWPm |
WPmMR |
WPm¾ |
GPrW |
GPoW |
WZP |
GPW |
LLTF |
LRTF |
HLTF |
HRTF |
DTREN |
DTRIN |
LURTR |
LULTR |
| CBL |
1 |
|
|
|
|
|
|
|
|
|
|
|
|
|
|
|
|
|
|
|
| LR |
0.969 |
1 |
|
|
|
|
|
|
|
|
|
|
|
|
|
|
|
|
|
|
| WRB |
0.898 |
0.791 |
1 |
|
|
|
|
|
|
|
|
|
|
|
|
|
|
|
|
|
| WRM |
0.904 |
0.818 |
0.944 |
1 |
|
|
|
|
|
|
|
|
|
|
|
|
|
|
|
|
| WR¾L |
0.885 |
0.811 |
0.863 |
0.878 |
1 |
|
|
|
|
|
|
|
|
|
|
|
|
|
|
|
| GWPm |
0.715 |
0.613 |
0.598 |
0.595 |
0.504 |
1 |
|
|
|
|
|
|
|
|
|
|
|
|
|
|
| WPmMR |
0.919 |
0.797 |
0.915 |
0.970 |
0.862 |
0.641 |
1 |
|
|
|
|
|
|
|
|
|
|
|
|
|
| WPm¾ |
0.885 |
0.783 |
0.808 |
0.859 |
0.890 |
0.466 |
0.929 |
1 |
|
|
|
|
|
|
|
|
|
|
|
|
| GPrW |
0.885 |
0.789 |
0.969 |
0.944 |
0.904 |
0.492 |
0.931 |
0.836 |
1 |
|
|
|
|
|
|
|
|
|
|
|
| GPoW |
0.878 |
0.746 |
0.977 |
0.969 |
0.894 |
0.504 |
0.937 |
0.819 |
0.966 |
1 |
|
|
|
|
|
|
|
|
|
|
| WZP |
0.925 |
0.848 |
0.938 |
0.940 |
0.837 |
0.853 |
0.940 |
0.849 |
0.923 |
0.964 |
1 |
|
|
|
|
|
|
|
|
|
| GPW |
0.622 |
0.625 |
0.534 |
0.557 |
0.564 |
0.542 |
0.513 |
0.551 |
0.565 |
0.599 |
0.663 |
1 |
|
|
|
|
|
|
|
|
| LLTF |
0.428 |
0.381 |
0.365 |
0.251 |
0.308 |
0.679 |
0.908 |
0.829 |
0.258 |
0.295 |
0.414 |
0.081 |
1 |
|
|
|
|
|
|
|
| LRTF |
0.906 |
0.808 |
0.944 |
0.957 |
0.793 |
0.656 |
0.960 |
0.875 |
0.946 |
0.919 |
0.955 |
0.583 |
0.955 |
1 |
|
|
|
|
|
|
| HLTF |
0.585 |
0.469 |
0.619 |
0.588 |
0.591 |
0.308 |
0.493 |
0.465 |
0.462 |
0.565 |
0.643 |
0.493 |
0.210 |
0.400 |
1 |
|
|
|
|
|
| HRTF |
0.764 |
0.580 |
0.887 |
0.895 |
0.730 |
0.578 |
0.874 |
0.808 |
0.753 |
0.855 |
0.916 |
0.607 |
0.738 |
0.861 |
0.698 |
1 |
|
|
|
|
| DTREN |
0.857 |
0.910 |
0.677 |
0.719 |
0.590 |
0.395 |
0.642 |
0.599 |
0.661 |
0.599 |
0.741 |
0.563 |
0.328 |
0.688 |
0.349 |
0.449 |
1 |
|
|
|
| DTRIN |
0.882 |
0.954 |
0.699 |
0.674 |
0.730 |
0.498 |
0.547 |
0.594 |
0.753 |
0.662 |
0.721 |
0.512 |
0.382 |
0.615 |
0.115 |
0.011 |
0.835 |
1 |
|
|
| LURTR |
0.980 |
0.982 |
0.832 |
0.843 |
0.867 |
0.601 |
0.842 |
0.861 |
0.821 |
0.788 |
0.863 |
0.621 |
0.364 |
0.814 |
0.544 |
0.662 |
0.852 |
0.905 |
1 |
|
| LULTR |
0.980 |
0.983 |
0.844 |
0.856 |
0.857 |
0.607 |
0.864 |
0.875 |
0.841 |
0.805 |
0.873 |
0.639 |
0.363 |
0.851 |
0.529 |
0.680 |
0.875 |
0.912 |
0.996 |
1 |
Appendix 3.— Correlation matrix of cranial measurements for I. g. geoffrensis. For acronyms see Material and methods. Bold = strong positive correlation.
Apéndice 3.— Matriz de correlación de las mediciones craneales para I. g. geoffrensis. Para las siglas ver Material y métodos. Negrita = fuerte correlación positiva.TOP
| VARIABLE |
CBL |
LR |
WRB |
WRM |
WR¾L |
GWPm |
WPmMR |
WPm¾ |
GPrW |
GPoW |
WZP |
GPW |
LLTF |
LRTF |
HLTF |
HRTF |
DTREN |
DTRIN |
LURTR |
LULTR |
| CBL |
1 |
|
|
|
|
|
|
|
|
|
|
|
|
|
|
|
|
|
|
|
| LR |
0.951 |
1 |
|
|
|
|
|
|
|
|
|
|
|
|
|
|
|
|
|
|
| WRB |
0.753 |
0.598 |
1 |
|
|
|
|
|
|
|
|
|
|
|
|
|
|
|
|
|
| WRM |
0.620 |
0.505 |
0.788 |
1 |
|
|
|
|
|
|
|
|
|
|
|
|
|
|
|
|
| WR¾L |
0.648 |
0.537 |
0.749 |
0.844 |
1 |
|
|
|
|
|
|
|
|
|
|
|
|
|
|
|
| GWPm |
0.529 |
0.482 |
0.350 |
0.281 |
0.314 |
1 |
|
|
|
|
|
|
|
|
|
|
|
|
|
|
| WPmMR |
0.567 |
0.406 |
0.700 |
0.902 |
0.846 |
0.435 |
1 |
|
|
|
|
|
|
|
|
|
|
|
|
|
| WPm¾ |
0.660 |
0.551 |
0.722 |
0.809 |
0.851 |
0.373 |
0.862 |
1 |
|
|
|
|
|
|
|
|
|
|
|
|
| GPrW |
0.709 |
0.519 |
0.940 |
0.752 |
0.663 |
0.216 |
0.707 |
0.670 |
1 |
|
|
|
|
|
|
|
|
|
|
|
| GPoW |
0.729 |
0.514 |
0.939 |
0.783 |
0.701 |
0.296 |
0.781 |
0.703 |
0.967 |
1 |
|
|
|
|
|
|
|
|
|
|
| WZP |
0.782 |
0.588 |
0.912 |
0.760 |
0.703 |
0.384 |
0.765 |
0.768 |
0.941 |
0.978 |
1 |
|
|
|
|
|
|
|
|
|
| GPW |
0.525 |
0.546 |
0.343 |
0.418 |
0.418 |
0.593 |
0.297 |
0.444 |
0.215 |
0.247 |
0.299 |
1 |
|
|
|
|
|
|
|
|
| LLTF |
0.402 |
0.267 |
0.440 |
0.261 |
0.360 |
0.444 |
0.789 |
0.776 |
0.399 |
0.442 |
0.514 |
0.008 |
1 |
|
|
|
|
|
|
|
| LRTF |
0.679 |
0.439 |
0.819 |
0.682 |
0.701 |
0.255 |
0.833 |
0.796 |
0.800 |
0.942 |
0.877 |
0.105 |
0.926 |
1 |
|
|
|
|
|
|
| HLTF |
0.618 |
0.410 |
0.723 |
0.537 |
0.529 |
0.433 |
0.583 |
0.519 |
0.716 |
0.780 |
0.797 |
0.285 |
0.348 |
0.613 |
1 |
|
|
|
|
|
| HRTF |
0.568 |
0.342 |
0.833 |
0.697 |
0.577 |
0.141 |
0.728 |
0.680 |
0.879 |
0.903 |
0.888 |
0.199 |
0.687 |
0.639 |
0.769 |
1 |
|
|
|
|
| DTREN |
0.936 |
0.960 |
0.628 |
0.496 |
0.455 |
0.462 |
0.401 |
0.498 |
0.555 |
0.543 |
0.621 |
0.506 |
0.285 |
0.477 |
0.443 |
0.383 |
1 |
|
|
|
| DTRIN |
0.942 |
0.969 |
0.640 |
0.527 |
0.589 |
0.570 |
0.382 |
0.517 |
0.616 |
0.582 |
0.604 |
0.657 |
0.279 |
0.379 |
0.358 |
0.246 |
0.937 |
1 |
|
|
| LURTR |
0.955 |
0.984 |
0.618 |
0.484 |
0.548 |
0.483 |
0.389 |
0.564 |
0.513 |
0.521 |
0.602 |
0.523 |
0.260 |
0.452 |
0.450 |
0.370 |
0.939 |
0.953 |
1 |
|
| LULTR |
0.951 |
0.986 |
0.608 |
0.479 |
0.535 |
0.487 |
0.385 |
0.569 |
0.503 |
0.513 |
0.594 |
0.531 |
0.252 |
0.448 |
0.433 |
0.360 |
0.945 |
0.956 |
0.998 |
1 |