
 CHIEFS VS. JETS - REGULAR SEASON GAME 4 - OCTOBER 1, 2023
CHIEFS VS. JETS - REGULAR SEASON GAME 4 - OCTOBER 1, 2023
CHIEFS VS. JETS - REGULAR SEASON GAME 4 - OCTOBER 1, 2023
CHIEFS TAKE ON NEW YORK JETS ON SUNDAY NIGHT FOOTBALL
THIS WEEK’S MEDIA AVAILABILITY
VS.
The Kansas City Chiefs head into back-to-back road games over the next twoweeks,thefirstagainsttheNewYorkJetsonSundayNightFootball. KickoffatMetLifeStadiumisslatedfor7:20p.m.CT.TheChiefsenterthe contest with a 2-1 record. The Chiefs are 26-15 in the month of October duringHeadCoachAndyReid'stenure.
KansasCityisinthemidstofitsquestforaneighthstraightAFCWesttitle. OverthelastfourseasonstheChiefshaveplayedinthreeSuperBowls (LIV, LV and LVII). Kansas City has hosted a record five-straight AFC ChampionshipGamesatGEHAFieldatArrowheadStadium.In2022,the Chiefsfinishedwitha14-3recordandthenumberoneseedintheAFC. KChasclinchedseven-consecutiveAFCWesttitles,tyingforthesecondlongeststreakinNFLhistory(NE-11,2009-19).Since2015,KansasCity has tallied a 42-6 record (.875) againstAFC West opponents, the NFL’s bestdivisionalrecordoveraneight-yearspansincedivisionalrealignment in2002.UnderReid,KChasqualifiedforthepostseasonninetimesin10 seasons and has nine 10+ win seasons. Reid owns 271 career victories (regularandpostseasoncombined).HeranksfourthontheNFL’sall-time winslist.Hehastallied119regularseasonwinsinKansasCity.

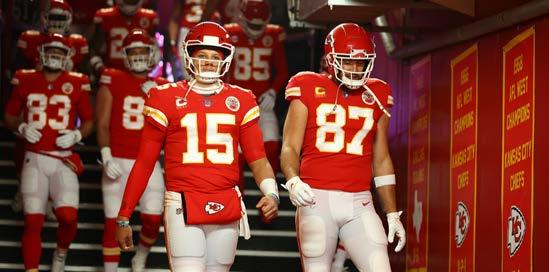
Chiefs QB Patrick Mahomes is in his sixth season as the club’s starting quarterback.Asthestarter,Mahomeshasledtheteamtofive-consecutive home AFC Championship Games, three Super Bowl appearances and earnedNFLMVP(2018,2022)andSuperBowlMVPhonors(2019,2022). Since2018,heleadstheleagueinyards(24,760),touchdowns(199),25+ yardcompletions(213)andfirstdownthrows(1,219).Withonly50interceptions(since2018),heownsa+149TD/INTratio,thehighestmarkof any active QB in that span. He owns 42 career games of 300+ passing yards.TETravisKelcehasrecordedanNFLrecordseven-straight1,000yardreceivingseasons(1,338yardsin2022).Heowns35gameswith100+ receivingyards(mostinNFLhistoryforatightend)andhascaughtatleast one pass in 163 consecutive games (reg. and postseason). Since enteringtheNFLin2013,Kelceleadsalltightendsinreceivingyards(10,439) andreceptions(825).Heranksfirstintouchdowns(71)andcatchesof25+ yards(81).Defensivelyin2023,theChiefsrankfourthintheNFLinpoints allowed(13.3ppg)andhavegivenupthreeTDsinthefirstthreegames.
The 2023 Chiefs feature several new faces including two new tackles, JawaanTaylor (RT) and Donovan Smith (LT).The club drafted DE Felix Anudike-Uzomahinthefirstround(31stoverall)andWRRasheeRicein thesecondround(55thoverall)ofthe2023NFLDraftheldinKansasCity. ForthefirsttimeinsixseasonstheChiefshaveanewoffensivecoordinator.OCMattNagytakesonthatrolefortheclubafterservinginthatsame capacityfrom2016-17.Thisyear’sregularseasonschedulefeatureseight gamesvs.sevenplayoffteamsfrom2022.Thecombined2022recordof KansasCity’s2023homeandawayopponentsis147-140-0(.512).
Sunday,Oct.1 ChiefsatJets-7:20p.m.CT
*Alltimesareapproximateandsubjecttochangewithlittleornonotice. *Forcredentialrequeststocoverpractice,pleaseemailBradGeeat bgee@chiefs.nfl.com.Forgamecredentialquestions,pleaseemailCydneyGlazeatcglaze@chiefs.nfl.com.
BROADCAST INFORMATION
TVCoverage NBC(KSHBLocal)
Play-by-Play: MikeTirico
Analyst: CrisCollinsworth
Sideline: MelissaStark
TicoSports(KansasCity) AudacyApp(ChiefsenEspanol) SpanishRadioBroadcast
Play-by-Play: EnriqueMorales
Color: OscarMonterroso
Sideline: HannahBassham
ChiefsRadioNetwork WDAF(106.5FM)
Play-by-Play: MitchHolthus
Color: DananHughes
Sideline: JoshKlingler
ChiefsPregame&PostgameShow WDAF(106.5FM)&KCSP(610AM)
Hosts: ArtHainsandDanIsrael
ChiefsTwitterAccounts: @Chiefs @KCChiefs_Matt@ChiefsPR
PostgamePressConfsLive: ChiefsYoutube/FacebookChannels
CHIEFS MEDIA WEBSITE INFORMATION
The Kansas City Chiefs 2023 Media Guide is available on the Chiefs mediainformationwebsite,NFLOMG.com.Theclub’ssiteisanimproved interactiveonlinemediaguidethatfeaturesanin-gamestatisticsmonitoring platform,inadditiontotheweeklypressmaterialssuchastranscripts,weekly releases, bios, additional stats and more. The team’s guide is updated weekly throughout the season to reflect the most up-to-date information. MediamemberscanalsoaccesstheChiefscredentialapplicationthrough thesite.Tologin,theusernameis chiefsmedia andthepasswordis chiefs
DID YOU KNOW?
With last week's 41-10 win over the Chicago Bears at GEHA Field at ArrowheadStadium,ChiefsHeadCoachAndyReidsolidifiedhis271stcareer win(reg.andpostseason)asaheadcoachintheNFL.Thatwinmovedhim pastTomLandryforfourthall-timeamongheadcoaches.HetrailsonlyDon Shula(347),GeorgeHalas(324)andBillBelichick(321)intherankings.
CHIEFS COMMUNICATIONS STAFF CONTACT INFORMATION
Chiefs 1 TedCrews ExecutiveVicePresidentofCommunications (816)920-4359 tcrews@chiefs.nfl.com BradGee VicePresidentofFootballCommunications (816)920-4349 bgee@chiefs.nfl.com LukeShanno SeniorDirectorofCorporateCommunications (816)920-4351 lshanno@chiefs.nfl.com CydneyGlaze DirectorofCommunications&Admin. (816)920-4352 cglaze@chiefs.nfl.com KelseyBoal CommunicationsAssistant (816)920-4355 kboal@chiefs.nfl.com JadeThomas CommunicationsSeasonalAssistant (816)920-4285 jthomas@chiefs.nfl.com KallenWebster CommunicationsSeasonalAssistant (816)920-4403 kwebster@chiefs.nfl.com
Kansas City Chiefs (2-1) vs. New York Jets (1-2) Sunday, October 1, 2023 • NBC • 7:20 p.m. CT MetLife Stadium • East Rutherford, New Jersey
Practice Coach Media Players
NoMediaAvailability Wednesday,Sept.27 1:20p.m. Reid 11:45a.m. 11:45a.m. Thursday,Sept.28 1:20p.m. Assts. 11:45a.m. 11:45a.m. Friday,Sept.29 11:45a.m. Reid 1:00p.m. 1:00p.m.
NoMediaAvailability
Date
Tuesday,Sept.26
Saturday,Sept.30
CHIEFS VS. JETS TEAM COMPARISONS
CHIEFS VS. JETS IND. COMPARISONS
CHIEFS VS. JETS SERIES HISTORY
•TheChiefsandtheJetshavematchedup38timesintheregularseason, datingbackto1960.Ofthe38games,theChiefsare19-18-1.
• These two teams have also faced each other in the postseason twice, onceinthedivisionalround(12/20/1969)andonceinthewildcardround (12/28/1986).Whenmeetinginthepostseason,theChiefsare1-1against theJets.
• Since becoming Head Coach of the Chiefs,Andy Reid is 3-1 against the JetswhileQBPatrickMahomesis1-0inhiscareer.Mahomeswillplayat MetLifeStadiumforthefirsttimeinhiscareer.
CHIEFSVS.JETSSERIESHISTORY-LAST10GAMES
*GiantsStadium**MetLifeStadium
Chiefs 2
Chiefs Jets Record 2-1 1-2 DivisionStanding 1st(AFCW) T-3rd(AFCE) TurnoverMargin(NFLRank) -2(T-20th) -1(19th) Offense(NFLRank) NetYardsPerGame 390.3(5th) 225.0(32nd) YardsPerPlay 5.8(5th) 4.2(31st) PointsPerGame 26.0(9th) 14.0(32nd) PossessionAverage 31:48(7th) 24:26(32nd) NetRushingYardsPerGame 114.7(10th) 91.3(22nd) NetPassingYardsPerGame 275.7(5th) 133.7(32nd) HadIntercepted/Yards 4/92 4/53 SacksAllowed/Yards 1/-7(T-1st) 9/-66(T-21st) Fumbles/Lost 4/2 3/1 ThirdDownPct. 46.3%(8th) 21.6%(32nd) RedZoneTDPct. 75.0%(T-3rd) 40.0%(T-27th) Giveaways ............................................6(T-27th)......................5(T-21st) Defense(NFLRank) NetYardsPerGame 280.7(6th) 351.3(20th) YardsPerPlay 4.6(5th) 4.8(9th) PointsPerGame 13.3(4th) 20.3(12th) NetRushingYardsPerGame 102.7(11th)............... 129.3(23rd) NetPassingYardsPerGame 178.0(6th) 222.0(16th) InterceptedBy/Yards 1/16 3/0 SacksFor/Yards 8/-33(T-15th) 6/-26(T-21st) Opp.Fumbles/Opp.FumbleRecovs. 6/3 3/1 ThirdDownPct. 30.8%(T-5th) 44.0%(22nd) RedZoneTDPct. 37.5%(T-5th) 37.5%(T-5th) Takeaways 4(T-13th) 4(T-13th) SpecialTeams(NFLRank) Punts-AverageYards(Gross) 49.5(11th) 48.5(14th) Punts-AverageYards(Net) 47.4(2nd) 43.6(10th) PuntReturns-AveragePer 6.3(23rd) 16.0(5th) PuntReturns-AveragePerAllowed 7.0(15th) 8.6(19th) KickoffReturns-AveragePer.............. 14.0(28th) ....................25.3(7th) KickoffReturns-Avg.PerAllowed......0.0(T-27th) 5.5(T-1st) FieldGoalPercentage/(M/A) 100.0%(5/5) 100.0%(5/5) Penalties(NFLRank) PenaltiesAgainst/Yards 18/134(T-12th) 10/54(1st) Opp.PenaltiesAgainst/Yds 12/105(30th) 17/121(T-21st) Chiefs Jets PASSINGYARDS Mahomes 803 Wilson 467 RUSHINGYARDS Pacheco..............................155 Hall 154 Mahomes 103 Cook 58 Edwards-Helaire 77 Wilson 43 RECEIVINGYARDS Watson 158 Wilson 165 Moore 112 Lazard 108 Rice 108 Conklin 78 Kelce 95 Cook 42 POINTSSCORED Butker 24 Zuerlein 14 Kelce 12 Wilson 12 McKinnon............................12 Bawden 6 FiveTied 6 Gipson 6 INTERCEPTIONS Edwards..............................1 Whitehead 3 SACKS Danna 2.5 Jefferson 2.0 Jones 2.5 FourTied 1.0 Karlaftis...............................2.0 TwoTied 0.5 DEFENSIVETACKLES McDuffie 16 Mosley 26 Tranquill 15 Williams 26 Bolton 15 Whitehead 21 ThreeTied 14 Reed..........................................20 KICKOFFRETURNS(AVG.) James 1(14.0) Gipson 4(25.3) PUNTRETURNS(AVG.) James 6(4.0) Gipson 7(16.0) Washington 3(11.0) FIELDGOALS Butker 5/5(100.0%) Zuerlein 4/4(100.0%) PUNTS(GROSS/NETAVG.) Townsend 10(49.5/47.4) Morstead 17(48.5/43.6)
•WhenplayinginNewYorkagainsttheJets,theChiefsare7-11-1withthe tiecomingin1988(10/02/1988).TheChiefswilllooktosnapafour-game losingstreakwhenplayingtheJetsontheroad. Date Result OfNote 11/11/2001* L,7-27 NYJ:MartinhadthreerushingTDs. 10/06/2002* W,29-25 KC:Martinrushedfor119yardsandoneTD. 09/11/2005 L,27-7 NYJ:JohnsonhadtworushingTDs,Holmeshadone. 12/30/2007* L,10-13 NYJ:Clemensthrewfor115yardsandoneTD. 10/26/2008* L,24-28 NYJ:Favrethrewfor290yardsandtwoTDs. 12/11/2011** L,10-37 NYJ:SanchezthrewtwoTDsandaddedtworushingTDs. 11/02/2014 W,24-10 KC:KelceandFasanobothhadaTDreception. 09/25/2016 W,24-3 KC:Johnsonhada55-yardpicksix. 12/03/2017** L,31-38 NYJ:McCownthrewforoneTDoff331yards. 11/01/2020 W,35-9 KC:FourdifferentreceivershadaTDrec.includingtwotoHill.
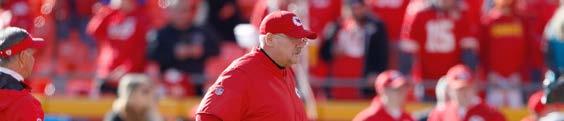
CHIEFS HEAD COACH ANDY REID
Reid is in his 32nd NFL season, 25th as a head coach and 11th with the Chiefs. In his first ten seasons with the club, Reid tallied 119 regular season wins, more victories than any other head coach in franchise history in that timeframe. Reid’s 70 wins at GEHA Field at Arrowhead Stadium passed Marty Schottenheimer for most wins at the home of the Chiefs (64). In 2019, Reid led the Chiefs to their first Super Bowl appearance and victory in 50 years, bringing the Lombardi Trophy back to Kansas City for the first time since the 1969 season. Additionally, the Chiefs 35-24 victory over the Tennessee Titans in the AFC Championship Game brought the Lamar Hunt Trophy to Kansas City for the first time ever. Under Reid, the Chiefs have made the playoffs nine of ten seasons, including a franchise best 14-2 record in 2020. Reid has led the Chiefs to back-to-back Super Bowl appearances (LIV and LV) and returned to the Super Bowl stage last season where they won Super Bowl LVII.
The Chiefs are now the first team in NFL history to host five-consecutive conference championship games (2018-22). The club has also earned sevenstraight AFC West titles (2016-22) for the first time in franchise history. In 2015, the Chiefs won their first playoff game since 1994, defeating the Texans 30-0. The team finished 11-5 after a 1-5 start in 2015. It was the greatest turnaround in a single-season in NFL history. In 2013, Reid led the Chiefs to an 11-5 record marking the greatest single-season turnaround in franchise history after the team finished 2-14 in 2012.
Prior to joining the Chiefs, Reid led the Eagles to a 130-93-1 (.583) regular season record during his 14 seasons as head coach. He led the Eagles franchise to one Super Bowl appearance. When you include his time as an NFL assistant coach, his teams have made the playoffs 22 times (31-21 record), and he has coached in six Super Bowls, eight NFC Championships and five AFC Championships. Reid spent seven seasons as an assistant coach with the Green Bay Packers under Head Coach Mike Holmgren. Prior to joining the NFL ranks, Reid’s final collegiate stop was the University of Missouri (1989-91). Prior to his stint with the Tigers, Reid spent two years working with the offensive line at the University of Texas – El Paso, and before that, he held the same position with Northern Arizona. In 1983, Reid took the position of offensive coordinator and offensive line coach at San Francisco State (1983-85). A tackle/guard at Brigham Young University from 1979-81, Reid entered the coaching ranks as a graduate assistant at BYU in 1982.

NFL Head Coach: 25th Year
NFL Coach Overall: 32nd Year
NFL Overall: 271-155-1 (.636)
Reg. Season: 249-139-1 (.641)
Postseason: 22-16 (.579)
1979-82 BYU
JETS HEAD COACH ROBERT SALEH
Robert Saleh was named the head coach of the New York Jets on January 19, 2021. Last season, Saleh oversaw a team that increased their total by three wins, the sixth largest in the league. Despite using three different starting quarterbacks, they improved in nearly every offensive category. After finishing last in the League in total defense in 2021, Saleh led a defensive unit that finished fourth overall in the NFL. His defenses have now ranked in the top five in three of the last four seasons, including becoming one of just five since 2000 to finish in the top five, a season after ranking 32nd.
While the team found success as a whole this past season, Saleh also helped his players reach multiple individual accolades, including four Pro Bowl selections, two First-TeamAll-Pro honors, one Second-TeamAll-Pro honor and both Offensive and Defensive Rookie of the Year selections in wide receiver Garrett Wilson and cornerback Sauce Gardner - becoming one of only three teams in NFL history to do so.
Since becoming head coach, Saleh’s group has seen a League-high 9,808 snaps by rookies, including 117 starts, the third-most in the NFL over that span. In his first season with the Jets (2021), Saleh coached the League’s youngest roster with an opening day age of 25.13. They became only the second team since the merger led by rookies in passing yards, rushing yards and receiving yards that season and while the results weren’t always there, the scars and the experience gained through them were.
Before joining the Jets, Saleh spent four seasons as the defensive coordinator with San Francisco. The last two seasons under Saleh, the 49ers defense led the League in passing defense (188.6), ranking in the top 10 in passer rating allowed (85.8), completion percentage allowed (62.4%), tackles for loss (154) and defensive touchdowns (six), while also helping San Francisco advance to Super Bowl LIV. A key part of the team’s Super Bowl LIV run (2019), Saleh’s defense finished second in total defense, first in passing defense and third in third-down defense, while producing 48 sacks (tied for the fifth most in the League), and 28 takeaways (the sixth most).
A native of Dearborn, MI, Saleh attended Northern Michigan University where he started for four years at tight end. He earned his finance degree, beginning a career as a credit analyst before getting into coaching.
Record w/ KC: 119-46 (.721)
Record w/ PHI: 130-93-1 (.583)
Record vs. NYJ: 6-1 (.857) College: BYU (’81)
Hometown: Los Angeles, Calif.
ANDY REID’S CAREER PATH
Tackle/Guard(‘79-81) GraduateAssistant(‘82)
NFL Head Coach: 3rd Year
NFL Coach Overall: 19th Year
NFL Overall: 12-25 (.324)
Reg. Season: 12-25 (.324)
Postseason: 0-0 (.000)
Record w/ NYJ: 12-25 (.324)
Record vs. KC: 0-0 (.000)
College: Northern Michigan (‘01)
Hometown: Dearborn, Mich.
ROBERT SALEH’S CAREER PATH
1987-88 Texas-ElPaso
1989-91 Missouri OffensiveLine
1992-98 GreenBayPackers
TightEnds/OffensiveLine(‘92-96) Quarterbacks(‘97-98)
1999-12 PhiladelphiaEagles HeadCoach(‘99-00)
HC/Exec.V.P.FootballOps(‘01-12)
2013-23 KansasCityChiefs HeadCoach
Chiefs 3 1997-01 NorthernMichigan TightEnd 2002-03 MichiganState OffensiveAssistant/TightEnds(‘02) DefensiveAssistant/DefensiveLine(‘03) 2004 CentralMichigan DefensiveAssistant/DefensiveLine 2005 Georgia DefensiveAssistant/Linebackers 2005-10 HoustonTexans CoachingIntern(‘05) DefensiveAssistant(‘06-08) AssistantLinebackers(‘09-10) 2011-13 SeattleSeahawks.............................DefensiveQualityControl 2014-16 JacksonvilleJaguars.................................. Linebackers 2017-20 SanFrancisco49ers DefensiveCoordinator 2021-23 NewYorkJets HeadCoach
Conference Titles
Division Titles 19
13 13 13
ROBERT SALEH’S HARDWARE
1983-85 SanFranciscoState OffensiveCoordinator OffensiveLine
1986 NorthernArizona OffensiveLine
OffensiveLine
01 96 95 96 97 96 97 02 03 04 10 Division Titles 04 ANDY REID’S HARDWARE 16 17 19 19 19 20 20 21 Conference Titles
18 06 22 21 22 22 19
MISC. OFFENSIVE NOTES CHIEFS-JETS CONNECTIONS
COLLEGE CONNECTIONS
Underline indicates a coach or administrative role (c/a). Bold indicates a connection from a current coach’s former playing career.
NFL CONNECTIONS
Underline indicates a coach or administrative role (c/a). Bold indicates a connection from a current coach’s former playing career. CHIEFS JETS
RBJerickMcKinnon(2018-20)
FORMER JETS
•Chiefs DefensiveBacksCoachDaveMerritt beganhisNFLcoachingcareer withtheJetsasadefensiveassistantandlinebackerscoachfrom2001-03.
FORMER CHIEFS
•Jets RunningBacksCoachTaylorEmbree gothisNFLcoachingstartwith theChiefs.Hespentoneseason(2016)asadefensiveassistant.
•Jets WRMecoleHardmanJr. wasdraftedbytheChiefsin2019andspent thefirstfouryearsofhiscareerinKansasCity.Heaccumulated2,088receiving yardsand16receivingtouchdownsfortheChiefs.
FAMILY TIES
•Jets RunningBacksCoachTaylorEmbree isthebrotherofChiefs Wide ReceiversCoachConnorEmbree
BEHIND ENEMY LINES
SMikeEdwards(2019-22)
QBBlaineGabbert(2019-22)
TDonovanSmith(2015-22) WRJustinWatson(2018-21)

(c/a)DaveMerritt(1993-96)
(c/a)KenFlajole(2016-20)
TPrinceTegaWanogho(2020)
WRKadariusToney(2021-22)
TEBlakeBell(2018)
(c/a)JoeCullen(2010-12)
QBBlaineGabbert(2011-13) (c/a)AndyHeck(2006-12) TJawaanTaylor(2019-22)
WRMarquezValdes-Scantling(2018-21)
(c/a)TaylorEmbree(2017-19) (c/a)TonyOden(2020)
CBD.J.Reed(2018-19) (c/a)MikeRutenberg(2020) (c/a)RobertSaleh(2017-20)
DLSolomonThomas(2017-20)
GLakenTomlinson(2017-21)
SJordanWhitehead(2018-21)
(c/a)BrantBoyer(1992-93)
(c/a)MarquandManuel(2020)
CBCraigJames(2019-20)
(c/a)BenWilkerson(2018-21)
(c/a)NathanielHackett(2015-18)
(c/a)RonMiddleton(2013-20)
(c/a)TonyOden(2012) (c/a)MikeRutenberg(2013-19) (c/a)AaronWhitecotton(2013-16)
SAdrianAmos(2019-22)
QBTimBoyle(2019-20)
WRRandallCobb(2011-18,21-22) (c/a)NathanielHackett(2019-21)
WRAllenLazard(2018-22)
OLAdamPankey(2017-18)
TBillyTurner(2019-21)
(c/a)KenFlajole(2003-08) (c/a)RickyManningJr.(2003-05)
(c/a)JoeCullen(2016-20) (c/a)SteveSpagnuolo(2013-14)
LBC.J.Mosley(2014-18)
(c/a)KenFlajole(2012)PThomasMorstead(2009-20)
QBBlaineGabbert(2018)
TEBlakeBell(2017-18) RBJerickMcKinnon(2014-17)
(c/a)KeithCarter(2018-22)
TETylerConklin(2018-21) RBDalvinCook(2017-22)
(c/a)ToddDowning(2018)
DLJalynHolmes(2018-20)
HOMETOWN CONNECTIONS
•ThestateofAlabama,specificallythecityof Mobile,willbewellrepresented onSunday.ItisthehometownofChiefs DTNeilFarrellJr. and WRKadarius Toney,alongwithJets DLBryceHuff and PThomasMorstead

• Chiefs DBChamarriConner willhavetwofellow Jacksonville,Florida, nativesonthesidelineinthisweek’smatchup:Jets SpecialTeamsAssistant LeonWashington andJets AssistantDefensiveLineCoachShaqWilson
•Chiefs LinebackersCoachBrendanDaly andJets GLakenTomlinson arebothfrom Chicago,Illinois

• FortWayne,Indiana,hasarepresentativeonbothteams,Chiefs LBDrue Tranquill andJets CJoeTippmann
•Chiefs TEBlakeBell andJets RBBreeceHall arebotharefromWichita, Kansas.
• Three players in Sunday’s game are from Detroit,Michigan, Chiefs DE MikeDanna,Chiefs CBNicJones and JetsCBSauceGardner.Jets Head CoachRobertSaleh isfrom Dearborn,Michigan,lessthan10mileswestof downtownDetroit.
•Chiefs OffensiveLineCoachAndyHeck andJets CConnorMcGovern arebothfromthecityof Fargo,NorthDekota.
•HailingfromtheLoneStarState,Chiefs DTKeondreCoburn and Jets P ThomasMorstead arebothfrom Houston,Texas.
Chiefs 4
KC TPrinceTegaWanogho 2015-19 NYJ DLCarlLawson 2013-16 NYJ LBJamienSherwood 2018-20 KC DEMikeDanna 2015-18 NYJ TETylerConklin 2014-17 KC DTDerrickNnadi 2014-17 NYJ RBDalvinCook 2014-16 KC SBryanCook 2019-21 NYJ CBSauceGardner 2019-21 KC TENoahGray 2017-20 NYJ CBMichaelCarterII 2017-20 KC DEMalikHerring 2017-20 NYJ (c/a)PatBastien 2016-17 NYJ WRMecoleHardmanJr. 2016-18 NYJ LBJermaineJohnson 2019-20 KC (c/a)RodWilson 2001-04 NYJ (c/a)AaronWhitecotton 2000-01 KC GNickAllegretti 2014-18 NYJSTonyAdams 2017-21 NYJCBJustinHardee 2012-16 KC (c/a)AndyHill 1996-19 NYJ (c/a)MackBrown 2012-14 NYJCConnorMcGovern 2011-15 SJustinReid(2018-21) WRRandallCobb(2020) KC SJustinReid 2015-17 NYJ DLSolomonThomas 2014-16 NYJ (c/a)NathanielWillingham 2015-18 KC PTommyTownsend 2015 NYJ (c/a)ZachAzzanni 2013-16
(c/a)MattNagy(2018-21) (c/a)RodWilson(2005-08) SAdrianAmos(2015-18) (c/a)RickyManningJr.(2006-07)
2019-22 NYJ WRXavierGipson 2018-22
KC DEBJThompson
2019-21
KC LBLeoChenal
NYJ CJoeTippmann 2019-22
• Jets OffensiveAssistantMackBrown is from Overland Park, Kansas, a Kansas City suburb only about 10 miles southwest of GEHA Field at ArrowheadStadium.
KC TDonovanSmith 2011-14 NYJSAdrianAmos 2011-13
KC CBJaylenWatson 2020-21 NYJ (c/a)MichaelGhobrial 2020 KC OLMikeCaliendo 2017-20 KC WRSkyyMoore 2019-21 NYJ LBZaireBarnes 2018-22 NYJ (c/a)BillyVandeMerkt 2017-19
WHAT TO WATCH FOR...
• HeadCoachAndyReid currentlysitsfifthinNFLhistoryforregularseason winswith249.WithawinversustheJetshewouldtiePFHOFcoachTom Landry(250)forfourthplaceall-timeonthelist.
• QBPatrickMahomes issecondinfranchisehistorywith1,650yardsrushing asaquarterback,trailingonlyAlexSmith(1,672).With23morerushingyards hewillbecomethefranchiseleaderinthatcategory.
• Since entering the NFL in 2017, Mahomes is tied for the second-most gameswithapasserratingof100+with47despiteplayingonlyonegamein 2017.HeistiedwithVikingsQBKirkCousinsforsecondonthelistandonly foursuchperformancesawayfrompassingBroncosQBRussellWilson(50) inthetopspot.
•With199careertouchdownpasses Mahomes isjustoneshyofthe200 mark.WithonepassingtouchdownagainsttheJets,hewillhavereachedthat markinjust84gameswhichwouldmakehimthefastestNFLquarterback to reach this mark, besting PFHOF QB Dan Marino’s previous record (89 games).
•With48touchdownconnections Mahomes and TETravisKelce currently sitfourthall-timeformostQB-TEtouchdownconnectionsinNFLhistory.With fourmoretheycanpassQBDrewBreesandTEJimmyGraham(51)forthird all-time.
• Kelce currentlyholdsthesecond-longestactivestreakofconsecutivegames playedwithapassreceptionat145.OnlyTitansWRDeAndreHopkinshas alongeractivestreakwith148. Kelce’s streakisalreadythelongestsuch streakinfranchisehistoryandthethird-longestinNFLhistoryforatightend, justsixgamesfrompassingPFHOFTEOzzieNewsome(150)forsecond.
•With74careertouchdownsscored, Kelce ranks third in franchise history. Withthreemoretouchdowns, Kelce willsurpassPFHOFTETonyGonzalez (76)forsecondplaceonthelist.
• Kelce has scored 454 career points. That is third among non-kickers in Chiefshistory(seventhoverall).With9morepointshewillpassGonzalez (462)forsecondmostpointsasanon-kicker(andsixthoverall).
• WRMarquezValdes-Scantling is close to hitting two career yardage milestones. With 2,986 career yards from scrimmage, he is just 14 yards shyof3,000.Heisalsojust62yardsshortof3,000careerreceivingyards currentlysittingat2,938.
• RBIsiahPacheco isnearingacareermilestoneinrushingyards.With985 careerrushingyardsheisjust15shyof1,000.
•With37consecutivestartssincebeingdraftedin2021 CCreedHumphrey istiedwithSGregWesleyforfifth-mostconsecutivestartstobeginacareer inChiefshistory.WithastartagainsttheJets,hewillclaimsolepossessionof fifthplaceandbejustfourgamesfrompassingDETambaHali(41)forfourth.
• CBL’JariusSneed has6.5careersacks,whichistiedforsecond-mostby adefensivebackinChiefshistory.WithtwomoresackshecanpassCBRon Parker(8)forthetopspotonthatlist.
CHIEFS ASSISTANT COACHES
OFFENSIVE STAFF
Matt Nagy
Offensive Coordinator
Joe Bleymaier
Pass Game Coordinator
Connor Embree Wide Receivers
David Girardi Quarterbacks
Andy HeckOffensive Line
Tom Melvin Tight Ends
Todd Pinkston Running Backs
Porter Ellett Assistant Running Backs
Corey Matthaei Assistant Offensive Line
Dan Williams Offensive Quality Control/Asst. Quarterbacks
Kevin Saxton Offensive Assistant
DEFENSIVE STAFF
Steve Spagnuolo
Defensive Coordinator
Joe Cullen Defensive Line
Donald D’Alesio Safeties
Brendan DalyLinebackers
Ken Flajole
Outside Linebackers
Dave Merritt Defensive Backs
Terry Bradden
Assistant Defensive Line
Alex WhittinghamDefensive Quality Control
Rod Wilson Defensive Assistant
SPECIAL TEAMS STAFF
Dave Toub
Assistant Head Coach/Special Teams Coordinator
Andy Hill
Assistant Special Teams
MISCELLANEOUS
Ryan Reynolds
Head Strength & Conditioning/Director of Sports Science
Greg Carbin
Assistant Strength and Conditioning
Nick Cassetta
Assistant Strength and Conditioning
Spencer Reid
Assistant Strength and Conditioning
Mike Frazier
Statistical Analysis Coordinator
Chiefs 5
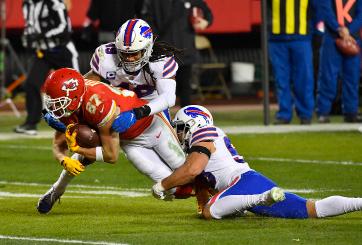
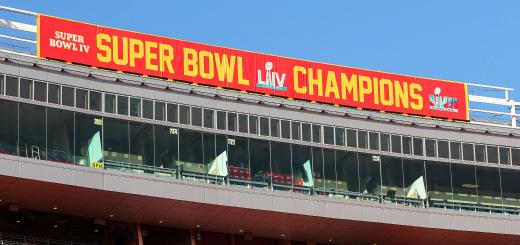
CHIEFSSECUREFRANCHISE’STHIRDLOMBARDITROPHY: Withthe 38-35victoryinSuperBowlLVII,theKansasCityChiefscapturedthefranchise’sthirdVinceLombardiTrophy(IV,LIVandLVII)anditssecondofthe pastfourseasons.TheChiefsbecomeoneof10NFLteamswiththreeor moreSuperBowlchampionships.
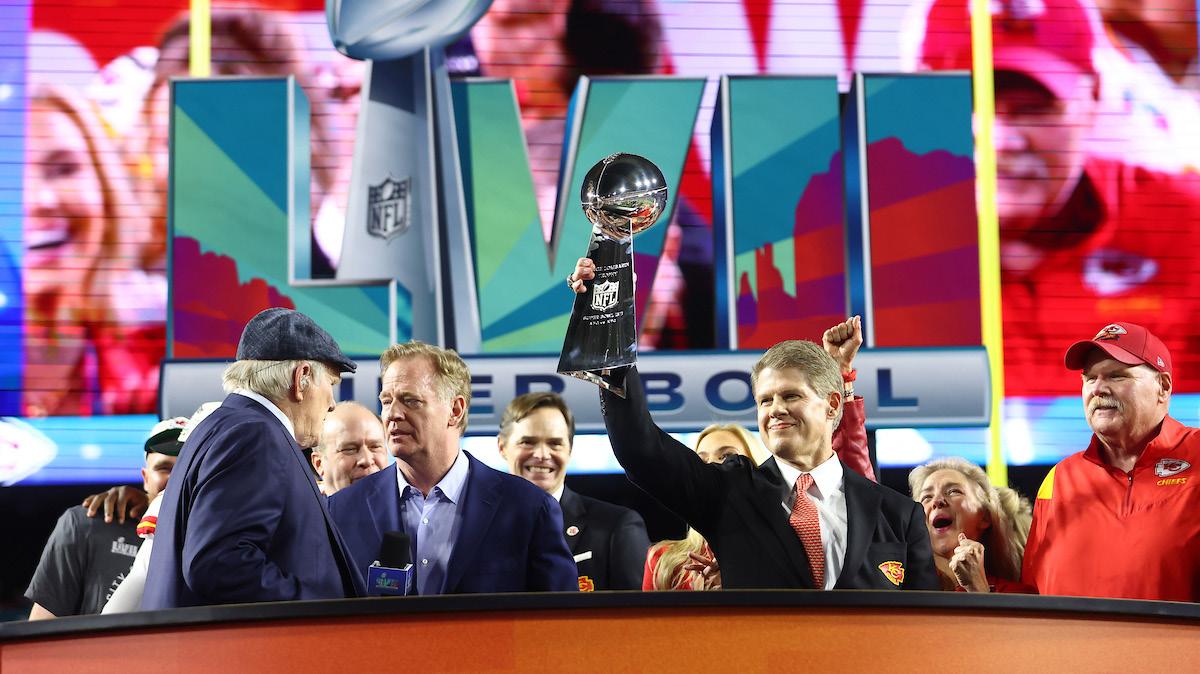
REIDJOINSELITEGROUPOFCHAMPIONSHIPCOACHES: With the 38-35victoryovertheEagles,HeadCoachAndyReidjoinsanexclusive fraternityofheadcoacheswhohaveledtheirteamstomultipleSuperBowl wins.Reidbecomesthe14thcoachtoaccomplishthisfeatandisoneof twowhoarestillactivelycoaching,joiningNewEngland’sBillBelichick.His twoSuperBowlchampionshipsaretiedforthefifth-mostinNFLhistory.
NFLRECORDBOOK MOSTSUPERBOWLCHAMPIONSHIPS,HEADCOACH
1. 6 BillBelichick
2. 4 ChuckNoll
3t. 3
BillWalsh JoeGibbs
5t. 2 VinceLombardi
TomFlores
JimmyJohnson
GeorgeSeifert
MikeShanahan
TomCoughlin
BillParcells
TomLandry
DonShula
AndyReid
Thevictorymarkedthe12thpostseasonwinforAndyReidasheadcoach oftheKansasCityChiefs(2013-22),extendinghisfranchiserecord.With 10postseasonvictoriesastheheadcoachofthePhiladelphiaEaglesfrom 1999-2012,heistheonlyheadcoachinNFLhistorytohave10ormore postseason wins with two different franchises. His 22 total postseason winsarethesecond-mostpostseasonwinsinNFLhistory,trailingonlyBill Belichick’sNFLrecordof31playoffwins.
CHIEFSRECORDBOOK
MOSTPOSEASONWINS,HEADCOACH
1. 12 AndyReid 2013-22
2. 5 HankStram 1960-74
3. 3 MartySchottenheimer 1989-98
NFLRECORDBOOK
MOSTPOSTSEASONWINS,HEADCOACH
1. 31 BillBelichick 1991-22
2. 22 AndyReid
3. 20 TomLandry
4. 19 DonShula
5. 17 JoeGibbs 1981-07
ThegamemarkedReid’s38thcareerpostseasongameasanNFLhead coach. He sits in second place for most career games as an NFLhead coach,trailingonlyBillBelichick’s44postseasongamesasanNFLhead coach.
NFLRECORDBOOK
MOSTPOSTSEASONAPPEARANCES,HEADCOACH
1. 44 BillBelichick
2. 38 AndyReid
3t. 36 TomLandry DonShula
5t. 24 JoeGibbs ChuckNoll MikeHolmgren
KELCEANDWINCHESTERSETNEWPOSTSEASONAPPEARANCE RECORD: WithappearancesintheAFCChampionshipGamevs.Cincinnati,TETravisKelceandLSJamesWinchesterbothrecordedtheir18th postseason game in a Chiefs uniform, extending their franchise record. K Harrison Butker and DTChris Jones each appeared in their 15th career postseasongamewiththeChiefs,movingintoatieforthethird-mostpostseasonappearancesinteamannals.QBPatrickMahomesandDTDerrick Nnadieachappearedintheir14thcareerpostseasongamefortheclub, tyingforsixth-mostinfranchisehistory.
Chiefs 6
CHIEFS WIN SUPER BOWL LVII
1999-22
1960-88
1963-95
CHIEFSRECORDBOOK
MAHOMESSECURESSECONDMOSTVALUABLEPLAYERAWARD: QBPatrickMahomescompleted21of27passesfor182yardswiththree touchdownsandnointerceptions,goodfora131.8passerrating.HisperformanceearnedhimhissecondcareerPeteRozelleTrophyastheSuper Bowl’sMostValuablePlayer.Itmarkedhis10thcareerpostseasongame witha100.0+passerrating,tyingforthird-mostinNFLhistory.His131.8 passerratingisthethird-bestsingle-gamemarkinclubpostseasonhistory. Withhisthreetouchdownpasses,henowowns35careerpostseasonpassingtouchdowns,eighth-mostinNFLhistory.Histhreepassingtouchdowns tieforthefourth-mostinasinglepostseasongameinfranchisehistory.His 77.8completionpercentageranksasthehighestcompletionpercentagein apostseasongameinteamhistory.
NFLRECORDBOOK
MOSTGAMESWITH100.0+PASSERRATING,POSTSEASON
NFLRECORDBOOK
MOSTQB-TETOUCHDOWNCONNECTIONS,POSTSEASON
1. 15 TomBrady–RobGronkowski
2. 14 PatrickMahomes–TravisKelce
3. 12 JoeMontana–JerryRice
4. 10 BrettFavre–AntonioFreeman
KELCEEXTENDSRECEPTIONSTREAK: With six receptions in the game,TETravis Kelce recorded his 18th consecutive postseason game withthreeormorereceptions,accomplishingthefeatineverypostseason gameofhiscareer.Hisstreakof18gameswiththreeormorereceptions sitsasanNFLpostseasonrecord.Hefinishedthegamewith81yardsand onetouchdownonthesixcatches.
NFLRECORDBOOK
MOSTCONSECUTIVEPOSTSEASONGAMES,3ORMOREPASSRECEPTIONS
1. 18 TravisKelce Jan.9,2016–Jan.29,2023
2. 16 JerryRice Dec.29,1985–Jan.7,1995
3. 14 JulianEdelman Jan.11,2014–Jan.4,2020
4t. 12 WesWelker Jan.12,2008–Feb.2,2014 JayNovacek Jan.5,1992–Jan.28,1996
KELCEFINDSPAYDIRT,MOVESUPNFLTOUCHDOWNCHARTS: With an18-yardtouchdownreceptioninthegame,TETravisKelcenowowns 16 career touchdown catches, extending his postseason franchise record forreceivingtouchdowns.HehaspassedTERobGronkowski(15)forthe mosttouchdowncatchesbyatightendinNFLpostseasonhistoryandis nowinsolepossessionofthesecond-mosttouchdownreceptionsbyany passcatcherinpostseasonhistory,trailingonlyPFHOFWRJerryRice’s22 touchdownreceptions.
NFLRECORDBOOK
MOSTTOUCHDOWNPASSES,POSTSEASON,CAREER 1. 88
8. 35 PatrickMahomes
9. 32 DanMarino
10. 31 KurtWarner
CHIEFSRECORDBOOK
HIGHESTCOMPLETIONPERCENTAGE,POSTSEASON,GAME(MIN. 15COMP.)
1. 77.8
2. 77.3 AlexSmithvs.Houston Jan.9,2016
3. 76.9
4. 76.3
5. 75.0
PatrickMahomesvs.Pittsburgh Jan.16,2022
PatrickMahomesvs.Buffalo
Jan.24,2021
PatrickMahomesvs.Buffalo Jan.23,2022
MAHOMESANDKELCECOMBINEFORANOTHERSCORE: QB PatrickMahomesfoundTETravisKelceforan18-yardtouchdowntogetthe ChiefsontheboardinSuperBowlLVII.Thepitch-and-catchmarkedthe 14thtouchdownconnectionbetweenthepair.Thetwositinsecondplace behind only QB Tom Brady and TE Rob Gronkowski, who own 15 total touchdownconnections.
MOSTRECEIVINGTOUCHDOWNS,POSTSEASON,CAREER
The first-quarter touchdown reception marked Kelce’s fourth of the 2022 postseason. His four trips to the endzone this postseason tie him for the second-mosttouchdownreceptionsbyatightendinasinglepostseason inNFLhistory.Hetieshisownmarkoffourfromthe2019postseasonas wellasVernonDavis’sfourfromthe2011postseason.Healsohadthree postseasontouchdownreceptionsin2020and2021.
Chiefs 7
MOSTGAMESPLAYED,POSTSEASON,CAREER(ALL10+) 1t. 18 TravisKelce 2013-22 JamesWinchester 2015-22 3t. 15 DanielSorensen 2014-21 HarrisonButker 2017-22 ChrisJones 2016-22 6t. 14 PatrickMahomes 2017-22 DerrickNnadi 2018-22 8t. 13 TyreekHill 2016-21 DemarcusRobinson 2016-21 AnthonySherman 2013-20
1. 19 TomBrady 2000-22 2. 12 JoeMontana 1979-94 3t. 10 AaronRodgers 2005-22 PatrickMahomes 2017-22 5t. 9 BrettFavre 1991-10 RussellWilson 2012-22
1. 138.2 PatrickMahomesvs.Pittsburgh Jan.16,2022 2. 134.6 PatrickMahomesvs.Houston Jan.12,2020
131.8 PatrickMahomesvs.Philadelphia Feb.12,2023 4. 127.6 PatrickMahomesvs.Buffalo Jan.24,2021 5. 124.8 LenDawsonatBuffalo Jan.1,1967
CHIEFSRECORDBOOK HIGHESTPASSERRATING,GAME,POSTSEASON
3.
TomBrady
JoeMontana AaronRodgers
BrettFavre 5.
PeytonManning 6.
DrewBrees 7.
BenRoethlisberger
2t. 45
4. 44
40
37
36
PatrickMahomesvs.Philadelphia Feb.12,2023
1. 16 TravisKelce(18games) 2013-22 2. 5 TyreekHill(13games) 2016-21 3. 4 DamienWilliams(5games) 2018-19 4. 3 ByronPringle(9games) 2018-21 5t. 2 OtisTaylor(7games) 1965-75 FredJones(3games) 1990-93 J.J.Birden(8games) 1990-94 TonyGonzalez(3games) 1997-08 AlbertWilson(3games) 2014-16 MarquezValdes-Scantling(3games) 2022
MOSTTOUCHDOWNS,POSTSEASON,CAREER,TIGHTEND 1. 16 TravisKelce KansasCity 2. 15 RobGronkowski NewEngland/TampaBay 3t. 7 VernonDavis SanFrancisco/Denver DaveCasper Houston/Oakland 5t. 6 KeithJackson Philadelphia/Miami/GreenBay JayNovacek Dallas NFLRECORDBOOK
CHIEFSRECORDBOOK MOSTRECEIVINGTOUCHDOWNS,POSTSEASON,CAREER
NFLRECORDBOOK
1.
JerryRice 1985-04 2.
TravisKelce 2013-22 3.
RobGronkowski 2010-21 4..
JohnStallworth 1974-87 5t.
FredBiletnikoff 1965-78 LarryFitzgerald 2004-20 AntonioFreeman 1995-03 RandyMoss 1998-12 HinesWard 1998-11
22
16
15
12
10
SUPER BOWL LVII GAME NOTES: CHIEFS 38 - EAGLES 35
PACHECOFINDSPAYDIRT: Rookie RB Isiah Pacheco recorded a oneyard touchdown run to open the game’s second half. It marked the first postseasontouchdownofhiscareer.Pachecofinishedthegamewith15 carriesfor76yardswiththeone-yardtouchdown.
SAUNDERSDROPSHURTS: DTKhalenSaundersrecordedaone-yard sackofEaglesQBJalenHurtsinthegame’sthirdquarter.Thisishisfirst careerpostseasonsack,andhenowowns5.5sacksonhiscareer(regular seasonandpostseason).Saundersfinishedtonight’sgamewithtwotackles(onesolo)andonesack.
TONEYHAULSINTOUCHDOWNCATCH: WRKadariusToneycaughta five-yardtouchdownpassfromQBPatrickMahomesinthefourthquarterof thegame.ItmarksToney’sfirst-careerpostseasontouchdown.Hefinished thegamewithonecatchforfiveyardsandatouchdown.
MOOREGRABSFIRSTTOUCHDOWN: RookieWRSkyyMoorerecorded afour-yardtouchdowninthefourthquarterofthegame.Itmarkedhisfirst receivingtouchdownoftheyear,regularseasonorpostseason.Moorefinishedthegamewiththeonetouchdowncatchforfouryards.
BOLTONSCOOPSANDSCORES: LB Nick Bolton recovered a fumble of Eagles QB Jalen Hurts and returned it for a 36-yard touchdown.This isBolton’sfirst-careerpostseasontouchdownandhissecondpostseason fumblerecovery,withbothcominginthe2022playoffs.Withonefumblerecoveryforatouchdownintheregularseason(86yardsatDenver,1/8/22), henowownsthreetotalfumblerecoverieswithtwoofthemgoingfortouchdowns.Itmarkedtheclub’sdefensivetouchdowninapostseasongame. Boltonfinishedtonight’sgamewithagame-highninetackles(eightsolo) andtheonefumblerecoveryforatouchdown.
CHENALRECORDSSACK: RookieLBLeoChenalwascreditedwitha one-yard sack of Philadelphia QB Jalen Hurts, recording his first-career postseasonsack.Hefinishedthegamewithsixtackles(foursolo),includingonetackleforloss,togowiththesack.
BUTKERMOVESUPPOSTSEASONPOINTSCHART: KHarrisonButker scoredeightpointsintonight’sgameononefieldgoalandfivePATs.He nowowns117careerpostseasonpoints,movinginto10thplaceinNFLhistoryformostpostseasonpointsbyanyplayerinNFLhistory.His117points aretheseventh-mostbyakickerinNFLpostseasonhistory.
NFLRECORDBOOK
MOSTPOINTS,POSTSEASON,CAREER(ALLPLAYERSWITH100+
BY THE NUMBERS
5 Super Bowl Appearances
9 AFL/AFC Championship Appearances
13 AFC West Championships
523
Regular Season Franchise Wins
13 Pro Football Hall of Famers
52 Chiefs Hall of Famers (Includes D. Hall)
241
Number of Chiefs wins vs. AFC West opponents, the most of any other AFC West team in intradivision affairs (reg. and postseason combined)
10 Retired Chiefs numbers
64
The club is in its 64th season of existence
82,893 Largest crowd (regular season)
142.2
level at GEHA Field atArrowhead
271 Games won by Head Coach Andy Reid
25.2
Average Age of the Current Chiefs Roster
5
Walter Payton Man of the Year Recipients
52 Seasons at GEHA Field at Arrowhead Stadium
Chiefs 8
MOSTTOUCHDOWNRECEPTIONS,SEASON,POSTSEASON 1. 5 DaveCasper 1977 2t. 4 TravisKelce 2022 TravisKelce 2019 VernonDavis 2011 5t. 3 TravisKelce 2020 TravisKelce 2021 BrentCelek 2008 JimmyGraham 2011 RobGronkowski 2017 RobGronkowski 2011 RobGronkowski 2015 RobGronkowski 2014 BrentJones 1989 SteveJunker 1957 DustinKeller 2009 DennisPitta 2012 DaltonSchultz 2022
NFLRECORDBOOK
238 AdamVinatieri 1996-19 2. 212 StephenGostkowski 2006-20 3. 175 DavidAkers 1998-13 4.
MasonCrosby 2007-22
153 GaryAnderson 1982-04 6. 132 JerryRice 1985-04 7t. 126 EmmittSmith 1990-04 ThurmanThomas 1988-00 RobbieGould 2005-22 10. 117 HarrisonButker 2017-22
POINTS) 1.
163
5.
Decibel
CHIEFS 2023 SCHEDULE

PRESEASONSCHEDULE
REGULARSEASONSCHEDULE
Chiefs 9
ALL-TIME
OPPONENTS OVERALL(REG.SEASON) Team Record Pct. LongestWinStreak Denver 71-54-0 .568 15(2015-Current) LAChargers 67-57-1 .540 9(2014-2018) LasVegas 70-53-2 .568 9(2003-2007) ATHOME(REG.SEASON) Team Record Pct. LongestWinStreak Denver 43-19-0 .694 14(1960-1973) LAChargers 37-26-0 .587 7(1997-2003) LasVegas 37-25-1 .595 10(1989-1998) ONTHEROAD(REG.SEASON) Team Record Pct. LongestWinStreak Denver 28-35-0 .444 8(2015-Current) LAChargers 30-31-1 .492 9(2014-Current) LasVegas 33-28-1 .540 7(2003-2009) Team W L Pct. PF PA Streak KansasCityChiefs 2 1 .667 78 40 Won2 LasVegasRaiders 1 2 .333 45 77 Lost2 LosAngelesChargers 1 2 .333 86 87 Won1 DenverBroncos 0 3 .000 69 122 Lost3 2023 AFC WEST STANDINGS
SCHEDULE PRESEASONSCHEDULE Date Opponent Time Results Saturday,Aug.13 atChicagoBears 12:00p.m. L,14-19 Saturday,Aug.20 WashingtonCommanders 3:00p.m. W,24-14 Thursday,Aug.25 GreenBayPackers 7:00p.m. W,17-10 REGULARSEASONSCHEDULE Date Opponent Time Result Sunday,Sept.11 atArizonaCardinals 3:25p.m. W,44-21 Thursday,Sept.15 LosAngelesChargers 7:15p.m. W,27-24 Sunday,Sept.25 atIndianapolisColts 12:00p.m. L,17-20 Sunday,Oct.2 atTampaBayBuccaneers 7:20p.m. W,41-31 Monday,Oct.10 LasVegasRaiders 7:15p.m. W,30-29 Sunday,Oct.16 BuffaloBills 3:25p.m. L,20-24 Sunday,Oct.23 atSanFrancisco49ers 3:25p.m. W,44-23 Sunday,Oct.30 BYEWEEK -------- ---Sunday,Nov.6 TennesseeTitans 7:20p.m. W,20-17 Sunday,Nov.13 JacksonvilleJaguars 12:00p.m. W,27-17 Sunday,Nov.20 atLosAngelesChargers 7:20p.m. W,30-27 Sunday,Nov.27 LosAngelesRams 3:25p.m. W,26-10 Sunday,Dec.4 atCincinnatiBengals 3:25p.m. L,24-27 Sunday,Dec.11 atDenverBroncos 3:05p.m. W,34-28 Sunday,Dec.18 atHoustonTexans 12:00p.m. W,30-24 Saturday,Dec.24 SeattleSeahawks 12:00p.m. W,24-10 Sunday,Jan.1 DenverBroncos 12:00p.m. W,27-24 Saturday,Jan.7 atLasVegasRaiders 3:30p.m. W,31-13 Saturday,Jan.21 JacksonvilleJaguars(DIV) 3:30p.m. W,27-20 Sunday,Jan.29 CincinnatiBengals(AFC) 5:30p.m. W,23-20 Sunday,Feb.12 PhiladelphiaEagles(SB) 5:30p.m. W,38-35
CHIEFS
VS. AFC WEST
CHIEFS 2022
Date Opponent Time Results Sunday,Aug.13 atNewOrleansSaints 12:00p.m. L,24-26 Saturday,Aug.19 atArizonaCardinals 7:00p.m. W,38-10 Saturday,Aug.26 ClevelandBrowns 12:00p.m. W,33-32
Date Opponent Time Result Thursday,Sept.7 DetroitLions 7:20p.m. L,20-21 Sunday,Sept.17 atJacksonvilleJaguars 12:00p.m. W,17-9 Sunday,Sept.24 ChicagoBears 3:25p.m. W,41-10 Sunday,Oct.1 atNewYorkJets 7:20p.m. Sunday,Oct.8 atMinnesotaVikings 3:25p.m. Thursday,Oct.12 DenverBroncos 7:15p.m. Sunday,Oct.22 LosAngelesChargers 3:25p.m. Sunday,Oct.29 atDenverBroncos 3:25p.m. Sunday,Nov.5 MiamiDolphins(Germany)8:30a.m. Sunday,Nov.12 BYEWEEK ------ -----Monday,Nov.20 PhiladelphiaEagles 7:15p.m. Sunday,Nov.26 atLasVegasRaiders 3:25p.m. Sunday,Dec.3 atGreenBayPackers 7:20p.m. Sunday,Dec.10 BuffaloBills 3:25p.m. Monday,Dec.18 atNewEnglandPatriots 7:15p.m. Monday,Dec.25 LasVegasRaiders 12:00p.m. Sunday,Dec.31 CincinnatiBengals 3:25p.m. Sat/Sun Jan.6/7 atLosAngelesChargers TBD
times CT*
*All
2023 CHIEFS OFFENSIVE RANKINGS
2023 CHIEFS DEFENSIVE RANKINGS
Chiefs 10
Category NFLRank Value 10-PlayDrives T-6th 7drives 1standGoalInside5Drives 2nd 7drives 1standGoalInside5Giveaways T-1st 0giveaways 3andOutPercentage 3rd 12.5% 3rdDownConversionPct. 8th 46.3% 3rdand10+ConversionPct. 6th 30.0% 3rdand>6YardConversionPct. 4th 37.5% 4thDownConversionPct. T-8th 66.7% 4thand1YardConversionPct. T-1st 100.0% 4thand<4YardConversionPct. T-1st 100.0% Avg.MarginofVictory 6th 19.50points 5-MinuteDrives T-7th 6drives Pointson1stOff.Poss.of2ndHalf T-4th 14points Completionsof20+Yards T-9th 10passes FieldGoalPercentage T-1st 100.0% Avg.StartingPosition-Home 9th 31.5yardline FirstDownsMade 9th 67firstdowns Goal-to-GoDrives T-2nd 10drives Goal-to-GoGiveaways T-1st 0giveaways Inside30TouchdownEfficiency 6th 56.3% KickoffTouchbackPercentage T-1st 100.0% NetPassingYardsperGame 5th 275.7yards OffensivePointsScored 6th 78points ScoringEfficiency 10th 43.8% Opp.FumbleReturnsof20+Yards T-1st 0returns YardsPerGame 5th 390.3yards PassingFirstDownsMade T-8th 38firstdowns YardsAftertheCatch 2nd 291yards Playsof10+Yards 2nd 47plays Playsof20+Yards T-8th 11plays PointsonPoss.AfterTakeaways T-10th 10points PuntReturnsof20+Yards T-2nd 1return ScoringDrives<4Plays T-5th 7drives RedZone3rdDownConversionPct. T-2nd 71.4% RedZoneDrives T-6th 12drives RedZoneGiveaways T-1st 0giveaways RedZoneTouchdownEfficiency T-3rd 75.0% RedZoneSuccessfulPlayPct. 3rd 58.3% Non-KneelRushesforNegativeYards T-6th 3rushes RushingPlaysof10+Yards T-4th 13rushes Avg.RushingYardsPerGame 10th 114.7yards TotalPointsScored 9th 78points ScoringDifferential 6th +38points PointsScoredatEndofHalf 2nd 27points OffensiveTouchdownsScored T-3rd 9touchdowns DrivesStartInsideOwn20-YdLine T-2nd 10drives SuccessfulPlayPercentage 10th 50.0% TimeofPossession 7th 31:48 TimesSacked T-1st 1sack PointsPerGame 9th 26.0points TouchdwnDrives T-3rd 9drives PointsScoredinTwo-MinuteOffense 3rd 10points YardsPerGame 5th 390.3yards YardsPerPlay 5th 5.83yards YardsPerPlayInside30 6th 3.97yards YardsPerPlayinRedZone 6th 3.42yards Category NFLRank Value Avg.MarginofDefeat T-1st 1.00yard Opp.PasserRatinginBlitzSituations 6th 65.10rating PointsonOpp.1stPoss.of2ndHalf T-1st 0points PointsonOpp.1stOff.Possession T-1st 0points OpponentPossessions T-8th 32possessions FumbleRecoveries T-5th 3recoveries Opp.OffensivePointsAllowed 3rd 33points Opp.PuntReturnsof20+Yards T-1st 0returns Opp.OffensiveTouchdowns T-3rd 3touchdowns Opp.1standGoalInside5TDEff. T-1st 0.0% Opp.2ndDownConversionPct. 10th 29.0% Opp.3rdDownConversionPct. T-5th 30.8% Opp.3rdand10+ConversionPct. T-10th 11.1% Opp.3rdand>6YdConversionPct. T-3rd 7.1% Opp.4thand>6YardConversionPct. T-1st 0.0% Opp.Completionsof20+Yards T-10th 7completions Opp.GoaltoGoScoringEfficiency 1st 0.0% Opp.Inside30ScoringEfficiency T-7th 33.3% Opp.RedZoneScoringEfficiency T-5th 37.5% Opp.RushingPlaysof10+Yards T-8th 6rushes Opp.RushingPlaysof20+Yards T-1st 0rushes Opp.RushingPlaysof50+Yards T-1st 0rushes Opp.ScoringOutsideRedZone T-1st 3points Opp.TotalYardsPerDown 5th 4.55yards Opp.10PlayDrives T-6th 5drives Opp.1standGoalInside5Drives T-1st 1drive Opp.3andOutDrivePct. T-7th 25.0% Opp.3rdDownConversionPct. T-5th 30.8% Opp.4thDownConversionPct. 4th 28.6% Opp.TotalFirstDownsAllowed 4th 48firstdowns Opp.GoaltoGoDrives T-2nd 2drives Opp.NetPassingYards 6th 178.0yards Opp.Playsof10+Yards T-3rd 26plays Opp.Playsof20+Yards T-2nd 7plays Opp.ScoringDrivesof<4Plays T-1st 0points Opp.TurnoverPct.<4Plays T-6th 9.4% Opp.RedZoneDrives T-7th 8drives Opp.RushesandCompletions 8th 44.7% Opp.TotalPointsScored 4th 40points Opp.ScoringEfficiency 2nd 21.9% Opp.TimeofPossession 7th 28:12 Opp.TouchdownDrives T-3rd 3drives Opp.YardsPerGame 6th 280.7yards Opp.YardsPerPlay 5th 4.55yards Opp.PasserRating 7th 75.6rating Opp.PasserRatingon2ndDown 4th 60.7rating Opp.PassingFirstDownsAllowed T-7th 30firstdowns Opp.PointsScoredatEndofHalf T-3rd 3points Opp.RZSuccessfulPlaysAllowed 4th 31.3% RedZoneTakeaways T-4th 1takeaway TotalOpp.PointsAllowed 4th 40points
TheChiefsselectedsevenplayersinthe2023NFLDraft.
DEFelixAnudike-Uzomah was taken in the first round by the ChiefswiththeNo.31overallpick.Anudike-UzomahisaKansas City native and attended Kansas State University. There, he saw time in 32 games with 27 starts. He finished his Wildcat career tiedforsixthinschoolhistoryincareersacks(20.5),whilehetied forfourthincareerforcedfumbles(eight).Thismadehimthesecondplayerinschoolhistorytotallythreegameswith3.0ormore sacks(DLNyleWiren).Anudike-UzomahleftcollegefootballrankingfourthnationallyandtoppedtheBig12amongactiveplayersin forcedfumblespergame(0.25)
WRRasheeRice wasselectedbytheKansasCityChiefsinthe secondroundwiththe55thpickoverall.Riceplayedin44games andstarted33fortheSMUMustangs.Infouryears(2019-22),Rice hauledin233passesfor3,111yardsand25touchdowns.Heled theFBSinreceivingyardspergame(112.9)in2022.Rice’s1,355 receivingyards(third)and8.0receptionspergame(fifth)weretop fiveinthenationduringhissenioryear(2022).Also,in2022,he was13thnationallywith10receivingTDsandleftSMUholdingthe single-seasonreceivingyardsrecord(1,355yardsin2022).
OLWanyaMorris waspickedupinthethirdroundbyKansasCity with the 92nd overall pick. Morris spent the 2019-20 seasons at TennesseebeforetransferringtoOklahomafor2021-22seasons. Heplayedin37careergames(15atOklahoma)andmade27starts (eightatOU).WhileatTennesseein2020,heallowedtwosackson 195pass-blockingplaysaccordingtoPFFandwasflaggedforjust threepenaltieson398totalsnaps.Duringhistrue-freshmanyearat Tennesseein2019,hehelpedpavethewayforaseason-high297yardrushingperformanceagainstVanderbilt(11/30),helpedprotectJarrettGuarantanoatMissouriwhenthequarterbackbecame thethirdVolunteertoeverpassfor400yards(11/23)andstartedat lefttacklevs.GeorgiaState(8/31)tobecomefirstTennesseetrue freshmanoffensivelinemantostartinaseasonopenersince2017.
DBChamarriConner waspickedupinthefourthroundbyKansas Citywiththe119thoverallpick.Connerplayedin61games(started 57)infiveseasons(2018-22)forVirginiaTech.Herecorded314 tackles (207 solo), 21 tackles for loss (-110.0 yards), 7.5 sacks (-73.0 yards), four interceptions returned for 20 yards, 23 passes defensed,fourforcedfumblesandoneblock.Connerfinishedhis collegecareerranked10thall-timeatVTincareertackles.
DEBJThompson was picked up in the fifth round by Kansas Citywiththe166thoverallpick.ThompsontransferredtoStephen F.Austin,wherehehadtositoutduringthe2019seasondueto NCAArules.Herecorded20.0sacksinthreeseasons(2020-22) withtheLumberjacks.In2022,Thompsonwasafirst-teamAll-WAC selection,leadingtheteamwith5.0sacksalongwith25tackles, 6.5forlossandthreeforcedfumblesin11starts.HeoriginallycommittedtoBaylor,playingtwoseasonsthere(2017-18)andseeing actionin19games(threestarts).AsaBear,heaccumulated18 tackles,6.5TFLs,4.0sacks,threequaterbackpressures,onepass breakupandthreeblockedkicks.
DTKeondreCoburn was picked up in the sixth round by KansasCitywiththe194thoverallpick.Coburn,afive-yeardefensive linemanwhoplayedin51careergamesandstarted45timesat Texaswasnamedsecond-teamAll-Big12bytheleague’scoachesandtheAPin2022.Also,hewasa2022third-teamAll-Big12 PreseasonselectionbyAthlonSports.Hewasnamedpreseason fourth-teamAll-Big12byPhilSteelein2022. Addingon,hewas namedAll-Big12honorablementionin2020and2021.Afirst-team preseasonAll-TexasselectionbyDaveCampbell’sTexasFootball Magazinein2020.Furthermore,hemadetheAll-Big12Preseason selectionbyPhilSteelein2019and2020.
CBNicJones waspickedupintheseventhroundbyKansasCity withthe250thoverallpick.Jonesplayedin37gamesatBallState (2019-22) and notched 64 tackles (49 solo), one tackle for loss, threeinterceptionsreturnedfor12yards,22passesdefensedand twoblocks.Inaddition,hereturnedfivekicksfor94yards.In2019, hereceivedtheBallStateJohnHodgeAwardgiventotheteam’s mostoutstandingfreshman.
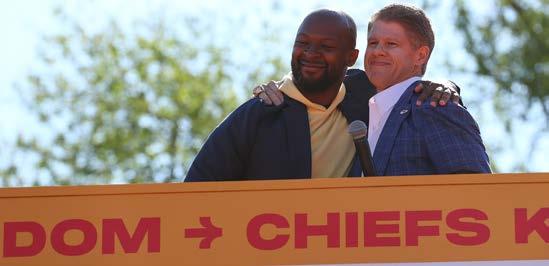
CHIEFS HALL OF FAME INDUCTEE - DANTE HALL
DanteHallspentsevenseasonswiththeKansasCityChiefs(2000-06), appearingin97games(10starts)whichistiedfortheseventhmostby awidereceiverinfranchisehistory.Hallwasnamedtotwo-straightPro Bowls andAll-Pro teams following the 2002-03 seasons, becoming the secondplayerinChiefshistorytogarneraProBowlselectionasareturn specialist.HallwasnamedAFCSpecialTeamsPlayeroftheWeekseven times,themostofanyplayerinChiefshistory.Hewasalsonamedfirstteam NFL2000sAll-DecadeTeam as a punt returner and second-team NFL2000sAll-DecadeTeamasakickreturner.
Hereturned360kicksfor8,644yardswithsixtouchdownsand188punts for1,882yardswithfivetouchdowns.His11totalreturntouchdownsare afranchisebest,andhesitsat–ornearthetop–ofvirtuallyeveryChiefs career,seasonandsingle-gamerecordlistasareturnspecialist.Hallaccumulated1,615receivingyardson145receptionswithninetouchdowns and215rushingyardson47attempts.His12,356combinedyardsranks firstinfranchisehistory.
“MyfamilyandIaredelightedtoannounceDanteasthisyear’sinductee intotheChiefsHallofFame,”ChiefsChairmanandCEOClarkHuntsaid. “It’snoteverydayyougettowitnessagenerationaltalentatthereturner position, but Chiefs Kingdom was blessed to witness Dante’s talent for sevenseasons.Hisquickness,agilityandpureathleticismasareturner andwidereceivercementedhimasoneofthefranchise’sgreats.Followinghisplayingcareer,DantejoinedtheKansasCityAmbassadorprogram andhasbeenanactiveparticipantinthebrand’sinternationalexpansion efforts.WearelookingforwardtocelebratingDante’sHallofFameinductionatGEHAFieldatArrowheadStadiumthisfall.”
NEW TO THE KINGDOM
Since the beginning of 2023, the Kansas City Chiefs signed a number of veteranplayerstobolstertheroster.
Pos. Name LastTeam HowAcquired
QB BlaineGabbert
TampaBay FA-23
DE CharlesOmenihu SanFrancisco FA-23
T DonovanSmith
LB DrueTranquill
T JawaanTaylor
S MikeEdwards
WR RichieJames
TampaBay FA-23
LAChargers FA-23
Jacksonville FA-23
TampaBay FA-23
NYGiants FA-23
Chiefs 11
2023 KANSAS CITY CHIEFS DRAFT CLASS
HEAD COACH ANDY REID NOTES
REID CAREER HIGHLIGHTS
• Career record of 249-139-1 in the regular season, as well as a 22-16 postseasonrecord.Reid’s271combinedwinsrankfifth-mostinNFLhistory andsecondamongactivecoachesinregularseasonandpostseasonwins. Hehasdefeatedall32NFLteamsasaheadcoach.His119reg.season winsinhisfirst11seasonswithKCaremorethananyotherheadcoach infranchisehistory(165games).Reidownsa.641regularseasonwinning percentageanda.636careerwinningpercentage.
• The Chiefs have won seven-straightAFC West titles (2016-22) for the first time in franchise history. Kansas City earned the No. 1 seed in the AFCinthe2018season,anddefeatedtheColtstoadvancetotheAFC Championshipgame. In2019,astheNo.2seed,theChiefsdefeatedthe Texans,51-31toadvanceandhosttheAFCtitlegameforthesecondyear in a row for the first time in franchise history. KC defeated the Titans to advancetoSuperBowlLIV.TheChiefsdefeatedthe49ersinSuperBowl LIVforReid’sfirstSuperBowlvictoryasaheadcoachandKC’sfirstSB victoryin50years.Onceagain,KCearnedthenumberoneseedin2020, finishing with a franchise-best 14-2 record. In 2021, the Chiefs defeated BuffalotoadvancetotheAFCChampionshipGame,withReidbecoming thefirsttocoachinfour-straighthomeAFCChampionshipGames.In2022, KCfinishedtheregularseason14-3,earningtheNo.1seed.KCdefeated theJacksonvilleJaguars,27-20toadvanceandhostanNFLrecordoffive straightAFCChampionshipGames.TheChiefsdefeatedtheBengals,2320 to advance to Super Bowl LVII where they defeated the Philadelphia Eagles,38-35.
•A12-4recordin2016earnedKCthenumbertwoseedandafirst-round byeintheplayoffs.ReidguidedKansasCitytoit’sfirstplayoffwinin22 yearsin2015.Theclubfinished11-5aftera1-5start,thegreatestturnaroundinasingleseasoninNFLhistory.The2013Chiefs,ledbyHead CoachAndy Reid, orchestrated the greatest single-season turnaround in franchise history after an 11-5 finish. In 2012, the team finished 2-14, a +9turnaroundinhisfirstseasonwiththeclub.DuringReid’s14seasons inPhiladelphia,histeamsmadethepostseasonninetimes,whichranked thirdintheNFLbehindIndianapolis’12andNewEngland’s10.
•Includinghistimeasanassistantcoach,Reid’steamshavenowmade24 playoffappearances,aswellassixSuperBowlappearancesafterplaying in a combined eight NFC Championships and fourAFC Championships. HewonSuperBowlXXXIasanassistantinGreenBayandSuperBowl
LIV, ans Super Bowl LVII as the head coach in Kansas City. Reid owns threeNFCtitles,twoAFCtitlesand16divisiontitlesinhiscareerdating backtohisdaysasanassistant.HementoredHallofFamequarterback BrettFavrewhilewiththePackersalongwithQBDonovanMcNabbwith
Chiefs Head CoachAndy Reid has made 20 first-round selections as a headcoachintheNFL.
Chiefs 12
Year Reg.Season Pct. Postseason Overall Result 1999 5-11 .313 0-0 5-11 5thinNFCEast 2000 11-5 .688 1-1 12-6 2ndinNFCEast;reacheddivisionalplayoffs 2001 11-5 .688 2-1 13-6 1stinNFCEast;reachedNFCChampionshipGame 2002 12-4 .750 1-1 13-5 1stinNFCEast;reachedNFCChampionshipGame 2003 12-4 .750 1-1 13-5 1stinNFCEast;reachedNFCChampionshipGame 2004 13-3 .813 2-1 15-4 1stinNFCEast;reachedSuperBowlXXXIX 2005 6-10 .375 0-0 6-10 4thinNFCEast 2006 10-6 .625 1-1 11-7 1stinNFCEast;reacheddivisionalplayoffs 2007 8-8 .500 0-0 8-8 4thinNFCEast 2008 9-6-1 .594 2-1 11-7-1 2ndinNFCEast;reachedNFCChampionshipGame 2009 11-5 .688 0-1 11-6 2ndinNFCEast;reachedwildcardround 2010 10-6 .625 0-1 10-7 1stinNFCEast;reachedwildcardround 2011 8-8 .500 0-0 8-8 2ndinNFCEast 2012 4-12 .250 0-0 4-12 4thinNFCEast 2013 11-5 .688 0-1 11-6 2ndinAFCWest;reachedwildcardround 2014 9-7 .563 0-0 9-7 2ndinAFCWest 2015 11-5 .688 1-1 12-6 2ndinAFCWest;reacheddivisionalplayoffs 2016 12-4 .750 0-1 12-5 1stinAFCWest;reacheddivisionalplayoffs 2017 10-6 .625 0-1 10-7 1stinAFCWest;reachedwildcardround 2018 12-4 .750 1-1 13-5 1stinAFCWest;reachedAFCChampionshipGame 2019 12-4 .750 3-0 15-4 1stinAFCWest;SuperBowlLIVChampions 2020 14-2 .875 2-1 16-3 1stinAFCWest;ReachedSuperBowlLV 2021 12-5 .706 2-1 14-6 1stinAFCWest;ReachedAFCChampionshipGame 2022 14-3 .824 3-0 17-3 1stinAFCWest;SuperBowlLVIIChampions 2023 2-1 .667 0-0 2-1 TBD TOTALS 249-139-1 .641 22-16 271-155-1 18PlayoffBerths,13Div.Titles,1NFCTitle,3AFCTitles,2SBs
ANDY REID’S HEAD COACHING RECORD
Yr. No.(Overall) Selection(School) 1999 2 QBDonovanMcNabb(Syracuse) 2000 6 DTCoreySimon(FloridaState) 2001 25 WRFreddieMitchell(UCLA) 2002 26 CBLitoSheppard(Florida) 2003 15 DEJeromeMcDougle(Miami) 2004 16 TShawnAndrews(Arkansas) 2005 31 DTMikePatterson(SouthernCalifornia) 2006 14 DTBrodrickBunkley(FloridaState) 2007 -- NoFirst-RoundSelection 2008 -- NoFirst-RoundSelection 2009 19 WRJeremyMaclin(Missouri) 2010 13 DEBrandonGraham(Michigan) 2011 21 GDannyWatkins(Baylor) 2012 12 DTFletcherCox(MississippiState) 2013(KC) 1 TEricFisher(CentralMichigan) 2014 23 LBDeeFord(Auburn) 2015 18 CBMarcusPeters(Washington) 2016 -- NoFirst-RoundSelection 2017 10 QBPatrickMahomes(TexasTech) 2018 -- NoFirst-RoundSelection 2019 -- NoFirst-RoundSelection 2020 32 RBClydeEdwards-Helaire(LSU) 2021 -- NoFirst-RoundSelection 2022 21 TrentMcDuffie(Washington) 2022 30 GeorgeKarlaftis(Purdue) 2023 31 FelixAnudike-Uzomah(KansasState)
REID VIA THE NFL DRAFT - HIS 1ST ROUND PICKS
REID AS A HEAD COACH VS. THE NFL
BelowisChiefsHeadCoachAndyReid’srecordagainsttheNFLasahead coach.Heis249-139-1intheregularseason,aswellas22-16inthepostseason.Reidhas 271totalcareerwinsasaheadcoach.
MOST OVERALL WINS; ACTIVE NFL HEAD COACHES
AndyReidisoneoffiveactiveNFLheadcoacheswithover150victories. Hehas271overallwinsandisoneoffiveactivecoacheswith10ormore postseasonvictories(JohnHarbaughhas11).
ReiddefeatedtheTennesseeTitansin2013,givinghimwinsagainstall32 NFLteams.HebecameonlythesixthheadcoachinNFLhistorytoaccomplishthatfeat.Belowisalookatallthecoacheswhohavedoneit.
THE BEST IN CHIEFS HISTORY
Entering his 11th season as head coach in Kansas City,Andy Reid is the club’ssecond-longesttenuredheadcoachtrailingonlyProFootballHallof FameCoachHankStram(15years).Reid’s.721regularseasonwinpercentage is the top mark in franchise history. InReid’s165regularseason gameswiththeChiefs,hehasregistereda62-21(74.7%)recordasthe hometeamanda57-25(69.5%)recordastheroadteam.
HIGHESTREGULARSEASONWINPERCENTAGE
Name CareerRec. Pct. Years
1. Reid 119-46-0 .721 2013-Present
2. Schottenheimer 101-58-1 .634 1989-98
3. Stram 124-76-10 .614 1960-74
4. Vermeil 44-36-0 .550 2001-05
AmongstactiveNFLheadcoacheswiththeircurrentteam,Reidisthefifthlongesttenuredcoach.Amongstthosefive,Reid’s72.1%regularseason winpercentagewiththeChiefsputshimatfirstamongthelongest-tenured coachesbestingNE’sBillBelichick(70.5%withNE)andaheadofPIT’s MikeTomlin(63.6%).Reid-whoistheall-timewinningestheadcoachin PhiladelphiaEagleshistory-isoneofonlyfourcoachestorankinthetop two in all-time wins for two different NFL franchises (Dan Reeves, Tom Coughlin,TonyDungy).
LONGESTTENUREDACTIVECOACHESREG.SEASONWINPCT.
Chiefs 13
Name. Pct. Years 1. AndyReid 72.1% 11-KC 2. BillBelichick 70.5% 24-NE 3. MikeTomlin 63.6% 17-PIT 4. PeteCarroll 61.3% 14-SEA 5. JohnHarbaugh 60.8% 16-BAL
Rk, Coach Reg. Post Total 1. BillBelichick,NE/CLE 299 31 330 2. AndyReid,KC/PHI 249 22 271 3. PeteCarroll,SEA/NYJ/NE 163 11 174 4. MikeTomlin,PIT 165 8 173 5. MikeMcCarthyGB/DAL 157 11 168
BillBelichick(NE) TonyDungy(Retired) MikeShanahan(Retired) BillParcells(Retired) AndyReid(KC) JohnFox(Retired)
Opponent Reg.Season Postseason Total vs.DenverBroncos 16-6 0-0 16-6 vs.KansasCityChiefs 3-0 0-0 3-0 vs.LasVegasRaiders 18-5 0-0 18-5 vs.LosAngelesChargers 17-6 0-0 17-6 vs.AFCWest 54-17 0-0 54-17 vs.BaltimoreRavens 6-2 0-0 6-2 vs.CincinnatiBengals 2-5-1 1-1 3-6-1 vs.ClevelandBrowns 8-0 1-0 9-0 vs.PittsburghSteelers 5-5 1-1 6-6 vs.AFCNorth 21-12-1 3-2 24-14-1 vs.HoustonTexans 8-2 2-0 10-2 vs.IndianapolisColts 2-6 1-1 3-7 vs.JacksonvilleJaguars 7-2 1-0 8-2 vs.TennesseeTitans 2-8 1-1 3-9 vs.AFCSouth 19-18 5-2 24-20 vs.BuffaloBills 6-5 2-0 8-5 vs.MiamiDolphins 6-1 0-0 6-1 vs.NewEnglandPatriots 5-4 0-3 5-7 vs.NewYorkJets 6-1 0-0 6-1 vs.AFCEast 23-11 2-3 25-14 vs.DallasCowboys 19-12 0-1 19-13 vs.NewYorkGiants 17-14 2-1 19-15 vs.WashingtonCommanders 20-11 0-0 20-11 vs.PhiladelphiaEagles 3-0 1-0 4-0 vs.NFCEast 59-37 3-2 62-39 vs.ArizonaCardinals 7-7 0-1 7-8 vs.SanFrancisco49ers 8-4 1-0 9-4 vs.SeattleSeahawks 5-4 0-0 5-4 vs.LosAngelesRams 7-3 0-1 7-4 vs.NFCWest 27-18 1-2 28-20 vs.AtlantaFalcons 8-3 2-0 10-3 vs.CarolinaPanthers 6-2 0-1 6-3 vs.TampaBayBuccaneers 6-4 2-2 8-6 vs.NewOrleansSaints 5-3 0-1 5-4 vs.NFCSouth 25-12 4-4 29-16 vs.ChicagoBears 7-5 1-0 8-5 vs.DetroitLions 5-2 0-0 5-2 vs.GreenBayPackers 5-5 1-1 6-6 vs.MinnesotaVikings 4-2 2-0 6-2 vs.NFCNorth 21-14 4-1 25-15
CHIEFS GENERAL MANAGER BRETT VEACH
VEACH IN THE NFL DRAFT AS PERSONNEL MAN
Since entering the NFL, Chiefs GM Brett Veach has been a part of personnelstaffsthathavedraftedthebelowfirst-roundpicks. Yr. No.(Overall) Selection(School)
2007(PHI) -- NoFirst-RoundSelection
QUICK FACTS ON CHIEFS GM BRETT VEACH
• Brett Veach was named the seventh general manager in Kansas City ChiefshistoryonJuly10,2017.The2023seasonmarksVeach'sseventh seasonasanNFLgeneralmanagerandhis17thyearintheNationalFootball League. Prior to being elevated, he previously served as the Chiefs Co-DirectorofPlayerPersonnel.
• In his first six seasons as the GM, Veach helped the team earn Super BowlvictoriesinSuperBowlsLIVandLVII,threeAFCChampionshipsand AFCWesttitlesin2017,2018,2019,2020,2021and2022,aswellasthe numberoneseedintheAFCin2018,2020and2022,andthenumbertwo seedin2019and2021. TheChiefsdefeatedtheColts,31-13,toadvance totheAFCtitlegamein2018.KCdefeatedtheTexans,51-31,toadvance andhosttheAFCtitlegameforthesecondyearinarowin2019.TheChiefs defeatedtheTitanstoadvancetoSuperBowlLIV,thenadvancingtobackto-backSuperBowlsforthefirsttimeinfranchisehistory(2019-20).Inthe 2021AFC Divisional Round, KC defeated the Buffalo Bills in a thriller to advancetotheAFCChampionshipGame.In2022,KCdefeatedtheJaguarstoadvancetotheAFCtitlegame.KChasnowhostedfive-straightAFC ChampionshipGames(2018-22).TheChiefsdefeatedtheBengals,23-20 toadvancetoSuperBowlLVIIbeatingtheEagles38-35,makingittheirthird SuperBowlappearanceinfouryears.
•Heisinhis11thseasonwiththeChiefsafteroriginallyjoiningtheclubin 2013.HewaspromotedtoCo-DirectorofPlayerPersonnelpriortothe2015 seasonafterservingtwoseasonsastheclub’sProandCollegePersonnel Analyst(2013-14).
•TheMountCarmel,Pennsylvania,nativeservedasaSoutheastRegional Scout forthePhiladelphiaEagles(2011-12)afteroriginallyjoiningPhiladelphia’sPlayerPersonnelDepartmentasaProandCollegeScoutin2010. Priortoenteringthescoutingdepartment,VeachwastheAssistanttoHead CoachAndyReidforthreeseasonsinPhiladelphia(2007-09).
•BeforejoiningtheEagles,VeachwastheSupervisorofIntercollegiateAthletic Events at his alma mater, the University of Delaware (2005-06). He wasafour-yearlettermanasawidereceiverfortheBlueHens,catching99 passesfor1,470yards(14.8avg.).HeleftDelawareastheschool’sall-time leaderinkickoffreturnyardswith1,558yards.Hewasastandoutrunning back for Mount Carmel High School. Wife -Alison; Children - twin sons, ElijahandWylan,andadaughter,Ella.
NOTABLE TRANSACTIONS
DuringhistimeasGM,Veachhasmadesignificantmovesnotviathedraft thathavecontributedtoKC’ssuccess.
VEACH’S NFL RECORD
Chiefs 14
Year Reg.Season Pct. Playoffs Overall Result 2007 8-8 .500 0-0 8-8 4thinNFCEast 2008 9-6-1 .594 2-1 11-7-1 2ndinNFCEast;ReachedNFCChampionshipGame 2009 11-5 .688 0-1 11-6 2ndinNFCEast;ReachedWildCardPlayoffs 2010 10-6 .625 0-1 10-7 1stinNFCEast;ReachedWildCardPlayoffs 2011 8-8 .500 0-0 8-8 2ndinNFCEast 2012 4-12 .250 0-0 4-12 4thinNFCEast 2013 11-5 .688 0-1 11-6 2ndinAFCWest;ReachedWildCardPlayoffs 2014 9-7 .563 0-0 9-7 2ndinAFCWest 2015 11-5 .688 1-1 12-6 2ndinAFCWest;ReachedDivisionalPlayoffs 2016 12-4 .750 0-1 12-5 1stinAFCWest;ReachedDivisionalPlayoffs 2017 10-6 .625 0-1 10-7 1stinAFCWest;ReachedWildCardPlayoffs 2018 12-4 .750 1-1 13-5 1stinAFCWest;ReachedAFCChampionshipGame 2019 12-4 .750 3-0 15-4 1stinAFCWest;SuperBowlLIVChampions 2020 14-2 .875 2-1 16-3 1stinAFCWest;ReachedSuperBowlLV 2021 12-5 .706 2-1 14-6 1stinAFCWest;ReachedAFCChampionshipGame 2022 14-3 .824 3-0 17-3 1stinAFCWest;SuperBowlLVIIChampions 2023 2-1 .667 0-0 2-1 TBD TOTALS 169-91-1 .649 14-10 183-101-1 12PlayoffAppearances,8Div.Titles,3AFCTitles,2SBs
2008 -- NoFirst-RoundSelection 2009 19 WRJeremyMaclin(Missouri) 2010 13 DEBrandonGraham(Michigan) 2011 21 GDannyWatkins(Baylor) 2012 12 DTFletcherCox(MississippiState) 2013(KC) 1 TEricFisher(CentralMichigan) 2014 23 LBDeeFord(Auburn) 2015 18 CBMarcusPeters(Washington) 2016 -- NoFirst-RoundSelection 2017 10 QBPatrickMahomes(TexasTech) 2018 -- NoFirst-RoundSelection 2019 -- NoFirst-RoundSelection 2020 32 RBClydeEdwards-Helaire(LSU) 2021 -- NoFirst-RoundSelection 2022 21 TrentMcDuffie(Washington) 2022 30 GeorgeKarlaftis(Purdue) 2023 31 FelixAnudike-Uzomah(KansasState)
Name Date HowAcquired KHarrisonButker 9/26/17 FA-17 TAndrewWylie 12/29/17 FA-17 WRSammyWatkins 3/15/18 FA-18 LBAnthonyHitchens 3/15/18 FA-18 CBCharvariusWard 8/31/18 T-18(DAL) STyrannMathieu 3/14/19 FA-19 DEFrankClark 4/24/19 T-19(SEA) DETerrellSuggs 12/16/19 W-19(ARI) GJoeThuney 3/17/21 FA-21 TOrlandoBrown 4/26/21 T-21(BAL) DEMelvinIngram 11/2/21 T-21(PIT) WRJuJuSmith-Schuster 3/21/22 FA-22 WRMarquezValdes-Scantling 3/24/22 FA-22 SJustinReid 3/18/22 FA-22 DE/OLBCarlosDunlap 7/28/22 FA-22 WRKadariusToney 10/27/22 T-22(NYG) TJawaanTaylor 3/16/23 FA-23 TDonovanSmith 5/3/23 FA-23
•ClarkHunthasbeenthedrivingforcebehindtheresurgenceoftheChiefs, transformingtheiconicfranchiseintooneofthemostsuccessfulteamsin theNFL.
•HunthasbeenChairmanoftheChiefssince2005,andsincetakingover an expanded role as both Chairman and CEO in 2010, the Chiefs have earnedeightAFCWestDivisionChampionships,includingseven-straight between2016-22underHunt’sleadership.Since2010,theclubhasqualifiedfortheplayoffs10timesandhostedfive-consecutiveAFCChampionship Games, becoming the first team in NFLhistory to host five-straight conferencetitlegames.
•Huntonceagainhoistedtheawardthatbearshisfather’sname-theLamarHuntTrophy-in2020astheChiefsclaimedtheirsecond-straightAFC Championship. The Chiefs made consecutive Super Bowl appearances forthefirsttimeinfranchisehistory.In2022,theChiefsclaimedtheLamarHuntTrophyforathirdtimeinfourseasonsandbeatthePhiladelphia Eagles38-35inSuperBowlLVIIgivingtheclubitssecondSuperBowlwin in4seasons.
• Hunt reorganized the leadership structure of the Chiefs in 2013 so the headcoach,thegeneralmanagerandtheteampresidentwouldallreport directlytotheChairmanandCEOforthefirsttimeinteamhistory.Aspartof therestructuring,HunthiredAndyReidasheadcoachin2013,andinthe 11seasonssince,theclubhaswon119regularseasongames,whichranks firstintheNFLoverthattime.
•HuntpromotedBrettVeachtoGeneralManagerin2017andduringthe 2020season,heextendedthecontractsofbothReidandVeach,solidifyingtheleadershipoftheclub’sfootballoperationformanyyearstocome.
•HuntgraduatedfirstinhisclassatSouthernMethodistUniversityin1987, earningadegreeinbusinessadministrationwithaconcentrationinfinance. Hewasateamcaptainandfour-yearlettermanontheMustangs’nationally rankedsoccerteam.HereceivedtheSMUDistinguishedAlumniAwardin 2020foroutstandingleadershipinphilanthropy,business,andciviclife,and currentlyservesontheSMUBoardofTrustees.
•Clarkandhiswife,Tavia,areactivelyinvolvedinnumerousphilanthropic initiativesinbothKansasCityandDallas.ThecouplehasthreechildrenGracie,KnobelandAva.
HUNT’S LEADERSHIP AT THE NFL LEVEL
In addition to returning the franchise his father founded to national prominence,ClarkHuntisaleadingvoiceamongNationalFootballLeague owners.
In2019,HuntwasnamedChairmanoftheFinanceCommitteeafterserving asamemberforsevenyears.HuntisamemberandformerChairmanofthe InternationalCommitteeandservesontheManagementCouncilExecutive Committee (CEC), the Personal Conduct Committee and Commissioner RogerGoodell’sChairman’sCommittee.Inaddition,Huntwasoneofsix membersontheNFLCommitteeonLosAngelesOpportunities.
In2006,stillearlyinhisroleasChairmanoftheChiefs,Huntservedon the NFL’s Commissioner Search Committee which recommended Roger Goodellasthesuccessortothen-CommissionerPaulTagliabue.Huntwas appointedtotheNFL’sDigitalMediaCommitteein2007andserveduntilit wasrestructuredin2019.
Beyondhisserviceonvariousleaguecommittees,Hunthasservedakey role in securing the ongoing labor peace between the National Football League and the NFLPlayersAssociation over the past decade. He was appointedbyGoodellasoneof10NFLownerstonegotiatetheNFL’snew CollectiveBargainingAgreementin2011,andagainin2020,Huntwasan integralmemberoftheNFL’snegotiatingteamthathelpeddeliveranew CollectiveBargainingAgreementafullseasonaheadofthedeadline.
CARRYING ON THE OFF-FIELD LEGACY
AsthesonoflegendaryAmericansportspioneerandChiefsFounderLamar Hunt, Clark Hunt has built upon his father’s legacy by ensuring the Chiefs organization remains focused on its core mission: HonorTradition, UniteOurCommunity,WinwithCharacterandInspireOurFans.
Thiscommitmentincludeda$125millioncontributionfromtheHuntfamily aspartofthe$375millionrenovationofGEHAFieldatArrowheadStadium which was completed in 2010, as well as upgraded stadium technology, newseats,andadditionalstadiuminfrastructuremeasures.Thiscommitmenttothecommunityextendsbeyondthefield,withmorethan50pieces ofartondisplayaspartoftheArrowheadArtCollection,whichcombines twopiecesoftheculturalfabricofKansasCity–sportsandthearts.
Huntandhisfamilystewardanumberofinitiativesthatwereestablished underLamarandhavecontinuedtogrowovertheyears.TheChiefsCharityGamehasraisedmorethan$15.1milliondollarsformultipleyouth-focusedcharitiessinceitsinceptionin1985.Overthepastnineyears,the saleofRedFridayflagshasraisedmorethan$4.5milliontohelpRonald McDonaldHouseCharitiesofKansasCitycontinueitsmissionofkeeping familiescloseintimesofsicknessandneed.Theteam’sKickoffLuncheon servesasawaytowelcometheplayersandcoachesbacktoKansasCity withfansandmembersofthebusinesscommunity.Finally,theHuntFamily Foundation, a 501(c)(3) nonprofit organization which was established in 1983 as the Chiefs Children’s Fund, prioritizes youth-based charities, hungerrelief,healthandwellness,aswellaschildrenandfamiliesincrisis throughphilanthropy,programming,andvolunteerism.
HUNT’S NFL RECORD AS CHAIRMAN AND CEO
Chiefs 15
Year Reg.Season Pct. Playoffs Overall Result 2010 10-6 .625 0-1 10-7 1stinAFCWest;ReachedWildCardPlayoffs 2011 7-9 .438 0-0 7-9 4thinAFCWest 2012 2-14 .125 0-0 2-14 4thinAFCWest 2013 11-5 .688 0-1 11-6 2ndinAFCWest;ReachedWildCardPlayoffs 2014 9-7 .563 0-0 9-7 2ndinAFCWest 2015 11-5 .688 1-1 12-6 2ndinAFCWest;ReachedDivisionalPlayoffs 2016 12-4 .750 0-1 12-5 1stinAFCWest;ReachedDivisionalPlayoffs 2017 10-6 .625 0-1 10-7 1stinAFCWest;ReachedWildCardPlayoffs 2018 12-4 .750 1-1 13-5 1stinAFCWest;ReachedAFCChampionshipGame 2019 12-4 .750 3-0 15-4 1stinAFCWest;SuperBowlLIVChampions 2020 14-2 .875 2-1 16-3 1stinAFCWest;AFCChampions-ReachedSuperBowlLV 2021 12-5 .706 2-1 14-6 1stinAFCWest;ReachedAFCChampionshipGame 2022 14-3 .824 3-0 17-3 1stinAFCWest;SuperBowlLVIIChampions 2023 2-1 .667 0-0 2-1 TBD TOTALS 138-75 .648 12-8 150-83 10PlayoffAppearances,8Div.Titles,3AFCTitles,2SBs
CHIEFS CHAIRMAN AND CEO CLARK HUNT
CHIEFS QUARTERBACK PATRICK MAHOMES

MAHOMES IN CHIEFS RECORD BOOK
ChiefsQBPatrickMahomeshasalreadycrackedintotheChiefsrecord books with only 83 games under his belt. Below is a look at different categorieswhereMahomeshascementedhisnameinChiefshistory.
CHIEFSRECORDFORMOSTTDPASSESINSINGLEGAME
MAHOMES STARTS HOT
ChiefsQBPatrickMahomesearnedtheNFL’sMVPawardin2018.His50 TDpassesin2018tiedforthesecond-bestmarkinNFLhistory.
MOSTTDPASSESSINGLESEASON
MAHOMES AMONG 2018-23 PASSING LEADERS
2018-23YARDSPERCOMPLETION(MIN.750ATTEMPTS,ACTIVE)
Rk. Name Team Y/A
1. JimmyGaroppolo SF/LV 8.24
2. PatrickMahomes KC 8.06
3. DeshaunWatson HOU/CLE8.05
4. JameisWinston TB/NO 7.88
5. RyanTannehill MIA/TEN 7.76
2018-23TDPERCENTAGE(MIN.750ATTEMPTS,ACTIVE)
Rk. Name Team TD%
1. PatrickMahomes KC 6.5
2. RussellWilson SEA/DEN6.1
3t. LamarJackson BAL 5.9 AaronRodgers GB/NYJ 5.9
5. KirkCousins MIN 5.6
2018-23PASSPLAYSOF25+YARDS
Rk. Name Team 25+YardComp.
1. PatrickMahomes KC 213
2. RussellWilson SEA/DEN175 3. TomBrady NE/TB 170 4t. DerekCarr LV/NO 169 KirkCousins MIN 169
2018-23PASSINGFIRSTDOWNS
Rk. Name Team FirstDowns
1,219
1,137 3. JaredGoff LAR/DET 1,075 4. KirkCousins MIN 1,066
1,057
2018-23REDZONEPASSINGTDs
Rk. Name Team RZTDs
1. PatrickMahomes KC 136
2. AaronRodgers GB/NYJ 112
3. KirkCousins MIN 111
4. TomBrady NE/TB 109
5. RussellWilson SEA/DEN103
Chiefs 16
2018-23PASSINGYARDS Rk. Name Team Yards 1. PatrickMahomes KC 24,760 2. TomBrady NE/TB 23,055 3. KirkCousins MIN 22,009 4. JaredGoff LAR/DET 21,780 5. DerekCarr LV/NO 21,168 2018-23PASSINGTOUCHDOWNS Rk. Name Team TDs 1. PatrickMahomes KC 199 2t. KirkCousins MIN 162 AaronRodgers GB/NYJ 162 4. TomBrady NE/TB 161 5. RussellWilson SEA/DEN153
Rk. Name Team TDS INTS Diff. 1. PatrickMahomes KC 199 50 +149 2 AaronRodgers GB/NYJ 162 27 +135 3. KirkCousins MIN 162 52 +110 4t. TomBrady NE/TB 161 52 +109 RussellWilson SEA/DEN153 44 +109 2018-23PASSERRATING(MIN.750ATTEMPTS,ACTIVE) Rk. Name Team Rating 1. PatrickMahomes KC 105.8 2. AaronRodgers GB/NYJ 103.1 3. RussellWilson SEA/DEN101.8
DeshaunWatson HOU/CLE101.4 5. KirkCousins MIN 101.3
2018-23TOUCHDOWN-TO-INTERCEPTIONDIFFERENTIAL
4.
2018-23YARDSPERATTEMPT(MIN.750ATTEMPTS,ACTIVE)
JameisWinston TB/NO
2t. PatrickMahomes KC 12.16 JimmyGaroppolo SF/LV 12.16
JalenHurts
12.02
Rk. Name Team Y/C 1.
12.74
4.
PHI
5. DeshaunWatson HOU/CLE 11.94
1. PatrickMahomes KC
2. TomBrady NE/TB
5. MattRyan ATL/IND
Rk. Name Team TDS Year 1. PeytonManning DEN 55 2013 2t. PatrickMahomes KC 50 2018 TomBrady NE 50 2007 4. PeytonManning IND 49 2004
Rk. Name TDS Opp. Date 1t. PatrickMahomes 6 atPIT Sept.16,2018 PatrickMahomes 6 atLAR Nov.19,2018 LenDawson 6 DEN Nov.1,1964 CHIEFSRECORDFORTDPASSESINASEASON Rk. Name Year Comp. Yds. TD 1. PatrickMahomes 2018 66.0% 5,097 50 2. PatrickMahomes 2022 67.1% 5,250 41 3. PatrickMahomes 2020 66.3% 4,740 38 4. PatrickMahomes 2021 66.3% 4,839 37 CHIEFSRECORDFORHIGHESTPASSERRATINGINSINGLEGAME Rk. Name Rtg. Opp. Date 1t. AlexSmith 158.3 atOAK Dec.15,2013 TrentGreen 158.3 atDET Dec.14,2003 3. SteveBono 156.6 atSEA Sept.3,1995 4. PatrickMahomes 154.8 atPIT Sept.16,2018
BY THE NUMBERS
- PATRICK MAHOMES VS. THE NFL - REGULAR SEASON
ChiefsQBPatrickMahomesisinhisseventhNFLseasonandsixthastheteam’sfull-timesignal-caller.MahomesledtheChiefstoa12-4recordinboth 2018and2019,aswellasa14-2recordandthetopseedintheAFCin2020.IntheNFL’sfirst17-gameseasonin2021,MahomesledtheChiefstoa12-5 record,onceagaintakingfirstintheAFCWest.In2022heledKansasCitytoa14-3finish,thesecond14-winseason(2020)infranchisehistoryagain givingKansasCitythetopseedintheAFC. Mahomeshad5,097yardsthroughtheairinthe2018season,themostinaseasoninfranchisehistoryat thetime,andhis50passingtouchdownsin2018aretiedforthesecondmostall-timeinasingleseasoninNFLhistory.In2022,Mahomesthrewfor5,250 yardsand41touchdowns,onceagainleadingtheleague.His5,250passingyardsin2022rankfourth-mostinleaguehistory.In83careerregularseason starts,Mahomeshasaccumulated25,044careerpassingyardsand199careerpassingTDs(Belowareregularseasontotals).
Chiefs 17
AFCWest Team G Att. Comp. Yds. TD Int. Pct. Rtg. Broncos 11 379 250 2,959 18 8 66.0 96.6 Chargers 9 325 203 2,391 21 5 62.5 99.9 Chiefs 0 0 0 0 0 0 0 0 Raiders 10 366 240 3,040 27 3 65.6 112.5 Total 30 1,070 693 8,390 66 16 64.8 103.1 AFCEast Team G Att. Comp. Yds. TD Int. Pct. Rtg. Bills 3 120 79 835 6 4 65.8 88.7 Dolphins 1 34 24 393 2 3 70.6 91.9 Jets 1 42 31 416 5 0 73.8 144.4 Patriots 3 105 68 871 7 3 64.8 100.9 Total 8 301 202 2,515 20 10 68.8 106.5 AFCNorth Team G Att. Comp. Yds. TD Int. Pct. Rtg. Bengals 3 101 70 840 7 1 69.3 113.5 Browns 2 68 50 712 6 1 73.5 130.3 Ravens 4 163 117 1,479 12 2 71.7 119.1 Steelers 2 58 46 584 9 0 79.3 148.2 Total 11 390 283 3,615 34 4 72.6 127.8 AFCSouth Team G Att. Comp. Yds. TD Int. Pct. Rtg. Colts 2 74 42 583 2 1 56.8 85.6 Jaguars 4 147 102 1,327 9 4 69.4 106.6 Texans 3 108 79 820 8 1 73.1 115.5 Titans 3 153 99 1,098 4 2 64.7 89.2 Total 12 482 322 3,828 23 8 66.8 99.8 AFC G Att. Comp. Yds. TD Int. Pct. Rtg. Total 61 2,243 1,500 18,348 143 38 66.9 106.1 NFCEast Team G Att. Comp. Yds. TD Int. Pct. Rtg. Cowboys 1 37 23 260 0 1 62.1 71.9 Eagles 1 30 24 278 5 1 80.0 130.9 Giants 1 48 29 275 1 1 60.4 74.6 Washington 1 47 32 397 2 2 68.1 90.5 Total 4 162 108 1,210 8 5 67.7 91.9 NFCNorth Team G Att. Comp. Yds. TD Int. Pct. Rtg. Bears 2 66 47 523 5 0 71.2 119.7 Lions 2 81 45 541 2 1 55.6 79.3 Packers 1 37 20 166 1 0 54.1 74.8 Vikings 0 0 0 0 0 0 0 0 Total 5 184 112 1,230 8 1 60.9 86.7 NFCSouth Team G Att. Comp. Yds. TD Int. Pct. Rtg. Buccaneers 2 86 60 711 6 1 69.8 113.1 Falcons 1 44 24 278 2 1 54.5 79.5 Panthers 1 45 30 372 4 0 66.7 121.7 Saints 1 47 26 254 3 0 55.3 92.0 Total 5 222 140 1,615 15 2 61.6 101.6 NFCWest Team G Att. Comp. Yds. TD Int. Pct. Rtg. 49ers 2 72 49 737 6 1 68.1 123.4 Cardinals 2 67 51 609 7 0 76.1 138.2 Rams 2 88 60 798 7 4 68.2 104.3 Seahawks 2 68 39 497 5 0 57.4 104.8 Total 8 295 199 2,641 25 5 67.5 117.7 NFC G Att. Comp. Yds. TD Int. Pct. Rtg. Total 22 863 559 6,696 56 13 64.8 103.7
QUARTERBACK PATRICK MAHOMES - NFL MVP SEASON (2018)
Inhisfirstseasonastheteam’sstartingQB,PatrickMahomeslefthismark inbothNFLandChiefsrecordbookseachweek.Belowisalistofmilestoneshereachedthroughoutthe2018season.
Week1atLosAngelesChargers(W,38-28)
•15of27(55.6%)for256yards,4TD,127.5QBrating
•EarnedAFCOffensivePlayeroftheWeek
Week2atPittsburghSteelers(W,42-37)
•23of28(82.1%)for326yards,6TD,154.8QBrating
•ChiefsRecord:6TDpassesinasinglegame
•TiedQBLenDawson’srecordsetin1964
•ChiefsRecord:10TDpassesinfirst2gamesofseason
•PassedQBLenDawson’srecordof7TDssetin1963
•NFLRecord:10TDpassesinfirst2gamesofseason
•PassedQBsPeytonManning(2013),DrewBrees (2009)CharleyJohnson(1965)whoallhad9
•YoungestplayerinNFLHistorytopassfor6TDs
•AFCOffensivePlayeroftheWeek
Week3vs.SanFrancisco49ers(W,38-27)
•24of38(63.2%)for314yards,3TD,115.5QBrating
•NFLRecord:13TDpassesthroughfirst3weeksofseason
•PassedQBTomBrady’s12TDmarksetin2013
Week4atDenverBroncos(W,27-23)
•28of45(62.2%)for304yards,1TD,89.5QBrating
•ChiefsRecord:1,200passingyardsthroughWeek4
•PassedAlexSmith’smarkof1,110passingyardssetin2015
•AFCOffensivePlayeroftheMonth
Week5vs.JacksonvilleJaguars(W,30-14)
•22of38(57.9%)for313yards,0TD,62.7QBrating
•ChiefsRecord:1,513passingyardsthroughWeek5
•PassedAlexSmith’smarkof1,391passingyardssetin2015
Week6atNewEnglandPatriots(L,43-40)
•23of36(63.9%)352yards,4TD,110.0QBrating
•ChiefsRecord:5consecutivegameswith300+passingyards
•PassedQBsTrentGreen(2004)andBillKenney’s (1983)markoffourconsecutivegamesof300+passingyards
•ChiefsRecord:1,865passingyardsthroughWeek6
•PassedAlexSmith’smarkof1,637passingyardssetin2017
Week7vs.CincinnatiBengals(W,45-10)
•28of39(71.8%)for358yards,4TD,123.7QBrating
•NFLRecord:22passingTDsthroughfirst8careergames.
•PassedQBKurtWarner’smarkof21TDs(1998-99)
•ChiefsRecord:6consecutivegameswith300+passingyards
•PassedTrentGreen’smarkof4consecutivegames(2004)
•ChiefsRecord:2,223passingyardsthroughWeek7
•PassedAlexSmith’smarkof1,979passingyardssetin2017
•FedExAirNFLPlayeroftheWeek
Week8vs.DenverBroncos(W,30-23)
•24of34(70.6%)for303yards,4TD,125.0QBrating
•NFLRecord:26TDthroughfirst9careergames
•PassedQBKurtWarner’smarkof24TDs(1998-99)
•NFLRecord:2,810passingyardsthroughfirst9careergames
•PassedAndrewLuck’smarkof2,631passingyards(2012)
•ChiefsRecord:7consecutivegameswith300+passingyards
•Extendshisfranchiserecord
•FedExAirNFLPlayeroftheWeek
Week9atClevelandBrowns(W,37-21)
•23of32(71.9%)for375yards,3TD,129.0QBrating
•NFLRecord:29TDthroughfirst10careergames
•PassedQBKurtWarner’smarkof24TDs(1998-99).
•NFLRecord:3,185passingyardsthroughfirst10careergames
•PassedAndrewLuck’smarkof2,965passingyards(2012)
•ChiefsRecord:8consecutivegameswith300+passingyards
Week10vs.ArizonaCardinals(W,26-14)
•21of28(75.0%)for249yards,2TD,125.4QBrating
•NFLRecord:31TDthroughfirst11careergames
•PassedQBKurtWarner’smarkof27TDs(1998-99)
•NFLRecord:3,434passingyardsthroughfirst11careergames
•PassedQBAndrewLuck’smarkof3,205passingyards(2012)
•ChiefsRecord:31TDpassesinsingleseason
•PassedQBL.Dawson’ssingle-seasonrecord30TDpasses(1964)
Week11atLosAngelesRams(L,54-51)
•33of46(71.7%)for478yards,6TD,117.6QBrating
•ChiefsRecord:9gamesinsingleseasonwith300+passingyards
•PassedQBTrentGreen’smarkof8gamesin2004
•ChiefsRecord:6TDpassesinsinglegame
•TiedhisownfranchiserecordsetatPittsburgh(9/16/18)
•ChiefsRecord:37TDpassesinsingleseason
•Extendsfranchiserecord
Week13atOaklandRaiders(W,40-33)
•23of38(60.5%)for295yards,4TD,120.0QBrating
•NFLRecord:Fastestplayerto4,000passingyds(4,207in13games)
•ChiefsRecord:10gamesof100.0+passerratinginsingleseason
•TiedQBSteveDeBerg’smarksetin1990
•ChiefsRecord:41TDpassesinsingleseason
•Extendsfranchiserecord
Week14vs.BaltimoreRavens(W,27-24)
•35of53(66.0%)for377yards,2TD,91.5QBrating
•ChiefsRecord:43TDpassesinsingleseason
•Extendsfranchiserecord
•ChiefsRecord:10gamesinasingleseasonwith300+passingyds.
•Extendsfranchiserecord
Week15vs.LosAngelesChargers(L,29-28)
•24of34(70.6%)for243yards,2TD,110.3rating
•ChiefsRecord:45TDpassesinsingleseason
•Extendsfranchiserecord
•ChiefsRecord:11gamesof100.0+passerratinginsingleseason
•PassedQBSteveDeBerg’smarkof10setin1990
Week16atSeattleSeahawks(L,38-31)
•23of40(57.5%)for273yards,3TD,103.4rating
•ChiefsRecord:48TDpassesinsingleseason
•Extendsfranchiserecord
•ChiefsRecord:12gamesof100.0+passerratinginsingleseason
•Extendsfranchiserecord
•ChiefsRecord:4,816passingyardsinsingleseason
•PassedQBTrentGreen’smarkof4,591yardssetin2004
•NFLRecord:31TDsinroadgamesinsingleseason
•PassedQBTomBrady’smarkof29setin2007
Week17vs.OaklandRaiders(W,35-3)
•14of24(58.3%)for281yards,2TD,109.9rating
•ChiefsRecord:50TDpassesinsingleseason
•Extendsfranchiserecord
•ChiefsRecord:13gamesof100.0+passerratinginsingleseason
•Extendsfranchiserecord
•ChiefsRecord:5,097passingyardsinsingleseason
•Extendsfranchiserecord
•ChiefsRecord:383passescompletedinasingleseason
•PassedQBTrentGreen’smarkof369setin2004
AFCDivisionalPlayoffsvs.IndianapolisColts(W,31-13)
•27of41(65.9%)for278yards,1RushingTD,85.2rating
•LedChiefstofirsthomeplayoffwinsince1993season.
•HelpedadvanceChiefstofirsthomeAFCChampionshipappearance.
AFCChampionshipGamevs.NewEnglandPatriots(L,31-37)
•16of31(51.6%)for295yards,3TDs,117.0rating
•Fourth-mostpassingyardsinpostseasongameinteamhistory
•Second-mostTDpassesinasinglepostseasongameinclubhistory
Chiefs 18
QUARTERBACK PATRICK MAHOMES - SUPER BOWL MVP SEASON (2019)
InhissecondseasonastheChiefsfull-timesignal-caller,QBPatrickMahomescontinuedhistrendofperformingatahighlevel.Belowisagameby-gamebreakdownoftheaccoladesthatMahomesreachedonhispath toaSuperBowltitle.
Week1atJacksonvilleJagurs(W,40-26)
•Completed25-of-33passes(75.8%)for378yards,threeTDsanda 143.2passerrating,alongwithzeroINTs.
•211first-halfpassingyardsweremostinNFLsinceQBPeyton Manningin2004.
•PassedProFootballHOFQBKurtWarnerformostpassingyardsin first20careergames(5,759).
Week2atOaklandRaiders(W,28-10)
•Completed30-of-44passes(68.2%)for443yards,fourTDsanda 131.2passerrating,alongwithzeroINTs.
•278passingyards(NFLrecord)andfourpassingTDsinthesecond quarterbrokeafranchisemark.
•Guidedoffensetorecord-breaking20thstraight26-pointoutput.
•821passingyardsfromWeek1toWeek2setthefranchiserecord formostpassingyardsinthefirsttwoweekstobeingaseason,also rankingfifthall-timeinNFLhistoryinthesamecategory.
•NamedAFCOffensivePlayeroftheWeek.
•NamedFedExAir&Ground’s“Air”PlayeroftheWeek.
Week3vs.BaltimoreRavens(W,33-28)
•Completed27-of-37passes(73.0%)for374yards,threeTDsanda 132.0passerrating,alongwithzeroINTs.
•PassedProFootballHOFQBKurtWarnerformost300-yardpassing gamesinaQB’sfirst20careergamesintheSuperBowlera(13).
•1,195passingyardsranksthroughthefirstthreegamesranksfourth all-timeinNFLhistory.
•NamedFedExAir&Ground’s“Air”PlayeroftheWeekforsecond consecutiveweek.
Week4atDetroitLions(W,34-30)
•Completed24-of-42(57.1%)for315yardsandzeroINTs.
•RankedthirdinNFLhistorywith1,510passingyardsthroughthefirst fourgames.
•Threwforatleast300yardsin14thcareergame,thethirdmostin franchisehistory.
•BecamejustthefourthQBinNFLhistorytothrowforatleast300 yardsineachofthefirstfourgamestobeginaseason.
•NamedAFCOffensivePlayeroftheMonth(September).
Week5vs.IndianapolisColts(L,13-19)
•Completed22-of-39(56.4%)for321yards,oneTDandzeroINTs.
•BroketheNFLrecordformostpassingyardswithoutthrowinganINT tobeingaseason(PeytonManning,2013;1,744).
•Recorded300-pluspassingyardsfor15thcareertime,tyingthefranchiserecordforthesecond-mostcareer300-yardpassinggamesin clubhistory(BillKenney).
Week6vs.HoustonTexans(L,24-31)
•Completed19-of-35(54.3%)for273yards,threeTDsandoneINT.
•Recordedhis14th careeroutingofthrowingforatleastthreeTDs, rankingthirdinteamhistoryformostgameswiththreeormoreTDpasses.
• ThrewfirstINToftheseasoninthesecondquarterafteraccumulating 1,896passingyardsontheseason,advancinghisNFL-recordto 2,027passingyardsthrownwithoutanINTtobeginaseason.
Week7atDenverBroncos(W,30-6)
•Completed10-of-19(52.6%)for117yards,oneTDandzeroINTs.
• Surpassed7,500careerpassingyards,settinganewNFLrecord(24games).
Week10atTennesseeTitans(L,32-35)
•Completed36-of-50(72.0%)for446yards,threeTDsandzeroINTs.
•Withapasserratingof119.2,accumulatedhisfifthoutingwithat leasta115.0passerratingthisseason,markingjustthefourthtime
thataQBintheirfirstthreeseasonshasbeenabletodosoina team’sfirst10gamestobeginaseason.
•Markedhis16thcareer300-yardpassingperformance,thesecond mostinfranchisehistoryandthird-mostinNFLhistoryinaQB’sfirst threeseasons.
Week11atLosAngelesChargers(W,24-17)
•Completed19-of-32(59.4%)for182yardsandoneTD.
•Rushedforacareer-high59yards,tallyingthreerushingfirstdowns.
Week13vs.OaklandRaiders(W,40-9)
•Completed15-of-29passes(51.7%)for175yardsandoneTD.
•Rushedforatleast25yardsinsecondconsecutivegame,recording hisfirstrushingTDoftheseasonona13-yardcarry.
Week14atNewEnglandPatriots(W,23-16)
•Completed26-of-40passes(65.0%)for283yardswithoneTDand oneINT.
•BecamethefirststartingQBundertheageof25tobeatthePatriots inFoxborough,Mass.,since2011(JetsQBMarkSanchez).
Week15vs.DenverBroncos(W,23-3)
•Completed27-of-34passes(88.9%)for340yardswithtwoTDsand oneINT.
•TiedKurtWarner’srecordforsecond-most300-yardpassinggames inaQB’sfirstthreeNFLseasons(17games).
•Recordedsecond-highestpass-completionpercentageoutingof career(79.4%).
Week16atChicagoBears(W,26-3)
• Completed23-of-33passes(69.7%)for251yardswithtwopassing TDsandzeroINTs.
•BecamethefastestQBinNFLhistorytothrowfor9,000career passingyardsand75careerpassingTDs(30thcareergame).
•Tiedasingle-seasoncareer-bestwithsecondrushingTDoftheyear.
Week17vs.LosAngelesChargers(W,31-21)
• Completed16-of-25passes(64.0%)for174yards,onepassingTD andoneINT.
•Added21rushingyards,takinghisseasontotalto218rushingyards.
•GuidedtheChiefsoffensetoover30pointsscoredfortheunit’s seventhtimethisseason,helpingsecuretheNo.2seedintheAFC Playoffs.
AFCDivisionalRoundvs.HoustonTexans(W,51-31)
• Completed23-of-35passes(65.7%)for321yardsandafranchiserecordfiveTDpasses.
• GuidedtheChiefstothefranchise’slargestcomeback(24pts)
• Recordeda134.6passerrating,becomingthefirstQBsinceNick Foles(2017)torecordapasserratingofover134.5inthepostseason.
• HisfiveTDpasseswerethemostbyaQBsinceBenRoethlisberger recordedfiveTDthrowsinthe2017postseason.
AFCChampionshipvs.TennesseeTitans(W,35-24)
• Completed23-of-35passes(65.7%)for294yards,threepassingTDs andzeroINTs.
• Finishedthegamewithapasserratingof120.4,hissecond-highest single-gamepasserratinginaplayoffgame.
• BrokethefranchiserecordformostcareerpassingTDsinthepostsea son(11).
• Rushedforateam-best53yardswithapostseasoncareer-longTD rushof27yards.
SuperBowlLIVvs.SanFrancisco49ers(W,31-20)
• Completed26-of-42passes(61.9%)for286yards,twopassingTDs andtwoINTs.
• EarnedtheSuperBowlLIVMVPAwardafterleadingtheChiefsto21 unansweredpointsinthegame’sfinalquarter.
• Rushedforaone-yardTDinthefirstquarter.
Chiefs 19
QUARTERBACK PATRICK MAHOMES 2020 ACCOLADES
Inhisthirdseasonastheteam’sstartingQB,PatrickMahomescontinuesto leavehismarkinbothNFLandChiefsrecordbookseachweek.Belowisa listofmilestoneshe’sreachedthroughoutthe2020season.
Week1vs.HoustonTexans(W,34-20)
•24of32(75.0%)for211yards,3TD,123.3QBrating.
•TiesNFLrecord25winsinfirst32games(DanMarino,KurtWarner).
•EarnedAFCOffensivePlayeroftheWeek.
Week2atLosAngelesChargers(W,23-20)
•27of47(57.4%)for302yards,2TD,90.9QBrating.
•NFLrecord13gamessince2018with3+playerswithareceivingTD.
Week3atBaltimoreRavens(W,34-20)
•31of42(73.8%)for385yards,4TD,133.5QBrating.
•NFLrecordfastestQBtopassfor10,000yards(34games).
•EarnedAFCOffensivePlayeroftheWeek.
Week4vs.NewEnglandPatriots(W,26-10)
•19of29(65.5%)for236yards,2TD,113.6QBrating.
Week5vs.LasVegasRaiders(L,40-32)
•22of43(51.2%)for340yards,2TD,83.5QBrating.
Week6atBuffaloBills(W,26-17)
•21of26(80.8%)for225yards,2TD,128.4QBrating.
•NFLrecordfastestQBtopassfor90-careertouchdowns(37games).
•SetChiefsrecordwith16consecutivegameswithapassingTD.
Week7atDenverBroncos(W,43-16)
•15of23(65.2%)for200yards,1TD,107.2QBrating.
•ExtendedChiefsrecordto17consecutivegameswithapassingTD.
Week8vs.NewYorkJets(W,35-9)
•31of42(73.8%)for416yards,5TD,144.4QBrating.
•ExtendedChiefsrecordto18consecutivegameswithapassingTD.
•Chiefsrecord10careergameswith4+passingTDs.
•NFLrecord3+passingTDsand0INTsinahalf10timessince2018, twiceasmanyastheQBswiththenext-most(AaronRodgersandTom Brady)(AccordingtoNFLResearch).
•EarnedAFCOffensivePlayeroftheWeek.
•EarnedFedExAirPlayeroftheWeek.
Week9vs.CarolinaPanthers(W,33-31)
•30of45(66.7%)for372yards,4TD,144.4QBrating.
•NFLRecordfastestquarterbacktoreach100-careerTD passes-101TDsin40games.
•ExtendedChiefsrecordto19consecutivegameswithapassingTD.
•ChiefsRecord11gameswith4+passingTDs.
•TiesNFLrecord350+passingyards,4+passingTDsand0INTsin back-to-backgames(joinsQBTomBradyastheonlyplayerstoaccomplishthisinback-to-backweeksinasingleseasonsinceatleast 1950(AccordingtoCBSSports).
Week11atLasVegasRaiders(W,35-31)
•34of45(75.6%)for348yards,2TD,1INT,102.8QBrating.
•ExtendedChiefsrecordto20consecutivegameswithapassingTD.
Week12atTampaBayBuccaneers(W,27-24)
•37of49(75.5%)for462yards,3TD,124.7QBrating.
•ExtendedChiefsrecordto21consecutivegameswithapassingTD.
•FirstplayerinNFLhistorywithatleast30completionsand300passingyardsinfourconsecutivegames(NFLResearch).
•JoinsDanMarino(sixgames)asonlyplayerswithfivecareergames withatleast400passingyardsandthreetouchdowns,intheirfirstfour seasonsinNFLhistory.
•TiedChiefsrecord24careergameswith300+passingyards.
•EarnedFedExAirPlayeroftheWeek.
•EarnedNFLOffensivePlayeroftheMonth-November.
Week13vs.DenverBroncos(W,22-16)
•25of40(62.5%)for318yards,1TD,95.6QBrating.
•ExtendedChiefsrecordto22consecutivegameswithapassingTD.
•Chiefsrecord25careergameswith300+passingyards.
Week14atMiamiDolphins(W,33-27)
•24of34(70.6%)for393Yards,2TD,3INT,91.9QBrating.
•ExtendedChiefsrecordto23consecutivegameswithapassingTD.
•ExtendsChiefsrecord26careergameswith300+passingyards.
•TiedNFLrecord(PFHOFQBKurtWarner)26career300-yardgames forthemostgamesofatleast300passingyardsaplayer’sfirstfour seasonsinleagueannals.
•Chiefsrecord26career300-yardgames.
•AccordingtoNFLCommunications,six-straight315+passingyards game,tiedwithQBsDrewBrees(2012-13)andRichGannon(2002) forthelongeststreakinNFLhistory.
Week15atNewOrleansSaints(W,32-29)
•26of47(55.3%)for254Yards,3TD,0INT,92.0QBrating.
•ExtendedChiefsrecordto24consecutivegameswithapassingTD. •Votedtothe2021ProBowl.
Week16vs.AtlantaFalcons(W,17-14)
•24of44(54.5%)for278Yards,2TD,1INT,79.5QBrating.
•ExtendedChiefsrecordto25consecutivegameswithapassingTD. Week17vs.LosAngelesChargers(L,38-21)
•Inactive(No.1SeedClinchedinAFC)
AFCDivisionalvs.ClevelandBrowns(W,22-17)
•21of30(70.0%)for255Yards,1TD,0INT,106.9QBrating.
•Chiefspostseasonrecordformostpassingyards(1,729)inacareer.
•KCpostseasonrecordformostpassesattempted(214)inacareer.
•KCpostseasonrecordformostcompletedpasses(136)inacareer.
•ChiefspostseasonrecordformostTDpasses(14)inacareer.
AFCChampionshipvs.BuffaloBills(W,38-24)
•29of38(76.3%)for325Yards,3TD,0INT,127.6QBrating.
•NFLRecord:youngestquarterbacktostartinthree-consecutive conferencechampionshipgames(25yearsold),andtheonlyquarter backtoaccomplishthefeatpriortohis26thbirthday.Alsothefirst quarterbacktodosoinhisfirstfourseasonsintheleague.
•NFLpostseasonrecordformostTDpasses(17)infirstfourseasons.
•ExtendsChiefspostseasonrecordformostpassingyards(2,054)in acareer.
•ExtendsKCpostseasonrecordformostpassesattempted(252)ina career.
•ExtendsKCpostseasonrecordformostcompletedpasses(165)ina career.
•ExtendsChiefspostseasonrecordformostTDpasses(17)ina career.
SuperBowlLVatTampaBayBuccaneers(L,31-9)
•26of49(53.1%)for270yards,0TD,2INT,52.3QBrating.
•HelpedChiefsearnback-to-backSuperBowltrips.
•ThreeAFCChampionshipappearancesinthreeyearsstarting.
Chiefs 20
QUARTERBACK PATRICK MAHOMES 2021 ACCOLADES
Inhisfourthseasonastheteam’sstartingQB,PatrickMahomescontinues toleavehismarkinbothNFLandChiefsrecordbookseachweek.Belowis alistofmilestoneshe’sreachedthroughoutthe2021season.
Week1vs.ClevelandBrowns(W,33-29)
•27of36(75.0%)for337yards,3TD,131.4QBrating.
•Chiefs/currentNFLrecord26straightgameswithapassingTD.
•Chiefsrecord27gamesof300+passingyards.
•NFLrecordmostpassingyards(14,372)infirst50starts(47).
•NFLrecordmostpassingTDs(117)infirst50starts(47).
•Chiefsrecord(regular+postseason)rushingTDsbyaQB(11).
Week2atBaltimoreRavens(L,35-36)
•24of31(77.4%)for343yards,3TD,1INT,131.5QBrating.
•Chiefs/currentNFLrecord27straightgameswithapassingTD.
•Chiefsrecord28gamesof300+passingyards.
•TiesChiefsrecord30gamesof100.0+passerrating.
Week3vs.LosAngelesChargers(L,24-30)
•27of44(61.4%)for260yards,3TD,2INT,81.6QBrating.
•Chiefs/currentNFLrecord28straightgameswithapassingTD.
•NFLrecordfastestQBtopassfor15,000+yards(49careerstarts).
Week4atPhiladelphiaEagles(W,42-30)
•24of30(80.0%)for278yards,5TD,1INT,131.0QBrating.
•Chiefsrecord31gamesof100.0+passerrating.
•Chiefs/currentNFLrecord29straightgameswithapassingTD.
•TiesNFLrecord3+TDsinfirstfourgamesofaseason,joiningSteve Young(1998),KurtWarner(1999)andTomBrady(2007).
Week5vs.BuffaloBills(L,20-38)
•33of54(61.1%)for272yards,2TD,2INT,70.9QBrating.
•Chiefs/currentNFLrecord30straightgameswithapassingTD.
Week6atWashingtonFootballTeam(W,31-13)
•32of47(68.1%)for397yards,2TD,2INT,90.5QBrating.
•Chiefsrecord29gamesof300+passingyards.
•Chiefs/currentNFLrecord31straightgameswithapassingTD.
Week11vs.DallasCowboys(W,19-9)
•23of37(62.2%)for260yards,0TD,1INT,71.9QBrating.
Week13vs.DenverBroncos(W,22-9)
•29of15(51.7%)for184yards,0TD,1INT,57.3QBrating.
Week14vs.LasVegasRaiders(W,48-9)
•20of24(83.3%)for258yards,2TD,0INT,139.2QBrating.
•Chiefsrecord33gamesof100.0+passerrating.
Week15atLosAngelesChargers(W,34-28)
•31of47(66.0%)for410yards,3TD,1INT,105.8QBrating.
•Chiefsrecord34gamesof100.0+passerrating.
•Chiefsrecord31gamesof300+passingyards.
•Chiefsrecordsevengameswith400+passingyards.
•NFLrecordsevengameswith400+passingyardsinfirstfivesea sons.
•JoinsPFHOFQBPeytonManningasonlytwoQBstologfourcon secutiveseasonswith4,000+passingyardsintheirfirstfiveseasons.
Week16vs.PittsburghSteelers(W,36-10)
•23of30(76.7%)for258yards,3TD,0INT,135.1QBrating.
•Chiefsrecord35gamesof100.0+passerrating.
•Chiefsrecord64careerTDpassesatGEHAFieldatArrowhead.
•Chiefsrecordfour-timeAFCOffensivePlayeroftheMonth.
•NFLrecordasonlyplayertoearnaPlayeroftheMonthawardthe pastfourseasons.
Week17atCincinnatiBengals(W,34-31)
•26of35(74.3%)for259yards,2TD,0INT,113.9QBrating.
•NFLrecordfirstQBwithatleast35touchdownpassesinthreeofhis firstfiveseasons.
•Chiefsrecord36gamesof100.0+passerrating.
Week18atDenverBroncos(W,28-24)
•27of44(61.4%)for270yards,2TD,0INT,93.9QBrating.
•Chiefsclinchno.2seedintheAFCPlayoffPicture.
AFCWildCardPlayoffsvs.PittsburghSteelers(W,42-21)
•30of39(77.0%)for404yards,5TD,1INT,138.2QBrating.
•138.2ishighestpasserratinginaplayoffgameinteamhistory.
•FiveTDpassestiesclubrecordformostTDpasses.
•404yardsismostpassingyardsinaplayoffgameinteamhistory.
AFCDivisionalPlayoffsvs.BuffaloBills(W,42-36-OT)
•33of44(75.0%)for378yards,3TD,0INT,123.1QBrating.
•Teamtrailedwith:13toplaybeforetyinggame.
•Mahomesledoffensetoteamrecord552totalnetyards.
AFCChampionshipvs.CincinnatiBengals(L,24-27-OT)
•26of39(66.7%)for275yards,3TD,2INTs,91.3QBrating.
•LedChiefstoanNFLrecordfourth-straighthomeAFCChampionship
Week7atTennesseeTitans(L,3-27)
•20of35(57.1%)for206yards,0TD,1INT,62.3QBrating.
Week8vs.NewYorkGiants(W,20-17)
•29of48(60.4%)for275yards,1TD,1INT,74.6QBrating.
Week9vs.GreenBayPackers(W,13-7)
•20of37(54.1%)for166yards,1TD,0INT,74.8QBrating.
Week10atLasVegasRaiders(W,41-14)
•35of50(70.0%)for406yards,5TD,0INT,127.6QBrating.
•NFLrecord30gameswithatleast300passingyardsbyaplayerin hisfirstfiveseasons.
•Chiefsrecord30gamesof300+passingyards.
•Chiefsrecord32gamesof100.0+passerrating.
Chiefs 21
QUARTERBACK PATRICK MAHOMES 2022 ACCOLADES (NFL/SB MVP)
Inhisfifthseasonastheteam’sstartingQB,PatrickMahomescontinuedto leavehismarkinbothNFLandChiefsrecordbookseachweek.Belowisa listofmilestoneshe’sreachedthroughoutthe2022season.
Week1atArizonaCardinals(W,44-21)
•30of39(76.9%)for360yards,5TD,0Int,144.2QBrating.
•BecamefirstQBinNFLhistorytorecordthreeormoreTDpassesin fiveconsecutiveseasonopeners.
•AFCOffensivePlayeroftheWeek. Week2vs.LosAngelesChargers(W,27-24)
•24of35(68.6%)for235yards,2TD,0INT,106.2QBrating.
•Extendsfranchiserecordforcareergameswith100.0passerrating to38careergames.
Week3atIndianapolisColts(L,17-20)
•20of35(57.1%)for262yards,1TD,1INT,78.5QBrating. Week4atTampaBayBuccaneers(W,41-31)
•23of37(62.2%)for249yards,3TD,1INT,97.7QBrating.
•NFL/Chiefsrecord162touchdownpassesinfirst67games.
•NFL/Chiefsrecord67gamesto20,000careerpassingyards.
•AFCOffensivePlayeroftheWeek. Week5vs.LasVegasRaiders(W,30-29)
•29of43(67.4%)for292yards,4TD,0INT,117.6QBrating.
•Extendsfranchiserecordforcareergameswith100.0passerrating to39.
Week6vs.BuffaloBills(L,20-24)
•25of40(62.5%)for338yards,2TD,2INT,85.2QBrating.
•Chiefsrecord278career20+yardpasses. Week7atSanFrancisco49ers(W,44-23)
•25of34(73.5%)for423yards,3TD,1INT,132.4QBrating.
•Extendsfranchiserecordforcareergameswith100.0passerrating to40.
Week9vs.TennesseTitans(W,20-17)
•43of68(63.2%)for446yards,1TD,1INT,80.9QBrating.
•Chiefsrecord68passesattemptedinagame.
•Chiefsrecord43completedpassesinagame
•ExtendsChiefsrecordto35300yardpassinggamesinacareer.
•TiedforfirstintheNFLwith35300yardpassinggamessince2017.
•NFL/Chiefsrecordformostpassingyardsinfirst75startswith 21,596(71starts).
Week10vs.JacksonvilleJaguars(W,27-17)
•26of35for331yards(74.3%),4TD,1Int,129.6QBrating.
•NFLrecord176passingtouchdownsinfirst75careerstarts(72 starts).
•TiedNFLrecord33gameswiththreeormorepassingtouchdownsin first75careerstarts(72starts).
•NFLrecord16gameswithfourormorepassingtouchdownsinfirst 75careerstarts(72starts). •
•NFLleaderofgameswith300passingyardssince2017with36.
•Extendsfranchiserecordforcareergameswith100.0passerrating to41.
Week11atLosAngelesChargers(W,30-27)
•20of34for329yards(58.8%),3TD,0Int,120.8QBrating.
•Extendsfranchiserecordforcareergameswith100.0passerrating to42.
•ExtendstitleofNFLleaderofgameswith300passingyardssince 2017with37.
•ExtendsChiefsrecordto37300-yardpassinggamesinacareer.
•TiedNFLrecordwith58careerwinsbyaQBinfirst75starts (73starts)
•ExtendsNFLrecordto179passingtouchdownpassesinfirst75 careergame(73games).
Week12vs.LosAngelesRams(W,26-10)
•27of42for320yards(64.3%)1TD,1Int,85.4QBrating.
•NFLrecordof59careerwinsbyaQBinfirst75starts(74starts).
•ExtendsChiefsrecordto38300-yardpassinggamesinacareer.
•TiedformostQB-passcatchertouchdownconnectionswith46to TravisKelce.
Week13atCincinnatiBengals(L,24-27)
•16of27for223yards(59.3%)1TD,0Int,98.2QBrating.
•TiedChiefsrecordformostrushingtouchdownsbyaQBwith10.
Week14atDenverBroncos(W,34-28)
•28of42for352yards(66.7%)3TD,3Int,86.6QBrating.
•ExtendsChiefsrecordto39300-yardpassinggamesinacareer.
•ExtendstitleofNFLleaderofgameswith300passingyardssince 2017to39.
Week15atHoustonTexans(W,30-24OT)
•36of41for336yards(87.8%)2TD,0Int,117.1QBrating.
•ExtendsChiefsrecordto40300-yardpassinggamesinacareer.
•ExtendedtitleofNFLleaderofgameswith300passingyardssince 2017to40.
•Chiefsrecord87.80completionpercentage.
•Chiefsrecord11rushingtouchdownsbyaQB
•Extendsfranchiserecordforcareergameswith100.0passerrating to43.
Week16vs.SeattleSeahawks(W,24-10)
•16of28for224yards(57.1%)2TD,0Int,106.8QBrating.
•Extendsfranchiserecordforcareergameswith100.0passerrating to44.
•ExtendsChiefsrecordto12rushingtouchdownsbyaQB.
Week17vs.DenverBroncos(W,27-24)
•29of42for328yards(69.0%)3TD,1Int,106.1QBrating
•TiedNFLrecordformostseasonswith5,000passingyardsand40 touchdownsinacareerwithtwo.
•TiedChiefsrecordformost300-yardpassinggamesinaseasonwith 10.
•Chiefsrecord1,280(658,622)passesattemptedinconsecutive seasons.
•Chiefsrecord853(436,417)passescompletedinconsecutive seasons.
•Chiefsrecord9,887(4.839,5,048)passingyardsinconsecutive seasons.
•Chiefsrecord77(37,40)passingtouchdownsinconsecutive seasons.
•Extendsfranchiserecordforcareergameswith100.0passerrating to45.
•ExtendsChiefsrecordto41300-yardpassinggamesinacareer.
•ExtendedtitleofNFLleaderofgameswith300passingyardssince 2017to41.
Week18atLasVegasRaiders(W,31-13)
•18of26for202yards(69.2%)1TD,0Int,105.0QBrating.
•NFLrecord5,614combinedyardsbyaQB.
•Chiefsrecord5,250passingyardsinaseason.
•Extendsfranchiserecordforcareergameswith100.0passerrating to46.
AFCDivisionalPlayoffsvs.JacksonvilleJaguars(W,27-20)
•22of30for195yards(73.3%)2TD,0Int,112.5QBrating.
•Extendsfranchiserecordforcareerpostseasongameswith100.0 passerratingto8.
AFCConferenceChampionshipvs.CincinnatiBengals(W,23-20)
•29of43for326yards(67.4%)2TD,0INT,105.4QBrating.
•Extendsfranchiserecordforcareerpostseasongameswith100.0 passerratingto9.
SuperBowlLVIIvs.PhiladelphiaEagles(W,38-25)
•21of27for182yards(77.8%)3TD,0INT,131.8QBrating.
•Extendsfranchiserecordforcareerpostseasongameswith100.0 passerratingto10.
•EarnedthesecondSuperBowlMVPofhiscareer.
2022SeasonAwards
•WonNFLMVPforthesecondtimeinhiscareer.
•VotedtheESPYBestMaleAthlete.
•VotedtheESPYBestNFLPlayer.
•VotedbyteammatesasChiefsDerrickThomasMostValuablePlayer. •SelectedtotheProBowl.
•NamedtotheAPAll-Profirstteam.
Chiefs 22
A HOT START FOR THE YOUNG QUARTERBACK
With83gamesunderhisbeltasastartingquarterbackintheNationalFootballLeague,ChiefsQBPatrickMahomeshasperformedatarecord-settingpace thusfar.ThechartsbelowcompareMahomes’first83careerstartstosomeofthegame’sgreatestquarterbacksintheirfirst83starts.
ListedareProFootballHOFQBsBrettFavre,KurtWarner,DanMarino,JohnElway,JoeMontana,JoeNamath,TroyAikman,JimKelly,SteveYoung, JohnnyUnitasandPeytonManning,alongwithpotentialfuturePFHOFersQBsTomBrady,DrewBreesandAaronRodgers.Amongthegroup,thereare 11ProFootballHallofFamers,11NFL/AFLMVPAwardwinners,12SuperBowlchampionsand10SuperBowlMVPs.
PASSINGYARDS(THROUGHFIRST83STARTS)
PASSINGTOUCHDOWNS(THROUGHFIRST83STARTS)
INTERCEPTIONS(THROUGHFIRST83STARTS)
COMEBACK KINGDOM
QBPatrickMahomesledhisteamtoanNFL-QBrecordeightstraightcomefrom-behindwinsafterbeingdownbyatleast10pointsfrom2019-20.He hasatotalof14suchcomebackvictoriesinhiscareer.
Mahomesalsoowns15winsingameshisteamenteredthefourthquarter eithertrailingortied.
Chiefs 23
Name Team Yards PatrickMahomes KC 25,044 DanMarino* MIA 23,017 AaronRodgers GB 22,978 KurtWarner* STL 22,452 PeytonManning* IND 21,218 JoeMontana* SF 20,003 BrettFavre* GB 19,872 TomBrady NE 19,014 DrewBrees SD/NO 18,992 JimKelly* BUF 18,857 JoeNamath* NYJ 18,807 JohnnyUnitas* BAL 18,335 JohnElway* DEN 17,999 SteveYoung* TB/SF 17,820 TroyAikman* DAL 16,531
Name Team TDs PatrickMahomes KC 199 DanMarino* MIA 189 AaronRodgers GB 180 BrettFavre* GB 157 JohnnyUnitas* BAL 148 KurtWarner* STL 142 PeytonManning* IND 141 JoeMontana* SF 132 TomBrady NE 131 JimKelly* BUF 131 SteveYoung* TB/SF 120 DrewBrees SD/NO 119 JoeNamath* NYJ 119 JohnElway* DEN 101 TroyAikman* DAL 83 PASSCOMPLETIONS(THROUGHFIRST83STARTS) Name Team Comp. PatrickMahomes KC 2,059 AaronRodgers GB 1,835 PeytonManning* IND 1,811 KurtWarner* STL 1,801 DanMarino* MIA 1,796 BrettFavre* GB 1,756 DrewBrees SD/NO 1,716 JoeMontana* SF 1,681 TomBrady NE 1,659 JimKelly* BUF 1,492 TroyAikman* DAL 1,439 JohnElway* DEN 1,432 SteveYoung* TB/SF 1,396 JohnnyUnitas* BAL 1,283 JoeNamath* NYJ 1,216 PASSERRATING(THROUGHFIRST83STARTS) Name Team Rating PatrickMahomes KC 105.4 AaronRodgers GB 105.4 SteveYoung* TB/SF 94.7 KurtWarner* STL 93.1 DanMarino* MIA 92.1 JoeMontana* SF 91.8 BrettFavre* GB 89.0 TomBrady NE 88.3 JimKelly* BUF 87.7 DrewBrees SD/NO 87.1 PeytonManning* IND 85.6 TroyAikman* DAL 82.0 JohnnyUnitas* BAL 79.5 JohnElway* DEN 73.4 JoeNamath* NYJ 69.2
Name Team INTs AaronRodgers GB 49 PatrickMahomes KC 51 SteveYoung* TB/SF 63 JoeMontana* SF 69 TomBrady NE 69 DrewBrees SD 76 TroyAikman* DAL 78 BrettFavre* GB 83 JimKelly* BUF 86 JohnElway* DEN 96 KurtWarner* STL 97 DanMarino* MIA 97 PeytonManning* IND 103 JohnnyUnitas* BAL 120 JoeNamath* NYJ 136 *DenotesProFootballHallofFamer
Date Team Deficit FinalScore 2/12/23* vs.PHI 14-24(10) 38-25 11/6/22 vs.TEN 3-14(11) 20-17 10/23/22 atSF 0-10(10) 44-23 10/10/22 vs.LV 0-17(17) 30-29 9/15/22 vs.LAC 7-17(10) 27-24 9/12/21 vs.CLE 3-15(12) 33-29 12/13/20 atMIA 0-10(10) 33-27 9/20/20 atLAC 6-17(11) 23-20OT 2/2/20* vs.SF 10-20(10) 31-20 1/19/20* vs.TEN 7-17(10) 35-24 1/12/20* vs.HOU 0-24(24) 51-31 9/15/19 atOAK 0-10(10) 28-10 9/29/19 atDET 0-10(10) 34-30 10/1/18 atDEN 13-23(10) 27-23
Date Team DeficitEnteringQ4 FinalScore 2/12/23* vs.PHI 21-27(6) 38-35 1/1/23 vs.DEN 13-17(4) 27-24 12/18/22 atHOU 16-21(5) 30-24OT 11/20/22 atLAC 16-20(4) 30-27 11/6/22 vs.TEN 9-17(6) 20-17OT 10/10/22 vs.LV 10-20(10) 30-29 9/15/22 vs.LAC 14-17(3) 27-24 1/8/22 atDEN 17-21(4) 28-24 12/16/21 atLAC 13-14(1) 34-28OT 9/12/21 vs.CLE 20-22(2) 33-29 9/20/20 atLAC 9-17(8) 23-20OT 2/2/20* vs.SF 10-20(10) 31-20 9/29/19 atDET 20-23(3) 34-30 12/9/18 vs.BAL 17-17(0) 27-24OT 10/1/18 atDEN 13-20(7) 27-23
*DenotesPostseasonGame
KELCE LOGS NFL RECORD
Overthepastfiveseasons(2018-22),ChiefsTETravisKelcehaslanded himselfintheNFLhistorybookashe’srecordedthreeofthetop-fivesingleseasonreceivingyardmarksfortightendsintheleague’sexistence.He settherecordin2020with1,416receivingyardson105receptions.
NFLRECORDBOOK:
SINGLE-SEASONRECEIVINGYARDS,TIGHTEND
With146gamesplayedinhiscareer,ChiefsTETravisKelcehasalready cementedhimselfinleaguehistoryandcontinuestoproduceatarecordsetting pace. Through 146 games, Kelce has totaled 825 receptions for 10,439yardsand71touchdowns.
Thebelowchartcomparesthefirst146gamesofKelce’scareertosome ofthegame’sgreatesttightendsfirst150games(minimumof125games played). There are currently nine TEs enshrined in the Pro Football Hall ofFame--DaveCasper(1974-84),MikeDitka(1961-72),TonyGonzalez (1997-2013),JohnMackey(1963-72;117games),OzzieNewsome(197890),CharlieSanders(1968-77;123games),ShannonSharpe(1990-2003), JackieSmith(1963-78)andKellenWinslow(1979-87;109games)--along with potential future PFHOFTEsAntonio Gates (2003-18), Jason Witten (2003-17,2019-20)andRobGronkowski(2010-18,2020-21).
RECEPTIONS(THROUGHFIRST150GAMES)
With71receivingyardsinKansasCity’s2022Week14gameagainstthe Broncos(12/11/22),TETravisKelcebecamejustthesecondpasscatcher infranchisehistorytocrossthe10,000-yardplateauforhiscareer.Henow owns10,439careerreceivingyards.Hehas35100-yardreceivinggamesin hiscareer,includingsixin2022.His35100-yardreceivinggamesisaleague bestfortightends.
CHIEFSRECORDBOOK:MOSTRECEIVINGYARDS,CAREER
RECEIVINGYARDS(THROUGHFIRST150GAMES)
By reaching the milestone in just 140 games, Kelce became the fastest tightendinNFLhistorytorecord10,000careerreceivingyards.He'salso thefastesttightendinNFLhistorytorecord9,000careerreceivingyards, doingsoin127games.
NFLRECORDBOOK: FASTESTTO10,000RECEIVINGYARDS,TIGHTEND
RECEIVINGTOUCHDOWNS(THROUGHFIRST150GAMES)
Chiefs 24 MISC. OFFENSIVE NOTES MISC. OFFENSIVE NOTES
Rk. Tm. Name Year Rec. Yards Avg. 1. KC TravisKelce 2020 105 1,416 13.5 2. SF GeorgeKittle 2018 88 1,377 15.6 3. BAL MarkAndrews 2021 107 1,361 12.7 4. KC TravisKelce 2022 110 1,338 12.2 5. KC TravisKelce 2018 103 1,336 13.0
Rk. Yards Player Pos. Seasons 1. 10,940 TonyGonzalez TE 1997-2008 2. 10,439 TravisKelce TE 2013-23 3. 7,306 OtisTaylor WR 1965-75 4. 7,155 DwayneBowe WR 2007-14 5. 6,630 TyreekHill WR 2016-21
Rk. Name Years Games 1. TravisKelce 2013-23 140 2. TonyGonzalez 1997-08 177 3. AntonioGates 2003-14 179 4. JasonWitten 2003-14 180 5. ShannonSharpe 1990-03 203
KELCE JOINS THE 10,000 CLUB
Name Team Receptions TravisKelce(146Games) KC 825 JasonWitten DAL 747 TonyGonzalez* KC 681 AntonioGates SD 657 RobGronkowski^ NE/TB 621 OzzieNewsome* CLE 575 ShannonSharpe* DEN 572 JackieSmith* STL 447 MikeDitka*^^^ CHI/PHI/DAL 427 DaveCasper*^^ OAK/HOU 378
Name Team Yards TravisKelce(146Games) KC 10,439 RobGronkowski^ NE/TB 9,286 AntonioGates SD 8,549 JasonWitten DAL 8,396 TonyGonzalez* KC 8,251 JackieSmith* STL 7,426 ShannonSharpe* DEN 7,238 OzzieNewsome* CLE 7,073 MikeDitka*^^^ CHI/PHI/DAL 5,812 DaveCasper*^^ OAK/HOU 5,216
Name Team Touchdowns RobGronkowski^ NE/TB 92 AntonioGates SD 84 TravisKelce(146Games) KC 71 TonyGonzalez* KC 57 DaveCasper*^^ OAK/HOU 52 ShannonSharpe* DEN 44 MikeDitka*^^^ CHI/PHI/DAL 43 OzzieNewsome* CLE 42 JasonWitten DAL 42 JackieSmith* STL 36 *DenotesProFootballHallofFamer ^Onlyplayedin143games ^^Onlyplayedin144games ^^^Onlyplayedin146games
KELCE AMONG THE ALL-TIME GREATS
Rk. Pos. Name Rec. Yards YAC 1. TE TravisKelce 825 10,439 4,920 2. WR GoldenTate 594 6,981 3,838 3. WR JulioJones 770 11,472 3,717 4. WR DavanteAdams 794 9,959 3,692 5. RB ChristianMcCaffrey453 3,826 3,661
YARDS
CATCH
SinceenteringtheNFLin2013,ChiefsTETravisKelceranksfirstin yardsaftercatchbyallplayers.
KELCE
AFTER
MISC. OFFENSIVE NOTES
RELIABILITY WITH KELCE
TETravisKelcehasrecordedatleastonepassreceptionin145-consecutive gamesplayedfromWeek1ofthe2014season(9/7/14)throughlastweek vs.theBears,extendinghisrecordforlongeststreakinfranchisehistory.
CHIEFSRECORDBOOK:
MOSTCONSECUTIVEGAMES,PASSRECEPTIONS
Rk. Games Player Years
1. 145 TravisKelce Sept.7,2014–Present
2. 131 TonyGonzalez Dec.4,2000–Dec.28,2008
3. 83 StephonePaige Nov.17,1985–Sept.29,1991
Kelce’s145-consecutivegameswithareceptionisthesecond-longestactive streakintheNFL.Kelce’sachievementalsoranksasthelongestconsecutive markbyanactiveTEintheNationalFootballLeague.
NFLRECORDBOOK:
MOSTCONSECUTIVEGAMES,PASSRECEPTION,ACTIVESTREAK
Rk. Name Team Games Date
1. DeAndreHopkins HOU/ARI/TEN 148 Sept.9,2013–Present
2. TravisKelce KC 144 Sept.7,2014–Present
3. StefonDiggs MIN/BUF 122 Oct.4,2015 – Present
4. ZachErtz PHI/ARI 119 Dec.7,2014 – Present
Kelce is in his 11th season and has 10,439 career receiving yards, becoming one of five tight ends in NFLhistory to eclipse 10,000 receiving yardsafterrecording71yardslastseasonagainsttheBroncos(12/11/22). Reachingthismarkinjust140games,Kelcebecamethefastesttightend to accumulate 10,000 receiving yards. Kelce’s 71 receiving yards in the winovertheBroncosalsoearnedhimhisseventh-consecutive1,000-yard receiving season, the most consecutive 1,000-yard seasons in franchise history.
NFLRECORDBOOK
MOSTRECEIVINGYARDS,CAREER,TIGHTEND(ALL10,000+)
1. 15,127 TonyGonzalez 1997-13
2. 13,046 JasonWitten 2003-20
3. 11,841 AntonioGates
4.
5.
PROTECTION UP FRONT
Priortothe2021season,theChiefsoverhauledtheiroffensiveline,drafting CCreedHumphreywiththe63rdpickinthesecondroundandpickingup GTreySmithwiththe226thoverallpickinthesixthround.Thedraftpicks were paired with G Joe Thuney as a free agent. Before the 2023 season the Chiefs added to the line with free agent tackles Donovan Smith and JawaanTaylor.
These additions have kept QB Patrick Mahomes protected. Throughout the2022season,theChiefsfrontallowedonly26sacks,thethird-fewest acrosstheleagueandthefewestintheAFC.
That success has continued into the 2023 season.Through Week 3 the Chiefs have only allowed one sack, tying them with the Dolphins for the leaguelead.
SACKSALLOWED,2022
Rk. Team Sacks Yds.
1. TB 22 -160
2. DET 24 -163
3. KC 26 -188
4. DAL 27 -175
5. JAX 28 -189
SACKSALLOWED,2023
Rk. Team Sacks Yds.
1t. MIA 1 -5 KC 1 -7
3t. DET 3 -10
TB 3 -17
DAL 3 -25
GB 3 -33
PUT IT ON THE BOARD
Since2018,theChiefsrankfirstintheNFLinpointsscoredpergame(29.9). TheChiefsaveraged29.2pointspergameinthe2022season,comingout ontopacrosstheleague.SinceAndyReidwasnamedHeadCoachin2013, theChiefshavehadatleastfourgameseachseasonwherethey’vescored 30 or more points. In 2018, the club scored at least 30 points 12 times, whichrankedfirstinfranchisehistory.Inthe2022seasonalone,theyChiefs recordedeightgameswithatleast30points.
2018-23NFLLEADERS-POINTSPERGAME Rk. Team PointsPerGame
1. KC 29.9
3. DAL 26.5
2. TB 26.2
4t. BAL 25.8 NO 25.8
SCRIMMAGE YARDS PER GAME LEADERS
Overthelastsixseasons, the Chiefs rank first in the NFL in scrimmage yardspergame.
2018-23NFLLEADERS-SCRIMMAGEYARDSPERGAME Rk. Team ScrimmageYardsPerGame
1. KC 415.7
MOVING THE CHAINS
Since2018,theChiefsrankedfirstintheleaguewithatotalof2,025first downs.
THIRD DOWN MAGIC
Since2018,theChiefshavethehighestthird-downpercentageinthe NFL,converting48.9%oftheirthird-downattempts.
2018-23NFLLEADERS-THIRDDOWNPCT.
CHIEFS CAPTAINS
Last week vs. the Bears the Chiefs captains were TETravis Kelce, DT ChrisJonesandLSJamesWinchester
CHIEFSCAPTAINS-2023
WeekOne: QBPatrickMahomes,LBNickBoltonandKHarrisonButker.
WeekTwo: TJawaanTaylor,SJustinReidandPTommyTownsend.
WeekThree: TETravisKelce,DTChrisJonesandLSJamesWinchester
Chiefs 25
Rk. Team FirstDowns 1. KC 2,025 2. TB 1,902 3 LAC 1,886 3. LAC 4 DAL 1,879 4. DAL 5 BAL 1,875 5. BAL
2018-23NFLLEADERS-FIRSTDOWNS
Rk. Team ThirdDownPct. 1. KC 48.9 2t. BAL 43.9 DAL 43.9 4. LAC 43.4 5. PHI 43.2
2003-18
10,439 TravisKelce 2013-23
10,060 ShannonSharpe 1990-03
2. TB 397.7
3. DAL 395.1
4. LAC 389.4
5. SF 387.4
CHIEFS DEFENSIVE NOTES
CHIEFS TAKEAWAYS UNDER REID
Datingbackto2013whenChiefsHeadCoachAndyReidarrivedinKansas City,theChiefsdefenseisrankedthirdintheNFLwhenitcomestoforcing opponentturnovers,tallying263totaltakeaways.
POINTS PER GAME ALLOWED
Datingbackto2013,KansasCity’sdefenseranksfourthintheNFLinallowingopposingteamstoscorejust20.5pointspergame.
HOUSE CALLS, PLEASE
The Chiefs have returned 24 of their 157 interceptions for touchdowns since2013,themostintheNFLoverthatspan.
OPPONENT PASSER RATING
Since2013,theChiefsareholdingopposingteamstoan85.2passerrating,placingtheunitfifthintheNFLduringthattimespan.
SinceDefensiveCoordinatorSteveSpagnuoloarrivedinKansasCityin 2019,theChiefshavereturnedsevenoftheir59interceptionsforatouchdown,includingtwoin2022,tyingforthirdmostintheNFL.
OPPONENT COMPLETION PERCENTAGE
Since2013,KansasCity’spassdefenseisallowingopposingquarterbacks tocompletejust60.7percentofpasses,rankingsecondintheNFL.
KANSAS CITY THIEFS
TheChiefsrankthirdintheNFLwith157interceptionssince2013,returningthoseinterceptionsforaleague-best2,613yardsand24TDs.
PASSES DEFENSED
Goingbackto2013,theclubisrankedsecondintheNFLformostpasses defensedwith815passesdefensed.
BOWL PLAYERS & ‘22 AWARDS
TheNFLannouncedonDec.21,2022thatsevenmembersoftheChiefs wereselectedtoparticipateinthe2023NFLProBowl.
OrlandoBrown(Tackle)-4thNomination
CreedHumphrey(Center)-1stNomination
ChrisJones(DefensiveTackle)-4thNomination
TravisKelce(TightEnd)-8thNomination
PatrickMahomes(Quarterback)-5thNomination
JoeThuney(Guard)-1stNomination
TommyTownsend(Punter)-1stNomination
2022IN-SEASONAWARDS
I GOT A NEED, A NEED FOR SNEED
SinceenteringtheNFLin2020,ChiefsCBL’JariusSneedranksfirstamong allcornerbacksinsacksandsackyards.
Chiefs 26
Rk. Team Games Takeaways 1. BUF 164 270 2. NE 165 264 3. KC 165 263 4. TB 165 260 5. SEA 165 256
Rk. Team PPG 1. NewEnglandPatriots 18.9 2. BaltimoreRavens 20.1 3. SeattleSeahawks 20.3 4. KansasCityChiefs 20.5 5. BuffaloBills 20.7
Rk. Comp.% Team 1. 60.6 NewEnglandPatriots 2. 60.7 KansasCityChiefs 3. 60.9 BuffaloBills 4. 61.8 PittsburghSteelers 5. 61.9 DenverBroncos
Rk. INTTDs Team 1. 24 KansasCityChiefs 2. 19 TampaBayBuccaneers 3t. 18 ArizonaCardinals 18 HoustonTexans 18 LosAngelesRams
Rk. INTs Team 1. 177 BuffaloBills 2 174 NewEnglandPatriotsBuffaloBills 3. 157 KansasCityChiefs 4. 152 CincinnatiBengals 5. 150 PittsburghSteelers
‘23
CHIEFS PRO
Week Player Award 1 QBPatrickMahomes AFCOffensivePOTW 2 CBJaylenWatson AFCDefensivePOTW Sept. PTommyTownsend AFCSpecialTeamsPOTM 4 QBPatrickMahomes AFCOffensivePOTW 11 TETravisKelce AFCOffensivePOTW Nov. QBPatrickMahomes AFCOffensivePOTM 15 PTommyTownsend AFCSpecialTeamsPOTW Dec. RBJerickMcKinnon AFCOffensivePOTM
Rk. PasserRtg Team 1. 79.0 BuffaloBills 2. 82.1 NewEnglandPatriots 3. 84.5 SeattleSeahawks 4 85.2 KansasCityChiefs 5. 85.4 DenverBroncos
Rk. Team PD 1. BuffaloBills 829 2. KansasCityChiefs 815 3. CincinnatiBengals 801 4. NewYorkGiants 800 5. BaltimoreRavens 783
Rk. INTTDs Team 1. 12 NewEnglandPatriots 2. 8 SanFrancisco49ers 3t. 7 KansasCityChiefs 7 Threeotherteamstied.
Rank Player Team Sacks SackYards 1. L’JariusSneed KC 6.5 71.0 2. MarlonHumphreyBAL 5.5 28.5 3. JourdanLewis DAL 4.5 13.5 4t. Threeplayerstied. 4.0
CHIEFS DEFENSIVE NOTES
CHIEFS EXCEL WHEN SACKING THE QB
The Chiefs have placed an emphasis on putting pressure on opposing quarterbacks.KansasCityhasrecorded6.0ormoreteamsacks62times inteamhistory.Inthose62games,KansasCityhasa56-5-1(.911)record andhasoutscoreditsopponents1,824-766. RecordWhenRecording6.0orMoreTeamSacks
Below is a look at Kansas City’s defensive scores since Defensive CoordinatorSteveSpagnuolojoinedtheChiefsin2019.TheChiefsare4-0 whenproducingafumblerecoverytouchdown.KCis2-0whenrecording a safety and 6-1 (.857) when obtaining an interception touchdown. One of these notable interception touchdowns was Jaylen Watson’s 99-yard interceptionreturnlastseason.
GREEDY CHIEFS
Throughthreegamesin2023,theKansasCityChiefsdefenseisranked fourthintheNFLwhenitcomestopointsallowedbyanopponentgiving uponly40totalpoints,averagingjust13.3pointspergame.
Chiefs 27
Date Opponent Sacks Yds Result 12/4/1960 Houston 7.0 54 W,24-0 12/18/1960 Buffalo 6.0 37 W,24-7 9/23/1962 @Oakland 6.0 67 W,26-16 12/8/1963 Denver 6.0 47 W,52-21 12/14/1963 Boston 6.0 54 W,35-3 11/8/1964 Oakland 7.0 65 W,42-7 10/31/1965 Oakland 6.0 62 W,14-7 10/8/1967 Miami 7.0 77 W,41-0 9/28/1968 @Miami 6.0 55 W,48-3 11/10/1968 @Cincinnati 6.0 35 W,16-9 12/8/1968 @SanDiego 6.0 61 W,40-3 12/14/1968 @Denver 7.0 78 W,30-7 10/26/1969 Cincinnati 6.0 23 W,42-22 11/2/1969 @Buffalo 9.0 93 W,29-7 9/28/1970 @Baltimore 7.0 73 W,44-24 12/6/1970 Denver 6.0 45 W,16-0 10/1/1972 @Denver 8.0 63 W,45-24 11/12/1973 Chicago 6.0 64 W,19-7 12/2/1973 Cleveland 7.0 50 T,20-20 9/23/1979 Oakland 7.0 55 W,35-7 10/5/1980 @Oakland 6.0 54 W,31-17 11/13/1983 Cincinnati 7.0 49 W,20-15 11/27/1983 @Seattle 6.0 40 L,48-51(OT) 9/30/1984 Cleveland 11.0 78 W,10-6 12/8/1985 Atlanta 7.0 53 W,38-10 9/21/1986 Houston 7.0 42 W,27-13 9/23/1990 @GreenBay 6.0 35 W,17-3 10/7/1990 @Indianapolis 7.0 62 L,19-23 11/11/1990 Seattle 9.0 70 L,16-17 12/2/1990 @NewEngland 6.0 44 W,37-7 10/7/1991 Buffalo 6.0 43 W,33-6 11/17/1991 Denver 6.0 47 L,20-24 10/11/1992 Philadelphia 6.0 39 W,24-17 11/8/1992 SanDiego 6.0 56 W,16-14 12/27/1992 Denver 6.0 56 W,42-20 10/3/1993 LARaiders 6.0 46 W,24-9 10/17/1994 @Denver 6.0 30 W,31-28 10/1/1995 @Arizona 7.0 68 W,24-3 9/15/1996 @Seattle 7.0 18 W,35-17 11/16/1997 Denver 6.0 38 W,24-22 12/7/1997 Oakland 6.0 45 W,30-0 12/14/1997 @SanDiego 7.0 34 W29-7 9/6/1998 Oakland 10.0 58 W,28-8 12/26/1998 @Oakland 6.0 44 W,31-24 9/17/2000 SanDiego 6.0 31 W,42-10 11/26/2000 @SanDiego 6.0 28 L,16-17 12/10/2000 Carolina 6.0 18 W,15-14 12/8/2002 St.Louis 7.0 49 W,49-10 12/4/2011 Chicago 7.0 45 W,10-3 9/8/2013 @Jacksonville 6.0 50 W,28-2 9/19/2013 @Philadelphia 6.0 34 W,26-16 10/13/2013 Oakland 9.0 63 W,24-7 12/8/2013 @Washington 6.0 31 W,45-10 10/26/2014 St.Louis 7.0 44 W,34-7 12/28/2014 SanDiego 7.0 42 W,19-7 11/1/2015 Detroit 6.0 32 W,45-10 1/3/2016 Oakland 6.0 37 W,23-17 10/30/2016 @Indianapolis 6.0 38 W,30-14 9/17/2017 Philadelphia 6.0 34 W,27-20 10/17/2019 @Denver 9.0 79 W,30-6 12/11/2022 @Denver 6.0 49 W,34-28 1/7/2023 @LasVegas 6.0 39 W,31-13
DefensiveScoresUnderDefensiveCoordinatorSteveSpagnuolo Date OpponentDefensiveScore Result 12/11/22 @DEN LBWillieGay47-ydINTreturn W,34-28 10/23/22 @SF DEFrankClarksafety(J.Garoppolo) W,44-23 9/15/22 LAC CBJaylenWatson99-ydINTreturn W,27-24 1/8/22 @DEN LBNickBolton86-ydfum.return W,28-24 12/12/21 LV CBMikeHughes23-ydfum.return W,48-9 12/5/21 DEN SDanSorensen75-ydINTreturn W,22-9 9/19/21 @BAL STyrannMathieu34-ydINTreturn L,35-36 12/13/20 @MIA DTChrisJonessafety(T.Tagovailoa) W,33-27 10/25/20 @DEN SDanSorensen50-ydINTreturn W,43-16 10/5/20 NE STyrannMathieu25-ydINTreturn W,26-10 12/1/19 OAK SJuanThornhill46-ydINTreturn W,40-9 10/17/19 @DEN LBReggieRagland5-ydfumreturn W,30-6 9/29/19 @DET CBB.Breeland100-ydfum.return W,34-30
CHIEFS DEFENSE NO STRANGER TO END ZONE
Rk. Team Pts.Allowed 1. ClevelandBrowns 32-10.7PPG 2. BuffaloBills 35- 11.7PPG 3. DallasCowboys 38- 12.7PPG 4. KansasCityChiefs 40-13.3PPG 5. SanFrancisco49ers 42-14.0PPG
BUTKER’S BOOTS
KHarrisonButker’s147pointsscoredledallNFLplayersin2019.Healso broke his own franchise record for the most points scored by a kicker in a singleseason.Butker’s147pointsranksecondinclubhistoryforthemost pointsscoredbyanyplayerinasingleseason(PriestHolmes,2003;162), andhis787pointsscoredinhiscareerrankthirdinclubannals.
NFLLEADERS,POINTSSCORED(2019)
Rk. Pts. Player Team
1. 147 HarrisonButker KC
2. 144 WilLutz NO
3. 141 JustinTucker BAL
4. 127 ZaneGonzalez ARI
5. 124 MattGay TB
CHIEFSMOSTPOINTS,SEASON
Rk. Pts. Player Year
1. 162 PriestHolmes 2003
2. 147 HarrisonButker 2019
3. 144 PriestHolmes 2002
4. 142 HarrisonButker 2017
5. 139 NickLowery 1990
6. 137 HarrisonButker 2018
CHIEFSMOSTPOINTS,CAREER
Rk. Pts. Player Year
1. 1,466 NickLowery 1983-93
2. 1,231 JanStenerud 1967-79
3. 787 HarrisonButker 2017-23
4. 517 RyanSuccup 2009-13
5. 500 PriestHolmes 2001-07
BUTKER KEEPING PACE
KHarrisonButkerowned763pointsinhisfirst90careergames,whichisthe mostinNFLhistorythroughakicker’sfirst90games.With93gamesnow notched,Butkerhastotaled787points.
NFLRECORDBOOK:POINTSSCORED,FIRST90GAMES
Rk. Player Points Team
1. HarrisonButker 763 KC
2. JustinTucker 749 BAL
3. WillLutz 745 NO
5. StephenGostkowski 734 NE
4. DanBailey 723 DAL
Since his arrival in 2013, Chiefs Assistant Head Coach/Special Teams Coordinator Dave Toub has had tremendous success with his coverage units.WithToub’sleadership,theChiefshaveallowedjustasinglePR/KR TDwhichtiesforthefewestacrosstheleague.
Toub’stworeturnTDsallowedsincethe2010seasonranksfirstamongall activeSpecialTeamsCoordinatorswhohaveledspecialteamsunitssince the2010season.
FEWESTRETURNTDSALLOWEDSINCE2010(ACTIVESTC)
QUALITY SPECIAL TEAMS PLAY
Overthepast11seasons(2013-23)underAssistantHeadCoach/Special TeamsCoordinatorDaveToub,theChiefsspecialteamsunitshaveperformedconsistently.Infact,overthatspan,theclubisfourthintheleaguein kickreturnaverageandtiedforthirdinpuntreturnaverage.Additionally,the Chiefshaveacombined14returntouchdowns,whichranksfirstintheNFL.
COMBINEDRETURNTOUCHDOWNS(SINCE2013)
Chiefs 28
SPECIAL TEAMS NOTES
Rk. Team KR Yds. Avg. TDs 1. Minnesota 361 8,956 24.8 8 2t. Indianapolis 352 8,696 24.7 2 Baltimore 321 7,916 24.7 5 4. KansasCity 386 9,487 24.6 6 5. Detroit 317 7,684 24.2 2
Rk. Team PR Yds. Avg. TDs 1. Baltimore 317 3,349 10.7 4 2. Detroit 279 2,828 10.1 8 3t. KansasCity 375 3,639 9.7 8 NewEngland 355 3,458 9.7 3 5. Chicago 274 2,614 9.5 5
KICKRETURNAVERAGE(SINCE2013)
PUNTRETURNAVERAGE(SINCE2013)
Rk. Team PRTDs KRTDs TotTDs 1. KansasCity 8 6 14 2. Minnesota 4 8 12 3. Detroit 8 2 10 4t. Baltimore 4 5 9 Philadelphia 5 4 9
FEWESTRETURNTDSALLOWEDSINCE2013 Rk. Team PR/KRTDs 1t. KansasCity 1 Atlanta 1 Dallas 1
Rk. STC Team TDs 1. DaveToub KC/CHI 2 2. RichBisaccia GB/LV/OAK/DAL/SD/TB 6 3. JohnFassel DAL/LAR/STL/OAK 6 4. JoeDeCamillis LAR/JAX/DEN/CHI/DAL 7 5t. MikePriefer CLE/MIN/DEN 8 DarrenRizzi NO/MIA 8 DarrinSimmons CIN 8
Date Type Opponent 12/25/05 PR GreenBay 9/30/07 KR Detroit 9/19/10 PR Dallas 9/29/20 KR Baltimore CONSISTENT COVERAGE WITH TOUB
TOUB–RETURNTDSALLOWEDSINCE2004(FEWESTINNFL)
CHIEFS IN THE POSTSEASON
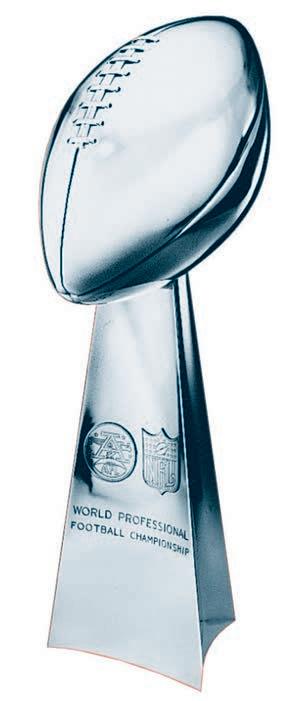

CHIEFS PLAYOFF APPEARANCES BY THE NUMBERS
RECORD VS. ALL PLAYOFF OPPONENTS
Chiefs 29
WorldChampionships 3(1969,2019,2022) AFLChampionships 3(1962,1966,1969) AFCChampionships 3(2019,2020,2022) AFLWestChamps 3(1962,1966,1968) AFCWestChamps 13(1971,1993,1995,1997,2003,2010,2016,2017,2018,2019,2020,2021,2022) TotalPlayoffGames 41 All-TimePlayoffRecord 20-21 YearsinPlayoffs 25 MostConsecutivePlayoffAppearances 8(2015-22) CurrentStreakofConsecutiveAppearances 8(2015-22)
TEAM RECORD LASTMEETING RESULT Baltimore 0-1 ’10AFCWildCard L,7-30 Buffalo 3-2 ’21AFCDivisional W,42-36(OT) Cincinnati 1-1 ’22AFCChampionship W,23-20 Cleveland 1-0 ’20AFCDivisional W,22-17 Denver 0-1 ’97AFCDivisional L,10-14 GreenBay 0-1 SuperBowlI L,10-35 Oilers/Titans 3-1 ’19AFCChampionship W,35-24 HoustonTexans 2-0 ’19AFCDivisional W,51-31 Indianapolis 1-4 ’18AFCDivisional W,31-13 Jacksonville 1-0 ’22AFCDivisional W,27-20 Miami 0-3 ’94AFCFirstRound L,17-27 Minnesota 1-0 SuperBowlIV W,23-7 NewEngland 0-2 ’18AFCChampionship L,31-37(OT) N.Y.Jets 1-1 ’86AFCWildCard L,15-35 Oak/LARaiders 2-1 ’91AFCFirstRound W,10-6 Philadelphia 1-0 SuperBowlLVII W,38-35 Pittsburgh 2-1 ’21AFCWildCard W,42-21 SanDiego 0-1 ’92AFCFirstRound L,0-17 SanFrancisco 1-0 SuperBowlLIV W,31-20 TampaBay 0-1 SuperBowlLV L,9-31 DATE OPPONENT GAME RESULT 12/23/62 Houston 1962AFLChampionship W,20-17(OT) 1/1/67 Buffalo 1966AFLChampionship W,31-7 1/15/67 GreenBay SuperBowlI(LosAngeles) L,10-35 12/22/68 Oakland 1968AFLDivisional L,6-41 12/20/69 N.Y.Jets 1969AFLDivisional W,13-6 1/4/70 Oakland 1969AFLChampionship W,17-7 1/11/70 Minnesota SuperBowlIV(NewOrleans) W,23-7 12/25/71 Miami 1971AFCDivisional L,24-27(2OT) 12/28/86 N.Y.Jets 1986AFCWildCard L,15-35 1/5/91 Miami 1990AFCWildCard L,16-17 12/28/91 L.A.Raiders 1991AFCWildCard W,10-6 1/5/92 Buffalo 1991AFCDivisional L,14-37 1/2/93 SanDiego 1992AFCWildCard L,0-17 1/8/94 Pittsburgh 1993AFCWildCard W,27-24(OT) 1/16/94 Houston 1993AFCDivisional W,28-20 1/23/94 Buffalo 1993AFCChampionship L,13-30 12/31/94 Miami 1994AFCWildCard L,17-27 1/7/96 Indianapolis 1995AFCDivisional L,7-10 1/4/98 Denver 1997AFCDivisional L,10-14 1/11/04 Indianapolis 2003AFCDivisional L,31-38 1/6/07 Indianapolis 2006AFCWildCard L,8-23 1/9/11 Baltimore 2010AFCWildCard L,7-30 1/4/14 Indianapolis 2013AFCWildCard L,44-45 1/9/16 Houston 2015AFCWildCard W,30-0 1/16/16 NewEngland 2015AFCDivisional L,20-27 1/15/17 Pittsburgh 2016AFCDivisional L,16-18 1/6/18 Tennessee 2017AFCWildCard L,21-22 1/12/19 Indianapolis 2018AFCDivisional W,31-13 1/20/19 NewEngland 2018AFCChampionship L,31-37(OT) 1/12/20 Houston 2019AFCDivisional W,51-31 1/19/20 Tennessee 2019AFCChampionship W,35-24 2/2/20 SanFrancisco SuperBowlLIV(Miami) W,31-20 1/17/21 Cleveland 2020AFCDivisional W,22-17 1/24/21 Buffalo 2020AFCChampionship W,38-24 2/7/21 TampaBay SuperBowlLV(Tampa) L,9-31 1/16/22 Pittsburgh 2021AFCWildCard W,42-21 1/23/22 Buffalo 2021AFCDivisional W,42-36(OT) 1/30/22 Cincinnati 2021AFCChampionship L,24-27(OT) 1/21/23 Jacksonville 2022AFCDivisional W,27-20 1/29/23 Cincinnati 2022AFCChampionship W,23-20 2/12/23 Philadephia SuperBowlLVII(Arizona) W,38-35
- Bold Denotes Home Games
CHIEFS ALL-TIME YEAR-BY-YEAR RESULTS
OWNERSHIP OF 60+ YEARS
TheChiefsareoneofonlyfivecurrentNFLfranchisesthathavebeen ownedbythesameindividualfamilyforover60years.
THE FIRST LADY OF FOOTBALL
NormaHuntplayedanintegralpartoftheChiefsinKansasCity.Sheowned the distinction of being the only woman known to have attended all 57 SuperBowlsbeforeherpassingandwasselectedtopresideoverthecoin tossatSuperBowlXLIalongwithProFootballHallofFamequarterback DanMarino.Shewasinvolvedinnumerousphilanthropicandcivicefforts inKansasCityandTexas.Herhusband,LamarHunt,wastheguidingforce behindtheformationoftheKansasCityChiefsandtheAmericanFootball LeagueandwasinductedintotheProFootballHallofFamein1972.He, withthehelpofhisfamily,coinedtheterm“SuperBowl.”
Chiefs 30 YEAR PRESEASON REG. SEASON PLAYOFFS 1960 6-0 8-6 0-0 1961 4-1 6-8 0-0 1962 2-3 11-3 1-0 1963 3-2.......................5-7-2........................0-0 1964 4-1 7-7 0-0 1965 3-2.......................7-5-2........................0-0 1966 4-0 11-2-1 1-1(SB loss) 1967 4-1 .........................9-5 .........................0-0 1968 4-1 12-2 0-1 1969 6-0........................11-3 ................ 3-0 (SB win) 1970 4-3 7-5-2 0-0 1971 4-1-1 ....................10-3-1.......................0-1 1972 5-2 8-6 0-0 1973 2-4 .......................7-5-2........................0-0 1974 3-3 5-9 0-0 1975 3-3.........................5-9 .........................0-0 1976 2-4 5-9 0-0 1977 3-3........................2-12 ........................0-0 1978 2-2 4-12 0-0 1979 3-1.........................7-9 .........................0-0 1980 3-1 8-8 0-0 1981 1-3 9-7 0-0 1982 2-1-1 3-6 0-0 1983 2-2 6-10 0-0 1984 1-3 8-8 0-0 1985 3-1 6-10 0-0 1986 2-2 10-6 0-1 1987 4-1 4-11 0-0 1988 2-1-1 4-11-1 0-0 1989 1-3 8-7-1 0-0 1990 1-3 11-5 0-1 1991 2-2 10-6 1-1 1992 1-3 10-6 0-1 1993 3-1 11-5 2-1 1994 2-3 9-7 0-1 1995 3-1 13-3 0-1 1996 3-1 9-7 0-0 1997 1-3 13-3 0-1 1998 2-3 7-9 0-0 1999 2-2 9-7 0-0 2000 0-4 7-9 0-0 2001 2-2 6-10 0-0 2002 3-1 8-8 0-0 2003 3-2 13-3 0-1 2004 1-3 7-9 0-0 2005 0-4 10-6 0-0 2006 2-2 9-7 0-1 2007 0-4 4-12 0-0 2008 2-2 2-14 0-0 2009 0-4 4-12 0-0 2010 1-3 10-6 0-1 2011 0-4 7-9 0-0 2012 1-3........................2-14 ........................0-0 2013 2-2 11-5 0-1 2014 1-3.........................9-7 .........................0-0 2015 4-0 11-5 1-1 2016 2-2........................12-4 ........................0-1 2017 2-2 10-6 0-1 2018 2-2........................12-4 ........................1-1 2019 1-3 12-4 3-0 (SB win) 2020 0-0........................14-2 ............ 2-1 (SB loss) 2021 3-0 12-5 2-1 2022 2-1........................14-3 .............3-0 (SB win) 2023 2-1 2-1 TBD
Ownership Franchise Years HalasFamily ChicagoBears 102 BidwillFamily ArizonaCardinals 91 RooneyFamily PittsburghSteelers 90 HuntFamily KansasCityChiefs 64 AdamsFamily TennesseeTitans 64
STADIUM
TOP CROWDS AT ARROWHEAD
(RegularSeasonandPlayoffs)
OnMonday,Sept.29,2014,KansasCitydefeatedtheNewEngland Patriots41-14,andChiefsfanssetaGuinnessWorldRecordforLoudestCrowdRoarataSportsStadium(Outdoors).Chiefsfansreacheda peakdecibelreadingof142.2asGuinnessWorldRecordsadjudicator PhilipRobertsonmonitoredthesoundlevels.Themarkwassetearly inthecontestwhiletheclubwasondefense.TheArrowheadStadium record passed the old record of 137.5 decibels and broke Seattle’s recordof137.6.TheChiefsstillholdtherecordsevenyearslater.
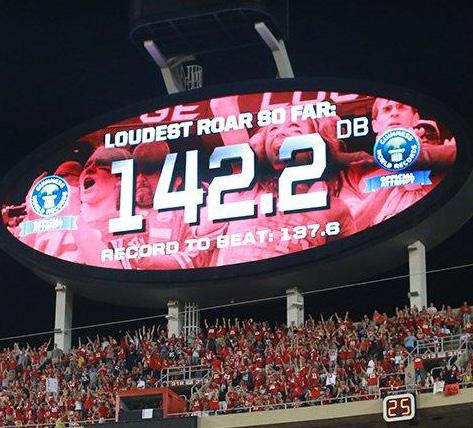
“Thefans,they’rephenomenal.142.2decibels,IneverthoughtIwouldbe firedup(for)decibellevelsbutI’mfiredupforthem.Myearsarestillringing, Imeanitwasloud,louddownthere.Likeincrediblyloud.”
-ChiefsHeadCoachAndyReid
“One hundred percent. Whenever you can go out in pregame warmups and feed on the energy because the fans are there packing the stadium thatearly,ittrulyisspecial.Wefeedoffthattheentiregame.There’snot anemptyseatinthestandsandIknowtherewon’tbeanemptyseatinArrowheadthisweek.I’mexcitedjusttobeinfrontofthatcrowdplayingthis AFCChampionship.”
-ChiefsQBPatrickMahomes
“AlegendaryenvironmentlikethatatArrowheadStadiumissomethingelse. We’reexcitedaboutit,werespectit,werealizethattheenvironmentisan issueandanelementofplayandit’ssomethingthatweneedtobepreparedforandultimatelycombat.”
-SteelersHeadCoachMikeTomlin
“Ithoughtthefanswereexcellent.Nobodyleftandeverybodystayed,and theywereloudandthatdefinitelyhelped.LikeImentioned,theywereable togetapuntertobobbletheball.That’sanattributetothemandtheenergy theyweredeliveringthere,butweappreciateeverybitofthat,andlikeI mentionedlastnight,myhatgoesofftothem.They’rethebestintheNFL. It’sgreattobeapartof.”
–HeadCoachAndyReid
“Yeah,listen,itwaslouddownthere—very,veryloud.Youguyswerethere, soyouknow.Itwasthatkindofatmosphere.Ithinkyouwatchedallthecollegegamesandyoufeltthat.Arrowheadisloudanyways—howyouload thisthingupandyousayyoucan’tcomehereforayearyouknow,andyou justopenthegates.”
–HeadCoachAndyReid
“YeahIthinkit’skindofwhatIsaidit’sthebeliefwehaveineachother.We believeasanoffensethatthedefenseisgoingtogetastopwhenitcomes toitandthedefensebelievesthatwe’regoingtogodownthereandfinda waytoscore.So,Ithinkthatbeliefineachotherandgoingoutthereand battlingisgoodforourfootballteam.WhatIthinkmadeitfeellikeaplayoff gamewasourcrowd.Imeanitwasinsane,probablyoneofthebestcrowds I’veseensinceI’vebeenhere.Ithinkthatwasamomentumswinginthe gamethatkindofgotinourfavor.”
–QBPatrickMahomes
Chiefs 31
THE ARROWHEAD ADVANTAGE
THIS IS OUR HOUSE - GEHA FIELD AT ARROWHEADCHIEFS FANS SET WORLD RECORD
Date Opponent Attendance Oct.2,2000 Seattle 82,893* Nov.5,1972 Oakland 82,094 Sept.11,1994 SanFrancisco 79,907 Sept.17,1972 Miami 79,829 Nov.23,2006 Denver 79,484 Sept.22,1996 Denver 79,439 Oct.26,1998 Pittsburgh 79,431 Oct.9,1995 SanDiego 79,288 Sept.8,1996 Oakland 79,281 Nov.10,1996 GreenBay 79,281 Oct.7,1996 Pittsburgh 79,189 Jan.11,2004 Indianapolis 79,159
LamarHuntleftanindeliblemarkonprofessionalfootball.WhileHuntmademanylastingcontributionstothegame,partofhislegacywillbehis“accidental” namingofprofootball’smostimportantcontest,theSuperBowl.Asthestoryhasbeentoldandretoldovertheyears,someofthefactshavegottenlost alongtheway.HerearesomeofthemostimportantelementsofthetaleinhowtheSuperBowlgotitsname...
CHIEFS HOFERS FROM SB IV
PriortoSuperBowlLIV,ithadbeen50yearssincetheKansasCity ChiefsplayedinaSuperBowl(IV).ThatgameservedasthefinalAFLNFLWorldChampionshipGameinthehistoryofprofessionalfootball. ThespectacleatTulaneStadiuminNewOrleans,La.,helpedpavethe wayfortheeventualAFL-NFLmergerlaterthatyear(1970).
• AftertheAFL-NFLmergerwasannouncedinJuneof1966,Commissioner PeteRozelleappointedacommitteeconsistingofhimself,LamarHunt (KansasCity),TexSchramm(Dallas)andtwootherownersfromeach league(AFL&NFL)tofirmupthedetailsofthemergeragreement.
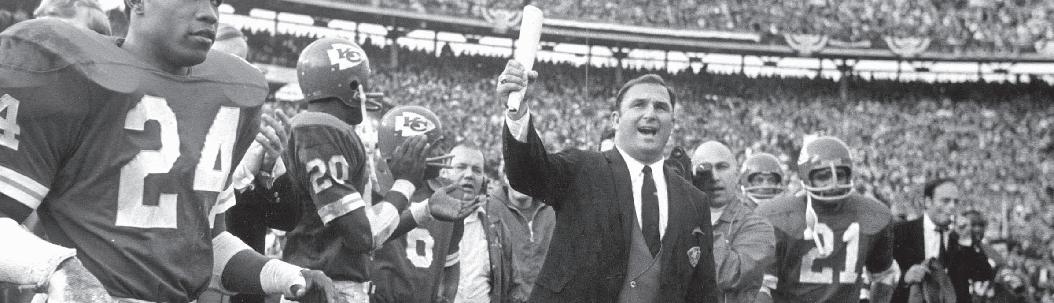
• Atoneofthoseinitialmergermeetings,therewasadiscussionaboutthe dateofthegame.Asthecommitteediscussedthechampionshipgame (which ultimately became referenced as the Super Bowl), there was some confusion on whether the parties were discussing the respective AFLandNFLtitlegamesorthegamebetweenthetwoleagues.Itwas thenthatHuntfirstrecalledsaying,“Youknow,thelastgame,thefinal game...theSuperBowl.”
• The“inspiration”forHunt’swhimsicalsuggestionwasthehigh-bouncing “SuperBall”producedbytheWham-Ocompany.Lamar’swife,Norma, hadpreviouslypurchasedoneforeachoftheHuntchildren(LamarJr., ClarkandSharron)andthetoyhadbecomesomewhatofacrazeinthe Hunthouseholdandmanyotherhomesacrossthecountry.
• Huntwaslaterquotedassaying,“Nobodyeversaidlet’smakethatthe nameofthegame.Farfromit,weallagreeditwasfartoocornytobethe nameofthenewtitlegame.”
• In a letter from Hunt to Rozelle on July 25, 1966, Hunt urged the commissioner to “coin a phrase” for the title game between the two leagues. In the letter, Hunt said, “I have kiddingly called it the Super Bowl,whichcanobviouslybeimprovedupon.”
• RozelleagreedwithHunt’ssuggestionsincehehadaparticulardisdain fortheterm“super.”AccordingtolongtimeNFLexecutiveDonWeiss, RozellewasaformerPRmanwhohadakeenappreciationofgrammar. InRozelle’sbook,“super”wastheequivalentof“geewhiz”or“neat.”He believedthattheterm“SuperBowl”hadnosophisticationwhatsoever.
• Rozelle was initially inclined to call the game the “Pro Bowl,” but that monikerwasalreadyassignedtotheNFL’sannualall-starcontest.
• Intheyearsleadinguptothemerger,manymembersofthemediahad billedapossiblechampionshipmatch-upbetweenthetworivalleagues asa“WorldSeriesofFootball,”butRozelleclearlydidnotwanttohave hisgameassociatedwithbaseball.
• After much consternation and debate, Rozelle eventually dubbed the title contest between the two leagues as “The AFL-NFL World ChampionshipGame.”However,Hunt’swhimsical,off-the-cuffcomment hadtakenroot.Intheweeksleadinguptothegame,headlinewriters hadalreadyadaptedHunt’stwo-wordtitleoverthemuchmoreverbose officialmonikerforthegame.TheTVnetworksbilledthegameas“Super Sunday”andevenNFLFilmstaggedtheirfilmreelsasbeingdesignated forthe“SuperBowl.”
• After the first two “AFL-NFL World Championship Games,” the term “SuperBowl”wasofficiallyadoptedbyCommissionerRozelleandthe NFL.ThefirstgametoofficiallybedesignatedastheSuperBowlatthe timeitwasplayedwasSuperBowlIIIbetweentheAFL’sJetsandthe NFL’sColts.Thefirsttwochampionshipgameswereretroactivelynamed SuperBowlsI&II.
Inall,17membersfromboththeChiefsandtheVikingsthattookpart inSuperBowlIVwerelaterinductedintotheProFootballHallofFame inCanton,Ohio,includingbothheadcoaches,HankStramandBud Grant, as well as Chiefs Founder Lamar Hunt and Vikings General ManagerJimFinks.FortheChiefs,10membersoftheSuperBowlIV ChampionshipwerelaterenshrinedintothehallowedhallsinCanton.
•LB/DEBobbyBell
•DTBuckBuchanan
•DTCurleyCulp
•QBLenDawson
•LBWillieLanier
•SJohnnyRobinson
•KJanStenerud
•CBEmmittThomas
•HeadCoachHankStram
•ChiefsFounderLamarHunt
TheKansasCityChiefswereproudtointroducetheNormaHuntTraining CampFellowshipProgramthatbeganin2021.Namedafterthematriarch oftheteamandtheonlyknownwomantoattendall57SuperBowls,the fellowshipopportunityispartoftheChiefscommitmenttodiversityand inclusion.
The positions actively expand NFL front office career opportunities for women by annually hiring female candidates into the club’s personnel department.
TheNormaHuntTrainingCampFellowshipProgramincludesexposure inproandcollegescouting,freeagenttryouts,salarycapandcontracts, teamoperations,playerengagementandotherdepartmentswithinfootball operations.
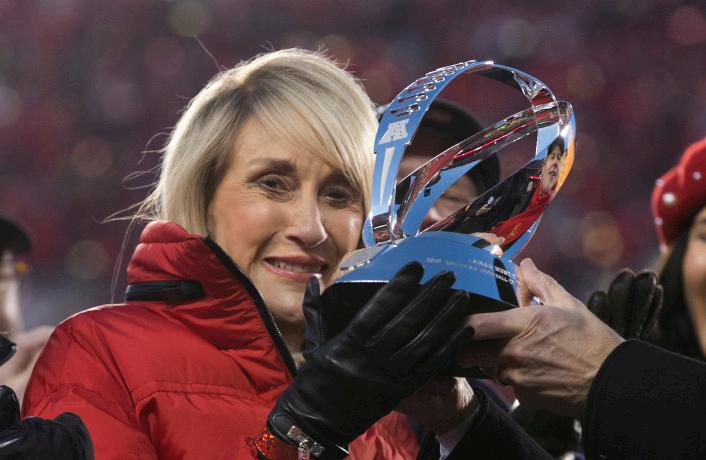
Chiefs 32 THE ORIGIN OF SUPER BOWL & SUPER BOWL IV
NORMA HUNT FELLOWSHIP PROGRAM
CHIEFS — Stenerud,48-yardFG.

CHIEFS — Stenerud,32-yardFG.
CHIEFS — Stenerud,25-yardFG.
CHIEFS — Garrett,5-yardrun(Stenerudkick).
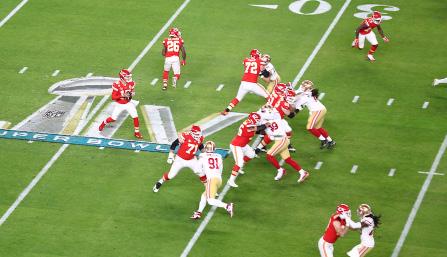
VIKINGS — Osborn,4-yardrun(Coxkick).

CHIEFS — Taylor,46-yardpassfromDawson(Stenerudkick).
49ERS — Gould,38-yardfieldgoal(10-62,5:58).
CHIEFS — Mahomes,1-yardrun(Butkerkick)(15-75,7:26).
CHIEFS — Butker,31-yardfieldgoal(9-43,4:36).
49ERS — Juszczyk,15-yardpassfromGaroppolo (Gouldkick)(7-80,4:27).
49ERS — Gould,42-yardfieldgoal(9-60,5:31).
49ERS — Mostert,1-yardrun(Gouldkick)(6-55,2:48).
CHIEFS — Kelce,1-yardpassfromMahomes(Butkerkick) (10-83,2:40).

CHIEFS — Dam.Williams,5-yardpassfromMahomes (Butkerkick)(7-65,2:26).
CHIEFS — Dam.Williams,38-yardrun(Butkerkick) (2-42,0:13).
KansasCity’sfinestsportshourconcludedat5:20intheafternoon ofSunday,January11,1970,whentheChiefsdefeatedtheMinnesota Vikings,23-7,fortheWorldChampionshipofprofootball.
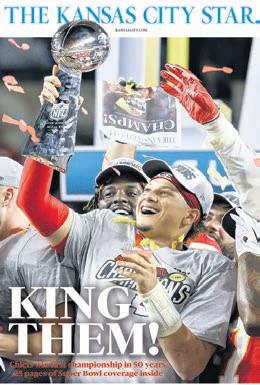
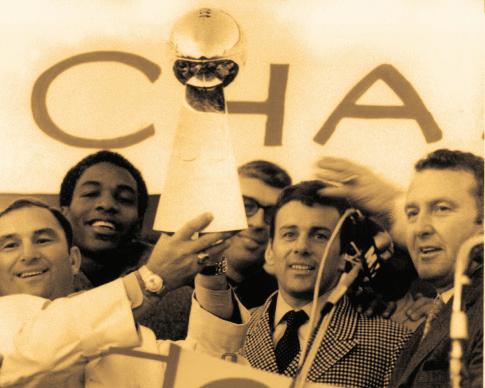
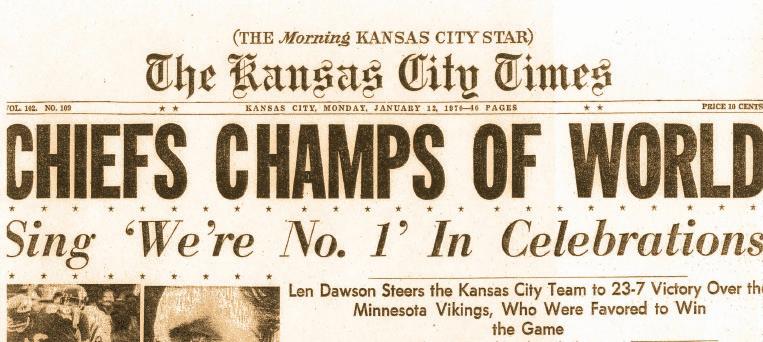
TheChiefs,whofinished11-3ontheseasonanddefeatedtheN.Y. JetsandOaklandRaidersintheplayoffs,closedouttheirfirstdecade asthewinningestteamintheAmericanFootballLeague,which,with Super Bowl IV, came to an end. Beginning in ’70, the two leagues merged,withtheAFLbecomingtheAmericanFootballConferenceof theNFL.

Minnesota, a prohibitive favorite, was 12-2 during the regular season and at one point had won 12 games in succession behind a fearsomedefensethathadallowedanaverageofjust9.5pointsper game.ButbehindQBLenDawson–whowouldearnthegame’sMost ValuablePlayerAward–theChiefswouldamassmorethanenough offensetocarrytheday.
TheKansasCityChiefssquaredoffagainsttheNFCChampionSan Francisco49ersinSuperBowlLIVatHardRockStadium,thehomeof theMiamiDolhpins,inMiamiGardens,Florida,onSunday,February 2,2020.Itmarkedtheclub’sthirdSuperBowlappearance(I,IVand LIV),butthefirstappearancefortheclubsincewinningSuperBowlIV againsttheMinnesotaVikingsfollowingthe1969season.
The 10-point fourth-quarter comeback tied for the second-largest comebackinSuperBowlhistoryandtheChiefsbecamethefirstteam torecordthreecomebacksofatleast10pointsinasinglepostseason inNFLhistory.
QB Patrick Mahomes was awarded the Pete Rozelle Trophy as MVPofthegame.At24yearsand138daysold,Mahomesbecame the youngest QB and the third-youngest player (Marcus Allen and LynnSwann)towintheSuperBowlMVPaward.
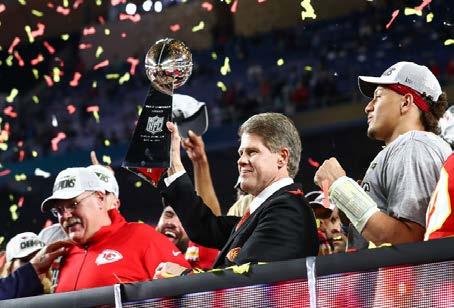
Chiefs 33
January 11, 1970 • Tulane Stadium • 80,562
February 2, 2020 • Hard Rock Stadium • 62,417 MINNESOTA ........ 0 0 7 0 — 7 KANSAS CITY....... 3 13 7 0 — 23
SUPER BOWL IV IV Chiefs 23, Vikings 7 Chiefs 23, 7
SUPER BOWL LIV LIV Chiefs 31, 49ers 20
TEAMSTATISTICS VIKINGS CHIEFS FirstDowns 13 18 TotalNetYards 239 273 Rushes/NetYards 19/67 41/151 NetPassing 172 122 PassAttempts/Completions 28/17 17/12 HadIntercepted 3 1 Sacked/YardsLost 3/27 3/20 Punts/Average 3/37.0 4/48.5 Penalties/Yards .................... 6/67 4/47 Fumbles/Lost 3/2 0/0 SAN FRANCISCO .....3 7 10 0 — 20 KANSAS CITY........7 3 0 21 — 31
TEAMSTATISTICS 49ERS CHIEFS FirstDowns 21 26 TotalNetYards .................... 351 397 Rushes/NetYards 22/141 29/129 NetPassing 210 268 PassAttempts/Completions 31/20 42/26 HadIntercepted 2 2 TimesSacked/Yards 1/9 4/18 Punts/Average 2/43.0 2/50.0 Penalties/Yards 5/45 4/24 Fumbles/Lost ....................... 1/0 3/0 PossessionTime 26:47 33:13
0,No .1 39 KANSASCIT CEBOOK. YST AR .C OM /K Classified Co mics 8B FY Opinion 10A TV 10B CUSTOM portdeliveryissues, 96 782 7or ka nsascity .co m/customer-service AZadiaz@miamiherald.com wrld CH AMP IO NS
On March 4, 2021, the Kansas City Chiefs and GEHA (Government Employees Health Association, Inc., pronounced G.E.H.A.) jointly announced a historic naming rights agreement that made the nonprofit medicalanddentalplanproviderthefirst-andexclusive-namingrights partnerforArrowheadStadium.Beginningwiththe2021season,thehome oftheChiefsbecameGEHAFieldatArrowheadStadium.
The announcement expanded on an already robust partnership between GEHAandtheChiefs,whichhadgrownsignificantlysincetherelationship wasfirstannouncedinJuly2019,whenGEHAbecametheclub’sExclusive Health,DentalandVisionPlanPartner.Theagreementalsohighlightedthe commitmentofbothGEHAandtheChiefstoensuringArrowheadStadium remainedpartoftheidentityofthestadium.
“We are extremely proud and excited to announce our naming rights agreementwithGEHA.Whenwesetouttofindapartnerforthefieldat Arrowhead,itwascriticaltoidentifyanationalleaderthatsharesourcore values,aswellasadeepconnectiontothelocalcommunityandrespect forChiefsKingdom,”ChiefsPresidentMarkDonovansaidatthetimeofthe announcement.“OurrelationshipwithGEHAoverthelastfewyearshas onlyservedtoreinforcethealignmentbetweenourtwoorganizationsand proven their strong, long-standing relationship with the local community. Thisexpandedpartnershipwillcontinuetobuildlastinghealthandwellness programsthatsupporttheteam,GEHAandourcommunity.”

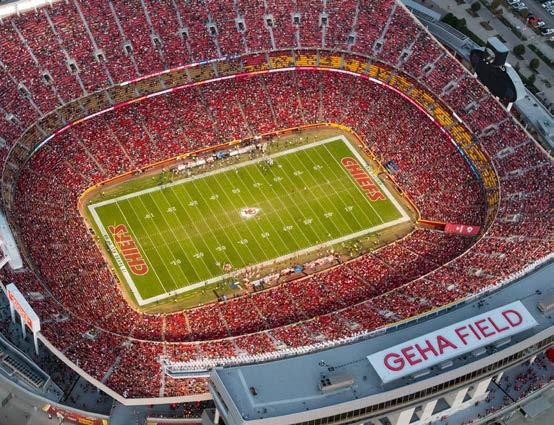
GEHA is a national leader in providing medical and dental plans to more than 2 million federal employees, retired military and their families worldwide.BothGEHAandtheChiefsaredeeplycommittedtopromoting their missions of driving and supporting health and wellness and this naming rights agreement provides a highly visible platform to support GEHA’seffortstoempoweritsmemberstobehealthyandwell.
Throughout the 2021 offseason, team and stadium staff worked with GEHAand Kansas City-based architecture and design firm Populous on the development of a signage package and plan that ensured that both temporaryandlong-termGEHAFieldatArrowheadStadiumbrandingand logoassetswereinplacebythekickoffofthe2021Chiefsseason-the 50thseasonfortheChiefsintheiconicstadium.
We were looking for the right partner. We were looking for someone who has a base and an impact in this community. We found a company in GEHA who not only had been here longer than us, but were bigger than anyone knew, and no one knew about them. And then they have a story that is so Kansas City. To be about to partner with that company, to use our assets to build their brand, you don’t really find that very often.
-Chiefs President Mark Donovan
THE STADIUM SINCE 2000, AT A GLANCE
The stadium opened its doors for the first time on Aug. 12, 1972 as the Chiefs hosted the St. Louis Cardinals in front of 78,190 fans for a preseasongame.Sincethatinitialcontest,muchhaschangedattheiconic venue through multiple renovation projects and upgrades to the facility. While many modernizations have taken place, the spirit of the stadium remainsthesameasitwasforthatfirstpreseasonfootballgamein1972.
2006: OnApril 4, 2006, Jackson County, Mo., taxpayers approved a 3/8 cent sales tax that was expected to raise $425 million for improvements totheSportsComplex,including$212.5millionforArrowhead.TheState of Missouri also contributed $37.5 million. In addition, the Hunt family contributed$125milliontotheproject.
2010: Upgradeswereofficiallydonepriortothestartofthe2010season andincludedFounder’sPlaza,theFordFanZone,theChiefsSportsLab, theChiefsHallofHonor,theFounder’sClub,theCommunityAmericaClub Level and anew teamstore.Otherimprovements included anupgraded sound and scoreboard system, a 360-degree video ribbon board and concoursesthatweredoubledinsize.
2013: The club introduced a stadium-wide Wi-Fi network, installing 600 high-densitywirelessaccesspointsaspartofaseven-figureinvestmentto createamorefullyintegratedmobileexperienceforChiefsfans.Stadium Wi-FichangedthewayfansconsumedChiefscontentin-stadiumandalso changed the way fans interact with the team and each other. The Wi-Fi networkreceivedadditionalupgradesin2017and2018.
2016: In the spring of 2016, the club finished a three-year, multi-million dollarheatingsysteminstallationundertheplayingsurfaceofthestadium. Theprojectincludedanewboilerroomonthestadium’sservicelevel,as well as thousands of feet of pipe snaking sideline-to-sideline underneath the natural grass surface. The system allows the club to maintain consistent soil temperatures during the cold winter months late in the footballseasonandallowstheclubtomaximizegrassgrowingbasedon thetimeofyearaswell.
2019: Prior to the 2019 season, the Chiefs committed more than $10 million in upgrades to the stadium, including concrete repairs and new waterproofingmeasuresinthestadium’supperlevel.Inaddition,theclub replaced nearly all seats in the upper deck.The club also upgraded the technologyinthewestscoreboardtostate-of-the-artLEDtechnologythat offersanenhancedscreenimageforfansin-stadium.Theteamintroduced theGEHADrumDeck,movingtheclub’spregamedrumtraditionfromfieldleveltoamoreprominentlocationintheupperdeckinthewestendzone.
2020: IntheweekfollowingKansasCity’sAFCChampionshipvictoryon Jan.19,2020,theclubannouncedmultipleoffseasonprojectsforthe2020 season,includingnewseatsinthelowerbowl,atechnologyupgradetothe eastendzonescoreboard,enclosingmultipleopen-airfieldboxsuites,and anexpandedTeamStore.
2021: Theclubfinishedthethirdphaseofthethree-yearseatreplacement projectbyinstallingallnewseatsontheCommunityAmericaClubLevel. Theteamalsocompletedamassiverenovationtothehomelockerroom complex inside the stadium, including not only the Chiefs locker room, but the equipment room, athletic training room and the coaches’ locker rooms. After a decade as the preeminent space dedicated to Chiefs and AFLhistory,theChiefsHallofHonoronthelowerlevelconcourseofthe stadium received a substantial upgrade, providing a more upscale, fully enclosed,temperature-controlledmuseumexperiencewhilecreatinganew specialeventsspace.
While other venues of a similar vintage have long since been termed obsolete,thankstotheforesightandvisionoftheleadershipofJackson County, the Hunt family, the Chiefs and the taxpayers who made it a reality,GEHAFieldatArrowheadStadiumremainsoneofthemosticonic stadiumsintheNFL.Theinvestmentsandimprovementsovertimeensure it is not only one of the nation’s top venues for fans to experience the excitementoftheNFL,butisalsoayear-roundentertainmentdestination servingtheentireMidwestregion.
Chiefs 34 GEHA FIELD AT ARROWHEAD STADIUM
“
”
ARROWHEAD EVENTS HAS BANNER SEASONCHIEFS AND MAHOMES EARN ESPYS
TheKansasCityChiefswererecognizedwiththreeawardsattheannual ESPYS on the evening of Wednesday, July 12, as the defending Super Bowlchampionscontinuedwhathasbeenanoffseasontoremember.
The Chiefs earned the nod for “Best Team” while quarterback Patrick Mahomes was recognized with ESPYS in both categories he was nominatedin,“BestAthlete,Men’sSports”and“BestNFLPlayer.”
Kansas City won “Best Team” honors over the Denver Nuggets (NBA), theGeorgiaBulldogs(collegefootball),theLasVegasAces(WNBA),the LSUTigers(women’scollegebasketball),theOklahomaSooners(college softball)andtheVegasGoldenKnights(NHL).
Arrowhead Events, the special events are of the Kansas City Chiefs organization, has seen exponential growth over the past decade. The businessrecordeditslargestandmostsuccessfulyearin2023,scheduling sixshowsacrossfivemajorconcerttoursfromthreedifferentpromoters.
Focusing on delivering diverse styles, genders and ages in the venue’s acts,thestadiumhasplayedhosttoLukeCombs,twonightsofTaylorSwift | The Eras tour, which drew more than 135,000 guests across the shows onback-to-backnights,andEdSheeran.TheGEHAFieldatArrowhead StadiumstagewillalsoplayhosttoBillyJoelandStevieNicksinAugust andBeyoncéinOctober.
Arrowhead Events also welcomed Monster Jam to GEHA Field at ArrowheadStadiumforafourthyearandhostedthethird-annualQBBQ Fest-KansasCityontheplayingsurfactatthestadium.
Mahomes,meanwhile,continuedhissweepofthe2022-23awardscircuit by beating out Nikola Jokic (Denver Nuggets, NBA),Aaron Judge (New YorkYankees,MLB)andLionelMessi(Argentina,soccer)for“BestAthlete, Men’s Sports” recognition. The reigning NFLand Super Bowl MVP also besteddefensiveendNickBosa(SanFrancisco),quarterbackJalenHurts (Philadelphia) and wide receiver Justin Jefferson (Minnesota) to win the “BestNFLPlayer”award.
TheESPYS–whichstandsfor“ExcellenceinSportsPerformanceYearly” –haverecognizedthetopathletesandindividualsintheworldofsports since1993.ThismarkedthefirsttimethatKansasCityearned“BestTeam” honors,whichisoneoftheevent’smostprestigiousawards.
CHIEFS RECOGNIZE ALUMNI PLAYERS AT CAMP
Twenty-two former Chiefs players representing multiple eras of Chiefs football attended Chiefs Training Camp presented by Mosaic Life Care on Monday, July 31 for the club’s annual Alumni Day.
The alumni watched practice from a tailgate suite overlooking the action on the fields before heading onto the field at the end of practice, where they were introduced by Head Coach Andy Reid and helped break down the postpractice huddle along current Chiefs players.
“This organization has always been like a family to me,” said Chiefs Hall of Fame DB Deron Cherry. “That’s the way Lamar was. He always respected the players and wanted to make sure that there was a continuation with the legacy of the former players who were here and paved the way. The Hunt family has kept that tradition alive. We’re still a family, and the older players –the guys who used to be here – are part of that. It’s really special.”
Pictured below is former C Jack Rudnay along with current centers Creed Humphrey (52) and Austin Reiter (61).
Chiefs 35
June10,2023 July7-8,2023 August5,2023
CHIEFS KINGDOM’S CROWN JEWEL
For the third time in franchise history, and the second time in four years, the Kansas City Chiefs commissioned Jostens to commemorate a world championship season with a Super Bowl ring.
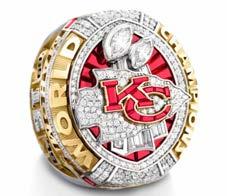
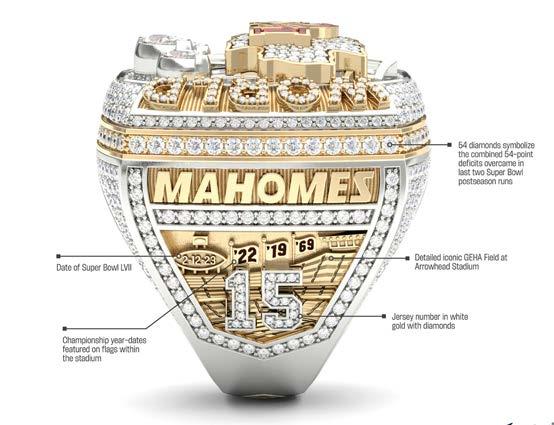
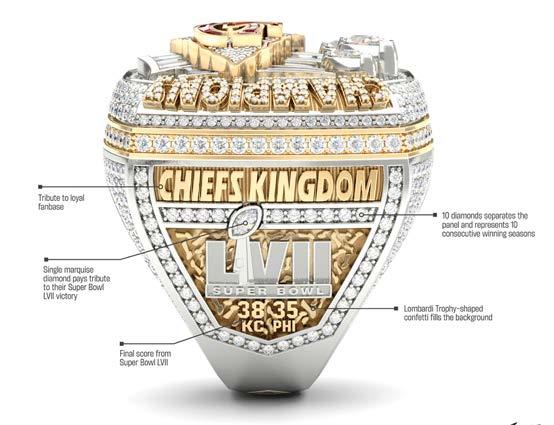
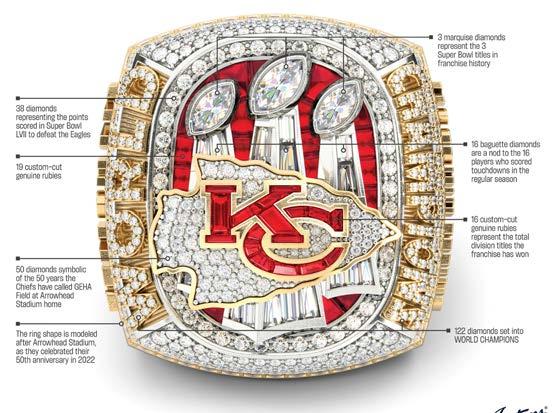
The club’s Super Bowl LVII ring is rich in its storytelling and contains countless artful details that hold significance and symbolism for the Hunt family, the Chiefs organization, as well as the team’s players, coaches and staff.
“Winning a Super Bowl is the crowning achievement for an NFL club, and the championship ring is the ultimate symbol of the hard work, dedication and sacrifice that it takes from everyone in the organization to reach this pinnacle,” Chiefs President Mark Donovan said at the time the ring was unveiled. “Our organization has trusted Jostens to create all three of our franchise’s Super Bowl rings, dating back to our first win in Super Bowl IV, as well as our recent win in Super Bowl LIV. From ownership to the players who were consulted in the design process for this year’s Super Bowl LVII ring, we are thrilled with how Jostens brought this meaningful design to life, and we are extremely proud of what this ring represents for every player, coach, and staff member, as well as all of Chiefs Kingdom.”

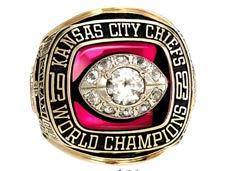
In addition to the unique details, the 16-plus carat ring is crafted in brilliant 10-karat white and yellow gold and contains more than 600 diamonds, 35 custom-cut genuine rubies.
CHAMPIONSHIP RINGS THROUGH THE YEARS
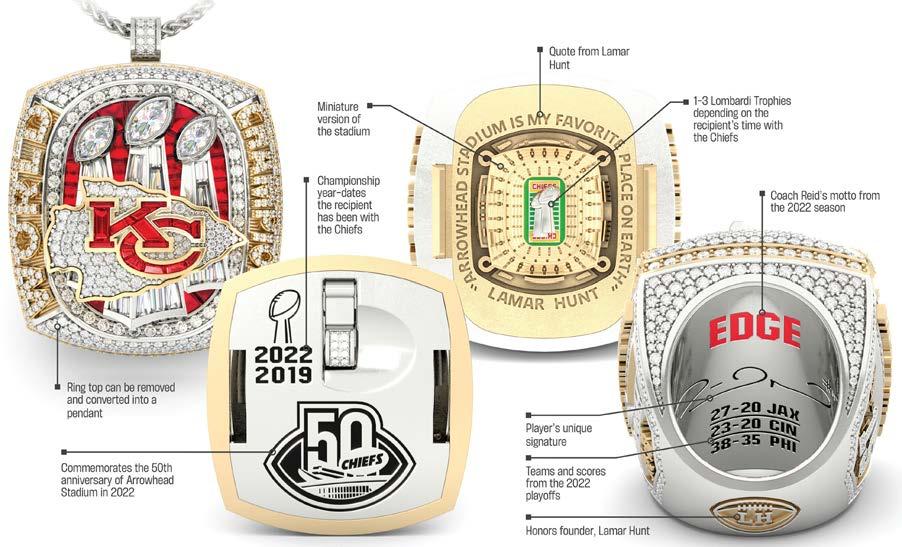
Chiefs 36
All ring images courtesy of Jostens.
CHIEFS TAKE ADVANTAGE OF SUPER BOWL LVII CELEBRATIONS
Followingtheclub’svictoryinSuperBowlLVIIinArizona,theteamreturned to Kansas City and scheduled the second championship parade of of thepastfouryearsandinvitedallofChiefsKingomtojoindowntownto celebrate.
Liketheparadefollowingtheteam’sSuperBowlLIVvictory,busesleftthe riverfrontandenteredtheparade routeat6thSt.andGrandindowntown KansasCity.Buseswithplayers,coachesandstafftookGrandtoPershing RoadbeforestoppingatUnionStationfortherally.
OnThursday,June15,eveningthat the team wrapped up mandatory minicamp for the 2023 offseason program,everyonefromtheChiefs organization - including players, coaches and staff - gathered at Union Station for the club’s Super Bowl LVII Ring Ceremony hosted by Clark and Tavia Hunt and the HuntFamily.
Guests were met with a red carpet welcome outside the historic Kansas City landmark, before moving inside for the private reception and event. A dinner was followed by the ring unboxing, as well as performances by Metro Boomin,FloRidaandLoudLuxury.

OnJune5,2023,theChiefswerewelcomedtothe“People’sHouse”by PresidentJoeBiden.FollowinglunchandatouroftheStateFloorofthe WhiteHouse,theteamwaswelcomedontotheSouthLawnforaspecial recognitionandremarksbythePresident,aswellascommentsfromHead Coach Andy Reid and President Mark Donovan. QB Patrick Mahomes andTETravisKelcepresentedBiden,thecountry’s46thPresident,witha custom46jerseyduringtheceremony.

Chiefs 37
On Friday, RB Isiah Pacheco joined with the Chiefs and the YMCA of greaterKansasCitytopartnerwithLittleCaesarsandtheLittleCaesars LoveKitchen,abigrigpizzakitchenonwheels,toprovidepizzamealsto approximately200peopleinneed.Theeventalsoincludedlawngames for kids, tours of GEHAField atArrowhead Stadium, and entertainment providedbytheChiefsCheerleadersandKCWolf.TheLittleCaesarsLove Kitchenhasservednearly4millionpeopleinthe48contiguousstatesand fourCanadianprovinces.
On Monday, LB Nick Bolton partnered with Campell’s Chunky to pack boxesoffoodatHarvestersFoodBankaspartofChunkySacksHunger, the brand’s community platform aimed at ending food insecurity. This NFLseason,ChunkywillbeworkingwithBoltonandotherNFLdefensive playersacrosstheNFL-calledtheSoupSquad-todonateovertwomillion mealstopeopleinneed.Additionally,Campbell’sChunkyandBoltonwill continuetheirsupportofHarvestersFoodBankallseasonlongbydonating 1,000Campbell’sproducteseverytimetheChiefsrecordasack.
ANNOUNCE COACH OF THE WEEK HONORS
TheKansasCityChiefshaveannouncedtheCoachoftheWeekhonors forthethirdweekofthe2023season.TheWeekThreeawardsgotoSt. JosephCentralHeadCoachRegiTrotter(Missouri)andWashingtonHead CoachCamronSmith(Kansas).
Asaresultofthishonor,theawardedschoolswillreceivea$500grantfrom theHuntFamilyFoundation.Additionally,thecoacheswillbepresenteda pair of sunglasses, courtesy of Oakley, a congratulatory commemorative Super Bowl LVII coin and a certificate recognizing their selection.These coachesarenowqualifiedfortheEricDriskellCoachoftheYearAward, whichwillbevotedonlaterthisfall.TheEricDriskellCoachoftheYear AwardisselectedbyapanelcomprisedoftheMissouriandKansasBoards fromtheGreaterKansasCityFootballCoachesAssociation.
Lastweek,St.JosephCentralbeatWilliamChrisman52-20tomoveto4-0 ontheseason.Itisthefirst4-0startfortheschoolsince1986,andthreeof their wins this season have had a 20+ point win margin.Trotter dedicates thisawardtotheentireCentralcommunity.
“WeatCentralwanttothanktheKansasCityChiefsandPrepsKCforthis tremendoushonor,”Trottersaid.“Ourprogramhasbeenonasteadybut toughinclineandIlovethatwearebeingrewardedforourhardworkand dedication.Ourcommunityappreciatesthisrecognition,andwelookforward tohonoringitbyplayingandlivingwiththeConfidence,Accountability,and Toughnessstandardsthatmakeupourprogram.”
In Kansas, Washington beat Bonner Springs 37-28 to earn its first win over the school since 2000. The Wildcats are now 3-0 for the first time since2005.SmithacceptsthishonoronbehalfofeveryoneintheWildcats’ program.
“Thankssomuchforthistremendoushonor,”Smithsaid.“Ihavetoadmit it’sprettycoolbeingrecognizedbythegreatestfootballorganizationinthe world.Althoughtheawardisnamed,‘ChiefsCoachoftheWeek,’Ilookatit likeafullstaffaward.ThereisnowayI’mreceivingthisrecognitionwithout mystaff.CoachesAlfredoBahena(DC/DBs),DerekJonesJr.(STC/RBs), MyronThomas(OL/DL),KennyPowellJr.(QBs/WRs),CliftonMcFadden (LBs),andCalebDiederich(AthleticTrainer)haveworkedalongsideeach other and myself to raise the standard within the Washington Wildcat FootballProgram.”
In its 27th season, the 2023 High School Coach of the Week is a joint initiative of the Kansas City Chiefs and the National Football League. This program is designed to recognize and reward Kansas City area high schoolcoachesforsuperiorperformanceonaweeklybasiswhilehonoring individualswhoareshapingtoday’syouthandtomorrow’sleaders.
The Kansas City Chiefs partner with PrepsKC to select Coaches of the WeekfromMissouriandKansaseachweek.PrepsKCistheonlycomplete multimediacoverageofhighschoolfootballintheKansasCityMetro.For thelast14yearsithascombinedadynamicwebsite,weeklymagazine andcomprehensiveweeklyradioshow.MoreinformationaboutPrepsKC, includingscores,schedulesandcoveragecanbefoundatwww.prepskc. com.
TheKansasCityChiefsandProFootballHallofFameGWillShieldsjoined withAmazononFridaytopresenta$25,000granttoCityYearKansasCity attheCityYearLearningandDevelopmentDay.
Amazon and the Chiefs teamed up to recognize a charitable partner in theKansasCityareaaspartofAmazon’s“TNFforGood”initiative,which providescommunitysupportincitieshostingThursdayNightFootballthis season.AsakeyeducationpartneroftheChiefsandtheNationalFootball League,CityYear’sKansasCitychapterwastheperfectgrantrecipientfor theadditionalfundingandawarenessgenerated.TheChiefsvs.Broncos ThursdayNightFootballgamewillaironPrimeVideoonThursday,October 12.
The$25,000grantwillsupportCityYear’seffortstobuildamoreequitable futuretodeveloptheskillsandmindsetsofchildrenandyoungadultsinour localcommunity.
Chiefs 38 PLAYERS JOIN PARTNERS TO SUPPORT COMMUNITYCHIEFS
CHIEFS JOIN AMAZON TO PRESENT GRANT TO CITY YEAR KANSAS CITY
The Chiefs and the Kansas City community raised more than $900,000 forRonaldMcDonaldHouseCharitiesofKansasCity(RMHC-KC)through flagsalesduringRedWednesday–the32ndeditionofRedFriday–on Wednesday,September6.Overthepastdecade,RedFridaysaleshave raised more than $6.5 million to help RMHC-KC continue its mission of keepingfamiliescloseintimesofsicknessandneed.
InadditiontotheRedWednesdaydonationfromflagsales,theHuntFamily Foundation50/50Raffleduringtheclub’s2023NFLKickoffGameagainst theDetroitLionsalsobenefitedRMHC-KC.Anadditional$113,094–half of$226,288,thelargestregularseasonpotinrafflehistory–broughtthe totaldonation fromthisyear’sRed Wednesday celebration tomorethan $1million.
MembersoftheChiefsCommunityCaringTeam,includingSBryanCook, CB Trent McDuffie and Executive Vice President and Chief Marketing OfficerLaraKrug,visitedtheRonaldMcDonaldHouseCharitiesofKansas CityTuesdaytomaketheformalannouncementofthetotalamountraised andvisitwithyouthandfamiliesatthehouse.
“WeknewthisRedWednesdaycelebrationhadthechancetobespecial, and the people of Kansas City and members of Chiefs Kingdom truly delivered for Ronald McDonald House Charities of Kansas City,” Chiefs President Mark Donovan said. “One of the many lasting legacies of founder Lamar Hunt, Red Friday continues to have incredible impact in ourcommunity,anditalwayshelpstheorganization–andourfans–kick offtheseason.Weareproudofhowthiscommunityunitestorallyaround those who need it most and we are thrilled to be able to announce this donationalongsideMcDonald’swithRMHC-KCstaffandfamiliestoday.”
RedWednesday(RedFriday)honorsthelong-standingtraditionofselling team-themed commemorative items around the city to raise money for local charities that was started by Chiefs Founder Lamar Hunt and the ChiefsRedCoatersin1992.SincetheinceptionofRedFriday,newspaper, magazine and flag sales have raised approximately $8 million for local charitieswithanemphasisonassistingyouthinneed.
ThroughapartnershipwithMcDonald’s,the10theditionoftheRedFriday flag–featuringaSuperBowlLVIIchampionshipdesign–wassoldinall KansasCity-andSt.Joseph-areaMcDonald’slocationsandKansasCity Hy-Vee stores for a minimum donation of $5. For the seventh year in a row, flags were also sold online for $10 and available for domestic and internationalshipping.
“The Chiefs aren’t just Super Bowl champions, they are champions for families at Ronald McDonald House Charities,” CEO of RMHC Kansas CityTamiGreenbergsaid.“WearesothankfultotheChiefsorganization for wrapping their arms around this charity, and to our founding mission partner,McDonald’s,fortheirlastingsupport.Amillion‘thankyous’toallof ChiefsKingdomforshowinguponRedWednesdaythisyearandmaking suchahugeimpact,oneflagatatime.”
With this year’s donation, more than $6.5 million has been directed to assistingRonaldMcDonaldHouseCharitiesofKansasCityastheyreduce theburdenofchildhoodillnessonchildrenandtheirfamiliesbyproviding a “home away from home” while the children are receiving medical care inKansasCity-areahospitals.FormoreinformationonRonaldMcDonald HouseCharitiesofKansasCity,pleasevisitwww.rmhckc.org/.
While at Ronald McDonald House Charities of Kansas City, the players participated in “Minute to Win It” style games with children from Ronald McDonaldHouseCharities.
To celebrate Hispanic Heritage Month, which runs from September 15 to October 15 annually, the Chiefs incorporated individuals and groups in the game entertainment lineup that highlight the history, legacy and contributionsofHispanicculture.

Most notably, the Kansas City Chiefs Flag Football Mexico Team out of MexicoCity,washonoredastheChiefsYouthTraditionFlagFootballTeam oftheWeek.Thatrecognitioncameduringthefirstquarterwhentheteam waspositionedontheGEHADeckandwasfeaturedonthevideoboards.
Halftime featured special performances by the dance group Grupo FolkloricoIzcalli,alongwithmusicalgroupsTrioAztlanandMakingMovies.

Chiefs 39
RED WEDNESDAY AND NFL KICKOFF GAME RAISE $1 MILLION FOR RMHC-KC
CHIEFS CELEBRATE HISPANIC HERITAGE MONTH DURING CHIEFS VS. BEARS GAME
STATS & SUMMARIES
KANSAS CITY CHIEFS / WEEK 3 / THROUGH MONDAY, SEPTEMBER 25, 2023
WON 2, LOST 1 * RUSHING No. Yds Avg Long TD 09/07 L 20-21 Detroit 73,522 Pacheco 35 155 4.4 31 1 09/17 W 17- 9 at Jacksonville 69,615 Mahomes 16 103 6.4 16 0 09/24 W 41-10 Chicago 73,562 Edwards-Helaire 22 77 3.5 16 1 10/01 at N.Y. Jets McKinnon 3 7 2.3 10 0 10/08 at Minnesota S. Moore 1 4 4.0 4 0 10/12 Denver Toney 2 2 1.0 3 0 10/22 L.A. Chargers Gabbert 2 -1 -.5 0 0 10/29 at Denver Rice 1 -3 -3.0 -3 0 11/05 Miami TEAM 82 344 4.2 31 2 11/20 Philadelphia OPPONENTS 78 308 3.9 18 1 11/26 at Las Vegas * RECEIVING No. Yds Avg Long TD 12/03 at Green Bay Kelce 11 95 8.6 24 2 12/10 Buffalo Rice 10 108 10.8 25 1 12/18 at New England Ju. Watson 7 158 22.6 37 0 12/25 Las Vegas S. Moore 7 112 16.0 54 1 12/31 Cincinnati Gray 7 78 11.1 24 0 01/07 at L.A. Chargers McKinnon 7 53 7.6 11 2 K.C. Opp. Pacheco 7 47 6.7 10 0 TOTAL FIRST DOWNS 67 48 Toney 7 35 5.0 17 0 Rushing 25 15 Valdes-Scantling 5 98 19.6 37 0 Passing 38 30 Edwards-Helaire 4 26 6.5 10 0 Penalty 4 3 Bell 2 12 6.0 8 1 3rd Down: Made/Att 19/41 12/39 James 1 6 6.0 6 0 3rd Down Pct. 46.3 30.8 Ju. Ross 1 6 6.0 6 0 4th Down: Made/Att 2/3 2/7 D. Smith 1 0 0.0 0 0 4th Down Pct. 66.7 28.6 TEAM 77 834 10.8 54 7 POSSESSION AVG. 31:48 28:12 OPPONENTS 56 567 10.1 45 2 TOTAL NET YARDS 1171 842 * INTERCEPTIONS No. Yds Avg Long TD Avg. Per Game 390.3 280.7 Edwards 1 16 16.0 16 0 Total Plays 201 185 TEAM 1 16 16.0 16 0 Avg. Per Play 5.8 4.6 OPPONENTS 4 92 23.0 50t 1 NET YARDS RUSHING 344 308 * PUNTING No. Yds Avg Net TB In Lg B Avg. Per Game 114.7 102.7 Townsend 10 495 49.5 47.4 0 5 58 0 Total Rushes 82 78 TEAM 10 495 49.5 47.4 0 5 58 0 NET YARDS PASSING 827 534 OPPONENTS 15 694 46.3 41.1 1 8 61 0 Avg. Per Game 275.7 178.0 * PUNT RETURNS Ret FC Yds Avg Long TD Sacked/Yards Lost 1/7 8/33 James 6 2 24 4.0 9 0 Gross Yards 834 567 Washington 3 1 33 11.0 23 0 Att./Completions 118/77 99/56 TEAM 9 3 57 6.3 23 0 Completion Pct. 65.3 56.6 OPPONENTS 3 3 21 7.0 16 0 Had Intercepted 4 1 * KICKOFF RETURNS No. Yds Avg Long TD PUNTS/AVERAGE 10/49.5 15/46.3 James 1 14 14.0 14 0 NET PUNTING AVG. 10/47.4 15/41.1 TEAM 1 14 14.0 14 0 PENALTIES/YARDS 18/134 12/105 * FIELD GOALS 1-19 20-29 30-39 40-49 50+ FUMBLES/BALL LOST 4/2 6/3 Butker 0/ 0 0/ 0 4/ 4 1/ 1 0/ 0 TOUCHDOWNS 9 4 TEAM 0/ 0 0/ 0 4/ 4 1/ 1 0/ 0 Rushing 2 1 OPPONENTS 0/ 0 2/ 2 1/ 1 1/ 1 0/ 0 Passing 7 2 Butker: (35G,39G)(38G)(41G,38G) Returns 0 1 OPP: ()(32G,49G,22G)(21G) * SCORE BY PERIODS Q1 Q2 Q3 Q4 OT PTS TEAM 7 48 17 6 0 78 OPPONENTS 7 6 7 20 0 40 * SCORING TD-Ru-Pa-Rt K-PAT FG S PTS Butker 0 0 0 0 9/ 9 5/ 5 0 24 Kelce 2 0 2 0 0 12 McKinnon 2 0 2 0 0 12 Bell 1 0 1 0 0 6 Edwards-Helaire 1 1 0 0 0 6 S. Moore 1 0 1 0 0 6 Pacheco 1 1 0 0 0 6 Rice 1 0 1 0 0 6 TEAM 9 2 7 0 9/ 9 5/ 5 0 78
OPPONENTS 4 1 2 1 4/ 4 4/ 4 0 40
2-Pt Conv: TM 0-0, OPP 0-0
SACKS: Danna 2.5, Ch. Jones 2.5, Karlaftis 2, Anudike-Uzomah 0.5, Tranquill 0.5, TM 8, OPP 1
FUM/LOST: Humphrey 1/0, James 1/1, Toney 1/0, Ju. Watson 1/1
* PASSING
Att Cmp Yds Cmp% Yds/Att TD TD% Int Int% Long Sack/Lost Rating Mahomes 113 74 803 65.5 7.11 7 6.2 2 1.8 54 1/ 7 99.5 Gabbert 5 3 31 60.0 6.20 0 0.0 2 40.0 15 0/ 0 38.3 TEAM 118 77 834 65.3 7.07 7 5.9 4 3.4 54 1/ 7 91.6 OPPONENTS 99 56 567 56.6 5.73 2 2.0 1 1.0 45 8/ 33 75.6
2023 REGULAR SEASON KANSAS CITY CHIEFS DEFENSIVE STATS (THROUGH WEEK 3)
POS. PLAYER TKL. AST. COMB TFL SACKS/SK. YDS. PR FR FF INT./YDS. PD CB T. McDuffie 9 7 16 0 0.0/0.0 1 0 2 0/0 1 LB N. Bolton 9 6 15 0 0.0/0.0 0 0 0 0/0 0 LB D. Tranquill 9 6 15 0 0.5/0.0 1 0 0 0/0 0 S J. Reid 10 4 14 0 0.0/0.0 0 0 0 0/0 3 CB L. Sneed 10 4 14 3 0.0/0.0 1 1 0 0/0 2 LB L. Chenal 9 5 14 1 0.0/0.0 1 0 0 0/0 0 S B. Cook 8 5 13 0 0.0/0.0 0 1 0 0/0 1 DE G. Karlaftis 5 8 13 2 2.0/9.0 3 0 0 0/0 1 DE M. Danna 7 4 11 2 2.5/9.0 3 0 0 0/0 1 DT D. Nnadi 2 7 9 0 0.0/0.0 0 0 0 0/0 1 DE F. Anudike-Uzomah 5 2 7 0 0.5/1.0 2 0 1 0/0 0 LB W. Gay 4 3 7 0 0.0/0.0 0 1 0 0/0 0 S M. Edwards 3 3 6 0 0.0/0.0 0 0 0 1/16 1 CB J. Williams 5 0 5 0 0.0/0.0 0 0 0 0/0 1 DT M. Dickerson 1 3 4 0 0.0/0.0 0 0 0 0/0 0 CB J. Watson 3 0 3 0 0.0/0.0 0 0 0 0/0 0 DT C. Jones 2 1 3 2 2.5/14.0 3 0 0 0/0 1 LB J. Cochrane 1 2 3 0 0.0/0.0 0 0 0 0/0 0 DE M. Herring 1 2 3 0 0.0/0.0 1 0 0 0/0 0 DT K. Coburn 1 0 1 1 0.0/0.0 0 0 0 0/0 0 DT T. Wharton 1 0 1 0 0.0/0.0 0 0 0 0/0 0 DB C. Conner 0 1 1 0 0.0/0.0 0 0 0 0/0 0 TOTALS 105 73 178 11 8.0/33.0 16 3 3 1/16 13 2023 REGULAR SEASON CHIEFS SPECIAL TEAMS STATS POS . PLAYER TKL. AST. COMB. LB Cochrane, Jack 1 0 1 DB Conner, Chamarri 1 0 1 LB Jones, Cam 1 0 1 TOTALS 3 0 3 DEFENSIVE SCORES INT (0) FR (0) Safety (0) SPECIAL TEAMS BIG PLAYS FR (0) REGULAR SEASON DEFENSIVE AND SPECIAL TEAMS STATISTICS ARE BASED ON PRESS BOX STATISTICS.
DET A.St. Brown 9 yd. pass from J.Goff (R.Patterson kick) (14-91, 8:04)
KC R.Rice 1 yd. pass from P.Mahomes (H.Butker kick) (13-75, 5:56)
KC B.Bell 4 yd. pass from P.Mahomes (H.Butker kick) (6-82, 1:28)
DET B.Branch 50 yd. interception return (R.Patterson kick)
KC H.Butker 35 yd. Field Goal (8-73, 3:34)
KC H.Butker 39 yd. Field Goal (8-47, 3:55)
DET D.Montgomery 8 yd. run (R.Patterson kick) (9-75, 5:05)
RUSHING
KC P. Mahomes 6-45; I. Pacheco 8-23; C. Edwards-Helaire 6-22; S. Moore 1-4; K. Toney 1-(-1); R. Rice 1-(-3)
DET D. Montgomery 21-74, TD; J. Gibbs 7-42; J. Reeves-Maybin 1-3; J. Goff 5-(-1)
RECEIVING
KC M. Valdes-Scantling 2-48; J. Watson 2-45; I. Pacheco 4-31; N. Gray 3-31; R. Rice 3-29, TD; B. Bell 2-12, TD; J. McKinnon 1-10; C. Edwards-Helaire 1-7; R. James 1-6; J. Ross 1-6; K. Toney 1-1
DET J. Reynolds 4-80; A. St. Brown 6-71, TD; S. LaPorta 5-39; K. Raymond 1-20; J. Gibbs 2-18; B. Wright 2-17; M. Jones Jr. 2-8
PASSING
KC P. Mahomes 39-21-226, 2 TDs, 1 INT
DET J. Goff 35-22-253, TD, 0 INT INTERCEPTIONS
KC None
DET B. Branch 1
KC M. Danna 1.0
DET None
KC H. Butker (35) (39)
DET
SACKS
FIELD GOALS
JAX B.McManus 32 yd. Field Goal (4-3, 1:52)
KC S.Moore 9 yd. pass from P.Mahomes (H.Butker kick) (7-50, 3:37)

JAX B.McManus 49 yd. Field Goal (5-44, 0:27)
KC T.Kelce 9 yd. pass from P.Mahomes (H.Butker kick) (7-81, 3:30)

JAX B.McManus 22 yd. Field Goal (9-73, 3:16)
KC H.Butker 38 yd. Field Goal (13-55, 5:33)
RUSHING
KC I. Pacheco 12-70; P. Mahomes 7-30; K. Toney 1-3; C. Edwards-Helaire 1-(0); J. McKinnon 1-(-2)
JAX T. Etienne Jr. 12-40; T. Lawrence 5-26; D. Johnson 1-8
RECEIVING
KC S. Moore 3-70, TD; J. Watson 3-62; N. Gray 3-38; K. Toney 5-35; T. Kelce 4-26, TD; J. McKinnon 3-24; R. Rice 2-20; C. Edwards-Helaire 2-17; M. Valdes-Scantling 2-13; I. Pacheco 1(0); D. Smith 1-(0)
JAX C. Kirk 11-110; E. Engram 6-57; C. Ridley 2-32; D. Johnson 1-9; J. Agnew 1-5; T. Etienne Jr. 2-2

PASSING
KC P. Mahomes 41-29-305, 2 TDs, 1 INT
JAX T. Lawrence 41-22-216, 0 TDs, 0 INT; C. Kirk 1-1-(-1), 0 TDs, 0 INT
KC None
JAX A. Cisco 1
INTERCEPTIONS
SACKS
KC C. Jones 1.5; G. Karlaftis 1.5; F. Anudike-Uzomah 0.5; M. Danna 0.5
JAX K. Chaisson 1.0
KC H. Butker (38)
FIELD GOALS
JAX B. McManus (32) (49) (22)
Lions 21, Chiefs
September
GEHA
Detroit Lions 7 0 7 7 21 Kansas City Chiefs 0 14 3 3 20
WEEK 1:
20
7, 2023
Field at Arrowhead Stadium 73,522
TEAM STATISTICS LIONS CHIEFS First Downs 19 ................................................... 17 Total Net Yards 368 316 Rushes/Net Yards 34/118 23/90 Net Passing 250 226 Pass Attempts/Completions 35/22 39/21 Had Intercepted 0 1 Sacked/Yards Lost 1/3 0/0 Punts/Average 5/44.4 5/49.4 Penalties/Yards 4/63 3/25 Fumbles/Lost 2/1 0/0 Possession Time 32:38 27:22
None WEEK 2: Chiefs 17, Jaguars 9 September 17, 2023 EverBank Stadium 69,615 Kansas City Chiefs 0 ..................................... 7 7 3 17 Jacksonville Jaguars 0 6 0 3 9
TEAM STATISTICS CHIEFS JAGUARS First Downs 19 18 Total Net Yards 399 .......................................... 271 Rushes/Net Yards 22/101 18/74 Net Passing 298 197 Pass Attempts/Completions 41/29 42/23 Had Intercepted 1 0 Sacked/Yards Lost 1/7 ...................................... 4/18 Punts/Average 4/48.3 5/48.6 Penalties/Yards 12/94 2/10 Fumbles/Lost 4/2 .............................................. 3/1 Possession Time 31:49 28:11
KC J.McKinnon 6 yd. pass from P.Mahomes (H.Butker kick) (6-59, 2:45)
KC C.Edwards-Helaire 1 yd. run (H.Butker kick) (11-80, 5:57)
KC J.McKinnon 3 yd. pass from P.Mahomes (H.Butker kick) (11-88, 5:24)

KC H.Butker 41 yd. Field Goal (4-3, 1:06)
KC I.Pacheco 1 yd. run (H.Butker kick) (3-26, 0:31)
KC H.Butker 38 yd. Field Goal (5-45, 0:35)
KC T.Kelce 3 yd. pass from P.Mahomes (H.Butker kick) (11-64, 5:14)
CHI C.Santos 21 yd. Field Goal (11-25, 4:42)
CHI D.Moore 9 yd. pass from J.Fields (C.Santos kick) (9-75, 2:49)
RUSHING
KC I. Pacheco 15-62, TD; C. Edwards-Helaire 15-55, TD; P. Mahomes 3-28; J. McKinnon 2-9; B. Gabbert 2-(-1)
CHI J. Fields 11-47; R. Johnson 8-38; K. Herbert 7-31
RECEIVING
KC T. Kelce 7-69, TD; R. Rice 5-59; J. Watson 2-51; S. Moore 4-42; M. Valdes-Scantling 1-37; J. McKinnon 3-19, 2 TDs; I. Pacheco 2-16; N. Gray 1-9; C. Edwards-Helaire 1-2; K. Toney 1-(-1)
CHI D. Moore 3-41, TD; C. Kmet 2-22; C. Claypool 1-15; R. Johnson 2-11; T. Scott 1-6; K. Herbert 2-4
PASSING
KC P. Mahomes 33-24-272, 3 TDs, 0 INT; B. Gabbert 5-3-31, 0 TDs, 2 INT
CHI J. Fields 22-11-99, TD, 1 INT
KC M. Edwards 1
INTERCEPTIONS
CHI Q. Johnson 1; J. Sanborn 1
SACKS
KC M. Danna 1.0; C. Jones 1.0; G. Karlaftis 0.5; D. Tranquill 0.5
CHI None
KC H. Butker (41) (38)
CHI C. Santos (21)
FIELD GOALS
3: Chiefs 41, Bears 10 September 24, 2023 GEHA Field at Arrowhead Stadium 73,562 Chicago Bears 0 0 0 10 10 Kansas City Chiefs 7 27 7 0 41
WEEK
TEAM STATISTICS BEARS CHIEFS First Downs 11 31 Total Net Yards 203 ........................................... 456 Rushes/Net Yards 26/116 37/153 Net Passing 87 303 Pass Attempts/Completions 22/11 ....................... 38/27 Had Intercepted 1 2 Sacked/Yards Lost 3/12 0/0 Punts/Average 5/45.8 1/55.0 Penalties/Yards 6/32 .......................................... 3/15 Fumbles/Lost 1/1 0/0 Possession Time 23:47 36:13
ROSTER INFO
HEAD COACH: Andy Reid
OFFENSE: MattNagy(OffensiveCoordinator);JoeBleymaier (Pass GameCoordinator);Porter Ellett (Asst. Running Backs); ConnorEmbree(WideReceivers);DavidGirardi (Quarterbacks); AndyHeck(OffensiveLine);CoreyMatthaei (Asst. OffensiveLine);Tom Melvin (TightEnds);ToddPinkston(Running Backs); KevinSaxton(Offensive Asst.); Dan Williams (Offensive Quality Control/Asst. Quarterbacks).
DEFENSE: Steve Spagnuolo (Defensive Coordinator); Terry Bradden (Asst. Defensive Line); Joe Cullen (Defensive Line); Donald D'Alesio (Safeties); Brendan Daly (Linebackers); Ken Flajole (Outside Linebackers); Dave Merritt (Defensive Backs); Alex Whittingham (Defensive Quality Control); Rod Wilson (Defensive Asst.).
SPECIALISTS: Dave Toub (Asst. Head Coach/Special Teams Coordinator); Andy Hill (Asst. Special Teams).
MISCELLANEOUS: Ryan Reynolds (Head Strength & Conditioning/Dir. of Sports Science); Greg Carbin (Asst. Strength & Conditioning); Nick Cassetta (Asst. Strength & Conditioning); Spencer Reid (Asst. Strength & Conditioning); Mike Frazier (Statistical Analysis Coordinator).
NO.NAME POS. HT. WT. AGE EXP. COLLEGE HOW ACQ. HOMETOWN 1 Jerick McKinnon RB 5-9209 31 10 Georgia Southern FA-21 Marietta, Ga. 2 Joshua Williams CB 6-3193 23 2 Fayetteville State D4-22 Fayetteville, N.C. 4 Rashee Rice WR 6-1204 23 R SMU D2-23 North Richland Hills, Texas 5 Tommy Townsend P 6-1191 26 4 Florida CFA-20 Orlando, Fla. 6 Bryan Cook S 6-120624 2 CincinnatiD2b-22 Cincinnati, Ohio 7 Harrison Butker K 6-4199 28 7 Georgia Tech FA-17 Decatur, Ga. 8 Justyn Ross WR 6-4210 23 2 Clemson CFA-22 Phenix City, Ala. 9 Blaine Gabbert QB 6-5235 33 12Missouri FA-23 Ballwin, Mo. 10 Isiah Pacheco RB 5-10216 24 2 RutgersD7b-22 Vineland, N.J. 11 Marquez Valdes-Scantling WR 6-4206 28 6 South Florida FA-22 St. Petersburg, Fla. 15 Patrick Mahomes QB 6-2225 28 7 Texas Tech D1-17 Tyler, Texas 19 Kadarius Toney WR 6-0193 24 3 Florida T (NYG)-22 Mobile, Ala. 20 Justin Reid S 6-1207 26 6 Stanford FA-22 Prairieville, La. 21 Mike Edwards S 5-10205 27 5 Kentucky FA-23 Cincinnati, Ohio 22 Trent McDuffie CB 5-11193 23 2 Washington D1a-22 Westminster, Calif. 23 Drue Tranquill LB6-2234 28 5 Notre Dame FA-23 Fort Wayne, Ind. 24 Skyy Moore WR 5-10195 23 2 Western Michigan D2a-22 New Kensington, Pa. 25 Clyde Edwards-Helaire RB 5-7207 24 4 LSU D1-20 Baton Rouge, La. 27 Chamarri Conner DB 6-0202 23 R Virginia Tech D4-23 Jacksonville, Fla. 31 Nic Jones CB 6-0189 21 R Ball State D7-23 Detroit, Mich. 32 Nick Bolton LB5-11237 23 3 MissouriD2a-21 Frisco, Texas 35 Jaylen Watson CB 6-2197 25 2 Washington State D7a-22 Augusta, Ga. 38 L'Jarius Sneed CB 6-1192 26 4 LA Tech D4-20 Minden, La. 41 James Winchester LS6-3209 34 9 Oklahoma FA-15 Washington, Okla. 43 Jack Cochrane LB6-3236 24 2 South Dakota CFA-22 Mount Vernon, Iowa 44 Cam Jones LB6-2227 23 R Indiana CFA-23 Memphis, Tenn. 50 Willie Gay LB6-1243 25 4 Mississippi State D2-20 Starkville, Miss. 51 Mike Danna DE 6-2257 25 4 MichiganD5-20 Detroit, Mich. 52 Creed Humphrey C 6-430225 3 OklahomaD2b-21 Shawnee, Okla. 53 BJ Thompson DE 6-6243 24 R Stephen F. Austin D5-23 England, Ark. 54 Leo Chenal LB6-3250 22 2Wisconsin D3-22 Grantsburg, Wis. 56 George Karlaftis DE 6-4263 22 2 PurdueD1b-22 West Lafayette, Ind. 62 Joe Thuney G 6-5304 30 8 North Carolina State FA-21 Centerville, Ohio 64 Wanya Morris OL 6-6307 22 R OklahomaD3-23 Grayson, Ga. 65 Trey Smith G 6-6321 24 3 TennesseeD6-21 Jackson, Tenn. 66 Mike Caliendo OL 6-4301 25 1 Western Michigan CFA-22 Brookfield, Wis. 73 Nick Allegretti G 6-431027 5 Illinois D7-19 Frankfort, Ill. 74 Jawaan Taylor T 6-5330 25 5 Florida FA-23 Cocoa, Fla. 76 Prince Tega Wanogho T 6-5308 25 2 Auburn FA-20 Elmore, Ala. 77 Lucas Niang T 6-6315 25 3 TCU D3-20 New Canaan, Conn. 81 Blake Bell TE 6-6252 32 9 Oklahoma FA-21 Wichita, Kan. 83 Noah Gray TE 6-3240 24 3 Duke D5a-21 Leominster, Mass. 84 Justin Watson WR 6-2215 27 6 Pennsylvania FA-22 Bridgeville, Pa. 87 Travis Kelce TE 6-5250 33 11CincinnatiD3a-13 Cleveland Heights, Ohio 91 Derrick Nnadi DT 6-1317 27 6 Florida State D3a-18 Virginia Beach, Va. 92 Neil Farrell DT 6-432525 2 LSU T (LV)-23 Mobile, Ala. 94 Malik Herring DE 6-3275 25 3 Georgia CFA-21 Forsyth, Ga. 95 Chris Jones DT 6-6310 29 8 Mississippi State D2-16 Houston, Miss. 97 Felix Anudike-Uzomah DE 6-4255 21 R Kansas State D1-23 Kansas City, Mo. 98 Tershawn Wharton DT 6-1280 25 4 Missouri S&T CFA-20 University City, Mo. 99 Keondre Coburn DT 6-2 332 23 R TexasD6-23 Houston, Texas Practice Squad 12 Montrell Washington WR 5-10170 24 2 Samford FA-23 Canton, Ga. 13 Chris Oladokun QB 6-2195 26 1 South Dakota State FA-22 Tampa, Fla. 14 Cornell Powell WR 6-0204 25 1 ClemsonD5b-21 Greenville, N.C. 26 Deon Bush S 6-0200 30 8 Miami FA-22 Miami, Fla. 29 La'Mical Perine RB 5-11216 25 2 Florida FA-22 Mobile, Ala. 30 Darius Rush CB 6-219823 R South Carolina FA-23 Kingstree, S.C. 34 Deneric Prince RB 6-0216 23 R Tulsa CFA-23 Manvel, Texas 39 Keith Taylor CB 6-3195 24 3 Washington FA-23 Long Beach, Calif. 40 Ekow Boye-Doe CB 6-0177 23 R Kansas State CFA-23 Lawrence, Kan. 48 Cole Christiansen LB6-1230 26 1 Army FA-22 Suffolk, Va. 57 Truman Jones DE 6-4250 23 R Harvard CFA-23 Atlanta, Ga. 61 Austin Reiter C 6-3301 31 7 South Florida FA-22 Bradenton, Fla. 72 Chukwuebuka (Jason) Godrick OT 6-5295 22 R CFA-23 Lagos, Nigeria 75 Darian Kinnard T 6-5322 23 1 KentuckyD5-22 Knoxville, Tenn. 82 Gerrit Prince TE 6-5241 26 1 Alabama Birmingham FA-23 Shawnee, Kan. 89 Matt Bushman TE 6-5245 27 1 BYUFA-22 Tucson, Ari. 93 Matt Dickerson DT 6-5298 27 3 UCLA FA-23 San Mateo, Calif. Reserve/League Suspension 90 Charles Omenihu DE 6-5280 26 5 Texas FA-23 Rowlett, Texas Reserve/Injured 13 Nazeeh Johnson S 5-10199 25 2 MarshallD7c-22 Martinsburg, W.V. 17 Richie James WR 5-9185 28 6 Middle Tennessee State FA-23 Sarasota, Fla. 88 Jody Fortson TE 6-4226 27 3 Valdosta State CFA-19 Buffalo, N.Y.
2023 KANSAS CITY CHIEFS NUMERICAL ROSTER (As of September 26, 2023)
HEAD COACH: Andy Reid
OFFENSE: MattNagy(OffensiveCoordinator);JoeBleymaier (Pass GameCoordinator);Porter Ellett (Asst. Running Backs); ConnorEmbree(WideReceivers);DavidGirardi (Quarterbacks); AndyHeck(OffensiveLine);CoreyMatthaei (Asst. OffensiveLine);Tom Melvin (TightEnds);ToddPinkston(Running Backs); KevinSaxton(Offensive Asst.); Dan Williams (Offensive Quality Control/Asst. Quarterbacks).
DEFENSE: Steve Spagnuolo (Defensive Coordinator); Terry Bradden (Asst. Defensive Line); Joe Cullen (Defensive Line); Donald D'Alesio (Safeties); Brendan Daly (Linebackers); Ken Flajole (Outside Linebackers); Dave Merritt (Defensive Backs); Alex Whittingham (Defensive Quality Control); Rod Wilson (Defensive Asst.).
SPECIALISTS: Dave Toub (Asst. Head Coach/Special Teams Coordinator); Andy Hill (Asst. Special Teams).
MISCELLANEOUS: Ryan Reynolds (Head Strength & Conditioning/Dir. of Sports Science); Greg Carbin (Asst. Strength & Conditioning); Nick Cassetta (Asst. Strength & Conditioning); Spencer Reid (Asst. Strength & Conditioning); Mike Frazier (Statistical Analysis Coordinator).
NO.NAME POS. HT. WT. AGE EXP. COLLEGE HOW ACQ. HOMETOWN 73 Allegretti, Nick G 6-4310 27 5 Illinois D7-19 Frankfort, Ill. 97 Anudike-Uzomah, Felix DE 6-4255 21 R Kansas State D1-23 Kansas City, Mo. 81 Bell, Blake TE 6-6252 32 9 Oklahoma FA-21 Wichita, Kan. 32 Bolton, Nick LB5-11237 23 3 MissouriD2a-21 Frisco, Texas 7 Butker, Harrison K 6-4199 28 7 Georgia Tech FA-17 Decatur, Ga. 66 Caliendo, Mike OL 6-4301 25 1 Western Michigan CFA-22 Brookfield, Wis. 54 Chenal, Leo LB6-3250 22 2Wisconsin D3-22 Grantsburg, Wis. 99 Coburn, Keondre DT 6-2332 23 R TexasD6-23 Houston, Texas 43 Cochrane, Jack LB6-3236 24 2 South Dakota CFA-22 Mount Vernon, Iowa 27 Conner, Chamarri DB 6-0202 23 R Virginia Tech D4-23 Jacksonville, Fla. 6 Cook, Bryan S 6-1206 24 2 CincinnatiD2b-22 Cincinnati, Ohio 51 Danna, Mike DE 6-2257 25 4 MichiganD5-20 Detroit, Mich. 21 Edwards, Mike S 5-10205 27 5 Kentucky FA-23 Cincinnati, Ohio 25 Edwards-Helaire, Clyde RB 5-7207 24 4 LSU D1-20 Baton Rouge, La. 92 Farrell, Neil DT 6-432525 2 LSU T (LV)-23 Mobile, Ala. 9 Gabbert, Blaine QB 6-5235 33 12Missouri FA-23 Ballwin, Mo. 50 Gay, Willie LB6-1243 25 4 Mississippi State D2-20 Starkville, Miss. 83 Gray, Noah TE 6-3240 24 3 Duke D5a-21 Leominster, Mass. 94 Herring, Malik DE 6-3275 25 3 Georgia CFA-21 Forsyth, Ga. 52 Humphrey, Creed C 6-4302 25 3 OklahomaD2b-21 Shawnee, Okla. 44 Jones, Cam LB6-2227 23 R Indiana CFA-23 Memphis, Tenn. 95 Jones, Chris DT 6-6310 29 8 Mississippi State D2-16 Houston, Miss. 31 Jones, Nic CB 6-0189 21 R Ball State D7-23 Detroit, Mich. 56 Karlaftis, George DE 6-4263 22 2 PurdueD1b-22 West Lafayette, Ind. 87 Kelce, Travis TE 6-5250 33 11CincinnatiD3a-13 Cleveland Heights, Ohio 15 Mahomes, Patrick QB 6-2225 28 7 Texas Tech D1-17 Tyler, Texas 22 McDuffie, Trent CB 5-11193 23 2 Washington D1a-22 Westminster, Calif. 1 McKinnon, Jerick RB 5-9209 31 10 Georgia Southern FA-21 Marietta, Ga. 24 Moore, Skyy WR 5-10195 23 2 Western Michigan D2a-22 New Kensington, Pa. 64 Morris, Wanya OL 6-6307 22 R OklahomaD3-23 Grayson, Ga. 77 Niang, Lucas T 6-6315 25 3 TCU D3-20 New Canaan, Conn. 91 Nnadi, Derrick DT 6-1317 27 6 Florida State D3a-18 Virginia Beach, Va. 10 Pacheco, Isiah RB 5-10216 24 2 RutgersD7b-22 Vineland, N.J. 20 Reid, Justin S 6-1207 26 6 Stanford FA-22 Prairieville, La. 4 Rice, Rashee WR 6-1204 23 R SMU D2-23 North Richland Hills, Texas 8 Ross, Justyn WR 6-4210 23 2 Clemson CFA-22 Phenix City, Ala. 79 Smith, Donovan T 6-6338 30 9 Penn State FA-23 Owings Mills, Md. 65 Smith, Trey G 6-6321 24 3 TennesseeD6-21 Jackson, Tenn. 38 Sneed, L'Jarius CB 6-1192 26 4 LA Tech D4-20 Minden, La. 74 Taylor, Jawaan T 6-5330 25 5 Florida FA-23 Cocoa, Fla. 53 Thompson, BJ DE 6-6243 24 R Stephen F. Austin D5-23 England, Ark. 62 Thuney, Joe G 6-5304 30 8 North Carolina State FA-21 Centerville, Ohio 19 Toney, Kadarius WR 6-0193 24 3 Florida T (NYG)-22 Mobile, Ala. 5 Townsend, Tommy P 6-1191 26 4 Florida CFA-20 Orlando, Fla. 23 Tranquill, Drue LB6-2234 28 5 Notre Dame FA-23 Fort Wayne, Ind. 11 Valdes-Scantling, Marquez WR 6-4206 28 6 South Florida FA-22 St. Petersburg, Fla. 76 Wanogho, Prince Tega T 6-5308 25 2 Auburn FA-20 Elmore, Ala. 35 Watson, Jaylen CB 6-2197 25 2 Washington State D7a-22 Augusta, Ga. 84 Watson, Justin WR 6-2215 27 6 Pennsylvania FA-22 Bridgeville, Pa. 98 Wharton, Tershawn DT 6-1280 25 4 Missouri S&T CFA-20 University City, Mo. 2 Williams, Joshua CB 6-3193 23 2 Fayetteville State D4-22 Fayetteville, N.C. 41 Winchester, James LS6-3209 34 9 Oklahoma FA-15 Washington, Okla. Practice Squad 40 Boye-Doe, Ekow CB 6-0177 23 R Kansas State CFA-23 Lawrence, Kan. 26 Bush, Deon S 6-0200 30 8 Miami FA-22 Miami, Fla. 89 Bushman, Matt TE 6-5245 27 1 BYUFA-22 Tucson, Ari. 48 Christiansen, Cole LB6-1230 26 1 Army FA-22 Suffolk, Va. 93 Dickerson, Matt DT 6-5298 27 3 UCLA FA-23 San Mateo, Calif. 72 Godrick, Chukwuebuka (Jason) OT 6-5295 22 R CFA-23 Lagos, Nigeria 57 Jones, Truman DE 6-4250 23 R Harvard CFA-23 Atlanta, Ga. 75 Kinnard, Darian T 6-5322 23 1 KentuckyD5-22 Knoxville, Tenn. 13 Oladokun, Chris QB 6-2195 26 1 South Dakota State FA-22 Tampa, Fla. 29 Perine, La'Mical RB 5-11216 25 2 Florida FA-22 Mobile, Ala. 14 Powell, Cornell WR 6-0204 25 1 ClemsonD5b-21 Greenville, N.C. 34 Prince, Deneric RB 6-0216 23 R Tulsa CFA-23 Manvel, Texas 82 Prince, Gerrit TE 6-5241 26 1 Alabama Birmingham FA-23 Shawnee, Kan. 61 Reiter, Austin C 6-3301 31 7 South Florida FA-22 Bradenton, Fla. 30 Darius Rush CB 6-219823 R South Carolina FA-23 Kingstree, S.C. 39 Taylor, Keith CB 6-3195 24 3 Washington FA-23 Long Beach, Calif. 12 Washington, Montrell WR 5-10170 24 R Samford FA-23 Canton, Ga. Reserve/League Suspension 90 Omenihu, Charles DE 6-5280 26 5 Texas FA-23 Rowlett, Texas Reserve/Injured 17 James, Richie WR 5-9185 28 6 Middle Tennessee State FA-23 Sarasota, Fla. 88 Fortson, Jody TE 6-4226 27 3 Valdosta State CFA-19 Buffalo, N.Y. 13 Johnson, Nazeeh S 5-10199 25 2 MarshallD7c-22 Martinsburg, W.V.
2023 KANSAS
(As of September 26, 2023)
CITY CHIEFS ALPHABETICAL ROSTER
CITY CHIEFS POSITIONAL ROSTER
NO.NAME POS. HT. WT. AGE EXP. COLLEGE HOW ACQ. HOMETOWN 9 Gabbert, Blaine QB 6-5235 33 12 Missouri FA-23 Ballwin, Mo. 15 Mahomes, Patrick QB 6-2225 28 7 Texas Tech D1-17 Tyler, Texas NO.NAME POS. HT. WT. AGE EXP. COLLEGE HOW ACQ. HOMETOWN 25 Edwards-Helaire, Clyde RB 5-7207 24 4 LSU D1-20 Baton Rouge, La. 1 McKinnon, Jerick RB 5-9209 31 10 Georgia Southern FA-21 Marietta, Ga. 10 Pacheco, Isiah RB 5-10216 24 2 RutgersD7b-22 Vineland, N.J. NO.NAME POS. 6-3 WT. AGE EXP. COLLEGE HOW ACQ. HOMETOWN 24 Moore, Skyy WR 5-10195 23 2 Western Michigan D2a-22 New Kensington, Pa. 4 Rice, Rashee WR 6-1204 23 R SMU D2-23 North Richland Hills, Texas 8 Ross, Justyn WR 6-4210 23 2 Clemson CFA-22 Phenix City, Ala. 19 Toney, Kadarius WR 6-0193 24 3 Florida T (NYG)-22 Mobile, Ala. 11 Valdes-Scantling, Marquez WR 6-4206 28 6 South Florida FA-22 St. Petersburg, Fla. 84 Watson, Justin WR 6-2215 27 6 Pennsylvania FA-22 Bridgeville, Pa. NO.NAME POS. HT. WT. AGE EXP. COLLEGE HOW ACQ. HOMETOWN 81 Bell, Blake TE 6-6252 32 9 Oklahoma FA-21 Wichita, Kan. 83 Gray, Noah TE 6-3240 24 3 Duke D5a-21 Leominster, Mass. 87 Kelce, Travis TE 6-5250 33 11CincinnatiD3a-13 Cleveland Heights, Ohio NO.NAME POS. HT. WT. AGE EXP. COLLEGE HOW ACQ. HOMETOWN 73 Allegretti, Nick G 6-4310 27 5 Illinois D7-19 Frankfort, Ill. 66 Caliendo, Mike OL 6-4301 25 1 Western Michigan CFA-22 Brookfield, Wis. 52 Humphrey, Creed C 6-4302 25 3 OklahomaD2b-21 Shawnee, Okla. 64 Morris, Wanya OL 6-6307 22 R OklahomaD3-23 Grayson, Ga. 77 Niang, Lucas T 6-6315 25 3 TCU D3-20 New Canaan, Conn. 79 Smith, Donovan T 6-6338 30 9 Penn State FA-23 Owings Mills, Md. 65 Smith, Trey G 6-6321 24 3 TennesseeD6-21 Jackson, Tenn. 74 Taylor, Jawaan T 6-5330 25 5 Florida FA-23 Cocoa, Fla. 62 Thuney, Joe G 6-5304 30 8 North Carolina State FA-21 Centerville, Ohio 76 Wanogho, Prince Tega T 6-5308 25 2 Auburn FA-20 Elmore, Ala. NO.NAME POS. HT. WT. AGE EXP. COLLEGE HOW ACQ. HOMETOWN 97 Anudike-Uzomah, Felix DE 6-4255 21 R Kansas State D1-23 Kansas City, Mo. 99 Coburn, Keondre DT 6-2332 23 R TexasD6-23 Houston, Texas 51 Danna, Mike DE 6-2257 25 4 MichiganD5-20 Detroit, Mich. 92 Farrell, Neil DT 6-432525 2 LSU T (LV)-23 Mobile, Ala. 94 Herring, Malik DE 6-3275 25 3 Georgia CFA-21 Forsyth, Ga. 95 Jones, Chris DT 6-6310 29 8 Mississippi State D2-16 Houston, Miss. 56 Karlaftis, George DE 6-4263 22 2 PurdueD1b-22 West Lafayette, Ind. 91 Nnadi, Derrick DT 6-1317 27 6 Florida State D3a-18 Virginia Beach, Va. 53 Thompson, BJ DE 6-6243 24 R Stephen F. Austin D5-23 England, Ark. 98 Wharton, Tershawn DT 6-1280 25 4 Missouri S&T CFA-20 University City, Mo. NO.NAME POS. HT. WT. AGE EXP. COLLEGE HOW ACQ. HOMETOWN 32 Bolton, Nick LB5-11237 23 3Missouri D2a-21 Frisco, Texas 54 Chenal, Leo LB6-3250 22 2Wisconsin D3-22 Grantsburg, Wis. 43 Cochrane, Jack LB6-3236 24 2 South Dakota CFA-22 Mount Vernon, Iowa 50 Gay, Willie LB6-1243 25 4 Mississippi State D2-20 Starkville, Miss. 44 Jones, Cam LB6-2227 23 R Indiana CFA-23 Memphis, Tenn. 23 Tranquill, Drue LB6-2234 28 5 Notre Dame FA-23 Fort Wayne, Ind. NO.NAME POS. HT. WT. AGE EXP. COLLEGE HOW ACQ. HOMETOWN 27 Conner, Chamarri DB 6-0202 23 R Virginia Tech D4-23 Jacksonville, Fla. 6 Cook, Bryan S 6-1206 24 2 CincinnatiD2b-22 Cincinnati, Ohio 21 Edwards, Mike S 5-10205 27 5 Kentucky FA-23 Cincinnati, Ohio 31 Jones, Nic CB 6-0189 21 R Ball State D7-23 Detroit, Mich. 22 McDuffie, Trent CB 5-11193 23 2 Washington D1a-22 Westminster, Calif. 20 Reid, Justin S 6-1207 26 6 Stanford FA-22 Prairieville, La. 38 Sneed, L'Jarius CB 6-1192 26 4 LA Tech D4-20 Minden, La. 35 Watson, Jaylen CB 6-2197 25 2 Washington State D7a-22 Augusta, Ga. 2 Williams, Joshua CB 6-3193 23 2 Fayetteville State D4-22 Fayetteville, N.C. NO.NAME POS. HT. WT. AGE EXP. COLLEGE HOW ACQ. HOMETOWN 7 Butker, Harrison K 6-4199 28 7 Georgia Tech FA-17 Decatur, Ga. 5 Townsend, Tommy P 6-1191 26 4 Florida CFA-20 Orlando, Fla. 41 Winchester, James LS6-3209 34 9 Oklahoma FA-15 Washington, Okla. RUNNING BACKS (3)
KANSAS
(As of September 26, 2023) QUARTERBACKS (2) WIDE RECEIVERS (7) SPECIALISTS (3) TIGHT ENDS (3) OFFENSIVE LINE (10) DEFENSIVE LINE (9) LINEBACKERS (6) DEFENSIVE BACKS (10)
2023
2023 KANSAS CITY CHIEFS 2023 UNOFFICIAL DEPTH CHART
(As of September 26, 2023)
OFFENSE
LB54
CB
CB
S6
P5 Tommy Townsend
K7 Harrison Butker
H5 Tommy Townsend
LS41 James Winchester
PR 17 Richie James 19
KR 17 Richie James
Rookies Underlined
DEFENSE
SPECIALISTS
PRONUNCIATION GUIDE
Nick Allegretti al-uh-GRET-ee
Felix Anudike-Uzomah ANN-you-DEE-kay ew-ZAH-muh
Leo Chenal shuh-NELL
Jack Cochrane kok-ruhn
Travis Kelce KEL-see
Wanya Morris whan-YAY
Lucas Niang KNEE-yang
Derrick Nnadi NAH-dee
Isiah Pacheco pa-CHECK-co
Rashee Rice rah-shee
Joe Thuney TOO-nee
Marquez Valdes-Scantling mar-KWEZ
Prince Tega WanoghoTAY-guh wah-NO-go
24 Skyy Moore 8 Justyn Ross
Donovan Smith 76 Prince Tega Wanogho 64 Wanya Morris LG62 Joe Thuney 66 Mike Caliendo
52 Creed Humphrey 73 Nick Allegretti RG 65 Trey Smith 73 Nick Allegretti RT 74 Jawaan Taylor 77 Lucas Niang
87 Travis Kelce 83 Noah Gray 81 Blake Bell
11 Marquez Valdes-Scantling 84 Justin Watson
15 Patrick Mahomes 9 Blaine Gabbert
10 Isiah Pacheco 1 Jerick McKinnon 25 Clyde Edwards-Helaire
19 Kadarius Toney 4 Rashee Rice DE 56 George Karlaftis 97 Felix Anudike-Uzomah 53 BJ Thompson DT 98 Tershawn Wharton 92 Neil Farrell DT 95 Chris Jones 91 Derrick Nnadi 99 Keondre Coburn DE 51 Mike Danna 94 Malik Herring
Willie Gay 44 Cam Jones
Nick Bolton 23 Drue Tranquill
WR
LT79
C
TE
WR
QB
RB
WR
LB50
LB32
Leo Chenal 43 Jack Cochrane
22 Trent McDuffie 2 Joshua Williams
38 L'Jarius Sneed 35 Jaylen Watson 31 Nic Jones
20 Justin Reid 21 Mike Edwards
S
Bryan Cook 27 Chamarri Conner
Kadarius Toney
10 Isiah Pacheco
YEAR DRAFT
2013 TE Travis Kelce (3a)
2014
HOW THE 2023 CHIEFS ROSTER WAS BUILT
As of September 26, 2023
FREE AGENTS
2015 LS James Winchester (FA)
2016 DT Chris Jones (2)
2017 QB Patrick Mahomes (1)K Harrison Butker (FA)
2018 DT Derrick Nnadi (3a)
2019 G Nick Allegretti (7)
2020 RB Clyde Edwards-Helaire (1)P Tommy Townsend (CFA)
LB Willie Gay (2) T Prince Tega Wanogho (FA)
T Lucas Niang (3)DT Tershawn Wharton (CFA)
CB L'Jarius Sneed (4)
DE Mike Danna (5)
2021 LB Nick Bolton (2a)TE Blake Bell (FA)
C Creed Humphrey (2b) DE Malik Herring (CFA)
TE Noah Gray (5a)RB Jerick McKinnon (FA)
G Trey Smith (6)G Joe Thuney (FA)
TRADE/WAIVERS
2022 CB Trent McDuffie (1a)OL Mike Caliendo (CFA)WR Kadarius Toney (T/NYG)
DE George Karlaftis (1b)LB Jack Cochrane (CFA)
WR Skyy Moore (2a)S Justin Reid (FA)
S Bryan Cook (2b) WR Justyn Ross (CFA)
LB Leo Chenal (3)WR Marquez Valdes-Scantling (FA)
CB Joshua Williams (4)WR Justin Watson (FA)
CB Jaylen Watson (7a)
RB Isiah Pacheco (7b)
2023 DE Felix Anudike-Uzomah (1)S Mike Edwards (FA)DT Neil Farrell (T/LV)
WR Rashee Rice (2)QB Blaine Gabbert (FA)
OL Wanya Morris (3)LB Cam Jones (CFA)
DB Chamarri Conner (4)T Donovan Smith (FA)
DE BJ Thompson (5)T Jawaan Taylor (FA)
DT Keondre Coburn (6)LB Drue Tranquill (FA)
CB Nic Jones (7)
TOTAL ROSTER BREAKDOWN
28 Draft Choices7 College Free Agents2 Trades 16 Free Agents
2023 CHIEFS ROSTER BY EXPERIENCE
12th Year (1) 6th Year (5)
(As of September 26, 2023)
3rd Year (12) 1st Year (13)
QB Blaine GabbertDT Derrick NnadiLB Nick BoltonOL Mike Caliendo
S Justin ReidTE Jody Fortson
11th Year (1) WR Marquez Valdes-ScantlingTE Noah Gray Rookie (22)
TE Travis Kelce WR Justin Watson DE Malik Herring DE Felix Anudike-Uzomah
10th Year (1) 5th Year (5)
C Creed HumphreyDT Keondre Coburn
T Lucas NiangDB Chamarri Conner
RB Jerick McKinnon G Nick AllegrettiG Trey Smith LB Cam Jones
S Mike EdwardsWR Kadarius ToneyCB Nic Jones
9th Year (3) T Jawaan Taylor OL Wanya Morris
TE Blake Bell LB Drue Tranquill 2nd Year (16) WR Rashee Rice
T Donovan Smith
LS James Winchester 4th Year (6)
8th Year (4)
LB Leo Chenal
LB Jack Cochrane
DE Mike DannaS Bryan Cook
RB Clyde Edwards-Helaire DT Neil Farrell
G Joe Thuney LB Willie Gay DE George Karlaftis
DT Chris JonesCB L'Jarius Sneed CB Trent McDuffie
P Tommy Townsend
7th Year (3) DT Tershawn Wharton WR Skyy Moore
K Harrison Butker
QB Patrick Mahomes
RB Isiah Pacheco
WR Justyn Ross
T Prince Tega Wanogho
CB Jaylen Watson
CB Joshua Williams
2023 CHIEFS ROSTER BY DRAFT ROUND
[Overall selection in brackets]
1st Round (9)
[10] QB Blaine Gabbert (2011-JAX) [10] QB Patrick Mahomes (2017) [12] WR Kadarius Toney (2021-NYG) [21] CB Trent McDuffie (2022) [30] DE George Karlaftis (2022) [31] DE Felix Anudike-Uzomah (2023) [32] RB Clyde Edwards-Helaire (2020)
2nd Round (9)
[34] T Donovan Smith (2015-TB), [37] DT Chris Jones (2016), [35] T Jawaan Taylor (2019-JAX), [54] WR Skyy Moore (2022), [55] WR Rashee Rice (2023), [58] LB Nick Bolton (2021), [62], S Bryan Cook (2022), [63] LB Willie Gay (2020), [63] C Creed Humphrey (2021).
3rd Round (9)
[63] TE Travis Kelce (2013) [68] S Justin Reid (2018-HOU) [75] DT Derrick Nnadi (2018) [78] G Joe Thuney (2016-NE) [92] Wanya Morris (2023) [96] RB Jerick McKinnon (2014-MIN) [96] T Lucas Niang (2020) [99] S Mike Edwards (2019-TB) [103] LB Leo Chenal (2022)
4th Round (8)
[117] TE Blake Bell (2015-SF) [119] DB Chamarri Conner (2023) [120], DT Neil Farrell (2022) [126], LB Drue Tranquill (2019-LAC) [135] CB Joshua Williams (2022) [138] CB L'Jarius Sneed (2020) [144]
5th Round (9)
[144] WR Justin Watson (2018-TB) [145], TE Noah Gray (2021) [166] DE BJ Thompson (2023) [174] WR Marquez Valdes-Scantling (2018-GB) [177] DE Mike Danna (2020) [181].
6th Round (3)
[194] DT Keondre Coburn (2023) [210] T Prince Tega Wanogho (2020-PHI) [226] G Trey Smith (2021)
7th Round (10)
[216] G Nick Allegretti (2019) [222] K Harrison Butker (2017-CAR) [240] WR Richie James (2018-SF) [241], CB Jaylen Watson (2022) [250] CB Nic Jones (2023) [251] RB Isiah Pacheco (2022) [259] S Nazeeh Johnson (2022)
Undrafted (34)
LS James Winchester (2013-PHI), DT Matt Dickerson (2018), TE Jody Fortson (2019), P Tommy Townsend (2020), DT Tershawn Wharton (2020), DE Malik Herring (2021), OL Mike Caliendo (2022), LB Jack Cochrane (2022), WR Justyn Ross (2022), LB Cam Jones (2023).
KANSAS CITY CHIEFS 2023 TRANSACTIONS
May 19 ANUDIKE-UZOMAH, Felix DE Signed
Jan. 9 FRYFOGLE, Ty WR
Jan. 9 ROSS, John WR
Feb. 3 WISE, Daniel DE
Feb. 14 BLANTON, Kendall TE
Feb. 14 BOOTLE, Dicaprio CB
Feb. 14 BUSHMAN, Matt TE
Feb. 14 CALIENDO, Mike G
Feb. 14 CHRISTIANSEN, Cole LB ...................Signed
Feb. 14 EALY, Jerrion WR
Feb. 14 OLADOKUN, Chris QB
Feb. 14 PERINE, La’Mical RB
Feb. 14 REITER, Austin C
Feb. 14 SHELTON, Danny DT
Feb. 14 SMITH-MARSETTE, Ihmir WR
Feb. 15 POWELL, Cornell WR
Mar. 7 CLARK, Frank DE
Mar. 14 WANOGHO, Prince Tega
Mar. 14 WHARTON, Tershawn
Mar. 16 OMENIHU, Charles DE
Mar. 16 TAYLOR, Jawaan T
Mar.
Mar.
Mar.
Mar.
Mar.
Mar.
Mar. 24 HOSKINS, Phil
Apr.
Apr.
Apr.
Apr.
Apr.
Apr.
Apr.
Apr.
Apr
Blaine
Apr. 29 COBURN, Keondre
Apr. 29 JONES, Nic CB
May
May
May
May
May
May
May
May
McKINNON, Jerick RB
SMITH, Donovan
BRASWELL, Montrae CB
CARVIN, Jerome G
COOK, Anthony S
HARDY, Anderson T
HAYNES, Blake T
JONES, Cam LB
May 6 JONES, Truman DE
May 6 MANUEL, Martez S
May 6 MOORE, Isaiah LB
May 6 NORMAN, Isaiah S
May 6 PRINCE, Deneric RB
May 6 REMIGIO, Nikko WR
May 6 SCOTT, Ty WR
May 6 TAYLOR, Reese CB
May 6 WITHERSTONE, Anthony CB
May
May
GODRICK, Chukwuebuka Jason T
HAILASSIE, Kahlef CB
May 9 GUTIERREZ, Sebastian T
May 9 BRASWELL, Montrae CB
May 9 HAYNES, Blake T
May 10 DICKERSON, Matt
May 10 JACKSON, Lamar CB
May 10 WILLIAMS, Chris DT
May 10 COWART, Byron
May 10 MANUEL, Martez S
May 15 BOYE-DOE, Ekow CB
May 15 SCOTT, Ty WR
May 15 COBURN, Keondre DT.....................................................Signed
May 15 CONNER, Chamarri DB
May 15 JONES, Nic CB
May 15 MORRIS, Wanya T
May 15 THOMPSON, B.J. DE
June 15 RICE, Rashee, WR Signed
June 15 BUECHELE, Shane, QB Signed
June 15 FORTSON, Jody, TE Signed
June 15 CRAWFORD, Kekoa, WR Signed
June 15 WITHERSTONE, Anthony, CB Released
July 19 WHARTON, Tershawn, DT Placed on Active/PUP
July 26 ROSS, John, WR Retired
July 27 SCOTT, Ty, WR Signed
July 30 JOHNSON, Nazeeh, CB Placed on Injured/Reserve
July 30 MOORE, Isaiah, LB Placed on Injured/Reserve
July 30 GATHINGS, Izaiah, TE Signed
July 30 WITHERSTONE, Anthony, CB Signed
Aug. 7 MOORE, Isaiah, LB Released/Injury Settlement
Aug. 15 WITHERSTONE, Anthony, CB
Aug. 15 FORTSON, Jody, TE
Aug. 15 FATUKASI, Olakunle, LB
Aug. 15 DURON, Lowe, CB
Aug. 21 KEKOA, Crawford, WR
Aug. 21 GREEN, Juwan, WR
Aug. 29 FARRELL, Neil, DT
Aug. 29 SMITH-MARSETTE, Ihmir, WR
Aug. 29 BLANTON, Kendall, TE
Aug. 29 BUSH, Deon, S
Aug. 29 REITER, Austin, C
Aug. 29 SHELTON, Danny, DT
Aug. 29 BOOTLE, Dicaprio, CB
Aug. 29 BOYE-DOE, Ekow, CB
Aug. 29 BUECHELE, Shane, QB
Aug. 29 BUSHMAN, Matt, TE
Aug. 29 CHRISTIANSEN, Cole, LB
Aug. 29 COOK, Anthony, S
Aug. 29 EALY, Jerrion, RB
Aug. 29 FRYFOGLE, Ty, WR
Aug. 29 GATHINGS, Izaiah, WR
Aug. 29 GODRICK, Chukwuebuka, OT
Aug. 29 GREEN, Juwan, WR
Aug. 29 GUTIERREZ, Sebastian, OT
Aug. 29 HAILASSIE, Kahlef, CB
Aug. 29 HARDY, Anderson, OT
Aug. 29 HOSKINS, Phil, DT Waived
Aug. 29 JACKSON, Lamar, CB Waived
Aug. 29 JONES, Truman, DE Waived
Aug. 29 KAINDOH, Joshua, DE Waived
Aug. 29 KINNARD, Darian, G Waived
Aug. 29 LOWE, Duron, CB Waived
Aug. 29 NORMAN, Isaiah, S Waived
Aug. 29 OLADOKUN, Chris, QB...................................................Waived
Aug. 29 PERINE, La’Mical, RB Waived
Aug. 29 POWELL, Cornell, WR Waived
Aug. 29 PRINCE, Deneric Waived
Aug. 29 SCOTT, Ty, WR Waived
Aug. 29 TAYLOR, Reese, CB Waived
Aug. 29 WILLIAMS, Chris, DT Waived
Aug. 29 WISE, Daniel, DE Waived
Aug. 29 CARVIN, Jerome, G Waived/Injury Designation
Aug. 29 FATUKASI, Olakunle, LB Waived/Injury Designation
Aug. 29 REMIGIO, Nikko, WR Waived/Injury Designation
Aug. 29 JONES, Chris, DT Placed on Reserve/Did Not Report
Aug. 29 OMENIHU, Charles, DE…Placed on Reserve/League Suspension
Aug. 30 RUSH, Darius, CB Claimed off Waivers
Aug. 30 DICKERSON, Matt, DT Release
Aug. 30 BOYE-DOE, Ekow, CB Signed to Practice Squad
Aug. 30 BUSH, Deon, S Signed to Practice Squad
Aug. 30 BUSHMAN, Matt, TE Signed to Practice Squad
Aug. 30 CHRISTIANSEN, Cole, LB Signed to Practice Squad
Aug. 30 DICKERSON, Matt, DT Signed to Practice Squad
Aug. 30 JONES, Truman, DE Signed to Practice Squad
Aug. 30 KINNARD, Darian, T Signed to Practice Squad
Aug. 30 OLADOKUN, Chris, QB Signed to Practice Squad
Aug. 30 PERINE, La’Mical, RB Signed to Practice Squad
Aug. 30 POWELL, Cornell, WR Signed to Practice Squad
Aug. 30 PRINCE, Deneric, RB Signed to Practice Squad
(as of 9/26/23) Date Player .....................................................................Transaction
Signed
to Reserve/Future
Signed
to Reserve/Future
Signed
to Reserve/Future
Signed
to Reserve/Future
Signed
to Reserve/Future
Signed
to Reserve/Future
Signed
to Reserve/Future
to Reserve/Future
Signed
to Reserve/Future
Signed
to Reserve/Future
Signed to Reserve/Future
Signed
to Reserve/Future
Signed
to Reserve/Future
Signed
to Reserve/Future
Signed to Reserve/Future
Released
Renegotiated Contract
T
Renegotiated Contract
DT
Signed
Signed
Signed
17 ALLEGRETTI, Nick G
20
Signed
EDWARDS, Mike S
21
LB Signed
TRANQUILL, Drue
DT Signed
23 NNADI, Derrick
TE Signed
24 BELL, Blake
DT Signed
24 COWART, Byron
DT Signed
S Signed
3 BUSH, Deon
WR Signed
11 JAMES, Richie
WR Signed
17 WATSON, Justin
19
QB Signed
GABBERT,
ANUDIKE-UZOMAH,
DE Drafted 1st Round
27
Felix
Drafted 2nd Round
28 RICE, Rashee WR
28
OL .......................................Drafted 3rd Round
MORRIS, Wanya
DB Drafted 4th Round
29 CONNER, Chamarri
DE Drafted 5th Round
29 THOMPSON, BJ
DT Drafted 6th Round
Drafted 7th Round
2
Signed
3
Signed
T
6
Signed
Signed
6
Signed
6
Signed
6
Signed
6
Signed
6
Signed
Signed
Signed
Signed
Signed
Signed
Signed
Signed
Signed
Signed
6
Signed
6
Signed
Released
Released
Signed
DT
Signed
Signed
Released
DT
Released
Signed
Released
Signed
Signed
Signed
Signed
Released/Injury Settlement
Placed on Injured/Reserve
Signed
Signed
Released/Injury Settlement
Signed
Acquired
via Trade with LV
Traded to CAR
Released
Released
Released
Released
Waived
Waived
Waived
Waived
Waived
Waived
Waived
Waived
Waived
Waived
Waived
Waived
Waived
Waived
Aug. 30 REITER, Austin, C Signed to Practice Squad
Aug. 30 SHELTON, Danny, DT Signed to Practice Squad
Aug. 30 TAYLOR, Reese, CB Signed to Practice Squad
Aug. 30 WILLIAMS, Chris, DT Signed to Practice Squad
Aug. 30 GODRICK, Chukwuebuka, T INT. Signed to Practice Squad
Aug. 31 TAYLOR, Keith, CB Signed to Practice Squad
Aug. 31 WASHINGTON, Montrell, WR Signed to Practice Squad
Aug. 31 TAYLOR, Reese, CB Released from Practice Squad
Sept. 1 WILLIAMS, Chris, DT Released from Practice Squad
Sept. 1 PRINCE, Gerrit, TE Signed to Practice Squad
Sept. 1 FATUKASI, Olakunle, LB Released
Sept. 6 CARVIN, Jerome, G Released/Injury Settlement
Sept. 7 BUSHMAN, Matt, TE Activated from PS via Stand Elevation
Sept. 7 DICKERSON, Matt, DT Activated from PS via Stand Elevation
Sept. 12 JONES, Chris, DT Reinstated from Reserve
Sept. 16 DICKERSON, Matt, DT Activated from PS vis Stand. Elevation
Sept. 16 PERINE, La’Mical, RB Activated from PS via Stand. Elevation
Sept. 16 RUSH, Darius, CB Waived
Sept. 19 RUSH, Darius, CB Signed to Practice Squad
Sept. 19 SHELTON, Danny, DT Released from Practice Squad
Sept. 24 JAMES, Richie, WR Placed on Injured Reserve
Sept. 24 WASHINGTON, Montrell, WR Activated from PS via Stand. Elev.
Sept. 24 CHRISTIANSEN, Cole, LB Activated from PS via Stand. Elev.
2023 REGULAR SEASON CHIEFS GAME-BY-GAME OFFENSE 09/07 DET 09/17 @ JAX 09/24 CHI 10/01 @ NYJ 10/08 @ MIN 10/12 DEN 10/22 LAC 10/29 @ DEN 11/05 MIA 11/20 PHI 11/26 @ LV 12/03 @ GB 12/10 BUF 12/18 @ NE 12/25 LV 12/31 CIN 01/07 @ LAC Totals FIRST DOWNS Total Rushing Passing Penalty 17 6 10 1 19 7 12 0 31 12 16 3 67 25 38 4 THIRD DOWNS Attempts Converted Percentage 14 5 35.7% 13 4 30.8% 14 10 71.4% 41 19 46.3% FOURTH DOWNS Attempts Converted Percentage 1 0 0.0% 2 2 100.0% 0 0 0 3 2 66.7% TOT. OFFENSE Net Yards Plays Avg./Play 316 62 5.1 399 64 6.2 456 75 6.1 1,171 201 5.8 RUSHING Net Yards Rush. Att. Avg./Att. 90 23 3.9 101 22 4.6 153 37 4.1 344 82 4.2 PASSING Net Yards Attempts Completions Intercepted Gross Yards Sacked Yards Lost 226 39 21 1 226 0.0 0 298 41 29 1 305 1.0 7 303 38 27 2 303 0.0 0 827 118 77 4 834 1.0 7 ADVANCES Rushes Completions Totals Total Drives 23 21 44 11 22 29 51 10 37 27 64 11 82 77 159 32 PENALTIES Number Yards 3 25 12 94 3 15 18 134 FUMBLES Number Lost 0 0 4 2 0 0 4 2 PUNTING Yards Punts Net Avg. Gross Avg. 247 5 46.2 49.4 193 4 47.0 48.3 55 1 55.0 55.0 495 10 47.4 49.5 SCORING Points Q1 Q2 Q3 Q4 OT TD Rushing TD Passing TD KO Returns TD Punt Returns TD Sp. Teams TD Def. Returns FG Attempts FG Made Safety 2-Pt Attempts 2-Pt Made Time of Possession 20 0 14 3 3 0 0 2 0 0 0 0 2 2 0 0 0 27:22 17 0 7 7 3 0 0 2 0 0 0 0 1 1 0 0 0 31:49 41 7 27 7 0 0 2 3 0 0 0 0 2 2 0 0 0 36:13 78 7 48 17 6 0 2 7 0 0 0 0 5 5 0 0 0 95:24
2023 REGULAR SEASON CHIEFS GAME-BY-GAME DEFENSE 09/07 DET 09/17 @ JAX 09/24 CHI 10/01 @ NYJ 10/08 @ MIN 10/12 DEN 10/22 LAC 10/29 @ DEN 11/05 MIA 11/20 PHI 11/26 @ LV 12/03 @ GB 12/10 BUF 12/18 @ NE 12/25 LV 12/31 CIN 01/07 @ LAC Totals FIRST DOWNS Total Rushing Passing Penalty 19 8 11 0 18 1 14 3 11 6 5 0 48 15 30 3 THIRD DOWNS Attempts Converted Percentage 15 5 33.3% 12 3 25.0% 12 4 33.3% 39 12 30.8% FOURTH DOWNS Attempts Converted Percentage 3 1 33.3% 2 0 0.0% 2 1 50.0% 7 2 28.6% TOT. OFFENSE Net Yards Plays Avg./Play 368 70 5.3 271 64 4.2 203 51 4.0 842 185 4.6 RUSHING Net Yards Rush. Att. Avg./Att. 118 34 3.5 74 18 4.1 116 26 4.5 308 78 3.9 PASSING Net Yards Attempts Completions Intercepted Gross Yards Sacked Yards Lost 250 35 22 0 253 1.0 3 197 42 23 0 215 4.0 18 87 22 11 1 99 3.0 12 534 99 56 1 567 8.0 33 ADVANCES Rushes Completions Totals Total Drives 34 22 56 11 18 23 41 11 26 11 37 10 78 56 134 32 PENALTIES Number Yards 4 63 2 10 6 32 12 105 FUMBLES Number Lost 2 1 3 1 1 1 6 3 PUNTING Yards Punts Net Avg. Gross Avg. 222 5 41.2 44.4 243 5 47.0 48.6 229 5 35.2 45.8 694 15 41.1 46.3 SCORING Points Q1 Q2 Q3 Q4 OT TD Rushing TD Passing TD KO Returns TD Punt Returns TD Sp. Teams TD Def. Returns FG Attempts FG Made Safety 2-Pt Attempts 2-Pt Made Time of Possession 21 7 0 7 7 0 1 1 0 0 0 1 0 0 0 0 0 32:38 9 0 6 0 3 0 0 0 0 0 0 0 3 3 0 0 0 28:11 10 0 0 0 10 0 0 1 0 0 0 0 1 1 0 0 0 23:47 40 7 6 7 20 0 1 2 0 0 0 1 4 4 0 0 0 84:36
Touchdowns 2 Jerick McKinnon vs. Bears 09/24 Passes Attempted 41 Patrick Mahomes at Jaguars 09/17 Passes Completed 29 Patrick Mahomes at Jaguars 09/17 Completion Percentage 72.7 Patrick Mahomes vs. Bears 09/24 Passing Yards 305 Patrick Mahomes at Jaguars 09/17 Yards Per Attempt 8.2 Patrick Mahomes vs. Bears 09/24 Touchdown Passes 3 Patrick Mahomes vs. Bears 09/24 Pass Receptions 7 Travis Kelce vs. Bears 09/24 Receiving Yards 70 Skyy Moore at Jaguars 09/17 Touchdown Receptions 2 Jerick McKinnon vs. Bears 09/24 Rushing Yards 70 Isiah Pacheco at Jaguars 09/17 Rushing Attempts 15 Clyde Edwards-Helaire vs. Bears 09/24 Isiah Pacheco vs. Bears 09/24 Rushing Average 5.8 Isiah Pacheco at Jaguars 09/17 Rushing Touchdowns 1 Clyde Edwards-Helaire vs. Bears 09/24 Isiah Pacheco vs. Bears 09/24 Yards From Scrimmage 78 Isiah Pacheco vs. Bears 09/24 Combined Net Yards 78 Isiah Pacheco vs. Bears 09/24 Interceptions Made 1 Mike Edwards vs. Bears 09/24 Interceptions Thrown 2 Blaine Gabbert vs. Bears 09/24 INT Return Yards 16 Mike Edwards vs. Bears 09/24 Tackles 8 Drue Tranquill vs. Bears 09/24 Nick Bolton at Jaguars 09/17 Trent McDuffie vs. Lions 09/07 Sacks 1.5 Chris Jones at Jaguars 09/17 George Karlaftis at Jaguars 09/17 Punts 5 Tommy Townsend vs. Lions 09/07 Punts Inside the 20 3 Tommy Townsend vs. Lions 09/07 Punting Average 55.0 Tommy Townsend vs. Bears 09/24 Punt Returns 3 Montrell Washington vs. Bears 09/24 Richie James at Jaguars 09/17 Richie James vs. Lions 09/07 Punt Return Yards 33 Montrell Washington vs. Bears 09/24 Kickoff Returns 1 Richie James at Jaguars 09/17 Kickoff Return Yards 14 Richie James at Jaguars 09/17 Field Goals Attempted 2 Harrison Butker vs. Bears 09/24 Harrison Butker vs. Lions 09/07 Field Goals Made 2 Harrison Butker vs. Bears 09/24 Harrison Butker vs. Lions 09/07 2023 REGULAR SEASON KANSAS CITY CHIEFS LONGEST PLAYS Run From Scrimmage 31 Isiah Pacheco at Jaguars 09/17 Touchdown Run 1 Clyde Edwards-Helaire vs. Bears 09/24 Isiah Pacheco vs. Bears 09/24 Passing Long 54 Patrick Mahomes at Jaguars 09/17 Touchdown Pass Long 9 (2) Patrick Mahomes at Jaguars 09/17 Pass Reception 54 Skyy Moore at Jaguars 09/17 Touchdown Reception 9 Travis Kelce at Jaguars 09/17 Skyy Moore at Jaguars 09/17 Interception Return 16 Mike Edwards vs. Bears 09/24 Punt Return 23 Montrell Washington vs. Bears 09/24 Kickoff Return 14 Richie James at Jaguars 09/17 Punt 58 Tommy Townsend at Jaguars 09/17 Tommy Townsend vs. Lions 09/07 Field Goal 41 Harrison Butker vs. Bears 09/24
2023 REGULAR SEASON CHIEFS INDIVIDUAL SINGLE-GAME HIGHS
Field Goal Attempt 41 (2) Harrison Butker vs. Bears 09/24
2023 REGULAR SEASON OPPONENTS INDIVIDUAL SINGLE-GAME HIGHS Touchdowns 1 DJ Moore vs. Bears 09/24 David Montgomery vs. Lions 09/07 Amon-Ra St. Brown vs. Lions 09/07 Passes Attempted 41 Trevor Lawrence at Jaguars 09/17 Passes Completed 22 Trevor Lawrence at Jaguars 09/17 Jared Goff vs. Lions 09/07 Completion Percentage 62.8 Jared Goff vs. Lions 09/07 Passing Yards 253 Jared Goff vs. Lions 09/07 Yards Per Attempt 7.2 Jared Goff vs. Lions 09/07 Touchdown Passes 1 Justin Fields vs. Bears 09/24 Jared Goff vs. Lions 09/07 Pass Receptions 11 Christian Kirk at Jaguars 09/17 Receiving Yards 110 Christian Kirk at Jaguars 09/17 Touchdown Receptions 1 DJ Moore vs. Bears 09/24 Amon-Ra St. Brown vs. Lions 09/07 Rushing Yards 74 David Montgomery vs. Lions 09/07 Rushing Attempts 21 David Montgomery vs. Lions 09/07 Rushing Average 6.0 Jahmyr Gibbs vs. Lions 09/07 Rushing Touchdowns 1 David Montgomery vs. Lions 09/07 Yards From Scrimmage 110 Christian Kirk at Jaguars 09/17 Combined Net Yards 110 Christian Kirk at Jaguars 09/17 Interceptions Made 1 Quindell Johnson vs. Bears 09/24 Jack Sanborn vs. Bears 09/24 Andre Cisco at Jaguars 09/17 Brian Branch vs. Lions 09/07 Interceptions Thrown 1 Justin Fields vs. Bears 09/24 INT Return Yards 50 Brian Branch vs. Lions 09/07 Tackles 16 T.J. Edwards vs. Bears 09/24 Sacks 1.0 K'Lavon Chaisson at Jaguars 09/17 Punts 5 Trenton Gill vs. Bears 09/24 Logan Cooke at Jaguars 09/17 Jack Fox vs. Lions 09/07 Punts Inside the 20 4 Logan Cooke at Jaguars 09/17 Punting Average 48.6 Logan Cooke at Jaguars 09/17 Punt Returns 2 Jamal Agnew at Jaguars 09/17 Punt Return Yards 16 Kalif Raymond vs. Lions 09/07 Field Goals Attempted 3 Brandon McManus at Jaguars 09/17 Field Goals Made 3 Brandon McManus at Jaguars 09/17 2023 REGULAR SEASON OPPONENTS LONGEST PLAYS Run From Scrimmage 18 Trevor Lawrence at Jaguars 09/17 Jahmyr Gibbs vs. Lions 09/07 Touchdown Run 8 David Montgomery vs. Lions 09/07 Passing Long 45 Trevor Lawrence at Jaguars 09/17 Touchdown Pass Long 9 Justin Fields vs. Bears 09/24 Jared Goff vs. Lions 09/07 Pass Reception 45 Christian Kirk at Jaguars 09/17 Touchdown Reception 9 DJ Moore vs. Bears 09/24 Amon-Ra St. Brown vs. Lions 09/07 Interception Return 50 Brian Branch vs. Lions 09/07 Longest INT Return for TD 50 Brian Branch vs. Lions 09/07 Punt Return 16 Kalif Raymond vs. Lions 09/07 Punt 61 Jack Fox vs. Lions 09/07 Field Goal 49 Brandon McManus at Jaguars 09/17 Field Goal Attempt 49 Brandon McManus at Jaguars 09/17
2023
300-YARD PASSERS DATE OPPONENT PLAYER ATT. YDS. COMP. LG TD 9/17 at Jaguars Patrick Mahomes 41 305 29 54 2 2023 OPPONENTS BIG YARDAGE GAMES 100-YARD PASS RECEIVERS DATE OPPONENT PLAYER ATT. YDS. AVG. LG TD 9/17 at Jaguars Christian Kirk 11 110 10.0 45 0
REGULAR SEASON BIG YARDAGE GAMES
2023
300-YARD PASSERS DATE OPPONENT PLAYER ATT. YDS. COMP. LG TD 9/17 at Jaguars Patrick Mahomes 41 305 29 54 2 2023 OPPONENTS BIG YARDAGE GAMES 100-YARD PASS RECEIVERS DATE OPPONENT PLAYER ATT. YDS. AVG. LG TD 9/17 at Jaguars Christian Kirk 11 110 10.0 45 0
REGULAR SEASON BIG YARDAGE GAMES
2023 REGULAR SEASON 100.0+ PASSER RATING CHIEFS PASSING GAMES DATE OPPONENT PLAYER ATT CMP YDS CMP% YDS/ATT YDS/CMP TD TD% INT INT% LONG SACK/LOST RATING 09/24 vs. CHI Patrick Mahomes 33 24 272 72.73% 8.24 11.33 3 9.09% 0 0.00% 37 0/0 127.30 DATE OPPONENT PLAYER ATT CMP YDS CMP% YDS/ATT YDS/CMP TD TD% INT INT% LONG SACK/LOST RATING 01/21 vs. JAX Patrick Mahomes 30 22 195 73.33% 6.50 8.86 2 6.67% 0 0.00% 27 0/0 112.50 01/29 vs. CIN Patrick Mahomes 43 29 326 67.44% 7.58 11.24 2 4.65% 0 0.00% 29 3/11 105.40 02/12 at PHI Patrick Mahomes 27 21 182 77.78% 6.74 8.67 3 11.11% 0 0.00% 22 0/0 131.80 2023 OPPONENTS 100.0+ PASSER RATING PASSING GAMES * No Results * DATE OPPONENT PLAYER ATT CMP YDS CMP% YDS/ATT YDS/CMP TD TD% INT INT% LONG SACK/LOST RATING 02/12 at PHI Jalen Hurts 38 27 304 71.05% 8.00 11.26 1 2.63% 0 0.00% 45t 2/2 103.40 *Need minimum of 20 attempts to qualify
DEFENSE DATE OPPONENT TOTAL RUSH PASS *POINTS SCORED TOTAL RUSH PASS *POINTS SCORED 09/07 Detroit 12 21 9 T-15 26 24 27 T-18 09/17 at Jacksonville 9 T-20 6 T-22 13 12 19 T-3 09/24 Chicago 5 10 5 9 6 11 6 4
per game
2023 REGULAR SEASON OFFENSE
*Points
2023
REGULAR SEASON INDIVIDUAL GAME-BY-GAME STATS
PASSING: PATRICK
DATE OPP. ATT CMP YDS CMP% Y/A Y/C TD TD% INT INT% LG SK/YD RATE 09/07 Detroit 39 21 226 53.8% 5.8 10.8 2 5.1% 1 2.6% 34 0/0 77.5 09/17 at Jacksonville 41 29 305 70.7% 7.4 10.5 2 4.9% 1 2.4% 54 1/7 98.1 09/24 Chicago 33 24 272 72.7% 8.2 11.3 3 9.1% 0 0.0% 37 0/0 127.3 10/01 at N.Y. Jets 10/08 at Minnesota 10/12 Denver 10/22 L.A. Chargers 10/29 at Denver 11/05 Miami 11/20 Philadelphia 11/26 at Las Vegas 12/03 at Green Bay 12/10 Buffalo 12/18 at New England 12/25 Las Vegas 12/31 Cincinnati 01/07 at L.A. Chargers TOTALS 113 74 803 65.5% 7.1 10.9 7 6.2% 2 1.8% 54 1/7 99.5 PASSING: BLAINE GABBERT DATE OPP. ATT CMP YDS CMP% Y/A Y/C TD TD% INT INT% LG SK/YD RATE 09/07 Detroit DID NOT PLAY 09/17 at Jacksonville DID NOT PLAY 09/24 Chicago 5 3 31 60.0% 6.2 10.3 0 0.0% 2 40.0% 15 0/0 38.3 10/01 at N.Y. Jets 10/08 at Minnesota 10/12 Denver 10/22 L.A. Chargers 10/29 at Denver 11/05 Miami 11/20 Philadelphia 11/26 at Las Vegas 12/03 at Green Bay 12/10 Buffalo 12/18 at New England 12/25 Las Vegas 12/31 Cincinnati 01/07 at L.A. Chargers TOTALS 5 3 31 60.0% 6.2 10.3 0 0.0% 2 40.0% 15 0/0 38.3 PASSING: CHRIS OLADOKUN DATE OPP. ATT CMP YDS CMP% Y/A Y/C TD TD% INT INT% LG SK/YD RATE 09/07 Detroit PRACTICE SQUAD 09/17 at Jacksonville PRACTICE SQUAD 09/24 Chicago PRACTICE SQUAD 10/01 at N.Y. Jets 10/08 at Minnesota 10/12 Denver 10/22 L.A. Chargers 10/29 at Denver 11/05 Miami 11/20 Philadelphia 11/26 at Las Vegas 12/03 at Green Bay 12/10 Buffalo 12/18 at New England 12/25 Las Vegas 12/31 Cincinnati 01/07 at L.A. Chargers TOTALS 0 0 0 0.0% 0.0 0.0 0 0.0% 0 0.0% 0/0 0.0
MAHOMES
2023
REGULAR SEASON INDIVIDUAL GAME-BY-GAME STATS
RUSHING: CLYDE EDWARDS-HELAIRE BLAINE GABBERT PATRICK MAHOMES DATE OPP. NO. YDS AVG LG TD NO. YDS AVG LG TD NO. YDS AVG LG TD 09/07 Detroit 6 22 3.7 5 0 DID NOT PLAY 6 45 7.5 16 0 09/17 at Jacksonville 1 0 0.0 0 DID NOT PLAY 7 30 4.3 14 0 09/24 Chicago 15 55 3.7 16 1 2 -1 -0.5 0 3 28 9.3 15 0 10/01 at N.Y. Jets 10/08 at Minnesota 10/12 Denver 10/22 L.A. Chargers 10/29 at Denver 11/05 Miami 11/20 Philadelphia 11/26 at Las Vegas 12/03 at Green Bay 12/10 Buffalo 12/18 at New England 12/25 Las Vegas 12/31 Cincinnati 01/07 at L.A. Chargers TOTALS 22 77 3.5 16 1 2 -1 -0.5 0 16 103 6.4 16 0 RUSHING: JERICK MCKINNON SKYY MOORE ISIAH PACHECO DATE OPP. NO. YDS AVG LG TD NO. YDS AVG LG TD NO. YDS AVG LG TD 09/07 Detroit 0 0 0.0 0 1 4 4.0 4 0 8 23 2.9 7 0 09/17 at Jacksonville 1 -2 -2.0 -2 0 0 0 0.0 0 12 70 5.8 31 0 09/24 Chicago 2 9 4.5 10 0 0 0 0.0 0 15 62 4.1 18 1 10/01 at N.Y. Jets 10/08 at Minnesota 10/12 Denver 10/22 L.A. Chargers 10/29 at Denver 11/05 Miami 11/20 Philadelphia 11/26 at Las Vegas 12/03 at Green Bay 12/10 Buffalo 12/18 at New England 12/25 Las Vegas 12/31 Cincinnati 01/07 at L.A. Chargers TOTALS 3 7 2.3 10 0 1 4 4.0 4 0 35 155 4.4 31 1 RUSHING: RASHEE RICE KADARIUS TONEY DATE OPP. NO. YDS AVG LG TD NO. YDS AVG LG TD 09/07 Detroit 1 -3 -3.0 -3 0 1 -1 -1.0 -1 0 09/17 at Jacksonville 0 0 0.0 0 1 3 3.0 3 0 09/24 Chicago 0 0 0.0 0 0 0 0.0 0 10/01 at N.Y. Jets 10/08 at Minnesota 10/12 Denver 10/22 L.A. Chargers 10/29 at Denver 11/05 Miami 11/20 Philadelphia 11/26 at Las Vegas 12/03 at Green Bay 12/10 Buffalo 12/18 at New England 12/25 Las Vegas 12/31 Cincinnati 01/07 at L.A. Chargers TOTALS 1 -3 -3.0 -3 0 2 2 1.0 3 0
SEASON INDIVIDUAL GAME-BY-GAME STATS
2023 REGULAR
RECEIVING: BLAKE BELL CLYDE EDWARDS-HELAIRE NOAH GRAY DATE OPP. NO. YDS AVG LG TD NO. YDS AVG LG TD NO. YDS AVG LG TD 09/07 Detroit 2 12 6.0 8 1 1 7 7.0 7 0 3 31 10.3 24 0 09/17 at Jacksonville 0 0 0.0 0 2 17 8.5 10 0 3 38 12.7 16 0 09/24 Chicago 0 0 0.0 0 1 2 2.0 2 0 1 9 9.0 9 0 10/01 at N.Y. Jets 10/08 at Minnesota 10/12 Denver 10/22 L.A. Chargers 10/29 at Denver 11/05 Miami 11/20 Philadelphia 11/26 at Las Vegas 12/03 at Green Bay 12/10 Buffalo 12/18 at New England 12/25 Las Vegas 12/31 Cincinnati 01/07 at L.A. Chargers TOTALS 2 12 6.0 8 1 4 26 6.5 10 0 7 78 11.1 24 0 RECEIVING: RICHIE JAMES TRAVIS KELCE JERICK MCKINNON DATE OPP. NO. YDS AVG LG TD NO. YDS AVG LG TD NO. YDS AVG LG TD 09/07 Detroit 1 6 6.0 6 0 INACTIVE 1 10 10.0 10 0 09/17 at Jacksonville 0 0 0.0 0 4 26 6.5 9t 1 3 24 8.0 11 0 09/24 Chicago RESERVE/INJURED 7 69 9.9 24 1 3 19 6.3 10 2 10/01 at N.Y. Jets 10/08 at Minnesota 10/12 Denver 10/22 L.A. Chargers 10/29 at Denver 11/05 Miami 11/20 Philadelphia 11/26 at Las Vegas 12/03 at Green Bay 12/10 Buffalo 12/18 at New England 12/25 Las Vegas 12/31 Cincinnati 01/07 at L.A. Chargers TOTALS 1 6 6.0 6 0 11 95 8.6 24 2 7 53 7.6 11 2 RECEIVING: SKYY MOORE ISIAH PACHECO RASHEE RICE DATE OPP. NO. YDS AVG LG TD NO. YDS AVG LG TD NO. YDS AVG LG TD 09/07 Detroit 0 0 0.0 0 4 31 7.8 10 0 3 29 9.7 25 1 09/17 at Jacksonville 3 70 23.3 54 1 1 0 0.0 0 2 20 10.0 15 0 09/24 Chicago 4 42 10.5 21 0 2 16 8.0 9 0 5 59 11.8 15 0 10/01 at N.Y. Jets 10/08 at Minnesota 10/12 Denver 10/22 L.A. Chargers 10/29 at Denver 11/05 Miami 11/20 Philadelphia 11/26 at Las Vegas 12/03 at Green Bay 12/10 Buffalo 12/18 at New England 12/25 Las Vegas 12/31 Cincinnati 01/07 at L.A. Chargers TOTALS 7 112 16.0 54 1 7 47 6.7 10 0 10 108 10.8 25 1
RECEIVING: JUSTYN ROSS KADARIUS TONEY MARQUEZ VALDES-SCANTLING DATE OPP. NO. YDS AVG LG TD NO. YDS AVG LG TD NO. YDS AVG LG TD 09/07 Detroit 1 6 6.0 6 0 1 1 1.0 1 0 2 48 24.0 34 0 09/17 at Jacksonville 0 0 0.0 0 5 35 7.0 17 0 2 13 6.5 8 0 09/24 Chicago 0 0 0.0 0 1 -1 -1.0 -1 0 1 37 37.0 37 0 10/01 at N.Y. Jets 10/08 at Minnesota 10/12 Denver 10/22 L.A. Chargers 10/29 at Denver 11/05 Miami 11/20 Philadelphia 11/26 at Las Vegas 12/03 at Green Bay 12/10 Buffalo 12/18 at New England 12/25 Las Vegas 12/31 Cincinnati 01/07 at L.A. Chargers TOTALS 1 6 6.0 6 0 7 35 5.0 17 0 5 98 19.6 37 0 RECEIVING: JUSTIN WATSON DATE OPP. NO. YDS AVG LG TD 09/07 Detroit 2 45 22.5 26 0 09/17 at Jacksonville 3 62 20.7 34 0 09/24 Chicago 2 51 25.5 37 0 10/01 at N.Y. Jets 10/08 at Minnesota 10/12 Denver 10/22 L.A. Chargers 10/29 at Denver 11/05 Miami 11/20 Philadelphia 11/26 at Las Vegas 12/03 at Green Bay 12/10 Buffalo 12/18 at New England 12/25 Las Vegas 12/31 Cincinnati 01/07 at L.A. Chargers TOTALS 7 158 22.6 37 0
2023 REGULAR SEASON INDIVIDUAL GAME-BY-GAME STATS
PUNTING: TOMMY TOWNSEND DATE OPP. NO. YDS AVG TB IN 20 LG NET BLK 09/07 Detroit 5 247 49.4 0 3 58 46.2 0 09/17 at Jacksonville 4 193 48.3 0 1 58 47.0 0 09/24 Chicago 1 55 55.0 0 1 55 55.0 0 10/01 at N.Y. Jets 10/08 at Minnesota 10/12 Denver 10/22 L.A. Chargers 10/29 at Denver 11/05 Miami 11/20 Philadelphia 11/26 at Las Vegas 12/03 at Green Bay 12/10 Buffalo 12/18 at New England 12/25 Las Vegas 12/31 Cincinnati 01/07 at L.A. Chargers TOTALS 10 495 49.5 0 5 58 47.4 0
2023 REGULAR SEASON INDIVIDUAL GAME-BY-GAME STATS
FIELD GOALS: HARRISON
DATE OPP. 0-19 20-29 30-39 40-49 50+ TOTAL FGM FGA PCT LG 09/07 Detroit 0/0 0/0 2/2 0/0 0/0 2/2 2 2 100.0% 39 09/17 at Jacksonville 0/0 0/0 1/1 0/0 0/0 1/1 1 1 100.0% 38 09/24 Chicago 0/0 0/0 1/1 1/1 0/0 2/2 2 2 100.0% 41 10/01 at N.Y. Jets 10/08 at Minnesota 10/12 Denver 10/22 L.A. Chargers 10/29 at Denver 11/05 Miami 11/20 Philadelphia 11/26 at Las Vegas 12/03 at Green Bay 12/10 Buffalo 12/18 at New England 12/25 Las Vegas 12/31 Cincinnati 01/07 at L.A. Chargers TOTALS 0/0 0/0 4/4 1/1 0/0 5/5 5 5 100.0% 41
BUTKER
GAME-BY-GAME
2023 REGULAR SEASON INDIVIDUAL DEFENSIVE
FELIX ANUDIKE-UZOMAH NICK BOLTON LEO CHENAL DATE OPP. S A TK TFL TFL Y SK SKY INT FR FF PR PD S A TK TFL TF LY SK SK Y INT FR FF PR PD S A TK TFL TFL Y SK SK Y INT FR FF PR PD 09/07 Detroit 2 0 2 0 0 0.0 0.0 0 0 0 2 0 4 3 7 0 0 0.0 0.0 0 0 0 0 0 3 3 6 0 0 0.0 0.0 0 0 0 0 0 09/17 at Jacksonville 1 1 2 0 0 0.5 1.0 0 0 1 0 0 5 3 8 0 0 0.0 0.0 0 0 0 0 0 3 1 4 1 1 0.0 0.0 0 0 0 0 0 09/24 Chicago 2 1 3 0 0 0.0 0.0 0 0 0 0 0 INACTIVE 3 1 4 0 0 0.0 0.0 0 0 0 1 0 10/01 at N.Y. Jets 10/08 at Minnesota 10/12 Denver 10/22 L.A. Chargers 10/29 at Denver 11/05 Miami 11/20 Philadelphia 11/26 at Las Vegas 12/03 at Green Bay 12/10 Buffalo 12/18 at New England 12/25 Las Vegas 12/31 Cincinnati 01/07 at L.A. Chargers TOTALS 5 2 7 0 0 0.5 1.0 0 0 1 2 0 9 6 15 0 0 0.0 0.0 0 0 0 0 0 9 5 14 1 1 0.0 0.0 0 0 0 1 0 KEONDRE COBURN JACK COCHRANE CHAMARRI CONNER DATE OPP. S A TK TFL TF LY SK SK Y INT FR FF PR PD S A TK TFL TFL Y SK SKY INT FR FF PR PD S A TK TFL TFL Y SK SKY INT FR FF PR PD 09/07 Detroit 1 0 1 1 0 0.0 0.0 0 0 0 0 0 0 0 0 0 0 0.0 0.0 0 0 0 0 0 0 0 0 0 0 0.0 0.0 0 0 0 0 0 09/17 at Jacksonville INACTIVE 0 0 0 0 0 0.0 0.0 0 0 0 0 0 0 0 0 0 0 0.0 0.0 0 0 0 0 0 09/24 Chicago INACTIVE 1 2 3 0 0 0.0 0.0 0 0 0 0 0 0 1 1 0 0 0.0 0.0 0 0 0 0 0 10/01 at N.Y. Jets 10/08 at Minnesota 10/12 Denver 10/22 L.A. Chargers 10/29 at Denver 11/05 Miami 11/20 Philadelphia 11/26 at Las Vegas 12/03 at Green Bay 12/10 Buffalo 12/18 at New England 12/25 Las Vegas 12/31 Cincinnati 01/07 at L.A. Chargers TOTALS 1 0 1 1 0 0.0 0.0 0 0 0 0 0 1 2 3 0 0 0.0 0.0 0 0 0 0 0 0 1 1 0 0 0.0 0.0 0 0 0 0 0 BRYAN COOK MIKE DANNA MATT DICKERSON DATE OPP. S A TK TFL TFL Y SK SKY INT FR FF PR PD S A TK TFL TFL Y SK SKY INT FR FF PR PD S A TK TFL TFL Y SK SK Y INT FR FF PR PD 09/07 Detroit 4 3 7 0 0 0.0 0.0 0 1 0 0 0 4 2 6 1 3 1.0 3.0 0 0 0 1 1 1 2 3 0 0 0.0 0.0 0 0 0 0 0 09/17 at Jacksonville 1 1 2 0 0 0.0 0.0 0 0 0 0 1 0 2 2 0 0 0.5 2.0 0 0 0 1 0 PRACTICE SQUAD 09/24 Chicago 3 1 4 0 0 0.0 0.0 0 0 0 0 0 3 0 3 1 4 1.0 4.0 0 0 0 1 0 PRACTICE SQUAD 10/01 at N.Y. Jets 10/08 at Minnesota 10/12 Denver 10/22 L.A. Chargers 10/29 at Denver 11/05 Miami 11/20 Philadelphia 11/26 at Las Vegas 12/03 at Green Bay 12/10 Buffalo 12/18 at New England 12/25 Las Vegas 12/31 Cincinnati 01/07 at L.A. Chargers TOTALS 8 5 13 0 0 0.0 0.0 0 1 0 0 1 7 4 11 2 7 2.5 9.0 0 0 0 3 1 1 2 3 0 0 0.0 0.0 0 0 0 0 0
STATS
MIKE EDWARDS WILLIE GAY MALIK HERRING
D AT E OP P. S A TK TFL TF LY SK SK Y INT FR FF PR PD S A TK TFL TF LY SK SK Y INT FR FF PR PD S A TK TFL TF LY SK SK Y INT FR FF PR PD 09/ 07 Det roit 1 1 2 0 0 0.0 0.0 0 0 0 0 0 2 1 3 0 0 0.0 0.0 0 0 0 0 0 0 0 0 0 0 0.0 0.0 0 0 0 0 0 09/ 17 at J ack son vill e 2 1 3 0 0 0.0 0.0 0 0 0 0 0 1 1 2 0 0 0.0 0.0 0 0 0 0 0 0 0 0 0 0 0.0 0.0 0 0 0 1 0 09/ 24 Chi cag o 0 1 1 0 0 0.0 0.0 1 0 0 0 1 1 1 2 0 0 0.0 0.0 0 1 0 0 0 1 2 3 0 0 0.0 0.0 0 0 0 0 0 10/ 01 at N.Y Jets 10/ 08 at Min nes ota 10/ 12 De nve r 10/ 22 L.A. Ch arg ers 10/ 29 at De nve r 11/ 05 Mia mi 11/ 20 Phil ade lphi a 11/ 26 at L as Ve gas 12/ 03 at Gre en Ba y 12/ 10 Buf falo 12/ 18 at Ne w En gla nd 12/ 25 Las Ve gas 12/ 31 Cin cin nat i 01/ 07 at L .A. Ch arg ers TOTA LS 3 3 6 0 0 0.0 0.0 1 0 0 0 1 4 3 7 0 0 0.0 0.0 0 1 0 0 0 1 2 3 0 0 0.0 0.0 0 0 0 1 0
CHRIS JONES GEORGE KARLAFTIS TRENT MCDUFFIE DATE OPP. S A TK TFL TFL Y SK SK Y INT FR FF PR PD S A TK TFL TFL Y SK SK Y INT FR FF PR PD S A TK TFL TFL Y SK SK Y INT FR FF PR PD 09/07 Detroit RESERVE/DID NOT REPORT 3 4 7 1 10 0.0 0.0 0 0 0 0 1 6 2 8 0 0 0.0 0.0 0 0 1 0 0 09/17 at Jacksonville 1 1 2 1 5 1.5 6.0 0 0 0 2 1 1 3 4 1 7 1.5 9.0 0 0 0 2 0 0 3 3 0 0 0.0 0.0 0 0 0 1 1 09/24 Chicago 1 0 1 1 8 1.0 8.0 0 0 0 1 0 1 1 2 0 0 0.5 0.0 0 0 0 1 0 3 2 5 0 0 0.0 0.0 0 0 1 0 0 10/01 at N.Y. Jets 10/08 at Minnesota 10/12 Denver 10/22 L.A. Chargers 10/29 at Denver 11/05 Miami 11/20 Philadelphia 11/26 at Las Vegas 12/03 at Green Bay 12/10 Buffalo 12/18 at New England 12/25 Las Vegas 12/31 Cincinnati 01/07 at L.A. Chargers TOTALS 2 1 3 2 13 2.5 14.0 0 0 0 3 1 5 8 13 2 17 2.0 9.0 0 0 0 3 1 9 7 16 0 0 0.0 0.0 0 0 2 1 1 DERRICK NNADI JUSTIN REID L'JARIUS SNEED DATE OPP. S A TK TFL TFL Y SK SK Y INT FR FF PR PD S A TK TFL TFL Y SK SK Y INT FR FF PR PD S A TK TFL TFL Y SK SK Y INT FR FF PR PD 09/07 Detroit 1 2 3 0 0 0.0 0.0 0 0 0 0 0 4 2 6 0 0 0.0 0.0 0 0 0 0 2 3 3 6 1 0 0.0 0.0 0 0 0 1 0 09/17 at Jacksonville 0 3 3 0 0 0.0 0.0 0 0 0 0 1 5 1 6 0 0 0.0 0.0 0 0 0 0 0 6 1 7 1 0 0.0 0.0 0 1 0 0 2 09/24 Chicago 1 2 3 0 0 0.0 0.0 0 0 0 0 0 1 1 2 0 0 0.0 0.0 0 0 0 0 1 1 0 1 1 1 0.0 0.0 0 0 0 0 0 10/01 at N.Y. Jets 10/08 at Minnesota 10/12 Denver 10/22 L.A. Chargers 10/29 at Denver 11/05 Miami 11/20 Philadelphia 11/26 at Las Vegas 12/03 at Green Bay 12/10 Buffalo 12/18 at New England 12/25 Las Vegas 12/31 Cincinnati 01/07 at L.A. Chargers TOTALS 2 7 9 0 0 0.0 0.0 0 0 0 0 1 10 4 14 0 0 0.0 0.0 0 0 0 0 3 10 4 14 3 1 0.0 0.0 0 1 0 1 2 DRUE TRANQUILL JAYLEN WATSON TERSHAWN WHARTON DATE OPP. S A TK TFL TFL Y SK SK Y INT FR FF PR PD S A TK TFL TFL Y SK SK Y INT FR FF PR PD S A TK TFL TFL Y SK SK Y INT FR FF PR PD 09/07 Detroit 1 1 2 0 0 0.0 0.0 0 0 0 0 0 0 0 0 0 0 0.0 0.0 0 0 0 0 0 0 0 0 0 0 0.0 0.0 0 0 0 0 0 09/17 at Jacksonville 4 1 5 0 0 0.0 0.0 0 0 0 0 0 2 0 2 0 0 0.0 0.0 0 0 0 0 0 0 0 0 0 0 0.0 0.0 0 0 0 0 0 09/24 Chicago 4 4 8 0 0 0.5 0.0 0 0 0 1 0 1 0 1 0 0 0.0 0.0 0 0 0 0 0 1 0 1 0 0 0.0 0.0 0 0 0 0 0 10/01 at N.Y. Jets 10/08 at Minnesota 10/12 Denver 10/22 L.A. Chargers 10/29 at Denver 11/05 Miami 11/20 Philadelphia 11/26 at Las Vegas 12/03 at Green Bay 12/10 Buffalo 12/18 at New England 12/25 Las Vegas 12/31 Cincinnati 01/07 at L.A. Chargers TOTALS 9 6 15 0 0 0.5 0.0 0 0 0 1 0 3 0 3 0 0 0.0 0.0 0 0 0 0 0 1 0 1 0 0 0.0 0.0 0 0 0 0 0
JOSHUA WILLIAMS
DAT E OPP . S A TK TFL TFL Y SK SKY INT FR FF PR PD 09/0 7 Detr oit 2 0 2 0 0 0.0 0.0 0 0 0 0 0 09/1 7 at Ja ckso nville 1 0 1 0 0 0.0 0.0 0 0 0 0 0 09/2 4 Chic ago 2 0 2 0 0 0.0 0.0 0 0 0 0 1 10/0 1 at N. Y. Jets 10/0 8 at Mi nnes ota 10/1 2 Denv er 10/2 2 L.A. Char gers 10/2 9 at De nver 11/0 5 Mia mi 11/2 0 Phila delp hia 11/2 6 at La s Vega s 12/0 3 at Gr een Bay 12/1 0 Buffa lo 12/1 8 at Ne w Engl and 12/2 5 Las Vega s 12/3 1 Cinci nnati 01/0 7 at L. A. Char gers TOTALS 5 0 5 0 0 0.0 0.0 0 0 0 0 1
JACK COCHRANE CHAMARRI CONNER CAM JONES DATE OPP. TKL AST TOT TKL AST TOT TKL AST TOT 09/07 Detroit 0 0 0 1 0 1 0 0 0 09/17 at Jacksonville 1 0 1 0 0 0 1 0 1 09/24 Chicago 0 0 0 0 0 0 0 0 0 10/01 at N.Y. Jets 10/08 at Minnesota 10/12 Denver 10/22 L.A. Chargers 10/29 at Denver 11/05 Miami 11/20 Philadelphia 11/26 at Las Vegas 12/03 at Green Bay 12/10 Buffalo 12/18 at New England 12/25 Las Vegas 12/31 Cincinnati 01/07 at L.A. Chargers TOTALS 1 0 1 1 0 1 1 0 1
2023 REGULAR SEASON INDIVIDUAL SPECIAL TEAMS GAME-BY-GAME STATS
2023 REGULAR SEASON INDIVIDUAL GAME-BY-GAME STATS
PUNT RETURNS: RICHIE
MONTRELL WASHINGTON DATE OPP. NO. YDS AVG LG FC TD NO. YDS AVG LG FC TD 09/07 Detroit 3 16 5.3 9 1 0 PRACTICE SQUAD 09/17 at Jacksonville 3 8 2.7 4 1 0 PRACTICE SQUAD 09/24 Chicago RESERVE/INJURED PRACTICE SQUAD 10/01 at N.Y. Jets 10/08 at Minnesota 10/12 Denver 10/22 L.A. Chargers 10/29 at Denver 11/05 Miami 11/20 Philadelphia 11/26 at Las Vegas 12/03 at Green Bay 12/10 Buffalo 12/18 at New England 12/25 Las Vegas 12/31 Cincinnati 01/07 at L.A. Chargers TOTALS 6 24 4.0 9 2 0 0 0 0.0 0 0
JAMES
2023
PRESEASON INDIVIDUAL GAME-BY-GAME STATS
KICKOFF RETURNS: RICHIE JAMES DENERIC PRINCE NIKKO REMIGIO DATE OPP. NO. YDS AVG LG FC TD NO. YDS AVG LG FC TD NO. YDS AVG LG FC TD 08/13 at New Orleans 1 31 31.0 31 0 0 2 36 18.0 20 0 0 1 21 21.0 21 0 0 08/19 at Arizona 0 0 0.0 0 0 0 1 21 21.0 21 0 0 DID NOT PLAY 08/26 Cleveland 0 0 0.0 0 0 0 3 55 18.3 22 0 0 DID NOT PLAY TOTALS 1 31 31.0 31 0 0 6 112 18.7 22 0 0 1 21 21.0 21 0 0 KICKOFF RETURNS: IHMIR SMITH-MARSETTE DATE OPP. NO. YDS AVG LG FC TD 08/13 at New Orleans 1 6 6.0 6 0 0 08/19 at Arizona 0 0 0.0 0 0 0 08/26 Cleveland 0 0 0.0 0 0 0 TOTALS 1 6 6.0 6 0 0
2023 REGULAR SEASON KANSAS CITY CHIEFS PLAYER PARTICIPATION DET AT JAX CHI PLAYERS 9/7 9/17 9/24 10/1 10/8 10/12 10/22 10/29 11/5 11/20 11/26 12/3 12/10 12/18 12/25 12/31 1/7 GP GS DNP IN Nick Allegretti P P P - - - - - - - - - - - - - - 3 0 0 0 Felix Anudike-Uzomah P P P - - - - - - - - - - - - - - 3 0 0 0 Blake Bell P P P - - - - - - - - - - - - - - 3 0 0 0 Nick Bolton LB LB * - - - - - - - - - - - - - - 2 2 0 1 Ekow Boye-Doe PS PS PS - - - - - - - - - - - - - - 0 0 0 0 Deon Bush PS PS PS - - - - - - - - - - - - - - 0 0 0 0 Matt Bushman P PS PS - - - - - - - - - - - - - - 1 0 0 0 Harrison Butker P P P - - - - - - - - - - - - - - 3 0 0 0 Mike Caliendo P P P - - - - - - - - - - - - - - 3 0 0 0 Leo Chenal P P P - - - - - - - - - - - - - - 3 0 0 0 Cole Christiansen PS PS P - - - - - - - - - - - - - - 1 0 0 0 Keondre Coburn P * * - - - - - - - - - - - - - - 1 0 0 2 Jack Cochrane P P P - - - - - - - - - - - - - - 3 0 0 0 Chamarri Conner S P S - - - - - - - - - - - - - - 3 2 0 0 Bryan Cook S S S - - - - - - - - - - - - - - 3 3 0 0 Mike Danna DE DE DE - - - - - - - - - - - - - - 3 3 0 0 Matt Dickerson P P PS - - - - - - - - - - - - - - 2 0 0 0 Clyde Edwards-Helaire RB P P - - - - - - - - - - - - - - 3 1 0 0 Mike Edwards P P P - - - - - - - - - - - - - - 3 0 0 0 Neil Farrell * * P - - - - - - - - - - - - - - 1 0 0 2 Jody Fortson IR IR IR - - - - - - - - - - - - - - 0 0 0 0 Blaine Gabbert DNP DNP P - - - - - - - - - - - - - - 1 0 2 0 Willie Gay LB LB LB - - - - - - - - - - - - - - 3 3 0 0 Noah Gray TE TE TE - - - - - - - - - - - - - - 3 3 0 0 Malik Herring P P P - - - - - - - - - - - - - - 3 0 0 0 Creed Humphrey C C C - - - - - - - - - - - - - - 3 3 0 0 Richie James P P IR - - - - - - - - - - - - - - 2 0 0 0 Nazeeh Johnson IR IR IR - - - - - - - - - - - - - - 0 0 0 0 Cam Jones P P P - - - - - - - - - - - - - - 3 0 0 0 Chris Jones DNR DT DT - - - - - - - - - - - - - - 2 2 0 0 Nic Jones * * * - - - - - - - - - - - - - - 0 0 0 3 Truman Jones PS PS PS - - - - - - - - - - - - - - 0 0 0 0 George Karlaftis DE DE DE - - - - - - - - - - - - - - 3 3 0 0 Travis Kelce * TE TE - - - - - - - - - - - - - - 2 2 0 1 Darian Kinnard PS PS PS - - - - - - - - - - - - - - 0 0 0 0 Patrick Mahomes QB QB QB - - - - - - - - - - - - - - 3 3 0 0 Trent McDuffie CB CB CB - - - - - - - - - - - - - - 3 3 0 0 Jerick McKinnon P P P - - - - - - - - - - - - - - 3 0 0 0 Skyy Moore WR P WR - - - - - - - - - - - - - - 3 2 0 0 Wanya Morris * * * - - - - - - - - - - - - - - 0 0 0 3 Lucas Niang * * * - - - - - - - - - - - - - - 0 0 0 3 Derrick Nnadi DT DT DT - - - - - - - - - - - - - - 3 3 0 0 Chris Oladokun PS PS PS - - - - - - - - - - - - - - 0 0 0 0 Charles Omenihu R/SUS R/SUS R/SUS - - - - - - - - - - - - - - 0 0 0 0 Isiah Pacheco P RB RB - - - - - - - - - - - - - - 3 2 0 0 La'Mical Perine PS * PS - - - - - - - - - - - - - - 0 0 0 1 Cornell Powell PS PS PS - - - - - - - - - - - - - - 0 0 0 0 Deneric Prince PS PS PS - - - - - - - - - - - - - - 0 0 0 0 Justin Reid S S S - - - - - - - - - - - - - - 3 3 0 0 Austin Reiter PS PS PS - - - - - - - - - - - - - - 0 0 0 0 Nikko Remigio ^ IR ^ - - - - - - - - - - - - - - 0 0 0 0 Rashee Rice P P P - - - - - - - - - - - - - - 3 0 0 0 Justyn Ross P P P - - - - - - - - - - - - - - 3 0 0 0 Danny Shelton PS PS ^ - - - - - - - - - - - - - - 0 0 0 0 Donovan Smith LT LT LT - - - - - - - - - - - - - - 3 3 0 0 Trey Smith RG RG RG - - - - - - - - - - - - - - 3 3 0 0 L'Jarius Sneed CB CB CB - - - - - - - - - - - - - - 3 3 0 0 Jawaan Taylor RT RT RT - - - - - - - - - - - - - - 3 3 0 0 B.J. Thompson * * * - - - - - - - - - - - - - - 0 0 0 3 Joe Thuney LG LG LG - - - - - - - - - - - - - - 3 3 0 0 Kadarius Toney WR P P - - - - - - - - - - - - - - 3 1 0 0 Tommy Townsend P P P - - - - - - - - - - - - - - 3 0 0 0 Drue Tranquill P P LB - - - - - - - - - - - - - - 3 1 0 0 Marquez ValdesScantling WR WR WR - - - - - - - - - - - - - - 3 3 0 0 Prince Tega Wanogho P P P - - - - - - - - - - - - - - 3 0 0 0 Montrell Washington PS PS P - - - - - - - - - - - - - - 1 0 0 0 Jaylen Watson P P P - - - - - - - - - - - - - - 3 0 0 0 Justin Watson P WR P - - - - - - - - - - - - - - 3 1 0 0 Tershawn Wharton DT P P - - - - - - - - - - - - - - 3 1 0 0
LEGEND:
Starters indicated by position (Bold), P=Played, DNP=Did Not Play, *=Inactive, PS=Practice Squad, IR=Reserve/Injured, DNR=Reserve/Did Not Report, R/SUS=Reserve/League Susp.,
Joshua Williams P CB P - - - - - - - - - - - - - - 3 1 0 0 James Winchester P P P - - - - - - - - - - - - - - 3 0 0 0
^=With Other Team 2023 REGULAR SEASON OFFENSE DATE OPPONENT TE TE LT LG C RG RT WR WR QB RB TE 9/7 Detroit Noah Gray Donovan Smith Joe Thuney Creed Humphrey Trey Smith Jawaan Taylor Kadarius Toney/ Marquez ValdesScantling/ Skyy Moore Patrick Mahomes Clyde EdwardsHelaire 9/17 at Jacksonville Travis Kelce Noah Gray Jawaan Taylor Joe Thuney Creed Humphrey Trey Smith Donovan Smith Justin Watson Marquez ValdesScantling Patrick Mahomes Isiah Pacheco 9/24 Chicago Noah Gray/ Travis Kelce Joe Thuney Creed Humphrey Trey Smith Donovan Smith Marquez ValdesScantling/ Skyy Moore Patrick Mahomes Isiah Pacheco 10/1 at N.Y. Jets 10/8 at Minnesota 10/12 Denver 10/22 L.A. Chargers 10/29 at Denver 11/5 Miami 11/20 Philadelphia 11/26 at Las Vegas 12/3 at Green Bay 12/10 Buffalo 12/18 at New England 12/25 Las Vegas 12/31 Cincinnati 1/7 at L.A. Chargers 2023 REGULAR SEASON DEFENSE DATE OPPONENT DE DT DT DB LB LB CB CB CB S S 9/7 Detroit George Karlaftis / Mike Danna Tershawn Whar ton/ Derrick Nnadi Chamarri Conn er Nick Bolton/ Willie Gay L'Jarius Sneed/ Trent McDuffie Bryan Cook/ Justin Reid 9/17 at Jacksonville George Karlaftis Chris Jones Mike Danna Derrick Nnadi Willie Gay/ Nick Bolton Trent McDuffie/ L'Jarius Sneed/ Joshua Williams Justin Reid/ Bryan Cook 9/24 Chicago George Karlaftis / Mike Danna Chris Jones/ Derrick Nnadi Chamarri Conn er Willie Gay/ Drue Tranquill L'Jarius Sneed/ Trent McDuffie Bryan Cook/ Justin Reid 10/1 at N.Y. Jets 10/8 at Minnesota 10/12 Denver 10/22 L.A. Chargers 10/29 at Denver 11/5 Miami 11/20 Philadelphia 11/26 at Las Vegas 12/3 at Green Bay 12/10 Buffalo 12/18 at New England 12/25 Las Vegas 12/31 Cincinnati 1/7 at L.A. Chargers
2023 REGULAR SEASON - CAPTAINS
DATE OPPONENT OFFENSE DEFENSE SPECIAL TEAMS 9/7 Detroit Patrick Mahomes Nick Bolton Harrison Butker 9/17 at Jacksonville Jawaan Taylor Justin Reid Tommy Townsend 9/24 Chicago Travis Kelce Chris Jones James Winchester 10/1 at N.Y. Jets 10/8 at Minnesota 10/12 Denver 10/22 L.A. Chargers 10/29 at Denver 11/5 Miami 11/20 Philadelphia 11/26 at Las Vegas 12/3 at Green Bay 12/10 Buffalo 12/18 at New England 12/25 Las Vegas 12/31 Cincinnati 1/7 at L.A. Chargers
2023 REGULAR SEASON INACTIVES
DATE OPPONENT
9/7 Detroit Neil Farrell Nic Jones Travis Kelce Wanya Morris Lucas Niang B.J. Thompson 9/17 at Jacksonville Keondre Coburn Neil Farrell Nic Jones Wanya Morris Lucas Niang La'Mical Perine B.J. Thompson 9/24 Chicago Nick Bolton Keondre Coburn Nic Jones Wanya Morris Lucas Niang B.J. Thompson 10/01 at N.Y. Jets 10/08 at Minnesota 10/12 Denver 10/22 L.A. Chargers 10/29 at Denver 11/05 Miami 11/20 Philadelphia 11/26 at Las Vegas 12/03 at Green Bay 12/10 Buffalo 12/18 at New England 12/25 Las Vegas 12/31 Cincinnati 01/07 at L.A. Chargers
PLAYERS
2023
2023 REGULAR SEASON - DEFENSIVE TAKEAWAYS DATE OPPONENT TAKEAWAY QTR. SCORE YD-LINE RESULT 09/07 Detroit B. Cook FR (T. McDuffie FF) 2 7-7 KC-7 Punt 09/17 at Jacksonville L. Sneed FR (T. Lawrence fumble) 2 0-3 KC-43 INT 09/24 Chicago W. Gay FR (T. McDuffie FF) M. Edwards INT (J. Fields) 2 2 21-0 24-0 CHI-26 CHI-42 FG TD 10/01 10/08 10/12 10/22 10/29 11/05 11/20 11/26 12/03 12/10 12/18 12/25 12/31 01/07 2023 REGULAR SEASON - OFFENSIVE GIVEAWAYS DATE OPPONENT TAKEAWAY QTR. SCORE YD-LINE RESULT 09/07 Detroit P. Mahomes INT (B. Branch) 3 14-14 50 TD 09/17 at Jacksonville J. Watson fumble (D. Williams FF; F. Oluokun FR) P. Mahomes INT (A. Cisco) 2 2 0-3 0-3 JAX-48 JAX-12 Fumble Downs 09/24 Chicago B. Gabbert INT (J. Sanborn) B. Gabbert INT (Q. Johnson) 3 4 41-0 41-3 CHI-30 CHI-25 FG TD 10/01 10/08 10/12 10/22 10/29 11/05 11/20 11/26 12/03 12/10 12/18 12/25 12/31 01/07 2023 REGULAR SEASON - SPECIAL TEAMS/MISC GIVEAWAYS DATE OPPONENT TAKEAWAY QTR. SCORE YD-LINE RESULT 09/17 at Jacksonville R. James; T. Jones FR 2 0-0 KC-17 FG
REGULAR SEASON - TURNOVERS
5 Giveaways 17 Points (2 TD, 1 FG) Ratio -2 (4 takes, 6 gives)
4 Takeaways 10 Points (1 TD, 1 FG)
Teams: 1 Giveaway 3 Points (0 TD, 1 FG) Points Off Turnovers Ratio -10 (10 scored, 20 allowed) 0 Takeaways 0 Points (0 TD, 0 FG)
Offense:
Defense:
Special
DATE OPPONENT OFFENSE DEFENSE 09/07 Detroit TD - Pass TD - Pass FG - 35 yards TD - Pass Fumble TD - Run 09/17 at Jacksonville TD - Pass TD - Pass FG - 38 yards End of Game FG - 32 yards FG - 22 yards Downs 09/24 Chicago TD - Pass TD - Run TD - Pass TD - Run TD - Pass FG - 21 yards TD - Pass 10/01 at N.Y. Jets 10/08 at Minnesota 10/12 Denver 10/22 L.A. Chargers 10/29 at Denver 11/05 Miami 11/20 Philadelphia 11/26 at Las Vegas 12/03 at Green Bay 12/10 Buffalo 12/18 at New England 12/25 Las Vegas 12/31 Cincinnati 01/07 at L.A. Chargers OFFENSEDEFENSE Inside the 20 12 8 Scores 11 6 Touchdowns 9 3 Field Goals 2 3 Total Points in 20 69 30 Fumbles 0 1 Interceptions 0 0 Missed Field Goals 0 0 Lost on Downs 0 1 End of Half/Game 1 0 TDs Outside 0 0 Red-Zone Percentage 75.0 37.5
DATE OPPONENT OFFENSE DEFENSE 09/07 Detroit TD - Pass TD - Pass NONE 09/17 at Jacksonville TD - Pass Field Goal - 38 yards End of Game Field Goal - 22 yards 09/24 Chicago TD - Pass TD - Run TD - Pass TD - Run TD - Pass Field Goal - 21 yards 10/01 at N.Y. Jets 10/08 at Minnesota 10/12 Denver 10/22 L.A. Chargers 10/29 at Denver 11/05 Miami 11/20 Philadelphia 11/26 at Las Vegas 12/03 at Green Bay 12/10 Buffalo 12/18 at New England 12/25 Las Vegas 12/31 Cincinnati 01/07 at L.A. Chargers OFFENSEDEFENSE Goal-To-Go Situations 10 2 Scores 9 2 Touchdowns 8 0 Field Goals 1 2 Total Points 59 6 Fumbles 0 0 Interceptions 0 0 Missed Field Goals 0 0 Missed Field Goals (G2G) 0 0 Lost on Downs 0 0 End of Half/Game 1 0 Goal-to-Go Percentage 80.0 0.0
2023 REGULAR
DATE OPPONENT QTR CHIEFS PLAYER YDS. DOWN RESULT QTR OPP. PLAYER YDS. DOWN RESULT 09/07 DET 2 Patrick Mahomes 16 2-10-DET 25 Touchdown 1 4 Jahmyr Gibbs Jahmyr Gibbs 17 18 2-6-KC 41 1-15-DET 29 Touchdown Downs 09/17 at JAX 2 3 4 4 4 Patrick Mahomes Isiah Pacheco Isiah Pacheco Patrick Mahomes Patrick Mahomes 11 31 11 10 14 2-10-KC 25 1-10-KC 19 1-10-KC 40 1-10-JAX 49 2-10-KC 16 Fumble Touchdown Field Goal Field Goal End Game 4 Trevor Lawrence 18 1-10-JAX 47 Downs 09/24 CHI 1 2 2 2 4 4 4 Patrick Mahomes Isiah Pacheco Isiah Pacheco Patrick Mahomes Clyde Edwards-Helaire Jerick McKinnon Clyde Edwards-Helaire 11 18 13 15 12 10 16 1-10-CHI 14 1-10-CHI 46 2-6-CHI 29 1-10-KC 35 1-10-KC 41 3-6-KC 29 2-10-KC 39 Touchdown Touchdown Touchdown Field Goal Interception End Game End Game 1 1 4 Khalil Herbert Justin Fields Roschon Johnson 11 17 11 3-3-CHI 32 1-10-CHI 43 2-9-CHI 40 Punt Punt Touchdown 10/08 at MIN 10/12 DEN 10/22 LAC 10/29 at DEN 11/05 MIA 11/20 PHI 11/26 at LV 12/03 at GB 12/10 BUF 12/18 at NE 12/25 LV 12/31 CIN 01/07 at LAC TOTALS 13 - 188 (14.5), 0 TDS 6 - 92 (15.3), 0 TDS
SEASON - BIG RUN PLAYS (10+ YARDS)
2023 REGULAR SEASON - BIG PASS PLAYS (20+ YARDS) DATE OPPONENT QTR CHIEFS PLAYER YDS. DOWN RESULT QTR OPP. PLAYER YDS. DOWN RESULT 09/07 DET 2 2 2 3 Patrick Mahomes -> Rashee Rice Patrick Mahomes -> Marquez Valdes-Scantling Patrick Mahomes -> Justin Watson Patrick Mahomes -> Noah Gray 25 34 26 24 1-10-KC 18 3-17-KC 36 1-10-DET 30 2-6-KC 36 Touchdown Touchdown Touchdown Field Goal 1 2 3 4 Jared Goff -> Josh Reynolds Jared Goff -> Amon-Ra St. Brown Jared Goff -> Kalif Raymond Jared Goff -> Josh Reynolds 21 21 20 33 1-10-DET 34 2-7-DET 39 2-22-DET 13 1-10-KC 47 Touchdown Fumble Punt Touchdown 09/17 at JAX 3 4 Patrick Mahomes -> Justin Watson Patrick Mahomes -> Skyy Moore 34 54 3-10- 50 3-6-KC 34 Touchdown End Game 2 3 Trevor Lawrence -> Calvin Ridley Trevor Lawrence -> Christian Kirk 26 45 1-10-JAX 36 1-10-JAX 23 Field Goal Field Goal 09/24 CHI 1 1 2 3 Patrick Mahomes -> Travis Kelce Patrick Mahomes -> Skyy Moore Patrick Mahomes -> Justin Watson Patrick Mahomes -> Marquez Valdes-Scantling 24 21 37 37 1-10-KC 41 1-10-CHI 35 2-6-KC 16 3-6-KC 40 Touchdown Touchdown Touchdown Touchdown 4 Justin Fields -> DJ Moore 29 2-5-KC 44 Touchdown 10/08 at MIN 10/12 DEN 10/22 LAC 10/29 at DEN 11/05 MIA 11/20 PHI 11/26 at LV 12/03 at GB 12/10 BUF 12/18 at NE 12/25 LV 12/31 CIN 01/07 at LAC TOTALS 10 - 316 (31.6), 0 TDS 7 - 195 (27.9), 0 TDS
2023 REGULAR SEASON - BIG PASS PLAYS (20+ YARDS) DATE OPPONENT QTR CHIEFS PLAYER YDS. DOWN RESULT QTR OPP. PLAYER YDS. DOWN RESULT 09/07 DET 2 2 2 3 Patrick Mahomes -> Rashee Rice Patrick Mahomes -> Marquez Valdes-Scantling Patrick Mahomes -> Justin Watson Patrick Mahomes -> Noah Gray 25 34 26 24 1-10-KC 18 3-17-KC 36 1-10-DET 30 2-6-KC 36 Touchdown Touchdown Touchdown Field Goal 1 2 3 4 Jared Goff -> Josh Reynolds Jared Goff -> Amon-Ra St. Brown Jared Goff -> Kalif Raymond Jared Goff -> Josh Reynolds 21 21 20 33 1-10-DET 34 2-7-DET 39 2-22-DET 13 1-10-KC 47 Touchdown Fumble Punt Touchdown 09/17 at JAX 3 4 Patrick Mahomes -> Justin Watson Patrick Mahomes -> Skyy Moore 34 54 3-10- 50 3-6-KC 34 Touchdown End Game 2 3 Trevor Lawrence -> Calvin Ridley Trevor Lawrence -> Christian Kirk 26 45 1-10-JAX 36 1-10-JAX 23 Field Goal Field Goal 09/24 CHI 1 1 2 3 Patrick Mahomes -> Travis Kelce Patrick Mahomes -> Skyy Moore Patrick Mahomes -> Justin Watson Patrick Mahomes -> Marquez Valdes-Scantling 24 21 37 37 1-10-KC 41 1-10-CHI 35 2-6-KC 16 3-6-KC 40 Touchdown Touchdown Touchdown Touchdown 4 Justin Fields -> DJ Moore 29 2-5-KC 44 Touchdown 10/08 at MIN 10/12 DEN 10/22 LAC 10/29 at DEN 11/05 MIA 11/20 PHI 11/26 at LV 12/03 at GB 12/10 BUF 12/18 at NE 12/25 LV 12/31 CIN 01/07 at LAC TOTALS 10 - 316 (31.6), 0 TDS 7 - 195 (27.9), 0 TDS
2023 REGULAR SEASON CHIEFS ADVANCES DATE OPPONENT RUSHES COMPLETIONS ADVANCES OUTCOME 09/07 Detroit 23 21 44 L 21-20 09/17 at Jacksonville 22 29 51 W 17-9 09/24 Chicago 37 27 64 W 41-10 10/01 at N.Y. Jets 10/08 at Minnesota 10/12 Denver 10/22 L.A. Chargers 10/29 at Denver 11/05 Miami 11/20 Philadelphia 11/26 at Las Vegas 12/03 at Green Bay 12/10 Buffalo 12/18 at New England 12/25 Las Vegas 12/31 Cincinnati 01/07 at L.A. Chargers TOTALS 82 77 159 2023 REGULAR SEASON OPPONENT ADVANCES DATE OPPONENT RUSHES COMPLETIONS ADVANCES OUTCOME 09/07 Detroit 34 22 56 L 21-20 09/17 at Jacksonville 18 23 41 W 17-9 09/24 Chicago 26 11 37 W 41-10 10/01 at N.Y. Jets 10/08 at Minnesota 10/12 Denver 10/22 L.A. Chargers 10/29 at Denver 11/05 Miami 11/20 Philadelphia 11/26 at Las Vegas 12/03 at Green Bay 12/10 Buffalo 12/18 at New England 12/25 Las Vegas 12/31 Cincinnati 01/07 at L.A. Chargers TOTALS 78 56 134 CHIEFS RECORD WHEN: Having 45 or more advances 2 - 0 Having 50 or more advances 2 - 0 Having less than 45 advances 0 - 1 Having less than 50 advances 0 - 1 Allowing 45 or more advances 0 - 1 Allowing 50 or more advances 0 - 1 Allowing less than 45 advances 2 - 0 Allowing less than 50 advances 2 - 0 NOTE: Advances equal to all rushing attempts plus completions.
CHIEFS
REGULAR SEASON SCORING
DATE OPPONENT ACQUIRED DRIVE START PLAYS YARDS Q TIME FIRST DOWNS SCORING PLAY KC OPP 09/07 Detroit Kickoff Punt Punt Punt KC 25 KC 18 KC 10 KC 32 13 6 8 8 75 82 73 47 Q1 Q2 Q3 Q3 5:56 1:28 3:34 3:55 5 4 3 2 Q2: R. Rice: 1-yard pass from P. Mahomes B. Bell: 4-yard pass from P. Mahomes H. Butker: 35-yard FG Q4: H. Butker: 39-yard FG 7 14 17 20 7 7 14 14 09/17 at Jacksonville Downs Kickoff Kickoff 50 yard line KC 19 KC 25 7 7 13 50 81 55 Q2 Q3 Q4 3:37 3:30 5:33 3 3 5 S. Moore: 9-yard pass from P. Mahomes T. Kelce: 9-yard pass from P. Mahomes H. Butker: 38-yard FG 7 14 17 3 6 9 09/24 Chicago Punt Punt Punt Fumble Interception Punt Punt KC 41 KC 20 KC 12 CHI 26 CHI 26 KC 35 KC 36 6 11 11 4 3 5 11 59 80 88 3 26 45 64 Q1 Q1 Q2 Q2 Q2 Q2 Q3 2:45 5:57 5:24 1:06 0:31 0:35 5:14 5 6 5 0 3 2 4 J. McKinnon: 6-yard pass from P. Mahomes Q2: C. Edwards-Helaire: 1-yard run J. McKinnon: 3-yard pass from P. Mahomes H. Butker: 41-yard FG I. Pacheco: 1-yard run H. Butker: 38-yard FG T. Kelce: 3-yard pass from P. Mahomes 7 14 21 24 31 34 41 0 0 0 0 0 0 0 10/01 10/08 10/12 10/22 10/29 11/05 11/20 11/26 12/03 12/10 12/18 12/25 12/31 01/07 AVG 8.1 59.1 3:30 3.6 TOTALS 113 828 49:05 50
2023
DRIVES
CHIEFS OPPONENTS 2023 REGULAR SEASON SCORING DRIVES DATE OPPONENT ACQUIRED DRIVE START PLAYS YARDS Q TIME FIRST DOWNS SCORING PLAY KC OPP 09/07 Detroit Punt Kickoff DET 9 DET 25 14 9 91 75 Q1 Q4 8:04 5:05 6 4 A. St. Brown: 9-yard pass from J. Goff D. Montgomery: 8-yard run 0 20 7 21 09/17 at Jacksonville Muffed Punt Kickoff Punt KC 17 JAX 25 JAX 23 4 5 9 3 44 73 Q2 Q2 Q3 1:52 0:27 3:16 0 2 3 B. McManus: 32-yard FG B. McManus: 49-yard FG Q4: B. McManus: 22-yard FG 0 7 14 3 6 9 09/24 Chicago Interception Interception KC 28 CHI 25 11 9 25 75 Q3 Q4 4:42 2:49 2 4 Q4: C. Santos: 21-yard FG D. Moore: 9-yard pass from J. Fields 41 41 3 10 10/01 10/08 10/12 10/22 10/29 11/05 11/20 11/26 12/03 12/10 12/18 12/25 12/31 01/07 AVG 8.7 55.1 3:45 3.0 TOTALS 61 386 26:15 21
Regular Season
of September 26, 2023) PASSING 500 YARDS PASSING KC 11/5/2000 @ Oakland 504 yards Elvis Grbac Opp 12/6/1990 @ Houston Oilers 527 yards Warren Moon 40+ PASS ATTEMPTS KC 9/17/2023 @ Jacksonville 41 att. Patrick Mahomes Opp 9/17/2023 @ Jacksonville 41 att. Trevor Lawrence 50+ PASS ATTEMPTS KC 11/6/2022 vs. Tennessee 68 att. Patrick Mahomes Opp 10/2/2022 @ Tampa Bay 52 att. Tom Brady 400 YARDS PASSING KC 11/6/2022 vs. Tennessee 446 yards Patrick Mahomes Opp 1/2/2022 @ Cincinnati 446 yards Joe Burrow 300 YARDS PASSING KC 9/17/2023 @ Jacksonville 305 yards Patrick Mahomes Opp 10/23/2022 @ San Francisco 303 yards Jimmy Garoppolo SIX TOUCHDOWN PASSES KC 11/19/2018 @ L.A. Rams 6 tds Patrick Mahomes: (25, 21, 8, 4, 73, 10) Opp * Never Has Happened * SEVEN TOUCHDOWN PASSES KC * Never Has Happened * Opp * Never Has Happened * FIVE TOUCHDOWN PASSES KC 9/11/2022 @ Arizona 5 tds Patrick Mahomes: (9, 3, 4, 1, 2) Opp 10/8/2017 @ Houston 5 tds Deshaun Watson: (6, 9, 48, 34, 1) FOUR TOUCHDOWN PASSES KC 11/13/2022 vs. Jacksonville 4 tds Patrick Mahomes: (6, 18, 13, 7) Opp 1/2/2022 @ Cincinnati 4 tds Joe Burrow: (72, 18, 69, 5) THREE TOUCHDOWN PASSES KC 9/24/2023 vs. Chicago 3 tds Patrick Mahomes: (6, 3, 3) Opp 12/11/2022 @ Denver 3 tds Russell Wilson: (18, 5, 66) SEVEN+ INTERCEPTIONS THROWN KC * Never Has Happened * Opp
Never Has Happened *
INTERCEPTIONS THROWN KC
Never Has Happened * Opp 9/25/2016 vs. N.Y. Jets 6 ints Ryan Fitzpatrick FIVE INTERCEPTIONS THROWN KC
Never Has Happened * Opp * Never Has Happened * FOUR INTERCEPTIONS THROWN KC 12/13/2009 vs. Buffalo 4 ints Matt Cassel Opp 11/18/2019 @ L.A. Chargers 4 ints Philip Rivers THREE INTERCEPTIONS THROWN KC 12/11/2022 @ Denver 3 ints Patrick Mahomes Opp 11/18/2019 @ L.A. Chargers 4 ints Philip Rivers TWO INTERCEPTIONS THROWN KC 9/24/2023 vs. Chicago 2 ints Blaine Gabbert Opp 11/27/2022 vs. L.A. Rams 2 ints Bryce Perkins RUSHING 300 YARDS RUSHING KC
Never Has Happened * Opp * Never Has Happened * 200 YARDS RUSHING KC 12/23/2012 vs. Indianapolis 226 yards Jamaal Charles Opp 12/20/2009 vs. Cleveland 286 yards Jerome Harrison
2023
(As
*
SIX
*
*
*
*
150-199 YARDS RUSHING KC 10/19/2020 @ Buffalo 161 yards Clyde Edwards-Helaire Opp 10/10/2022 vs. Las Vegas 154 yards Josh Jacobs 100 YARDS RUSHING KC 11/20/2022 @ L.A. Chargers 107 yards Isiah Pacheco Opp 12/24/2022 vs. Seattle 107 yards Kenneth Walker III 100-149 YARDS RUSHING KC 11/20/2022 @ L.A. Chargers 107 yards Isiah Pacheco Opp 12/24/2022 vs. Seattle 107 yards Kenneth Walker III
TOUCHDOWNS RUSHING KC * Never Has Happened * Opp 12/7/2003 @ Denver 5 tds Clinton Portis: (11, 1, 59, 28, 53)
TOUCHDOWNS RUSHING KC 10/24/2004 vs. Atlanta 4 tds 4 tds Derrick Blaylock: (7, 1, 3, 2) Priest Holmes: (15, 2, 2, 1) Opp 12/7/2003 @ Denver 5 tds Clinton Portis: (11, 1, 59, 28, 53) THREE TOUCHDOWNS RUSHING KC 9/28/2015 @ Green Bay 3 tds Jamaal Charles: (9, 4, 7) Opp 9/22/2019 vs. Baltimore 3 tds Mark Ingram II: (2, 19, 1)
TOUCHDOWNS RUSHING KC 10/23/2022 @ San Francisco 2 tds Mecole Hardman: (25, 3) Opp 1/1/2023 vs. Denver 2 tds Russell Wilson: (16, 4)
PLAYERS WITH TWO TD RUSHING KC 10/24/2004 vs. Atlanta Derrick Blaylock: (7, 1, 3, 2) Priest Holmes: (15, 2, 2, 1) Opp
FIVE
FOUR
TWO
TWO
Never Has Happened * 150 YARDS RUSHING KC 10/19/2020 @ Buffalo 161 yards Clyde Edwards-Helaire Opp 10/10/2022 vs. Las Vegas 154 yards Josh Jacobs 30+ RUSHING ATTEMPTS KC 9/21/2014 @ Miami 32 att. Knile Davis Opp 10/15/2017 vs. Pittsburgh 32 att. Le'Veon Bell 50-74 YARD RUSHING KC 9/24/2023 vs. Chicago 62 yards 55 yards Isiah Pacheco Clyde Edwards-Helaire Opp 9/7/2023 vs. Detroit 74 yards David Montgomery 75+ YARD RUSHING KC 12/18/2022 @ Houston 86 yards Isiah Pacheco Opp 12/24/2022 vs. Seattle 107 yards Kenneth Walker III 30-39 RUSHING ATTEMPTS KC 9/21/2014 @ Miami 32 att. Knile Davis Opp 10/15/2017 vs. Pittsburgh 32 att. Le'Veon Bell 40+ RUSHING ATTEMPTS KC * Never Has Happened * Opp * Never Has Happened * 400 YARDS RUSHING (TEAM) KC * Never Has Happened * Opp * Never Has Happened * 300 YARDS RUSHING (TEAM) KC 12/23/2012 vs. Indianapolis 352 yards Indianapolis 20, Kansas City 13 Opp 12/20/2009 vs. Cleveland 351 yards Cleveland 41, Kansas City 34 200 YARDS RUSHING (TEAM) KC 10/3/2021 @ Philadelphia 200 yards Kansas City 42, Philadelphia 30 Opp 9/19/2021 @ Baltimore 251 yards Baltimore 36, Kansas City 35 200-299 YARDS RUSHING (TEAM) KC 10/3/2021 @ Philadelphia 200 yards Kansas City 42, Philadelphia 30
Opp 9/19/2021 @ Baltimore 251 yards Baltimore 36, Kansas City 35 200+ YARDS RUSHING (TEAM) KC 10/3/2021 @ Philadelphia 200 yards Kansas City 42, Philadelphia 30 Opp 9/19/2021 @ Baltimore 251 yards Baltimore 36, Kansas City 35 300+ YARDS RUSHING (TEAM) KC 12/23/2012 vs. Indianapolis 352 yards Indianapolis 20, Kansas City 13 Opp 12/20/2009 vs. Cleveland 351 yards Cleveland 41, Kansas City 34 RECEIVING TWO 100-YARD RECEIVERS KC 10/23/2022 @ San Francisco 124 yards 111 yards JuJu Smith-Schuster Marquez Valdes-Scantling Opp 9/16/2018 @ Pittsburgh 138 yards 121 yards Jesse James JuJu Smith-Schuster 200 YARDS RECEIVING KC 9/17/1990 @ Denver 206 yards Stephon Paige Opp 1/2/2022 @ Cincinnati 266 yards Ja'Marr Chase 100 YARDS RECEIVING KC 12/24/2022 vs. Seattle 113 yards Travis Kelce Opp 9/17/2023 @ Jacksonville 110 yards Christian Kirk FOUR TOUCHDOWN RECEPTIONS KC 10/10/2022 vs. Las Vegas 4 tds Travis Kelce: (1, 4, 8, 1) Opp 12/1/2013 vs. Denver 4 tds Eric Decker: (41, 37, 15, 1) FIVE TOUCHDOWN RECEPTIONS KC * Never Has Happened * Opp * Never Has Happened * THREE TOUCHDOWN RECEPTIONS KC 11/20/2022 @ L.A. Chargers 3 tds Travis Kelce: (4, 32, 17) Opp 12/11/2022 @ Denver 3 tds Jerry Jeudy: (18, 5, 7) TWO TOUCHDOWN RECEPTIONS KC 9/24/2023 vs. Chicago 2 tds Jerick McKinnon: (6, 3) Opp 12/11/2022 @ Denver 3 tds Jerry Jeudy: (18, 5, 7)
PLAYERS
KC 11/19/2018 @ L.A. Rams Tyreek Hill: (25, 73) Chris Conley: (8, 10) Opp 10/8/2017 @ Houston DeAndre Hopkins: (6, 34, 1) Will Fuller V: (9, 48) 150 YARDS RECEIVING KC 12/16/2021 @ L.A. Chargers 191 yards Travis Kelce Opp 1/2/2022 @ Cincinnati 266 yards Ja'Marr Chase 10 OR MORE RECEPTIONS KC 12/18/2022 @ Houston 10 10 JuJu Smith-Schuster Travis Kelce Opp 9/17/2023 @ Jacksonville 11 Christian Kirk 100-149 YARDS RECEIVING KC 12/24/2022 vs. Seattle 113 yards Travis Kelce Opp 9/17/2023 @ Jacksonville 110 yards Christian Kirk 150-199 YARDS RECEIVING KC 12/16/2021 @ L.A. Chargers 191 yards Travis Kelce Opp 10/27/2019 vs. Green Bay 159 yards Aaron Jones 200-299 YARDS RECEIVING KC 11/29/2020 @ Tampa Bay 269 yards Tyreek Hill Opp 1/2/2022 @ Cincinnati 266 yards Ja'Marr Chase 300+ YARDS RECEIVING KC
Never Has Happened * Opp
Never Has Happened * COMBINED YARDS
TWO
WITH TWO TD RECEPTIONS
*
*
RUSHER AND 300-YARD PASSER
AND 300-YARD
RUSHER, 300-YARD PASSER, 100-YARD RECEIVER
TWO
RECEIVERS/300-YARD PASSER
(4:43) 3-R.Wilson pass short middle intended for 89-B.Johnson INTERCEPTED by 50-W.Gay at DEN 47. 50-W.Gay for 47 yards, TOUCHDOWN. DEN-89-B.Johnson was injured during the play.
(11:04) (Shotgun) 15-P.Mahomes pass short right intended for 19-K.Toney INTERCEPTED by 32-B.Branch at 50. 32-B.Branch for 50 yards, TOUCHDOWN.
FUMBLE RETURNED FOR A TOUCHDOWN
(7:57) 25-M.Gordon right guard to KC 13 for -4 yards (24-M.Ingram). FUMBLES (24-M.Ingram), touched at KC 13, RECOVERED by KC-54N.Bolton at KC 14. 54-N.Bolton for 86 yards, TOUCHDOWN.
(6:28) (Shotgun) 26-Dam.Williams up the middle to TEN 45 for -1 yards (51-D.Long). FUMBLES (51-D.Long), RECOVERED by TEN-54-R.Evans at TEN 47. 54-R.Evans for 53 yards, TOUCHDOWN.
KC 10/23/2022 @ San Francisco
Opp 1/3/2021 vs. L.A. Chargers
SAFETY SCORED
Frank Clark
Isaac Rochell
KC 10/23/2011 @ Oakland Kansas City 28, Las Vegas 0 Opp 12/16/2012 @ Oakland Las Vegas 15, Kansas City 0
(8:55) (Shotgun) 10-J.Garoppolo sacked in End Zone for -6 yards, SAFETY (55-F.Clark).
(1:48) (Shotgun) 4-C.Henne sacked in End Zone for -1 yards, SAFETY (98-I.Rochell). SHUTOUT
FIVE+ SACK GAME
Derrick Thomas Opp
KC 9/6/1998 vs. Oakland 6.0 sk
* Never Has Happened * FOUR SACK GAME
Justin Houston Opp 11/9/2003 vs. Cleveland 4.0 sk
KC 12/28/2014 vs. San Diego 4.0 sk
KC 11/21/2021 vs. Dallas 3.5 sk
Opp 9/24/2017 @ L.A. Chargers 3.0 sk
KC 1/7/2023 @ Las Vegas 2.5 sk 2.0 sk
Andra Davis
THREE SACK GAME
Chris Jones
Melvin Ingram III
TWO SACK GAME
Chris Jones
Mike Danna Opp 11/6/2022 vs. Tennessee 2.0 sk
KC 9/29/1985 vs. Seattle 4 ints
Denico Autry
FOUR OR MORE INTERCEPTION GAME
Derron Cherry
KC 11/20/2022 @ L.A. Chargers 107 yards 329 yards Isiah Pacheco Patrick Mahomes Opp 10/14/2018 @ New England 106 yards 340 yards Sony Michel Tom Brady
KC 12/18/2022 @ Houston 105 yards 336 yards Travis Kelce Patrick Mahomes Opp 10/16/2022 vs. Buffalo 148 yards 329 yards Stefon Diggs Josh Allen 100-YARD RUSHER
RECEIVER KC 11/20/2022 @ L.A. Chargers 107 yards 115 yards Isiah Pacheco Travis Kelce Opp 10/10/2022 vs. Las Vegas 154 yards 124 yards Josh Jacobs Davante Adams
KC 11/20/2022 @ L.A. Chargers 107 yards 329 yards 115 yards Isiah Pacheco Patrick Mahomes Travis Kelce Opp 12/1/2013 vs. Denver 117 yards 403 yards 174 yards Montee Ball Peyton Manning Eric Decker 100-YARD RUSHER/TWO
RECEIVERS KC 12/3/2006 @ Cleveland 110 yards 105/117 yards Larry Johnson Tony Gonzalez/Eddie Kennison Opp 12/1/2013 vs. Denver 117 yards 174/106 yards Montee Ball Eric Decker/Demaryius
100-YARD
100-YARD RECEIVER
PASSER
AND 100-YARD
100-YARD
100-YARD
Thomas
KC 10/23/2022 @ San Francisco 124/111 yards 423 yards JuJu Smith-Schuster/Marquez
Patrick Mahomes Opp 9/16/2018 @ Pittsburgh 138/121 yards 452 yards Jesse James/JuJu Smith-Schuster Ben Roethlisberger DEFENSE INTERCEPTED PASS RETURNED FOR A TOUCHDOWN KC 12/11/2022 @ Denver 47 yards Willie Gay
100-YARD
Valdes-Scantling
Opp 9/7/2023 vs. Detroit 50 yards Brian Branch
KC 1/8/2022 @ Denver 86 yards Nick Bolton
Opp 11/10/2019 @ Tennessee 53 yards Rashaan Evans
Opp 10/7/2001 @ Denver 4 int Deltha O'Neal TWO INTERCEPTIONS BY TEAMMATES KC * Never Has Happened * Opp * Never Has Happened * THREE INTERCEPTION GAME KC 11/27/2005 vs. New England 3 int Greg Wesley Opp 10/1/1989 @ Cincinatti 3 ints David Fulcher TWO INTERCEPTION GAME KC 9/19/2021 @ Baltimore 2 int Tyrann Mathieu Opp 12/11/2022 @ Denver 2 int Josey Jewell 70+ YARD INTERCEPTION RETURN KC 9/15/2022 vs. L.A. Chargers 99t yards Jaylen Watson Opp 1/1/2017 @ San Diego 90t yards Jahleel Addae TWO INTERCEPTIONS KC 9/19/2021 @ Baltimore 2 ints Tyrann Mathieu Opp 12/11/2022 @ Denver 2 ints Josey Jewell THREE INTERCEPTIONS KC 11/27/2005 vs. New England 3 ints Greg Wesley Opp * Never Has Happened * FOUR INTERCEPTIONS KC * Never Has Happened * Opp 10/7/2001 @ Denver 4 ints Deltha O'Neal LESS THAN 25 RUSHING YARDS KC 12/16/2012 @ Oakland 10 yards Las Vegas 15, Kansas City 0 Opp 10/2/2022 @ Tampa Bay 3 yards Kansas City 41, Tampa Bay 31 LESS THAN 50 RUSHING YARDS KC 1/1/2023 vs. Denver 46 yards Kansas City 27, Denver 24 Opp 10/2/2022 @ Tampa Bay 3 yards Kansas City 41, Tampa Bay 31 LESS THAN 100 RUSHING YARDS KC 9/17/2023 @ Jacksonville 74 yards Kansas City 17, Jacksonville 9 Opp 9/7/2023 vs. Detroit 90 yards Detroit 21, Kansas City 20 LESS THAN 50 NET PASSING YARDS KC 12/30/2012 @ Denver 26 yards Denver 38, Kansas City 3 Opp 9/20/1998 vs. San Diego -19 yards Kansas City 23, L.A. Chargers 7 LESS THAN 100 NET PASSING YARDS KC 12/30/2012 @ Denver 26 yards Denver 38, Kansas City 3 Opp 9/24/2023 vs. Chicago 87 yards Kansas City 41, Chicago 10 LESS THAN 150 NET PASSING YARDS KC 9/24/2017 @ L.A. Chargers 122 yards Kansas City 24, L.A. Chargers 10 Opp 9/24/2023 vs. Chicago 87 yards Kansas City 41, Chicago 10 LESS THAN 150 YARDS NET OFFENSE KC 12/1/2002 vs. Arizona 122 yards Kansas City 49, Arizona 0 Opp 12/30/2012 @ Denver 119 yards Denver 38, Kansas City 3 LESS THAN 200 YARDS NET OFFENSE KC 11/27/2022 vs. L.A. Rams 198 yards Kansas City 26, L.A. Rams 10 Opp 11/30/2014 vs. Denver 151 yards Denver 29, Kansas City 16 LESS THAN 300 YARDS NET OFFENSE KC 9/24/2023 vs. Chicago 203 yards Kansas City 41, Chicago 10 Opp 12/24/2022 vs. Seattle 297 yards Kansas City 24, Seattle 10 FORCED FOUR TURNOVERS KC 10/10/2021 vs. Buffalo 4 to Buffalo 38, Kansas City 20 Opp 10/25/2020 @ Denver 4 to Kansas City 43, Denver 16 FORCED FIVE+ TURNOVERS KC 11/19/2018 @ L.A. Rams 5 to L.A. Rams 54, Kansas City 51 Opp 12/12/2021 vs. Las Vegas 5 to Kansas City 48, Las Vegas 9 AT LEAST ONE TURNOVER KC 9/24/2023 vs. Chicago 2 to Kansas City 41, Chicago 10 Opp 9/24/2023 vs. Chicago 2 to Kansas City 41, Chicago 10 FORCED THREE+ TURNOVERS KC 10/23/2022 @ San Francisco 3 to Kansas City 44, San Francisco 23 Opp 9/17/2023 @ Jacksonville 3 to Kansas City 17, Jacksonville 9
RETURNED FOR A TOUCHDOWN KC 10/25/2020 @ Denver 102 yards Byron Pringle 8-B.McManus kicks 67 yards from DEN 35 to KC -2. 13-B.Pringle for 102 yards, TOUCHDOWN.
SPECIAL TEAMS KICKOFF
KC
Devin Duvernay
PUNT RETURNED FOR A TOUCHDOWN
Mecole Hardman
7-H.Butker kicks 58 yards from KC 35 to BLT 7. 13-D.Duvernay for 93 yards, TOUCHDOWN.
(13:04) 2-M.Haack punts 37 yards to KC 33, Center-50-B.Ferguson. 17-M.Hardman for 67 yards, TOUCHDOWN.
Travis Benjamin (15:00) (Punt formation) 2-D.Colquitt punts 41 yards to CLV 7, Center-43-T.Gafford. 80T.Benjamin for 93 yards, TOUCHDOWN. Longest Punt Return in Cleveland Franchise History
BLOCKED FIELD GOAL RETURNED FOR A TOUCHDOWN
KC 12/6/1987 @ Cincinnati 28 yards
Opp 11/28/2010 @ Seattle
Kevin Ross
Craig Terrill
BLOCKED PUNT RETURNED FOR A TOUCHDOWN
(5:08) 6-R.Succop 43 yard field goal is BLOCKED (93-C.Terrill), Center-43-T.Gafford, Holder-2D.Colquitt, ball out of bounds at SEA 47. Penalty on KC-6-R.Succop, Illegal Touch Kick, declined. Play Challenged by KC and REVERSED. 6R.Succop 43 yard field goal is BLOCKED (93C.Terrill), Center-43-T.Gafford, Holder-2D.Colquitt, recovered by KC-2-D.Colquitt at SEA 38. 2-D.Colquitt to SEA 38 for no gain (31K.Chancellor). Challenge was whether FG att. passed line of scrim
KC 9/13/2009 @ Baltimore
Jon McGraw
Albert Lewis
MADE FIELD GOAL OF 50 YARDS OR LONGER
BLOCKED FIELD GOAL
(10:09) (Punt formation) 4-S.Koch punt is BLOCKED by 47-J.McGraw, Center-70-M.Katula, RECOVERED by KC-47-J.McGraw at BLT 0. TOUCHDOWN.
(6:03) 7-H.Butker 52 yard field goal is GOOD, Center-41-J.Winchester, Holder-5-T.Townsend.
(7:20) 2-D.Carlson 54 yard field goal is GOOD, Center-47-T.Sieg, Holder-6-A.Cole.
(:05) 7-H.Butker 51 yard field goal is BLOCKED (96-E.Uwazurike), Center-41-J.Winchester, Holder-5-T.Townsend. Opp
vs. Green Bay 37 yards
KC 12/8/2019 @ New England
Opp 11/4/2018 @ Cleveland
KC 12/18/2022 @ Houston
Opp 12/12/2021 vs. Las Vegas
KC 12/1/2019 vs. Oakland
Opp 9/20/2020 @ L.A. Chargers
KC 10/15/2017 vs. Pittsburgh
Opp 11/13/2022 vs. Jacksonville
KC 12/6/2020 vs. Denver 5 fg
Opp 10/14/2018 @ New England 5 fg
KC 10/4/2015 @ Cincinnati 7 fg
Mason Crosby
BLOCKED PUNT
Dustin Colquitt
Britton Colquitt
MISSED POINT AFTER TOUCHDOWN ATTEMPT
Harrison Butker
Daniel Carlson
POINT AFTER TOUCHDOWN ATTEMPT BLOCKED
Daniel Carlson [Tanoh Kpassagnon blocked]
(10:48) 2-M.Crosby 37 yard field goal is BLOCKED (97-A.Okafor), Center-46-S.Wirtel, Holder-7-C.Bojorquez, RECOVERED by KC-91D.Nnadi at KC 19.
(5:19) 2-D.Colquitt punt is BLOCKED by 43N.Ebner, Center-41-J.Winchester, ball out of bounds at KC 19.
(8:10) (Punt formation) 4-B.Colquitt punt is BLOCKED by 26-Dam. Williams, Center-47C.Hughlett, ball out of bounds at CLV 21.
7-H.Butker extra point is No Good, Wide Left, Center-41-J.Winchester, Holder-5-T.Townsend.
2-D.Carlson extra point is No Good, Wide Left, Center-47-T.Sieg, Holder-6-A.Cole.
8-D.Carlson extra point is Blocked (92T.Kpassagnon), Center-47-T.Sieg, Holder-6A.Cole. DEFENSIVE TWO-POINT ATTEMPT. 35C.Ward recovered the blocked kick. ATTEMPT SUCCEEDS.
7-H.Butker extra point is Blocked (99-J.Tillery), Center-41-J.Winchester, Holder-5-T.Townsend. SUCCESSFUL ONSIDE KICK
Harrison Butker [Jerry Tillery blocked]
Jehu Chesson
Riley Patterson
FIVE FIELD GOALS
Harrison Butker:
(35, 24, 23, 31, 48)
Stephen Gostkowski:
(48, 24, 39, 50, 28)
SIX FIELD GOALS
Cairo Santos:
(22, 40, 51, 34, 40, 29, 51)
Opp * Never Has Happened *
KC 11/20/2022 @ L.A. Chargers 52 yards
Opp 1/7/2023 @ Las Vegas 54 yards
KC 11/27/2022 vs. L.A. Rams 4 fg
Opp 10/6/2019 vs. Indianapolis 4 fg
KC 10/16/2022 vs. Buffalo 62 yards
50-59 YARD FIELD GOAL
Harrison Butker
Daniel Carlson
FOUR FIELD GOALS
Harrison Butker:
(27, 32, 22, 22)
Adam Vinatieri:
(32, 32, 31, 29)
60+ YARD FIELD GOAL
Harrison Butker
2-D.Colquitt kicks 48 yards from KC 20 to PIT 32. RECOVERED by KC-80-J.Chesson.
10-R.Patterson kicks onside 11 yards from JAX 35 to JAX 46. RECOVERED by JAX-10-R.Patterson.
(6:25) 7-H.Butker 30 yard field goal is GOOD, Center-41-J.Winchester, Holder-5-T.Townsend.
(7:00) 2-D.Carlson 38 yard field goal is GOOD, Center-47-T.Sieg, Holder-6-A.Cole.
(:01) 7-H.Butker 62 yard field goal is GOOD, Center-41-J.Winchester, Holder-5-T.Townsend.
93
Opp 9/28/2020 @ Baltimore
yards
12/13/2020 @ Miami 67 yards
Opp 12/9/2012 @ Cleveland 93 yards
N.Y. Jets
Opp 12/28/1986 @
0 yards
11/20/2022 @ L.A. Chargers 52 yards
Butker
KC
Harrison
Opp 1/7/2023 @ Las Vegas 54 yards
Carlson
Daniel
1/1/2023 vs. Denver 51 yards Harrison Butker
KC
11/7/2021
* Never Has Happened * THREE FIELD GOALS
KC 10/25/2020
TOUCHDOWN ON OFFENSE, DEFENSE AND SPECIAL TEAMS
Denver ST: (9:28) (Shotgun) D.Lock pass short right intended for N.Fant INTERCEPTED by D.Sorensen [A.Hitchens] at 50. D.Sorensen for 50 yards, TOUCHDOWN.
DEF: (11:21) (Shotgun) P.Mahomes pass short right to T.Hill for 10 yards, TOUCHDOWN.
DEF: (9:15) (Shotgun) C.Edwards-Helaire left guard for 11 yards, TOUCHDOWN.
DEF: (3:02) (Shotgun) C.Henne left end for 1 yard, TOUCHDOWN.
OFF: B.McManus kicks 67 yards from DEN 35 to KC -2. B.Pringle for 102 yards, TOUCHDOWN.
Opp * Never Has Happened * MADE TWO-POINT CONVERSION
KC 12/18/2022 @ Houston
Opp 9/11/2022 @ Arizona
KC 1/1/2023 vs. Denver
Opp 10/10/2022 vs. Las Vegas
Patrick Mahomes
Kyler Murray
FAILED TWO-POINT CONVERSION
Tommy Townsend
Josh Jacobs
KC 11/19/2018 @ L.A. Rams L.A. Rams 54, Kansas City 51 Opp 11/19/2018 @ L.A. Rams L.A. Rams 54, Kansas City 51
KC 9/24/2023 vs. Chicago Kansas City 41, Chicago 10 Opp 10/11/2020 vs. Las Vegas Las Vegas 40, Kansas City 32
KC 12/18/2022 @ Houston Kansas City 30, Houston 24
50 POINTS
40 POINTS
OVERTIME WIN
TWO-POINT CONVERSION ATTEMPT. 15P.Mahomes pass to 1-J.McKinnon is complete. ATTEMPT SUCCEEDS.
(Pass formation) TWO-POINT CONVERSION
ATTEMPT. 1-K.Murray pass to 86-Z.Ertz is complete. ATTEMPT SUCCEEDS.
(Kick formation) TWO-POINT CONVERSION ATTEMPT. 5-T.Townsend rushes right end. ATTEMPT FAILS.
TWO-POINT CONVERSION ATTEMPT. 28-J.Jacobs rushes up the middle. ATTEMPT FAILS.
Opp
KC 11/27/2022 vs. L.A. Rams 4 fg Harrison Butker: (27, 32, 22, 22) Opp 9/17/2023 @ Jacksonville 3 fg Brandon McManus: (32, 49, 22) 50-69 YARD PUNT RETURN KC 12/13/2020 @ Miami 67t yards Mecole Hardman Opp 12/9/2018 vs. Baltimore 55 yards Cyrus Jones 70-89 YARD PUNT RETURN KC 10/8/2017 @ Houston 82t yards Tyreek Hill Opp 9/16/2012 @ Buffalo 88t yards Leodis McKelvin 60-69 YARD PUNT KC 1/7/2023 @ Las Vegas 61 yds Tommy Townsend Opp 9/7/2023 vs. Detroit 61 yds Jack Fox 90+ YARD PUNT RETURN KC 9/9/2018 @ L.A. Chargers 91t yards Tyreek Hill Opp 12/9/2012 @ Cleveland 93t yards Travis Benjamin 70+ YARD PUNT KC 12/11/2022 @ Denver 76 yds Tommy Townsend Opp 9/23/2012 @ New Orleans 70 yds Thomas Morstead 50-69 YARD KICKOFF RETURN KC 12/23/2018 @ Seattle 61 yards Tremon Smith Opp 10/16/2016 @ Oakland 50 yards Jalen Richard PUNTED 10+ TIMES KC 9/8/2013 @ Jacksonville 10 punts Dustin Colquitt Opp 12/14/2014 vs. Oakland 11 punts Marquette King 70-89 YARD KICKOFF RETURN KC 11/27/2016 @ Denver 86t yards Tyreek Hill Opp 12/16/2021 @ L.A. Chargers 75 yards Andre Roberts 90+ YARD KICKOFF RETURN KC 10/25/2020 @ Denver 102t yards Byron Pringle Opp 9/28/2020 @ Baltimore 93t yards Devin Duvernay TEAM/MISCELLANEOUS 500 TOTAL YARDS OF OFFENSE KC 12/18/2022 @ Houston 502 yards Kansas City 502, Houston 219 Opp 10/14/2018 @ New England 500 yards New England 500, Kansas City 446 400 TOTAL YARDS OF OFFENSE KC 9/24/2023 vs. Chicago 456 yards Kansas City 456, Chicago 203 Opp 12/4/2022 @ Cincinnati 431 yards Cincinnati 431, Kansas City 349
@
pass short right to J.McKinnon for 9 yards, TOUCHDOWN.
Detroit 21, Kansas City 20
(2:52) (Shotgun) J.Goff pass short right to A.St. Brown for 9 yards, TOUCHDOWN.
(11:04) (Shotgun) P.Mahomes pass short right intended for K.Toney INTERCEPTED by B.Branch at 50. B.Branch for 50 yards, TOUCHDOWN.
(7:11) D.Montgomery up the middle for 8 yards, TOUCHDOWN.
Las Vegas 0 to Kansas City 31, Las Vegas 13
Opp 12/4/2022 @ Cincinnati 0 to Cincinnati 27, Kansas City 24
FOUR TOTAL TOUCHDOWNS
KC 1/7/2023 @ Las Vegas 4 td Kansas City 31, Las Vegas 13
(12:58) (Shotgun) P.Mahomes pass short left to J.McKinnon for 2 yards, TOUCHDOWN.
(15:00) (Shotgun) R.Jones left guard for 2 yards, TOUCHDOWN.
(:53) K.Toney left end for 11 yards, TOUCHDOWN.
(11:06) (Shotgun) I.Pacheco left guard for 1 yard, TOUCHDOWN.
Opp 12/11/2022 @ Denver 4 td Kansas City 34, Denver 28
(1:38) (No Huddle, Shotgun) R.Wilson pass deep left to J.Jeudy for 18 yards, TOUCHDOWN.
(:14) (Shotgun) R.Wilson pass short right to J.Jeudy for 5 yards, TOUCHDOWN.
(13:16) (Shotgun) R.Wilson pass short right to M.Mack for 66 yards, TOUCHDOWN.
(10:54) (Shotgun) B.Rypien pass short middle to J.Jeudy for 7 yards, TOUCHDOWN.
OVER 40:00 TIME OF POSSESSION (NON-OT)
KC 12/20/2020 @ New Orleans 41:14 TOP Kansas City 32, New Orleans 29 Opp 12/3/2017 @ N.Y. Jets 42:49 TOP
NO SACKS/NO INTERCEPTIONS ALLOWED
N.Y. Jets 38, Kansas City 31
KC 9/11/2022 @ Arizona
Opp 10/10/2021 vs. Buffalo
Opp 11/19/2017 @ N.Y. Giants N.Y. Giants 12, Kansas City 9 OVERTIME LOSS KC 11/19/2017 @ N.Y. Giants N.Y. Giants 12, Kansas City 9 Opp 12/18/2022 @ Houston Kansas City 30, Houston 24 OVERTIME TIE KC 11/19/1989 @ Cleveland Kansas City 10, Cleveland 10 Opp 11/19/1989 @ Cleveland Kansas City 10, Cleveland 10 20 FIRST-QUARTER POINTS KC 9/16/2018 @ Pittsburgh Kansas City 21, Pittsburgh 0 Opp 10/2/2016 @ Pittsburgh Pittsburgh 22, Kansas City 0 20 SECOND-QUARTER POINTS KC 9/24/2023 vs. Chicago Kansas City 27, Chicago 0 Opp 10/11/2020 vs. Las Vegas Las Vegas 21, Kansas City 17 20 THIRD-QUARTER POINTS KC 12/14/2014 vs. Oakland Kansas City 21, Las Vegas 3 Opp 12/6/2009 vs. Denver Denver 20, Kansas City 0 20 FOURTH-QUARTER POINTS KC 11/19/2018 @ L.A. Rams Kansas City 21, L.A. Rams 14 Opp 10/8/2017 @ Houston Houston 21, Kansas City 19 SHUTOUT AT HOME KC 10/1/2006 vs. San Francisco Kansas City 41, San Francisco 0 Opp * Never Has Happened * SHUTOUT ON THE ROAD KC 10/23/2011 @ Oakland Kansas City 28, Las Vegas 0 Opp 12/16/2012 @ Oakland Las Vegas 15, Kansas City 0 OVERTIME WIN AT HOME KC 11/6/2022 vs. Tennessee Kansas City 20, Tennessee 17 Opp 12/24/2011 vs. Oakland Las Vegas 16, Kansas City 13 OVERTIME WIN ON THE ROAD KC 12/18/2022 @ Houston Kansas City 30, Houston 24 Opp 11/19/2017 @ N.Y. Giants N.Y. Giants 12, Kansas City 9 10 PENALTIES KC 9/17/2023 @ Jacksonville 12 pen Kansas City 17, Jacksonville 9 Opp 10/23/2022 @ San Francisco 10 pen Kansas City 44, San Francisco 23
TOTAL TOUCHDOWNS KC 12/24/2022 vs. Seattle 3 td Kansas City 24, Seattle 10 (6:46) (Shotgun) P.Mahomes
(9:02) (Shotgun)
(4:50) (Shotgun)
Opp 9/7/2023 vs. Detroit 3 td
THREE
pass short middle to K.Toney for 8 yards, TOUCHDOWN.
P.Mahomes
P.Mahomes scrambles right end for 3 yards, TOUCHDOWN.
TURNOVERS KC 1/7/2023 @
NO
SCORE TOUCHDOWN IN EACH QUARTER
KC 10/23/2022 @ San Francisco (7, 7, 14, 16 Points) Kansas City 44, San Francisco 23 Opp 1/2/2022 @ Cincinnati (7, 10, 7, 10 Points) Cincinnati 34, Kansas City 31 30 ONE-HALF POINTS KC 9/24/2023 vs. Chicago 34 (first half) Kansas City 41, Chicago 10 Opp 11/19/2018 @ L.A. Rams 31 (second half) L.A. Rams 54, Kansas City 51 WON GAME BY 20+ POINTS KC 9/24/2023 vs. Chicago Kansas City 41, Chicago 10 Opp 10/24/2021 @ Tennessee Tennessee 27, Kansas City 3
LAST GAME
National Football League Game Summary
NFL Copyright © 2023 by The National Football League. All rights reserved. This summary and play-by-play is for the express purpose of assisting media in their coverage of the game; any other use of this material is prohibited without the written permission of the National Football League.
RB 24 K.Herbert S 9 J.Brisker
J.Reid
RB 10 I.Pacheco S 6 B.Cook
SubstitutionsSubstitutions
K 8 C.Santos, WR 12 V.Jones, WR 13 T.Scott, WR 15 T.Taylor, P 16 T.Gill, TE 18 R.Tonyan, RB 20 T.Homer, RB 23 R.Johnson, DB 26 Q.Johnson, DB 27
G.Stroman, DB 31 Ja.Jones, DB 32 T.Smith, FB 35 K.Blasingame, DB 39 J.Blackwell, LB 44 N.Sewell, LS 48 P.Scales, LB 55 D.Cole, OL 67 D.Feeney, TE 84 M.Lewis, DL 90 D.Robinson, DL 94 R.Green, DL 96 Z.Pickens, DL 99 G.Dexter
RB 1 J.McKinnon, CB 2 J.Williams, WR 4 R.Rice, P 5 T.Townsend, K 7 H.Butker, WR 8 J.Ross, QB 9 B.Gabbert, WR 12 M.Washington, WR 19 K.Toney, S 21 M.Edwards, RB 25 C.Edwards-Helaire, CB 35 Ja.Watson, LS 41 J.Winchester, LB 43 J.Cochrane, LB 44 Ca.Jones, LB 48 C.Christiansen, LB 54 L.Chenal, OL 66 M.Caliendo, G 73 N.Allegretti, T 76 P.Wanogho, TE 81 B.Bell, WR 84 Ju.Watson, DE 92 N.Farrell, DE 94 M.Herring, DE 97 F.AnudikeUzomah, DT 98 T.Wharton
QB 14 N.Peterman, OL 64 N.Davis, OL 74 A.Collins
DB 4 E.Jackson, 3QB 17 T.Bagent, WR 19 E.St. Brown, RB 21 D.Foreman, DB 38 A.Thomas, DL 92 D.Hardy
CB 31 N.Jones, LB 32 N.Bolton, DE 53 B.Thompson, OL 64 W.Morris, T 77 L.Niang, DT 99 K.Coburn
Chicago Bears at Kansas City Chiefs Start Time: 3:25 PM CDT at GEHA Field at Arrowhead Stadium, Kansas City, MO Open Stadium on Natural Grass Game Weather: Temp: 82° F (27.8° C) Humidity: 37%, Wind: WNW 9 mph Officials Referee: Line Judge: Down Judge: Side Judge: Umpire: Field Judge: Back Judge: Eck, Alan (76) DeLorenzo, Robin (134) Bryan, Fred (11) Jenkins, John (117) Slaughter, Tab (110) Shaw, Dale (104) Meyer, Greg (78) Lineups VISITOR: Chicago Bears 0 0 0 10 0 10 HOME: Kansas City Chiefs 7 27 7 0 0 41 1234OTTotal Replay Official: Crudup, Denise (0) Game Day Weather Field Goals (made ( ) & missed) Scoring Plays Date: Sunday, 9/24/2023 Kansas City ChicagoChiefs Bears OffenseDefenseOffenseDefense WR 2 D.Moore DL 95 D.Walker WR 24 S.Moore DE 56 G.Karlaftis WR 11 D.Mooney DT 93 Ju.Jones LT 79 D.Smith DT 91 D.Nnadi LT 75 L.Borom DL 97 A.Billings LG 62 J.Thuney DT 95 C.Jones LG 65 C.Whitehair DE 91 Y.Ngakoue C 52 C.Humphrey DE 51 M.Danna C 62 L.Patrick LB 53 T.Edwards RG 65 T.Smith LB 50 W.Gay RG 69 J.Carter LB 49 T.Edmunds RT 74 J.Taylor LB 23 D.Tranquill RT 58 D.Wright LB 57 J.Sanborn TE 87 T.Kelce DB 27 C.Conner TE 85 C.Kmet CB 33 J.Johnson TE 83 N.Gray CB 22 T.McDuffie WR 10 C.Claypool CB 29 T.Stevenson WR 11 M.Valdes-Scantling CB 38 L.Sneed QB 1 J.Fields DB 22 E.Hicks QB 15 P.Mahomes S 20
Not PlayDid Not Play
Did
ActiveNot Active
Not
C.Santos (21) H.Butker (41) (38) Play Description (Extra Point) (Drive TeamQtrTimeInfo)VisitorHome Chiefs J.McKinnon 6 yd. pass from P.Mahomes (H.Butker kick) (6-59, 2:45) 0 7 1 6:51 Chiefs C.Edwards-Helaire 1 yd. run (H.Butker kick) (11-80, 5:57) 0 14 2 11:34 Chiefs J.McKinnon 3 yd. pass from P.Mahomes (H.Butker kick) (11-88, 5:24) 0 21 2 3:05 Chiefs H.Butker 41 yd. Field Goal (4-3, 1:06) 0 24 2 1:51 Chiefs I.Pacheco 1 yd. run (H.Butker kick) (3-26, 0:31) 0 31 2 1:06 Chiefs H.Butker 38 yd. Field Goal (5-45, 0:35) 0 34 2 0:00 Chiefs T.Kelce 3 yd. pass from P.Mahomes (H.Butker kick) (11-64, 5:14) 0 41 3 7:40 Bears C.Santos 21 yd. Field Goal (11-25, 4:42) 3 41 4 13:34
National Football League Game Summary
NFL Copyright © 2023 by The National Football League. All rights reserved. This summary and play-by-play is for the express purpose of assisting media in their coverage of the game; any other use of this material is prohibited without the written permission of the National Football League.
Paid Attendance: 73,562 Time: 2:55 Bears D.Moore 9 yd. pass from J.Fields (C.Santos kick) (9-75, 2:49) 10 41 4 4:20
Chicago Bears
Chicago Bears vs Kansas City Chiefs
9/24/2023 at GEHA Field at Arrowhead Stadium
Final Individual Statistics
Kansas City Chiefs
RUSHINGATTYDSLGTDAVGRUSHINGATTYDSLGTD AVG J.Fields 47 4.3 0 1117 I.Pacheco 62 4.1 1 1518 R.Johnson 38 4.8 0 811 C.Edwards-Helaire 55 3.7 1 1516 K.Herbert 31 4.4 0 711 P.Mahomes 28 9.3 0 315 J.McKinnon 9 4.5 0 210 B.Gabbert -1 -0.5 0 20 26 116 4.5 17 0 Total 37 153 4.1 18 2 Total PASSINGATTYDSLG SK/YDTD CMPINRTPASSINGATTYDSLG SK/YDTD CMPINRT J.Fields 99 1 22 11 3/12 1 58.7 P.Mahomes 272 3 33 24 0/0 0 127.3 37 29 B.Gabbert 31 0 5 3 0/0 2 38.3 15 38 303 3 27 0/0 2 98.9 11 99 1 22 3/12 1 58.7 Total Total 37 29 PASS RECEIVINGRECYDSLGTDTARAVGPASS RECEIVINGRECYDSLGTD TARAVG D.Moore 41 13.7 1 3 6 T.Kelce 69 9.9 1 7 824 29 C.Kmet 22 11.0 0 2 2 R.Rice 59 11.8 0 5 715 14 R.Johnson 11 5.5 0 2 2 S.Moore 42 10.5 0 4 621 6 K.Herbert 4 2.0 0 2 2 J.McKinnon 19 6.3 2 3 310 5 C.Claypool 15 15.0 0 1 4 Ju.Watson 51 25.5 0 2 337 15 T.Scott 6 6.0 0 1 3 I.Pacheco 16 8.0 0 2 39 6 D.Mooney 0 0.0 0 0 1 M.Valdes-Scantling 37 37.0 0 1 237 0 N.Gray 9 9.0 0 1 29 C.Edwards-Helaire 2 2.0 0 1 12 K.Toney -1 -1.0 0 1 1-1 J.Ross 0 0.0 0 0 10 11 99 9.0 29 1 Total 20 27 303 11.2 37 3 Total 37 INTERCEPTIONSNOYDSLGTDAVGINTERCEPTIONSNOYDSLGTD AVG J.Sanborn 42 42.0 0 1 M.Edwards 16 16.0 0 116 42 Q.Johnson 0 0.0 0 1 0 Total 42 21.0 42 0 2 Total 16 16.0 16 0 1 PUNTINGYDSLG NOAVGTBIN20PUNTINGNET NOYDSLG AVGTBIN20 NET T.Gill 229 58 5 45.8 1 1 35.2 T.Townsend 55 55 1 55.0 0 1 55.0 Total 229 58 5 45.8 1 1 35.2 Total 55 55 1 55.0 0 1 55.0 PUNT RETURNSNOYDSLGTDAVGPUNT RETURNSNOYDSLGTDFCAVGFC [OUT OF BOUNDS] 0 0.0 0 1 M.Washington 33 11.0 0 3 1 0 23 0 [TOUCHBACK] 0 0.0 0 1 0 0 Total 0 0.0 0 0 0 Total 33 11.0 23 0 3 1 0 KICKOFF RETURNSNOYDSLGTDAVGKICKOFF RETURNSNOYDSLGTDFCAVGFC [TOUCHBACK] 0 0.0 0 7 [TOUCHBACK] 0 0.0 0 3 0 0 0 0 Total 0 0.0 0 0 0 Total 0 0.0 0 0 0 0 0 FUMBLESFUMYDSFORCED TD OWN-RECOPP-RECYDSTDOUT-BDS Chicago Bears LOST K.Herbert 0 0 0 1 0 0 0 0 0 1 Total 0 0 0 1 0 0 0 0 0 1 FUMBLESFUMYDSFORCED TD OWN-RECOPP-RECYDSTDOUT-BDS Kansas City Chiefs LOST T.McDuffie 0 0 0 0 0 0 0 1 0 0 W.Gay 0 0 0 0 0 0 0 0 1 0 Total 0 0 0 0 0 0 0 1 1 0
Chicago Bears vs Kansas City Chiefs 9/24/2023 at GEHA Field at Arrowhead Stadium
Final Team Statistics
VisitorHome BearsChiefs 11 31 TOTAL FIRST DOWNS 6 12 By Rushing 5 16 By Passing 0 3 By Penalty 4-12-33.3% 10-14-71.4% THIRD DOWN EFFICIENCY 1-2-50.0% 0-0-0.0% FOURTH DOWN EFFICIENCY 203 456 TOTAL NET YARDS 51 75 Total Offensive Plays (inc. times thrown passing) 4.0 6.1 Average gain per offensive play 116 153 NET YARDS RUSHING 26 37 Total Rushing Plays 4.5 4.1 Average gain per rushing play 0-0 5-9 Tackles for a loss-number and yards 87 303 NET YARDS PASSING 3-12 0-0 Times thrown - yards lost attempting to pass 99 303 Gross yards passing 22-11-1 38-27-2 PASS ATTEMPTS-COMPLETIONS-HAD INTERCEPTED 3.5 8.0 Avg gain per pass play (inc.# thrown passing) 3-3-3 7-7-7 KICKOFFS Number-In End Zone-Touchbacks 5-45.8 1-55.0 PUNTS Number and Average 0 0 Had Blocked 0-0 0-0 FGs - PATs Had Blocked 35.2 55.0 Net Punting Average 42 49 TOTAL RETURN YARDAGE (Not Including Kickoffs) 0-0 3-33 No. and Yards Punt Returns 0-0 0-0 No. and Yards Kickoff Returns 2-42 1-16 No. and Yards Interception Returns 6-32 3-15 PENALTIES Number and Yards 1-1 0-0 FUMBLES Number and Lost 1 5 TOUCHDOWNS 0 2 Rushing 1 3 Passing 1-1 5-5 EXTRA POINTS Made-Attempts 1-1 5-5 Kicking Made-Attempts 1-1 2-2 FIELD GOALS Made-Attempts 1-2-50% 5-5-100% RED ZONE EFFICIENCY 0-1-0% 5-5-100% GOAL TO GO EFFICIENCY 0 0 SAFETIES 10 41 FINAL SCORE 23:47 36:13 TIME OF POSSESSION
Chicago Bears vs Kansas City Chiefs
9/24/2023 at GEHA Field at Arrowhead Stadium
Ball Possession And Drive Chart
Chicago Bears
*inside opponent's 20
Time of Possession by Quarter Home Visitor Kickoff Drive No.-Start Average 1st2nd3rd4thOTTotal 7:09 7:51 3:58 8:25 4:1523:47 11:02 6:3510:4536:13 Bears: 7 - CHI 25Chiefs: 3 - KC 25 (275) Average CHI 28 (426) Average KC 39 Chicago Bears Kansas City Chiefs Time Recd Time Lost Time Poss How Ball Obtained Drive Began # Play Yds Pen Net Yds Yds Gain 1st Down Last Scrm How Given Up #
1 12:25 2:49 9:36 Punt CHI 3 4 21 0 21 1 CHI 24 Punt 2 6:51 4:20 2:31 Kickoff CHI 25 7 31 0 31 2 KC 44 Punt 3 11:34 3:05 8:29 Kickoff CHI 25 5 22 0 22 1 CHI 47 Punt 4 3:05 0:08 2:57 Kickoff CHI 25 1 5 -5 0 0 CHI 20 Fumble 5 1:51 0:14 1:37 Kickoff CHI 25 2 0 0 0 0 CHI 25 Interception 6 1:06 0:31 0:35 Kickoff CHI 25 3 6 -5 1 0 CHI 26 Punt 7 15:00 2:06 12:54 Kickoff CHI 25 3 2 0 2 0 CHI 27 Punt 8 7:40 3:03 4:37 Kickoff CHI 25 7 16 0 16 1 CHI 41 Downs 9 3:16 4:42 13:34 Interception KC 28 11 25 0 25 2 KC 3 * Field Goal 10 7:09 2:49 4:20 Interception CHI 25 9 75 0 75 4 KC 9 * Touchdown Time Recd Time Lost Time Poss How Ball Obtained Drive Began # Play Yds Pen Net Yds Yds Gain 1st Down Last Scrm How Given Up # Kansas City Chiefs 1 15:00 2:35 12:25 Kickoff KC 25 6 17 0 17 1 KC 42 Punt 2 9:36 2:45 6:51 Punt KC 41 6 63 -4 59 5 CHI 6 * Touchdown 3 2:31 5:57 11:34 Punt KC 20 11 80 0 80 6 CHI 1 * Touchdown 4 8:29 5:24 3:05 Punt KC 12 11 88 0 88 5 CHI 3 * Touchdown 5 2:57 1:06 1:51 Fumble CHI 26 4 3 0 3 0 CHI 23 Field Goal 6 1:37 0:31 1:06 Interception CHI 26 3 26 0 26 3 CHI 1 * Touchdown 7 0:35 0:35 0:00 Punt KC 35 5 35 10 45 2 CHI 20 Field Goal 8 12:54 5:14 7:40 Punt KC 36 11 63 1 64 4 CHI 3 * Touchdown 9 4:37 1:21 3:16 Downs CHI 41 3 6 0 6 0 CHI 35 Interception 10 13:34 6:25 7:09 Kickoff KC 25 10 46 0 46 3 CHI 29 Interception 11 4:20 4:20 0:00 Kickoff KC 25 7 29 0 29 2 CHI 45 End of Game
Final Defensive Statistics
TKL = Tackle AST = Assist COMB = Combined QH=QB Hit IN = Interception PD = Pass Defense FF = Forced Fumble FR = Fumble Recovery Regular Defensive PlaysSpecial ChicagoTeamsMisc Bears TKLASTCOMBSK/QINPDFFFRTKLASTFFFRBLTKLASTFFFR YDSTFL 6 10 16 0 0 0 0 0 0 0 1 0 0 0 0 0 0 0 T.Edwards 0 2 7 3 10 0 0 0 1 0 0 0 0 0 0 0 0 0 0 0 T.Smith 0 1 4 4 8 0 0 0 0 0 0 0 0 0 0 0 0 0 0 0 T.Edmunds 0 0 4 3 7 0 0 0 0 0 0 0 0 0 0 0 0 0 0 0 J.Brisker 0 0 4 1 5 0 0 0 0 0 0 1 0 0 0 0 0 0 0 0 Ja.Jones 0 1 2 2 4 0 0 0 0 0 0 0 0 0 0 0 0 0 0 0 G.Stroman 0 0 1 3 4 0 0 0 0 0 0 0 0 0 0 0 0 0 0 0 N.Sewell 0 0 3 0 3 0 0 0 0 0 0 0 0 0 0 0 0 0 0 0 G.Dexter 1 0 2 1 3 0 0 0 0 0 0 0 0 0 0 0 0 0 0 0 E.Hicks 0 0 2 1 3 0 0 0 0 0 0 0 0 0 0 0 0 0 0 0 D.Robinson 0 1 1 2 3 0 0 0 0 0 0 0 0 0 0 0 0 0 0 0 A.Billings 0 0 2 0 2 0 0 0 1 0 0 0 0 0 0 0 0 0 0 0 J.Johnson 0 1 2 0 2 0 0 0 0 0 0 0 0 0 0 0 0 0 0 0 T.Stevenson 0 0 1 1 2 0 0 0 0 0 0 0 0 0 0 0 0 0 0 0 Y.Ngakoue 2 0 1 1 2 0 0 0 0 0 0 0 0 0 0 0 0 0 0 0 Ju.Jones 1 0 1 1 2 0 0 0 0 0 0 0 0 0 0 0 0 0 0 0 J.Blackwell 0 0 1 1 2 0 0 0 0 0 0 0 0 0 0 0 0 0 0 0 Z.Pickens 0 0 1 0 1 0 0 1 1 0 0 0 2 0 0 0 0 0 0 0 J.Sanborn 0 0 1 0 1 0 0 0 0 0 0 0 0 0 0 0 0 0 0 0 R.Green 0 0 0 1 1 0 0 1 1 0 0 0 0 0 0 0 0 0 0 0 Q.Johnson 0 0 0 0 0 0 0 0 0 0 0 0 0 0 0 0 0 0 0 0 D.Walker 1 0 0 0 0 0 0 0 0 0 0 0 1 0 0 0 0 0 0 0 V.Jones 0 0 0 0 0 0 0 0 0 0 0 0 0 0 0 0 1 0 0 0 C.Kmet 0 0 Total463581002400140001000 65 TKLASTCOMBSK/ YDSINPDFFFRTKLASTFFFRBLTKLASTFFFR TFLQH Special KansasTeamsMisc City ChiefsRegular Defensive Plays 4 4 8 0.5 0 0 0 0 0 0 0 0 0 0 0 0 0 0 D.Tranquill 1 0 3 2 5 0 0 0 0 1 0 0 0 0 0 0 0 0 0 0 T.McDuffie 0 0 3 1 4 0 0 0 0 0 0 0 0 0 0 0 0 0 0 0 L.Chenal 1 0 3 1 4 0 0 0 0 0 0 0 0 0 0 0 0 0 0 0 B.Cook 0 0 3 0 3 1 4 0 0 0 0 0 0 0 0 0 0 0 0 0 M.Danna 1 1 2 1 3 0 0 0 0 0 0 0 0 0 0 0 0 0 0 0 F.Anudike-Uzomah 0 0 1 2 3 0 0 0 0 0 0 0 0 0 0 0 0 0 0 0 J.Cochrane 0 0 1 2 3 0 0 0 0 0 0 0 0 0 0 0 0 0 0 0 D.Nnadi 0 0 1 2 3 0 0 0 0 0 0 0 0 0 0 0 0 0 0 0 M.Herring 0 0 2 0 2 0 0 0 1 0 0 0 0 0 0 0 0 0 0 0 J.Williams 0 0 1 1 2 0.5 0 0 0 0 0 0 0 0 0 0 0 0 0 0 G.Karlaftis 1 0 1 1 2 0 0 0 1 0 0 0 0 0 0 0 0 0 0 0 J.Reid 0 0 1 1 2 0 0 0 0 0 1 0 0 0 0 0 0 0 0 0 W.Gay 0 0 1 0 1 1 8 0 0 0 0 0 0 0 0 0 0 0 0 0 C.Jones 1 1 1 0 1 0 0 0 0 0 0 0 0 0 0 0 0 0 0 0 L.Sneed 0 1 1 0 1 0 0 0 0 0 0 0 0 0 0 0 0 0 0 0 T.Wharton 0 0 1 0 1 0 0 0 0 0 0 0 0 0 0 0 0 0 0 0 Ja.Watson 0 0 0 1 1 0 0 1 1 0 0 0 0 0 0 0 0 0 0 0 M.Edwards 0 0 0 1 1 0 0 0 0 0 0 0 0 0 0 0 0 0 0 0 C.Conner 0 0 0 0 0 0 0 0 0 0 0 0 0 0 0 0 2 0 0 0 R.Rice 0 0 Total3020503121311000002000 35
Chicago Bears vs Kansas City Chiefs 9/24/2023 at GEHA Field at Arrowhead Stadium
Chicago Bears vs Kansas City Chiefs
9/24/2023 at GEHA Field at Arrowhead Stadium
First Half Summary
Scoring Plays Regular Defensive PlaysSpecial ChicagoTeamsMisc Bears Chicago BearsKansas City Chiefs Chicago Bears Kansas City Chiefs TIME OF POSSESSION PERIOD SCORES 0 0 = 0 7 27 = 34 11:07 18:53 Bears Chiefs Bears Chiefs Play Description (Extra Point) (Drive TeamQtrTimeInfo)VisitorHome Chiefs J.McKinnon 6 yd. pass from P.Mahomes (H.Butker kick) (6-59, 2:45) 0 7 1 6:51 Chiefs C.Edwards-Helaire 1 yd. run (H.Butker kick) (11-80, 5:57) 0 14 2 11:34 Chiefs J.McKinnon 3 yd. pass from P.Mahomes (H.Butker kick) (11-88, 5:24) 0 21 2 3:05 Chiefs H.Butker 41 yd. Field Goal (4-3, 1:06) 0 24 2 1:51 Chiefs I.Pacheco 1 yd. run (H.Butker kick) (3-26, 0:31) 0 31 2 1:06 Chiefs H.Butker 38 yd. Field Goal (5-45, 0:35) 0 34 2 0:00 4 22 TOTAL FIRST DOWNS 2 - 2 - 0 9 - 11 - 2 First Downs Rushing-Passing-by Penalty 1-5-20.0% 4-6-66.7% THIRD DOWN EFFICIENCY 85 312 TOTAL NET YARDS 22 44 Total Offensive Plays 53 91 NET YARDS RUSHING 32 221 NET YARDS PASSING 40 221 Gross Yards Passing 2-8 0-0 Times thrown-yards lost attempting to pass 10 - 4 - 1 27 - 20 - 0 Pass Attempts-Completions-Had Intercepted 4 - 48.0 1 - 55.0 Punts-Number and Average 4 - 26 2 - 10 Penalties-Number and Yards 1 - 1 0 - 0 Fumbles-Number and Lost 0-0-0% 4-4-100% Red Zone Efficiency CHI 21 KC 40 Average Drive Start RUSHINGATTYDSLGTDAVGRUSHINGATTYDSLGTD AVG K.Herbert 23 4.6 0 511 I.Pacheco 50 5.0 1 1018 J.Fields 22 11.0 0 217 P.Mahomes 28 9.3 0 315 R.Johnson 8 2.7 0 35 C.Edwards-Helaire 13 3.3 1 49 10 53 5.3 17 0 Total 17 91 5.4 18 2 Total PASSINGATTYDSLG SK/YDTD CMPINRTPASSINGATTYDSLG SK/YDTD CMPINRT J.Fields 40 0 10 4 2/8 1 12.5 P.Mahomes 221 2 27 20 0/0 0 122.6 37 15 27 221 2 20 0/0 0 122.6 4 40 0 10 2/8 1 12.5 Total Total 37 15 PASS RECEIVINGRECYDSLGTDTARAVGPASS RECEIVINGRECYDSLGTD TARAVG C.Claypool 15 15.0 0 1 3 T.Kelce 61 12.2 0 5 624 15 C.Kmet 14 14.0 0 1 1 R.Rice 39 13.0 0 3 414 14 R.Johnson 6 6.0 0 1 1 J.McKinnon 19 6.3 2 3 310 6 K.Herbert 5 5.0 0 1 1 Ju.Watson 51 25.5 0 2 237 5 D.Moore 0 0.0 0 0 3 S.Moore 25 12.5 0 2 321 0 I.Pacheco 16 8.0 0 2 39 N.Gray 9 9.0 0 1 29 C.Edwards-Helaire 2 2.0 0 1 12 K.Toney -1 -1.0 0 1 1-1 J.Ross 0 0.0 0 0 10 M.Valdes-Scantling 0 0.0 0 0 10 4 40 10.0 15 0 Total 9 20 221 11.1 37 2 Total 27
Chicago Bears vs Kansas City Chiefs 9/24/2023 at GEHA Field at Arrowhead Stadium
First Half Summary
TKLASTCOMBSK/QINPDFFFRTKLASTFFFRBLTKLASTFFFR YDSTFL 4 5 9 0 0 0 0 0 0 0 1 0 0 0 0 0 0 0 T.Edwards 0 1 3 4 7 0 0 0 0 0 0 0 0 0 0 0 0 0 0 0 T.Edmunds 0 0 3 2 5 0 0 0 0 0 0 0 0 0 0 0 0 0 0 0 J.Brisker 0 0 3 2 5 0 0 0 1 0 0 0 0 0 0 0 0 0 0 0 T.Smith 0 0 Total131326000100010000000 10 TKLASTCOMBSK/ YDSINPDFFFRTKLASTFFFRBLTKLASTFFFR TFLQH Special KansasTeamsMisc City ChiefsRegular Defensive Plays 2 2 4 0.5 0 0 0 0 0 0 0 0 0 0 0 0 0 0 D.Tranquill 1 0 2 1 3 0 0 0 0 1 0 0 0 0 0 0 0 0 0 0 T.McDuffie 0 0 2 0 2 0 0 0 0 0 0 0 0 0 0 0 0 0 0 0 B.Cook 0 0 1 1 2 0 0 0 0 0 1 0 0 0 0 0 0 0 0 0 W.Gay 0 0 Total74110.500011000000000 01
Chicago Bears vs Kansas City Chiefs at GEHA Field at Arrowhead Stadium
CHI wins the coin toss and elects to defer. KC elects to Receive, and CHI elects to defend the east goal.
C.Santos kicks 65 yards from CHI 35 to end zone, Touchback.
Kansas City Chiefs at 15:00
1-10-KC 25
2-8-KC 27
(15:00) (Shotgun) I.Pacheco up the middle to KC 27 for 2 yards (Y.Ngakoue, T.Edwards).
(14:28) (Shotgun) P.Mahomes pass incomplete short right to J.Ross (J.Johnson).
3-8-KC 27 P1
1-10-KC 37
2-11-KC 36
3-5-KC 42
4-5-KC 42
Timeout at 12:25.
(14:22) (Shotgun) P.Mahomes pass short right to T.Kelce to KC 37 for 10 yards (G.Stroman).
Penalty on CHI-T.Stevenson, Illegal Contact, declined.
(13:54) (Shotgun) P.Mahomes pass short left to K.Toney to KC 36 for -1 yards (J.Johnson).
(13:18) (Shotgun) I.Pacheco left end to KC 42 for 6 yards (T.Edmunds).
(12:39) (Shotgun) P.Mahomes pass incomplete short middle to R.Rice.
(12:34) T.Townsend punts 55 yards to CHI 3, Center-J.Winchester, out of bounds.
Chicago Bears at 12:25
1-10-CHI 3 P1
1-10-CHI 18
2-5-CHI 23
3-4-CHI 24
4-4-CHI 24
Timeout at 09:36.
(12:25) (Shotgun) J.Fields pass short right to C.Claypool ran ob at CHI 18 for 15 yards.
(11:50) (Shotgun) R.Johnson up the middle to CHI 23 for 5 yards (D.Tranquill, W.Gay).
(11:11) (Shotgun) K.Herbert right guard to CHI 24 for 1 yard (D.Tranquill; T.McDuffie).
(10:28) (Shotgun) J.Fields sacked at CHI 24 for 0 yards (sack split by D.Tranquill and G.Karlaftis).
(9:50) T.Gill punts 58 yards to KC 18, Center-P.Scales. M.Washington pushed ob at KC 41 for 23 yards (J.Sanborn; T.Edwards).
Kansas City Chiefs at 9:36
(9:36) P.Mahomes pass short right to T.Kelce to CHI 35 for 24 yards (J.Brisker).
1-10-KC 41 P2
(8:54) (Shotgun) P.Mahomes pass deep middle to S.Moore to CHI 14 for 21 yards (T.Edmunds).
1-10-CHI 35 P3
1-10-CHI 14 R4
1-3-CHI 3
Timeout at 07:31.
1-1-CHI 1
1-6-CHI 6
(8:16) (Shotgun) P.Mahomes scrambles right end ran ob at CHI 3 for 11 yards (T.Edwards).
(7:37) (Shotgun) I.Pacheco right end ran ob at CHI 2 for 1 yard (T.Stevenson). CHI-T.Stevenson was injured during the play. His return is Questionable.
PENALTY on CHI-T.Stevenson, Unnecessary Roughness, 1 yard, enforced at CHI 2. X5
(7:21) (Shotgun) PENALTY on KC-T.Kelce, False Start, 5 yards, enforced at CHI 1 - No Play.
(7:01) (Shotgun) P.Mahomes pass incomplete short middle to T.Kelce.
2-6-CHI 6 P6
(6:55) (Shotgun) P.Mahomes pass short middle to J.McKinnon for 6 yards, TOUCHDOWN.
H.Butker extra point is GOOD, Center-J.Winchester, Holder-T.Townsend. Timeout at 06:51.
CHI 0 KC 7, 6 plays, 59 yards, 1 penalty, 2:45 drive, 8:09 elapsed H.Butker kicks 65 yards from KC 35 to end zone, Touchback. Chicago Bears at 6:51
1-10-CHI 25
2-3-CHI 32
(6:51) (Shotgun) K.Herbert right guard to CHI 32 for 7 yards (B.Cook).
(6:17) J.Fields pass incomplete deep left to D.Moore.
(6:12) (Shotgun) K.Herbert right tackle to CHI 43 for 11 yards (J.Cochrane; J.Reid).
3-3-CHI 32 R2
1-10-CHI 43 R3
1-10-KC 40
2-7-KC 37
3-6-KC 36
4-14-KC 44
Timeout at 02:31.
(5:26) J.Fields scrambles right end to KC 40 for 17 yards (D.Tranquill).
(4:36) (Shotgun) K.Herbert up the middle to KC 37 for 3 yards (D.Nnadi).
(3:57) K.Herbert right end to KC 36 for 1 yard (T.McDuffie).
(3:18) (Shotgun) J.Fields sacked at KC 44 for -8 yards (C.Jones).
(2:39) T.Gill punts 44 yards to end zone, Center-P.Scales, Touchback.
Kansas City Chiefs at 2:31
1-10-KC 20
(2:31) (Shotgun) P.Mahomes pass short left to C.Edwards-Helaire to KC 22 for 2 yards (T.Stevenson, T.Edwards).
2-8-KC 22 R7
1-10-KC 31
2-8-KC 33
(1:51) (Shotgun) C.Edwards-Helaire left end to KC 31 for 9 yards (J.Brisker, T.Edwards).
(1:17) (Shotgun) C.Edwards-Helaire right end to KC 33 for 2 yards (T.Edwards; J.Blackwell).
(:42) (Shotgun) P.Mahomes pass short right to T.Kelce to KC 39 for 6 yards (J.Brisker).
First Quarter Play By Play 9/24/2023
Chicago Bears vs Kansas City Chiefs at GEHA Field at Arrowhead Stadium END OF QUARTER Chicago Bears0 7:0921031/30/0 Kansas City Chiefs7 7:5124171/20/0 Score Time Poss First Downs RPXT Efficiencies 3 Down4 Down
Chicago Bears vs Kansas City Chiefs at GEHA Field at Arrowhead Stadium
Kansas City Chiefs continued.
(15:00) (Shotgun) P.Mahomes pass short left to T.Kelce to CHI 46 for 15 yards (T.Smith).
3-2-KC 39 P8
1-10-CHI 46 R9
1-10-CHI 28
2-8-CHI 26
(14:19) I.Pacheco left end to CHI 28 for 18 yards (E.Hicks).
(13:43) P.Mahomes scrambles right end ran ob at CHI 26 for 2 yards (G.Dexter).
(13:02) C.Edwards-Helaire left end to CHI 25 for 1 yard (G.Dexter).
3-7-CHI 25 P10
Timeout at 12:03.
(12:25) (Shotgun) P.Mahomes pass short right to J.McKinnon to CHI 15 for 10 yards (T.Edmunds; E.Hicks). CHI-J.Brisker was injured during the play.
1-10-CHI 15 P11
(11:55) (Shotgun) P.Mahomes pass short middle to R.Rice for 15 yards, TOUCHDOWN. The Replay Official reviewed the runner broke the plane ruling, and the play was REVERSED.
(Shotgun) P.Mahomes pass short middle to R.Rice to CHI 1 for 14 yards (J.Blackwell, Q.Johnson).
1-1-CHI 1 R12
Timeout at 11:34.
(11:42) (Shotgun) C.Edwards-Helaire right tackle for 1 yard, TOUCHDOWN.
H.Butker extra point is GOOD, Center-J.Winchester, Holder-T.Townsend.
CHI 0 KC 14, 11 plays, 80 yards, 5:57 drive, 3:26 elapsed H.Butker kicks 65 yards from KC 35 to end zone, Touchback.
Chicago Bears at 11:34
1-10-CHI 25
(11:34) (Shotgun) J.Fields right end to CHI 30 for 5 yards (G.Karlaftis).
2-5-CHI 30 P4
1-10-CHI 44
2-7-CHI 47
3-7-CHI 47
4-7-CHI 47
Timeout at 08:29.
(10:53) (Shotgun) J.Fields pass short left to C.Kmet to CHI 44 for 14 yards (B.Cook).
(10:08) R.Johnson up the middle to CHI 47 for 3 yards (L.Chenal, D.Nnadi).
(9:26) R.Johnson right end to CHI 47 for no gain (W.Gay).
(8:48) (No Huddle, Shotgun) J.Fields pass incomplete short right.
Penalty on CHI-R.Johnson, Offensive Holding, declined.
(8:41) T.Gill punts 43 yards to KC 10, Center-P.Scales. M.Washington to KC 12 for 2 yards (Ja.Jones).
Kansas City Chiefs at 8:29
1-10-KC 12
(8:29) (Shotgun) P.Mahomes pass short left to S.Moore to KC 16 for 4 yards (T.Edmunds).
2-6-KC 16 P13
1-10-CHI 47
(7:52) P.Mahomes pass deep right to Ju.Watson to CHI 47 for 37 yards (T.Smith) [G.Dexter].
Timeout #1 by KC at 07:11.
(7:11) P.Mahomes pass short left to N.Gray to CHI 38 for 9 yards (J.Johnson).
2-1-CHI 38 R14
1-10-CHI 33
(6:33) I.Pacheco right end to CHI 33 for 5 yards (Ju.Jones).
(5:54) I.Pacheco up the middle to CHI 29 for 4 yards (T.Edmunds; A.Billings).
2-6-CHI 29 R15
1-10-CHI 16
Timeout at 04:27.
2-10-CHI 16
3-1-CHI 7
1-3-CHI 3
(5:14) (Shotgun) I.Pacheco right tackle to CHI 16 for 13 yards (D.Robinson, T.Smith).
(4:32) (Shotgun) P.Mahomes pass incomplete deep left to M.Valdes-Scantling. CHI-J.Johnson was injured during the play.
(4:27) (Shotgun) P.Mahomes pass short right to I.Pacheco to CHI 7 for 9 yards (Z.Pickens, T.Edmunds).
(3:48) I.Pacheco left guard to CHI 3 for 4 yards (J.Brisker; G.Stroman).
(3:12) (Shotgun) P.Mahomes pass incomplete short right to I.Pacheco.
R16
2-3-CHI 3 P17
(3:08) (Shotgun) P.Mahomes pass short left to J.McKinnon for 3 yards, TOUCHDOWN.
H.Butker extra point is GOOD, Center-J.Winchester, Holder-T.Townsend.
CHI 0 KC 21, 11 plays, 88 yards, 5:24 drive, 11:55 elapsed H.Butker kicks 65 yards from KC 35 to end zone, Touchback.
Chicago Bears at 3:05
1-10-CHI 25
1-15-CHI 20
(3:05) (Shotgun) PENALTY on CHI, Delay of Game, 5 yards, enforced at CHI 25 - No Play.
(3:05) (Shotgun) J.Fields pass short left to K.Herbert to CHI 26 for 6 yards (T.McDuffie). FUMBLES (T.McDuffie), touched at CHI 25, RECOVERED by KC-W.Gay at CHI 26.
Kansas City Chiefs at 2:57
1-10-CHI 26
2-14-CHI 30
Two-Minute Warning
3-7-CHI 23
4-7-CHI 23
(2:57) (Shotgun) I.Pacheco right end to CHI 30 for -4 yards (T.Edwards, T.Smith).
(2:16) (Shotgun) P.Mahomes pass short right to I.Pacheco pushed ob at CHI 23 for 7 yards (T.Edwards).
(2:00) (Shotgun) P.Mahomes pass incomplete short left to S.Moore [Y.Ngakoue].
Penalty on KC-J.Taylor, Illegal Formation, declined.
(1:55) H.Butker 41 yard field goal is GOOD, Center-J.Winchester, Holder-T.Townsend.
Play By Play 9/24/2023
Second Quarter
CHI 0 KC 24, 4 plays, 3 yards, 1:06 drive, 13:09 elapsed H.Butker kicks 65 yards from KC 35 to end zone, Touchback.
Chicago Bears at 1:51
1-10-CHI 25
2-10-CHI 25
(1:51) (Shotgun) J.Fields pass incomplete deep right to D.Moore.
(1:45) (Shotgun) J.Fields pass deep left intended for C.Claypool INTERCEPTED by M.Edwards (J.Reid) at CHI 42. M.Edwards pushed ob at CHI 26 for 16 yards (C.Kmet).
Kansas City Chiefs at 1:37
(1:37) (Shotgun) P.Mahomes pass short left to R.Rice to CHI 14 for 12 yards (T.Edmunds; G.Stroman).
1-10-CHI 26 P18
(1:17) (No Huddle, Shotgun) P.Mahomes pass short middle to R.Rice to CHI 1 for 13 yards (T.Edwards; J.Brisker).
1-10-CHI 14 P19
Timeout #1 by CHI at 01:08.
(1:08) (Shotgun) I.Pacheco left guard for 1 yard, TOUCHDOWN.
1-1-CHI 1 R20
H.Butker extra point is GOOD, Center-J.Winchester, Holder-T.Townsend.
CHI 0 KC 31, 3 plays, 26 yards, 0:31 drive, 13:54 elapsed H.Butker kicks 65 yards from KC 35 to end zone, Touchback.
Chicago Bears at 1:06
1-10-CHI 25
2-4-CHI 31
3-4-CHI 31
3-9-CHI 26
4-9-CHI 26
(1:06) (Shotgun) J.Fields pass short left to R.Johnson pushed ob at CHI 31 for 6 yards (J.Williams).
(:59) (Shotgun) J.Fields pass incomplete deep left to C.Claypool (J.Williams).
(:52) (Shotgun) PENALTY on CHI, Delay of Game, 5 yards, enforced at CHI 31 - No Play.
(:52) (Shotgun) J.Fields pass incomplete deep right to D.Moore.
(:47) T.Gill punts 47 yards to KC 27, Center-P.Scales. M.Washington to KC 35 for 8 yards (V.Jones; J.Sanborn).
Kansas City Chiefs at 0:35
1-10-KC 35 R21
1-10-50
1-15-KC 45
1-10-CHI 26
2-10-CHI 26
3-4-CHI 20
(:35) (Shotgun) P.Mahomes scrambles left end ran ob at 50 for 15 yards (T.Smith).
(:27) (Shotgun) P.Mahomes pass deep left to M.Valdes-Scantling for 50 yards, TOUCHDOWN NULLIFIED by Penalty [G.Dexter].
PENALTY on KC-J.Taylor, Illegal Formation, 5 yards, enforced at 50 - No Play.
(:18) (Shotgun) P.Mahomes pass short right to Ju.Watson to CHI 41 for 14 yards (Ja.Jones).
PENALTY on CHI-Ja.Jones, Face Mask, 15 yards, enforced at CHI 41. X22
(:11) (Shotgun) P.Mahomes pass incomplete short right to N.Gray (T.Smith).
(:08) (Shotgun) P.Mahomes pass short middle to T.Kelce to CHI 20 for 6 yards (T.Edwards).
Timeout #2 by KC at 00:03.
(:03) H.Butker 38 yard field goal is GOOD, Center-J.Winchester, Holder-T.Townsend.
CHI 0 KC 34, 5 plays, 45 yards, 1 penalty, 0:35 drive, 15:00 elapsed
END
Chicago Bears0 3:5801010/20/0 Kansas City Chiefs3411:02771153/40/0 Score Time Poss First Downs RPXT Efficiencies 3 Down4 Down Chicago Bears vs Kansas City Chiefs at GEHA Field at Arrowhead Stadium
OF QUARTER
CHI elects to Receive, and KC elects to defend the West goal.
H.Butker kicks 65 yards from KC 35 to end zone, Touchback.
Chicago Bears at 15:00
1-10-CHI 25
2-3-CHI 32
3-7-CHI 28
4-8-CHI 27
Timeout at 12:54.
(15:00) (Shotgun) K.Herbert right end to CHI 32 for 7 yards (D.Tranquill; B.Cook).
(14:21) (Shotgun) J.Fields sacked at CHI 28 for -4 yards (M.Danna).
(13:35) (Shotgun) J.Fields pass short right to K.Herbert to CHI 27 for -1 yards (L.Sneed).
(13:01) T.Gill punts 37 yards to KC 36, Center-P.Scales, fair catch by M.Washington.
Kansas City Chiefs at 12:54
1-10-KC 36
2-11-KC 35
(12:54) (Shotgun) I.Pacheco right end to KC 35 for -1 yards (T.Smith).
(12:19) (Shotgun) P.Mahomes pass short left to T.Kelce to KC 40 for 5 yards (G.Stroman).
3-6-KC 40 P23
1-10-CHI 23
2-5-CHI 18
(11:43) (Shotgun) P.Mahomes pass deep right to M.Valdes-Scantling to CHI 23 for 37 yards (T.Smith).
(11:01) (Shotgun) I.Pacheco up the middle to CHI 18 for 5 yards (T.Smith; T.Edwards).
(10:22) (Shotgun) I.Pacheco up the middle to CHI 16 for 2 yards (G.Dexter, A.Billings).
3-3-CHI 16 P24
1-10-CHI 10
2-10-CHI 10
1-1-CHI 1
2-3-CHI 3
(9:40) (Shotgun) P.Mahomes pass short left to S.Moore to CHI 10 for 6 yards (T.Edmunds).
(9:00) (Shotgun) P.Mahomes pass incomplete short right [D.Walker].
(8:54) (Shotgun) I.Pacheco left guard to CHI 2 for 8 yards (J.Brisker, T.Edwards).
PENALTY on CHI-J.Brisker, Face Mask, 1 yard, enforced at CHI 2. X25
(8:29) I.Pacheco right guard to CHI 3 for -2 yards (Ja.Jones).
(7:50) (Shotgun) P.Mahomes pass incomplete short left to Ju.Watson.
3-3-CHI 3 P26
Timeout at 07:40.
(7:44) (Shotgun) P.Mahomes pass short right to T.Kelce for 3 yards, TOUCHDOWN.
H.Butker extra point is GOOD, Center-J.Winchester, Holder-T.Townsend.
CHI 0 KC 41, 11 plays, 64 yards, 1 penalty, 5:14 drive, 7:20 elapsed H.Butker kicks 65 yards from KC 35 to end zone, Touchback.
Chicago Bears at 7:40
1-10-CHI 25
2-7-CHI 28
(7:40) R.Johnson left end to CHI 28 for 3 yards (M.Danna, M.Herring).
(7:00) (Shotgun) R.Johnson right end to CHI 34 for 6 yards (J.Cochrane).
3-1-CHI 34 R5
1-10-CHI 36
2-9-CHI 37
3-5-CHI 41
4-5-CHI 41
Timeout at 04:37.
(6:41) (No Huddle) J.Fields up the middle to CHI 36 for 2 yards (D.Tranquill; J.Cochrane).
(5:59) (Shotgun) J.Fields scrambles left end to CHI 37 for 1 yard (M.Danna).
(5:16) (Shotgun) R.Johnson right guard to CHI 41 for 4 yards (M.Herring).
(4:47) (No Huddle, Shotgun) J.Fields pass incomplete deep right to T.Scott. KC-J.Williams was injured during the play.
(4:42) (Shotgun) J.Fields pass incomplete deep left to D.Mooney.
Kansas City Chiefs at 4:37
1-10-CHI 41
2-7-CHI 38
Timeout at 03:38.
3-4-CHI 35
Chicago Bears at 3:16
1-10-KC 28
2-1-KC 19
(4:37) (Shotgun) C.Edwards-Helaire left guard to CHI 38 for 3 yards (D.Robinson; T.Edwards).
(3:53) (Shotgun) C.Edwards-Helaire left end to CHI 35 for 3 yards (J.Brisker; Z.Pickens). KC-D.Smith was injured during the play.
(3:27) (Shotgun) B.Gabbert pass short middle intended for S.Moore INTERCEPTED by J.Sanborn [Y.Ngakoue] at CHI 30. J.Sanborn pushed ob at KC 28 for 42 yards (R.Rice).
(3:16) J.Fields right end to KC 19 for 9 yards (D.Tranquill).
(2:39) (No Huddle, Shotgun) J.Fields pass incomplete deep right to C.Claypool.
3-1-KC 19 R6
1-10-KC 17
2-7-KC 14
3-5-KC 12
(2:34) J.Fields up the middle to KC 17 for 2 yards (F.Anudike-Uzomah).
(1:54) (Shotgun) J.Fields pass short left to D.Moore to KC 14 for 3 yards (B.Cook, F.Anudike-Uzomah).
(1:26) (No Huddle, Shotgun) J.Fields left end to KC 12 for 2 yards (T.McDuffie).
(:46) (Shotgun) J.Fields left end pushed ob at KC 8 for 4 yards (J.Reid).
(:26) (No Huddle) J.Fields up the middle to KC 7 for 1 yard (T.Wharton).
4-1-KC 8 R7
Third Quarter Play By Play 9/24/2023
END OF QUARTER Chicago Bears0 8:2530032/51/2 Kansas City Chiefs41 6:3503143/40/0 Score Time Poss First Downs RPXT Efficiencies 3 Down4 Down Chicago
Kansas City Chiefs at GEHA Field at Arrowhead Stadium
Bears vs
Chicago Bears continued.
1-7-KC 7
2-7-KC 7
3-6-KC 6
4-3-KC 3
Timeout at 13:34.
(15:00) (Shotgun) J.Fields pass incomplete short left [L.Chenal].
(14:53) (Shotgun) K.Herbert up the middle to KC 6 for 1 yard (T.McDuffie; D.Nnadi).
(14:16) (Shotgun) J.Fields scrambles left end to KC 3 for 3 yards (D.Tranquill). CHI-J.Fields was injured during the play.
(13:36) C.Santos 21 yard field goal is GOOD, Center-P.Scales, Holder-T.Gill.
CHI 3 KC 41, 11 plays, 25 yards, 4:42 drive, 1:26 elapsed C.Santos kicks 65 yards from CHI 35 to end zone, Touchback. Kansas City Chiefs at 13:34
1-10-KC 25
2-8-KC 27
3-5-KC 30
1-10-KC 41
1-10-CHI 47
2-11-CHI 48
2-16-KC 47
3-17-KC 46
(13:34) C.Edwards-Helaire left tackle to KC 27 for 2 yards (A.Billings, N.Sewell).
(12:52) (Shotgun) C.Edwards-Helaire left end to KC 30 for 3 yards (N.Sewell).
(12:12) (Shotgun) B.Gabbert pass short left to S.Moore pushed ob at KC 41 for 11 yards (T.Smith).
(11:37) C.Edwards-Helaire left end to CHI 47 for 12 yards (Ja.Jones).
(10:53) (Shotgun) C.Edwards-Helaire left end to CHI 48 for -1 yards (D.Robinson, T.Edwards).
(10:11) (Shotgun) PENALTY on KC-T.Smith, False Start, 5 yards, enforced at CHI 48 - No Play.
(10:11) (Shotgun) J.McKinnon left end to KC 46 for -1 yards (T.Edwards).
(9:27) (Shotgun) B.Gabbert pass incomplete deep left to S.Moore (T.Smith).
PENALTY on CHI-D.Robinson, Defensive Offside, 5 yards, enforced at KC 46 - No Play.
P27
R28
3-12-CHI 49 P29
1-10-CHI 34
2-5-CHI 29
3-5-CHI 29
Timeout at 07:09.
Chicago Bears at 7:09
1-10-CHI 25
(9:23) (Shotgun) B.Gabbert pass short right to R.Rice to CHI 34 for 15 yards (Ja.Jones) [Ju.Jones].
(8:38) (Shotgun) B.Gabbert pass short left to R.Rice to CHI 29 for 5 yards (N.Sewell; Ja.Jones).
(7:57) C.Edwards-Helaire left end to CHI 29 for no gain (T.Edwards; Y.Ngakoue).
(7:14) (Shotgun) B.Gabbert pass short left intended for R.Rice INTERCEPTED by Q.Johnson at CHI 25. Q.Johnson to CHI 25 for no gain (R.Rice).
(7:09) (Shotgun) R.Johnson right end to CHI 31 for 6 yards (L.Chenal).
2-4-CHI 31 P8
1-10-CHI 39
(6:45) (No Huddle, Shotgun) J.Fields pass short right to C.Kmet to CHI 39 for 8 yards (M.Herring; L.Chenal).
(6:16) (No Huddle, Shotgun) J.Fields scrambles left end pushed ob at CHI 40 for 1 yard (F.Anudike-Uzomah).
2-9-CHI 40 R9
1-10-KC 49
(5:47) (No Huddle, Shotgun) R.Johnson left end to KC 49 for 11 yards (C.Conner; M.Edwards).
(5:25) (No Huddle, Shotgun) J.Fields pass short middle to R.Johnson to KC 44 for 5 yards (L.Chenal).
2-5-KC 44 P10
1-10-KC 15
2-4-KC 9
3-4-KC 9
(4:59) (No Huddle, Shotgun) J.Fields pass deep left to D.Moore ran ob at KC 15 for 29 yards (Ja.Watson).
(4:54) (No Huddle, Shotgun) J.Fields pass short right to T.Scott to KC 9 for 6 yards (J.Williams).
(4:27) (No Huddle, Shotgun) J.Fields pass incomplete short left to T.Scott.
(4:23) (Shotgun) J.Fields pass short left to D.Moore for 9 yards, TOUCHDOWN.
C.Santos extra point is GOOD, Center-P.Scales, Holder-T.Gill.
CHI 10 KC 41, 9 plays, 75 yards, 2:49 drive, 10:40 elapsed C.Santos kicks 65 yards from CHI 35 to end zone, Touchback.
Kansas City Chiefs at 4:20
1-10-KC 25
2-8-KC 27
(4:20) (Shotgun) C.Edwards-Helaire right tackle to KC 27 for 2 yards (R.Green).
(3:39) C.Edwards-Helaire left tackle to KC 29 for 2 yards (J.Sanborn, Ju.Jones).
3-6-KC 29 R30
1-10-KC 39
Two-Minute Warning
(2:57) (Shotgun) J.McKinnon left guard to KC 39 for 10 yards (T.Smith).
(2:13) (Shotgun) C.Edwards-Helaire right end to KC 39 for no gain (T.Edwards, N.Sewell).
2-10-KC 39 R31
1-10-CHI 45
2-10-CHI 45
(2:00) (Shotgun) C.Edwards-Helaire right guard to CHI 45 for 16 yards (E.Hicks).
(1:14) B.Gabbert kneels to CHI 45 for no gain.
(:38) B.Gabbert kneels to CHI 46 for -1 yards.
Fourth Quarter Play By Play 9/24/2023
P11
END OF QUARTER Chicago Bears10 4:1513041/20/0 Kansas City Chiefs4110:4532053/40/0 Score Time Poss First Downs RPXT Efficiencies 3 Down4 Down Chicago
GEHA
Bears vs Kansas City Chiefs at
Field at Arrowhead Stadium
Miscellaneous Statistics Report
2-5-KC 44(4:59) (No Huddle, Shotgun) J.Fields pass deep left to D.Moore ran ob at KC 15 for 29 yards (Ja.Watson).
1-10-CHI 43(5:26) J.Fields scrambles right end to KC 40 for 17 yards (D.Tranquill).
1-10-CHI 3(12:25) (Shotgun) J.Fields pass short right to C.Claypool ran ob at CHI 18 for 15 yards. 1 15
2-5-CHI 30(10:53) (Shotgun) J.Fields pass short left to C.Kmet to CHI 44 for 14 yards (B.Cook).
3-3-CHI 32(6:12) (Shotgun) K.Herbert right tackle to CHI 43 for 11 yards (J.Cochrane; J.Reid). 1 11
4 11
3 9
4 9
4 8
2-9-CHI 40(5:47) (No Huddle, Shotgun) R.Johnson left end to KC 49 for 11 yards (C.Conner; M.Edwards).
1-10-KC 28(3:16) J.Fields right end to KC 19 for 9 yards (D.Tranquill).
3-4-KC 9(4:23) (Shotgun) J.Fields pass short left to D.Moore for 9 yards, TOUCHDOWN.
2-4-CHI 31(6:45) (No Huddle, Shotgun) J.Fields pass short right to C.Kmet to CHI 39 for 8 yards (M.Herring; L.Chenal).
1-10-CHI 25(6:51) (Shotgun) K.Herbert right guard to CHI 32 for 7 yards (B.Cook).
Play StartPlay YardsQtrDescription
2 37
3 37
2 29
1 24
1 21
2 18
4 16
2-6-KC 16(7:52) P.Mahomes pass deep right to Ju.Watson to CHI 47 for 37 yards (T.Smith) [G.Dexter].
3-6-KC 40(11:43) (Shotgun) P.Mahomes pass deep right to M.Valdes-Scantling to CHI 23 for 37 yards (T.Smith).
1-15-KC 45 (:18) (Shotgun) P.Mahomes pass short right to Ju.Watson to CHI 41 for 14 yards (Ja.Jones). PENALTY on CHI-Ja.Jones, Face Mask, 15 yards, enforced at CHI 41.
1-10-KC 41(9:36) P.Mahomes pass short right to T.Kelce to CHI 35 for 24 yards (J.Brisker).
1-10-CHI 35(8:54) (Shotgun) P.Mahomes pass deep middle to S.Moore to CHI 14 for 21 yards (T.Edmunds).
1-10-CHI 46(14:19) I.Pacheco left end to CHI 28 for 18 yards (E.Hicks).
2-10-KC 39(2:00) (Shotgun) C.Edwards-Helaire right guard to CHI 45 for 16 yards (E.Hicks).
3-2-KC 39(15:00) (Shotgun) P.Mahomes pass short left to T.Kelce to CHI 46 for 15 yards (T.Smith). 2 15
1-10-KC 35(:35) (Shotgun) P.Mahomes scrambles left end ran ob at 50 for 15 yards (T.Smith). 2 15
3-12-CHI 49(9:23) (Shotgun) B.Gabbert pass short right to R.Rice to CHI 34 for 15 yards (Ja.Jones) [Ju.Jones].
City
9/24/2023
at
Chicago Bears vs Kansas
Chiefs
at GEHA Field
Arrowhead Stadium
Ten Longest Plays for Chicago Bears Ten Longest Plays for Kansas City Chiefs VISITOR Chicago Bears 1 0 0 HOME Kansas City Chiefs 5 0 0 OffenseDefenseSpecial TouchdownTeams Scoring Information Player Scoring Information Play StartPlay YardsQtrDescription
29
4
1 17
2 14
1 7
4
ClubPlayerTDRush TD Rec TD KO TDPunt TD Int TDFum TD Misc TD FGXP2Pt Rush 2Pt Rec SftyPoints CHID.Moore 0010000000006 0 CHIC.Santos 0000000011004 0 KCJ.McKinnon 00200000000012 0 KCH.Butker 00000000250011 0 KCI.Pacheco 0100000000006 0 KCC.Edwards-Helaire0100000000006 0 KCT.Kelce 0010000000006 0 Possession DetailFirst HalfSecond HalfGame Largest Lead Largest Deficit Drives Leading Drives Trailing Time of Possession Leading Time of Possession Trailing Times Score Tied Up Lead Changes VisitorHomeVisitorHomeVisitorHome 0 0 0:00 -34 5 8:18 34 5 13:33 0 0 0:00 0 0 0:00 -41 4 12:40 41 4 17:20 0 0 0:00 0 0 0:00 -41 9 20:58 41 9 30:53 0 0 0:00 0 1 0 0 0 1
15
PLAYER STATS


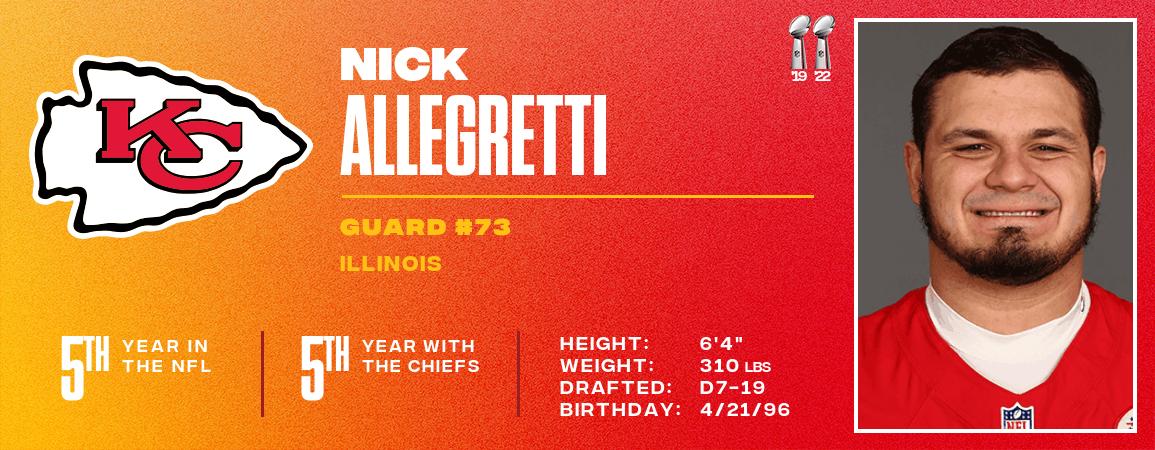
120 @CHIEFS NICK ALLEGRETTI'S NFL REGULAR SEASON STATISTICS DATE TEAM GP GS 2019 Chiefs 7 0 2020 Chiefs 16 9 2021 Chiefs 17 0 2022 Chiefs 17 3 2023 Chiefs 3 0 NFL TOTALS 60 12 2023 GAME-BY-GAME REGULAR-SEASON STATISTICS (CHIEFS) DATE OPPONENT P/S W/L SCORE 09/07 Lions P L 20-21 09/17 at Jaguars P W 17-9 09/24 Bears P W 41-10 2023 TOTALS 3-0 2-1
ANUDIKE-UZOMAH'S
DEFENSIVE STATISTICS TACKLES INTERCEPTIONS O. FUMB ST MISC DATE TEAM GP GS TK S A TFL YDS SK YDS QBH NO YDS LG TD PD FF FR TD YDS TK S A FF FR S A 2023 Chiefs 3 0 7 5 2 0 0 0.5 1.0 2 0 0 0 0 0 1 0 0 0 0 0 0 0 0 0 0 NFL TOTALS 3 0 7 5 2 0 0 0.5 1.0 2 0 0 0 0 0 1 0 0 0 0 0 0 0 0 0 0
FELIX
NFL REGULAR SEASON
2023 GAME-BY-GAME REGULAR-SEASON STATISTICS (CHIEFS)
BLAKE BELL'S NFL REGULAR SEASON RUSHING/RECEIVING STATISTICS
121 @CHIEFS
TACKLES INTERCEPTIONS O. FUMB ST MISC DATE OPPONENT P/S TK S A SK YDS TFL YDS QBH NO YDS LG TD PD FF FR TD YDS TK S A FF FR S A W/L SCORE 09/07 Lions P 2 2 0 0.0 0.0 0 0 2 0 0 0 0 0 0 0 0 0 0 0 0 0 0 0 0 L 20-21 09/17 at Jaguars P 2 1 1 0.5 1.0 0 0 0 0 0 0 0 0 1 0 0 0 0 0 0 0 0 0 0 W 17-9 09/24 Bears P 3 2 1 0.0 0.0 0 0 0 0 0 0 0 0 0 0 0 0 0 0 0 0 0 0 0 W 41-10 2023 TOTALS 3-0 7 5 2 0.5 1.0 0 0 2 0 0 0 0 0 1 0 0 0 0 0 0 0 0 0 0 2-1
RECEIVING RUSHING DATE TEAM GP GS NO. YDS. AVG. LG TD NO. YDS. AVG. LG TD 2015 49ers 14 5 15 186 12.4 48 0 0 0 0.0 0 0 2016 49ers 13 0 4 85 21.3 45 0 0 0 0.0 0 0 2017 Vikings 13 3 3 19 6.3 12 0 0 0 0.0 0 0 2018 Vikings 0 0 0 0 0.0 0 0 0 0 0.0 0 0 Went from Minnesota to Jacksonville 2018 Jaguars 10 4 8 67 8.4 16 0 0 0 0.0 0 0 2018 TOTAL 10 4 8 67 8.4 16 0 0 0 0.0 0 0 2019 Chiefs 15 7 8 67 8.4 30 0 0 0 0.0 0 0 2020 Cowboys 16 2 11 110 10.0 24 0 1 2 2.0 2 0 2021 Chiefs 16 5 9 87 9.7 24 0 4 10 2.5 3 0 2022 Chiefs 3 1 2 20 10.0 17t 1 0 0 0.0 0 0 2023 Chiefs 3 0 2 12 6.0 8 1 0 0 0.0 0 0 NFL TOTALS 103 27 62 653 10.5 48 2 5 12 2.4 3 0
NFL REGULAR SEASON RETURN
KICKOFF RETURNS PUNT RETURNS DATE TEAM RET. YDS. AVG. LG TD NO. FC YDS. AVG. LG TD 2015 49ers 0 0 0.0 0 0 0 0 0 0.0 0 0 2016 49ers 0 0 0.0 0 0 0 0 0 0.0 0 0 2017 Vikings 0 0 0.0 0 0 0 0 0 0.0 0 0 2018 Vikings 0 0 0.0 0 0 0 0 0 0.0 0 0 Went from Minnesota to Jacksonville 2018 Jaguars 1 9 9.0 9 0 0 0 0 0.0 0 0 2018 TOTAL 1 9 9.0 9 0 0 0 0 0.0 0 0 2019 Chiefs 0 0 0.0 0 0 0 0 0 0.0 0 0 2020 Cowboys 0 0 0.0 0 0 0 0 0 0.0 0 0 2021 Chiefs 0 0 0.0 0 0 0 0 0 0.0 0 0 2022 Chiefs 0 0 0.0 0 0 0 0 0 0.0 0 0 2023 Chiefs 0 0 0.0 0 0 0 0 0 0.0 0 0 NFL TOTALS 1 9 9.0 9 0 0 0 0 0.0 0 0
BLAKE BELL'S
STATISTICS
122 @CHIEFS
REGULAR-SEASON
RECEIVING RUSHING DATE OPPONENT P/S NO. YDS. AVG. LG TD NO. YDS. AVG. LG TD W/L SCORE 09/07 Lions P 2 12 6.0 8 1 0 0 0.0 0 0 L 20-21 09/17 at Jaguars P 0 0 0.0 0 0 0 0 0.0 0 0 W 17-9 09/24 Bears P 0 0 0.0 0 0 0 0 0.0 0 0 W 41-10 2023 TOTALS 3-0 2 12 6.0 8 1 0 0 0.0 0 0 2-1 NICK BOLTON'S NFL REGULAR SEASON DEFENSIVE STATISTICS TACKLES INTERCEPTIONS O. FUMB ST MISC DATE TEAM GP GS TK S A TFL YDS SK YDS QBH NO YDS LG TD PD FF FR TD YDS TK S A FF FR S A 2021 Chiefs 16 12 112 70 42 11 11 0.0 0.0 3 0 0 0 0 3 0 1 1 86 0 0 0 0 0 0 0 2022 Chiefs 17 17 180 108 72 9 22 2.0 19.0 7 2 15 15 0 3 1 0 0 0 0 0 0 0 0 0 0 2023 Chiefs 2 2 15 9 6 0 0 0.0 0.0 0 0 0 0 0 0 0 0 0 0 0 0 0 0 0 0 0 NFL TOTALS 35 31 307 187 120 20 33 2.0 19.0 10 2 15 15 0 6 1 1 1 86 0 0 0 0 0 0 0 2023 GAME-BY-GAME REGULAR-SEASON STATISTICS (CHIEFS) TACKLES INTERCEPTIONS O. FUMB ST MISC DATE OPPONENT P/S TK S A SK YDS TFL YDS QBH NO YDS LG TD PD FF FR TD YDS TK S A FF FR S A W/L SCORE 09/07 Lions S 7 4 3 0.0 0.0 0 0 0 0 0 0 0 0 0 0 0 0 0 0 0 0 0 0 0 L 20-21 09/17 at Jaguars S 8 5 3 0.0 0.0 0 0 0 0 0 0 0 0 0 0 0 0 0 0 0 0 0 0 0 W 17-9 09/24 Bears INACTIVE W 41-10 2023 TOTALS 2-2 15 9 6 0.0 0.0 0 0 0 0 0 0 0 0 0 0 0 0 0 0 0 0 0 0 0 2-1
2023 GAME-BY-GAME
STATISTICS (CHIEFS)
2023 GAME-BY-GAME
REGULAR-SEASON STATISTICS (CHIEFS)
123 @CHIEFS
NFL REGULAR SEASON DEFENSIVE STATISTICS TACKLES INTERCEPTIONS O. FUMB ST MISC DATE TEAM GP GS TK S A TFL YDS SK YDS QBH NO YDS LG TD PD FF FR TD YDS TK S A FF FR S A 2023 Chiefs 0 0 0 0 0 0 0 0.0 0.0 0 0 0 0 0 0 0 0 0 0 0 0 0 0 0 0 0 NFL TOTALS 0 0 0 0 0 0 0 0.0 0.0 0 0 0 0 0 0 0 0 0 0 0 0 0 0 0 0 0 2023 GAME-BY-GAME REGULAR-SEASON STATISTICS (CHIEFS) TACKLES INTERCEPTIONS O. FUMB ST MISC DATE OPPONENT P/S TK S A SK YDS TFL YDS QBH NO YDS LG TD PD FF FR TD YDS TK S A FF FR S A W/L SCORE 09/07 Lions PRACTICE SQUAD L 20-21 09/17 at Jaguars PRACTICE SQUAD W 17-9 09/24 Bears PRACTICE SQUAD W 41-10 2023 TOTALS 0 0 0 0.0 0.0 0 0 0 0 0 0 0 0 0 0 0 0 0 0 0 0 0 0 0 2-1
BUSH'S NFL REGULAR SEASON DEFENSIVE STATISTICS TACKLES INTERCEPTIONS O. FUMB ST MISC DATE TEAM GP GS TK S A TFL YDS SK YDS QBH NO YDS LG TD PD FF FR TD YDS TK S A FF FR S A 2016 Bears 11 6 21 16 5 0 0 0.0 0.0 0 0 0 0 0 1 0 0 0 0 1 1 0 0 0 0 0 2017 Bears 13 0 3 1 2 0 0 0.0 0.0 0 0 0 0 0 0 0 0 0 0 3 3 0 0 0 0 0 2018 Bears 15 2 6 6 0 1 7 1.0 7.0 1 0 0 0 0 0 1 0 0 0 2 2 0 0 0 0 0 2019 Bears 15 0 6 6 0 0 0 0.0 0.0 0 0 0 0 0 2 0 0 0 0 2 2 0 0 0 0 0 2020 Bears 12 0 1 1 0 0 0 0.0 0.0 0 1 10 10 0 2 0 0 0 0 4 4 0 0 0 0 0 2021 Bears 14 4 31 23 8 0 0 0.0 0.0 0 2 42 27 0 5 0 0 0 0 9 8 1 0 0 0 0 2022 Chiefs 16 0 4 3 1 0 0 0.0 0.0 0 0 0 0 0 1 0 0 0 0 7 3 4 0 0 0 0 2023 Chiefs 0 0 0 0 0 0 0 0.0 0.0 0 0 0 0 0 0 0 0 0 0 0 0 0 0 0 0 0 NFL TOTALS 96 12 72 56 16 1 7 1.0 7.0 1 3 52 27 0 11 1 0 0 0 28 23 5 0 0 0 0
EKOW BOYE-DOE'S
DEON
TACKLES INTERCEPTIONS O. FUMB ST MISC DATE OPPONENT P/S TK S A SK YDS TFL YDS QBH NO YDS LG TD PD FF FR TD YDS TK S A FF FR S A W/L SCORE 09/07 Lions PRACTICE SQUAD L 20-21 09/17 at Jaguars PRACTICE SQUAD W 17-9 09/24 Bears PRACTICE SQUAD W 41-10 2023 TOTALS 0 0 0 0.0 0.0 0 0 0 0 0 0 0 0 0 0 0 0 0 0 0 0 0 0 0 2-1
MATT
2023 GAME-BY-GAME REGULAR-SEASON STATISTICS (CHIEFS)
124 @CHIEFS
RECEIVING RUSHING DATE TEAM GP GS NO. YDS. AVG. LG TD NO. YDS. AVG. LG TD 2021 Raiders 2 0 0 0 0.0 0 0 0 0 0.0 0 0 2022 Chiefs 0 0 0 0 0.0 0 0 0 0 0.0 0 0 2023 Chiefs 1 0 0 0 0.0 0 0 0 0 0.0 0 0 NFL TOTALS 3 0 0 0 0.0 0 0 0 0 0.0 0 0
BUSHMAN'S NFL REGULAR SEASON RUSHING/RECEIVING STATISTICS
KICKOFF RETURNS PUNT RETURNS DATE TEAM RET. YDS. AVG. LG TD NO. FC YDS. AVG. LG TD 2021 Raiders 0 0 0.0 0 0 0 0 0 0.0 0 0 2022 Chiefs 0 0 0.0 0 0 0 0 0 0.0 0 0 2023 Chiefs 0 0 0.0 0 0 0 0 0 0.0 0 0 NFL TOTALS 0 0 0.0 0 0 0 0 0 0.0 0 0
MATT BUSHMAN'S NFL REGULAR SEASON RETURN STATISTICS
RECEIVING RUSHING DATE OPPONENT P/S NO. YDS. AVG. LG TD NO. YDS. AVG. LG TD W/L SCORE 09/07 Lions P 0 0 0.0 0 0 0 0 0.0 0 0 L 20-21 09/17 at Jaguars PRACTICE SQUAD W 17-9 09/24 Bears PRACTICE SQUAD W 41-10 2023 TOTALS 1-0 0 0 0.0 0 0 0 0 0.0 0 0 2-1
2023
GAME-BY-GAME REGULAR-SEASON STATISTICS (CHIEFS)
125 @CHIEFS HARRISON BUTKER'S NFL REGULAR SEASON KICKING STATISTICS DATE TEAM GP FGM FGA PCT. LG XP XPA PCT. BLK PTS 2017 Panthers 0 0 0 0.0 0 0 0 0.0 0 0 Went from Carolina to Kansas City 2017 Chiefs 13 38 42 90.5 53 28 28 100.0 0 142 2017 TOTAL 13 38 42 90.5 53 28 28 100.0 0 142 2018 Chiefs 16 24 27 88.9 54 65 69 94.2 0 137 2019 Chiefs 16 34 38 89.5 56 45 48 93.8 1 147 2020 Chiefs 16 25 27 92.6 58 48 54 88.9 0 123 2021 Chiefs 16 25 28 89.3 56 47 49 95.9 0 122 2022 Chiefs 13 18 24 75.0 62 38 41 92.7 1 92 2023 Chiefs 3 5 5 100.0 41 9 9 100.0 0 24 NFL TOTALS 93 169 191 88.5 62 280 298 94.0 2 787 HARRISON BUTKER'S NFL REGULAR SEASON FIELD-GOAL ACCURACY STATISTICS DATE TEAM 1-19 PCT. 20-29 PCT. 30-39 PCT. 40-49 PCT. 50+ PCT. 2017 Panthers 0-0 0.0 0-0 0.0 0-0 0.0 0-0 0.0 0-0 0.0 Went from Carolina to Kansas City 2017 Chiefs 0-0 0.0 8-8 100.0 16-17 94.1 10-12 83.3 4-5 80.0 2017 TOTAL 0-0 0.0 8-8 100.0 16-17 94.1 10-12 83.3 4-5 80.0 2018 Chiefs 0-0 0.0 9-9 100.0 7-7 100.0 6-7 85.7 2-4 50.0 2019 Chiefs 0-0 0.0 9-9 100.0 9-10 90.0 13-13 100.0 3-6 50.0 2020 Chiefs 2-2 100.0 7-7 100.0 9-9 100.0 3-5 60.0 4-4 100.0 2021 Chiefs 0-0 0.0 3-3 100.0 11-11 100.0 4-5 80.0 7-9 77.8 2022 Chiefs 0-0 0.0 7-7 100.0 4-5 80.0 4-5 80.0 3-7 42.9 2023 Chiefs 0-0 0.0 0-0 0.0 4-4 100.0 1-1 100.0 0-0 0.0 NFL TOTALS 2-2 100.0 43-43 100.0 60-63 95.2 41-48 85.4 23-35 65.7
FIELD GOALS EXTRA POINTS DATE OPPONENT FGM FGA PCT LG XP XPA PCT BLK PTS W/L SCORE 09/07 Lions P 2 2 100.0 39 2 2 100.0 0 8 L 20-21 09/17 at Jaguars P 1 1 100.0 38 2 2 100.0 0 5 W 17-9 09/24 Bears P 2 2 100.0 41 5 5 100.0 0 11 W 41-10 2023 TOTALS 3 5 5 100.0 41 9 9 100.0 0 24 2-1
2023 GAME-BY-GAME REGULAR-SEASON STATISTICS (CHIEFS)
LEO CHENAL'S NFL REGULAR SEASON DEFENSIVE STATISTICS
126 @CHIEFS MIKE CALIENDO'S NFL REGULAR SEASON STATISTICS DATE TEAM GP GS 2022 Chiefs 0 0 2023 Chiefs 3 0 NFL TOTALS 3 0
DATE OPPONENT P/S W/L SCORE 09/07 Lions P L 20-21 09/17 at Jaguars P W 17-9 09/24 Bears P W 41-10 2023 TOTALS 3-0 2-1
TACKLES INTERCEPTIONS O. FUMB ST MISC DATE TEAM GP GS TK S A TFL YDS SK YDS QBH NO YDS LG TD PD FF FR TD YDS TK S A FF FR S A 2022 Chiefs 17 8 29 16 13 3 3 1.0 1.0 3 0 0 0 0 0 0 0 0 0 6 3 3 0 0 0 0 2023 Chiefs 3 0 14 9 5 1 1 0.0 0.0 1 0 0 0 0 0 0 0 0 0 0 0 0 0 0 0 0 NFL TOTALS 20 8 43 25 18 4 4 1.0 1.0 4 0 0 0 0 0 0 0 0 0 6 3 3 0 0 0 0
127 @CHIEFS
(CHIEFS) TACKLES INTERCEPTIONS O. FUMB ST MISC DATE OPPONENT P/S TK S A SK YDS TFL YDS QBH NO YDS LG TD PD FF FR TD YDS TK S A FF FR S A W/L SCORE 09/07 Lions P 6 3 3 0.0 0.0 0 0 0 0 0 0 0 0 0 0 0 0 0 0 0 0 0 0 0 L 20-21 09/17 at Jaguars P 4 3 1 0.0 0.0 1 1 0 0 0 0 0 0 0 0 0 0 0 0 0 0 0 0 0 W 17-9 09/24 Bears P 4 3 1 0.0 0.0 0 0 1 0 0 0 0 0 0 0 0 0 0 0 0 0 0 0 0 W 41-10 2023 TOTALS 3-0 14 9 5 0.0 0.0 1 1 1 0 0 0 0 0 0 0 0 0 0 0 0 0 0 0 0 2-1
TACKLES INTERCEPTIONS O. FUMB ST MISC DATE TEAM GP GS TK S A TFL YDS SK YDS QBH NO YDS LG TD PD FF FR TD YDS TK S A FF FR S A 2020 Chargers 4 0 0 0 0 0 0 0.0 0.0 0 0 0 0 0 0 0 0 0 0 2 1 1 0 0 0 0 2021 Chargers 3 0 0 0 0 0 0 0.0 0.0 0 0 0 0 0 0 0 0 0 0 1 1 0 0 0 0 0 2022 Chiefs 1 0 0 0 0 0 0 0.0 0.0 0 0 0 0 0 0 0 0 0 0 1 1 0 0 0 0 0 2023 Chiefs 1 0 0 0 0 0 0 0.0 0.0 0 0 0 0 0 0 0 0 0 0 0 0 0 0 0 0 0 NFL TOTALS 9 0 0 0 0 0 0 0.0 0.0 0 0 0 0 0 0 0 0 0 0 4 3 1 0 0 0 0
GAME-BY-GAME REGULAR-SEASON STATISTICS (CHIEFS) TACKLES INTERCEPTIONS O. FUMB ST MISC DATE OPPONENT P/S TK S A SK YDS TFL YDS QBH NO YDS LG TD PD FF FR TD YDS TK S A FF FR S A W/L SCORE 09/07 Lions PRACTICE SQUAD L 20-21 09/17 at Jaguars PRACTICE SQUAD W 17-9 09/24 Bears PRACTICE SQUAD W 41-10 2023 TOTALS 0 0 0 0.0 0.0 0 0 0 0 0 0 0 0 0 0 0 0 0 0 0 0 0 0 0 2-1
2023 GAME-BY-GAME REGULAR-SEASON STATISTICS
COLE CHRISTIANSEN'S NFL REGULAR SEASON DEFENSIVE STATISTICS
2023
2023 GAME-BY-GAME REGULAR-SEASON STATISTICS (CHIEFS)
128 @CHIEFS
TACKLES INTERCEPTIONS O. FUMB ST MISC DATE TEAM GP GS TK S A TFL YDS SK YDS QBH NO YDS LG TD PD FF FR TD YDS TK S A FF FR S A 2023 Chiefs 1 0 1 1 0 1 0 0.0 0.0 0 0 0 0 0 0 0 0 0 0 0 0 0 0 0 0 0 NFL TOTALS 1 0 1 1 0 1 0 0.0 0.0 0 0 0 0 0 0 0 0 0 0 0 0 0 0 0 0 0
KEONDRE COBURN'S NFL REGULAR SEASON DEFENSIVE STATISTICS
TACKLES INTERCEPTIONS O. FUMB ST MISC DATE OPPONENT P/S TK S A SK YDS TFL YDS QBH NO YDS LG TD PD FF FR TD YDS TK S A FF FR S A W/L SCORE 09/07 Lions P 1 1 0 0.0 0.0 1 0 0 0 0 0 0 0 0 0 0 0 0 0 0 0 0 0 0 L 20-21 09/17 at Jaguars INACTIVE W 17-9 09/24 Bears INACTIVE W 41-10 2023 TOTALS 1-0 1 1 0 0.0 0.0 1 0 0 0 0 0 0 0 0 0 0 0 0 0 0 0 0 0 0 2-1 JACK COCHRANE'S NFL REGULAR SEASON DEFENSIVE STATISTICS TACKLES INTERCEPTIONS O. FUMB ST MISC DATE TEAM GP GS TK S A TFL YDS SK YDS QBH NO YDS LG TD PD FF FR TD YDS TK S A FF FR S A 2022 Chiefs 15 0 0 0 0 0 0 0.0 0.0 0 0 0 0 0 0 0 0 0 0 9 5 4 0 0 0 0 2023 Chiefs 3 0 3 1 2 0 0 0.0 0.0 0 0 0 0 0 0 0 0 0 0 1 1 0 0 0 0 0 NFL TOTALS 18 0 3 1 2 0 0 0.0 0.0 0 0 0 0 0 0 0 0 0 0 10 6 4 0 0 0 0
2023 GAME-BY-GAME REGULAR-SEASON STATISTICS (CHIEFS)
TACKLES INTERCEPTIONS O. FUMB ST MISC DATE OPPONENT P/S TK S A SK YDS TFL YDS QBH NO YDS LG TD PD FF FR TD YDS TK S A FF FR S A W/L SCORE 09/07 Lions P 0 0 0 0.0 0.0 0 0 0 0 0 0 0 0 0 0 0 0 0 0 0 0 0 0 0 L 20-21 09/17 at Jaguars P 0 0 0 0.0 0.0 0 0 0 0 0 0 0 0 0 0 0 0 1 1 0 0 0 0 0 W 17-9 09/24 Bears P 3 1 2 0.0 0.0 0 0 0 0 0 0 0 0 0 0 0 0 0 0 0 0 0 0 0 W 41-10 2023 TOTALS 3-0 3 1 2 0.0 0.0 0 0 0 0 0 0 0 0 0 0 0 0 1 1 0 0 0 0 0 2-1
129 @CHIEFS CHAMARRI CONNER'S NFL REGULAR SEASON DEFENSIVE STATISTICS TACKLES INTERCEPTIONS O. FUMB ST MISC DATE TEAM GP GS TK S A TFL YDS SK YDS QBH NO YDS LG TD PD FF FR TD YDS TK S A FF FR S A 2023 Chiefs 3 2 1 0 1 0 0 0.0 0.0 0 0 0 0 0 0 0 0 0 0 1 1 0 0 0 0 0 NFL TOTALS 3 2 1 0 1 0 0 0.0 0.0 0 0 0 0 0 0 0 0 0 0 1 1 0 0 0 0 0
TACKLES INTERCEPTIONS O. FUMB ST MISC DATE OPPONENT P/S TK S A SK YDS TFL YDS QBH NO YDS LG TD PD FF FR TD YDS TK S A FF FR S A W/L SCORE 09/07 Lions S 0 0 0 0.0 0.0 0 0 0 0 0 0 0 0 0 0 0 0 1 1 0 0 0 0 0 L 20-21 09/17 at Jaguars P 0 0 0 0.0 0.0 0 0 0 0 0 0 0 0 0 0 0 0 0 0 0 0 0 0 0 W 17-9 09/24 Bears S 1 0 1 0.0 0.0 0 0 0 0 0 0 0 0 0 0 0 0 0 0 0 0 0 0 0 W 41-10 2023 TOTALS 3-2 1 0 1 0.0 0.0 0 0 0 0 0 0 0 0 0 0 0 0 1 1 0 0 0 0 0 2-1
2023 GAME-BY-GAME REGULAR-SEASON STATISTICS (CHIEFS)
TACKLES INTERCEPTIONS O. FUMB ST MISC DATE TEAM GP GS TK S A TFL YDS SK YDS QBH NO YDS LG TD PD FF FR TD YDS TK S A FF FR S A 2022 Chiefs 16 1 27 19 8 1 5 1.0 5.0 2 0 0 0 0 2 0 0 0 0 6 3 3 0 0 0 0 2023 Chiefs 3 3 13 8 5 0 0 0.0 0.0 0 0 0 0 0 1 0 1 0 0 0 0 0 0 0 0 0 NFL TOTALS 19 4 40 27 13 1 5 1.0 5.0 2 0 0 0 0 3 0 1 0 0 6 3 3 0 0 0 0
BRYAN COOK'S NFL REGULAR SEASON DEFENSIVE STATISTICS
2023 GAME-BY-GAME
REGULAR-SEASON STATISTICS (CHIEFS)
130 @CHIEFS 2023 GAME-BY-GAME REGULAR-SEASON STATISTICS (CHIEFS) TACKLES INTERCEPTIONS O. FUMB ST MISC DATE OPPONENT P/S TK S A SK YDS TFL YDS QBH NO YDS LG TD PD FF FR TD YDS TK S A FF FR S A W/L SCORE 09/07 Lions S 7 4 3 0.0 0.0 0 0 0 0 0 0 0 0 0 1 0 0 0 0 0 0 0 0 0 L 20-21 09/17 at Jaguars S 2 1 1 0.0 0.0 0 0 0 0 0 0 0 1 0 0 0 0 0 0 0 0 0 0 0 W 17-9 09/24 Bears S 4 3 1 0.0 0.0 0 0 0 0 0 0 0 0 0 0 0 0 0 0 0 0 0 0 0 W 41-10 2023 TOTALS 3-3 13 8 5 0.0 0.0 0 0 0 0 0 0 0 1 0 1 0 0 0 0 0 0 0 0 0 2-1 MIKE DANNA'S NFL REGULAR SEASON DEFENSIVE STATISTICS TACKLES INTERCEPTIONS O. FUMB ST MISC DATE TEAM GP GS TK S A TFL YDS SK YDS QBH NO YDS LG TD PD FF FR TD YDS TK S A FF FR S A 2020 Chiefs 13 1 25 16 9 4 23 2.5 22.5 6 0 0 0 0 0 0 0 0 0 0 0 0 0 0 0 0 2021 Chiefs 17 6 26 11 15 3 14 3.0 14.0 10 0 0 0 0 1 2 0 0 0 0 0 0 0 0 0 0 2022 Chiefs 13 0 27 9 18 3 26 5.0 34.0 10 0 0 0 0 0 2 0 0 0 0 0 0 0 0 0 0 2023 Chiefs 3 3 11 7 4 2 7 2.5 9.0 3 0 0 0 0 1 0 0 0 0 0 0 0 0 0 0 0 NFL TOTALS 46 10 89 43 46 12 70 13.0 79.5 29 0 0 0 0 2 4 0 0 0 0 0 0 0 0 0 0
TACKLES INTERCEPTIONS O. FUMB ST MISC DATE OPPONENT P/S TK S A SK YDS TFL YDS QBH NO YDS LG TD PD FF FR TD YDS TK S A FF FR S A W/L SCORE 09/07 Lions S 6 4 2 1.0 3.0 1 3 1 0 0 0 0 1 0 0 0 0 0 0 0 0 0 0 0 L 20-21 09/17 at Jaguars S 2 0 2 0.5 2.0 0 0 1 0 0 0 0 0 0 0 0 0 0 0 0 0 0 0 0 W 17-9 09/24 Bears S 3 3 0 1.0 4.0 1 4 1 0 0 0 0 0 0 0 0 0 0 0 0 0 0 0 0 W 41-10 2023 TOTALS 3-3 11 7 4 2.5 9.0 2 7 3 0 0 0 0 1 0 0 0 0 0 0 0 0 0 0 0 2-1
2023 GAME-BY-GAME REGULAR-SEASON STATISTICS (CHIEFS)
131 @CHIEFS MATT DICKERSON'S NFL REGULAR SEASON DEFENSIVE STATISTICS TACKLES INTERCEPTIONS O. FUMB ST MISC DATE TEAM GP GS TK S A TFL YDS SK YDS QBH NO YDS LG TD PD FF FR TD YDS TK S A FF FR S A 2018 Titans 3 0 3 2 1 0 0 0.0 0.0 0 0 0 0 0 0 0 0 0 0 0 0 0 0 0 0 0 2019 Titans 5 0 2 1 1 1 0 0.0 0.0 1 0 0 0 0 0 0 0 0 0 0 0 0 0 0 0 0 2020 Titans 10 0 10 4 6 0 0 0.0 0.0 1 0 0 0 0 0 0 0 0 0 0 0 0 0 0 0 0 2021 Cardinals 0 0 0 0 0 0 0 0.0 0.0 0 0 0 0 0 0 0 0 0 0 0 0 0 0 0 0 0 2022 Falcons 5 3 12 3 9 1 0 0.0 0.0 1 0 0 0 0 0 0 0 0 0 0 0 0 0 0 0 0 2023 Chiefs 2 0 4 1 3 0 0 0.0 0.0 0 0 0 0 0 0 0 0 0 0 0 0 0 0 0 0 0 NFL TOTALS 25 3 31 11 20 2 0 0.0 0.0 3 0 0 0 0 0 0 0 0 0 0 0 0 0 0 0 0
REGULAR-SEASON STATISTICS
TACKLES INTERCEPTIONS O. FUMB ST MISC DATE OPPONENT P/S TK S A SK YDS TFL YDS QBH NO YDS LG TD PD FF FR TD YDS TK S A FF FR S A W/L SCORE 09/07 Lions P 3 1 2 0.0 0.0 0 0 0 0 0 0 0 0 0 0 0 0 0 0 0 0 0 0 0 L 20-21 09/17 at Jaguars PRACTICE SQUAD W 17-9 09/24 Bears PRACTICE SQUAD W 41-10 2023 TOTALS 1-0 3 1 2 0.0 0.0 0 0 0 0 0 0 0 0 0 0 0 0 0 0 0 0 0 0 0 2-1 MIKE EDWARDS' NFL REGULAR SEASON DEFENSIVE STATISTICS TACKLES INTERCEPTIONS O. FUMB ST MISC DATE TEAM GP GS TK S A TFL YDS SK YDS QBH NO YDS LG TD PD FF FR TD YDS TK S A FF FR S A 2019 Buccaneers 15 7 45 33 12 3 11 1.0 9.0 1 0 0 0 0 6 0 1 0 -1 0 0 0 0 1 0 0 2020 Buccaneers 16 0 9 5 4 0 0 0.0 0.0 0 2 67 37 0 5 0 1 0 31 2 1 1 0 0 0 0 2021 Buccaneers 14 4 45 33 12 1 1 0.0 0.0 0 3 46 31t 2 7 1 0 0 0 1 1 0 0 0 0 0 2022 Buccaneers 13 12 82 52 30 3 6 1.0 5.0 2 2 68 68t 1 3 0 0 0 0 0 0 0 0 0 0 0 2023 Chiefs 3 0 6 3 3 0 0 0.0 0.0 0 1 16 16 0 1 0 0 0 0 0 0 0 0 0 0 0 NFL TOTALS 61 23 187 126 61 7 18 2.0 14.0 3 8 197 68T 3 22 1 2 0 30 3 2 1 0 1 0 0
2023 GAME-BY-GAME
(CHIEFS)
TACKLES INTERCEPTIONS O. FUMB ST MISC DATE OPPONENT P/S TK S A SK YDS TFL YDS QBH NO YDS LG TD PD FF FR TD YDS TK S A FF FR S A W/L SCORE 09/07 Lions P 2 1 1 0.0 0.0 0 0 0 0 0 0 0 0 0 0 0 0 0 0 0 0 0 0 0 L 20-21 09/17 at Jaguars P 3 2 1 0.0 0.0 0 0 0 0 0 0 0 0 0 0 0 0 0 0 0 0 0 0 0 W 17-9 09/24 Bears P 1 0 1 0.0 0.0 0 0 0 1 16 16 0 1 0 0 0 0 0 0 0 0 0 0 0 W 41-10 2023 TOTALS 3-0 6 3 3 0.0 0.0 0 0 0 1 16 16 0 1 0 0 0 0 0 0 0 0 0 0 0 2-1
132 @CHIEFS CLYDE EDWARDS-HELAIRE'S NFL REGULAR SEASON RUSHING/RECEIVING STATISTICS RUSHING RECEIVING DATE TEAM GP GS NO. YDS. AVG. LG TD NO. YDS. AVG. LG TD 2020 Chiefs 13 13 181 803 4.4 31 4 36 297 8.3 26 1 2021 Chiefs 10 10 119 517 4.3 17 4 19 129 6.8 29 2 2022 Chiefs 10 6 71 302 4.3 52 3 17 151 8.9 25 3 2023 Chiefs 3 1 22 77 3.5 16 1 4 26 6.5 10 0 NFL TOTALS 36 30 393 1,699 4.3 52 12 76 603 7.9 29 6 2023 GAME-BY-GAME REGULAR-SEASON STATISTICS (CHIEFS) RUSHING RECEIVING DATE OPPONENT P/S NO. YDS. AVG. LG TD NO. YDS. AVG. LG TD W/L SCORE 09/07 Lions S 6 22 3.7 5 0 1 7 7.0 7 0 L 20-21 09/17 at Jaguars P 1 0 0.0 0 0 2 17 8.5 10 0 W 17-9 09/24 Bears P 15 55 3.7 16 1 1 2 2.0 2 0 W 41-10 2023 TOTALS 3-1 22 77 3.5 16 1 4 26 6.5 10 0 2-1 NEIL FARRELL'S NFL REGULAR SEASON DEFENSIVE STATISTICS TACKLES INTERCEPTIONS O. FUMB ST MISC DATE TEAM GP GS TK S A TFL YDS SK YDS QBH NO YDS LG TD PD FF FR TD YDS TK S A FF FR S A 2022 Raiders 9 0 12 3 9 1 0 0.0 0.0 2 0 0 0 0 0 0 0 0 0 0 0 0 0 0 0 0 2023 Chiefs 1 0 0 0 0 0 0 0.0 0.0 0 0 0 0 0 0 0 0 0 0 0 0 0 0 0 0 0 NFL TOTALS 10 0 12 3 9 1 0 0.0 0.0 2 0 0 0 0 0 0 0 0 0 0 0 0 0 0 0 0
2023 GAME-BY-GAME REGULAR-SEASON STATISTICS (CHIEFS)
133 @CHIEFS
TACKLES INTERCEPTIONS O. FUMB ST MISC DATE OPPONENT P/S TK S A SK YDS TFL YDS QBH NO YDS LG TD PD FF FR TD YDS TK S A FF FR S A W/L SCORE 09/07 Lions INACTIVE L 20-21 09/17 at Jaguars INACTIVE W 17-9 09/24 Bears P 0 0 0 0.0 0.0 0 0 0 0 0 0 0 0 0 0 0 0 0 0 0 0 0 0 0 W 41-10 2023 TOTALS 1-0 0 0 0 0.0 0.0 0 0 0 0 0 0 0 0 0 0 0 0 0 0 0 0 0 0 0 2-1
REGULAR
DATE TEAM GP GS ATT. CMP. PCT. YDS AVG. TD INT. LG SK LST RATE 2011 Jaguars 15 14 413 210 50.8 2,214 5.4 12 11 74t 40 293 65.4 2012 Jaguars 10 10 278 162 58.3 1,662 6.0 9 6 80t 22 158 77.4 2013 Jaguars 3 3 86 42 48.8 481 5.6 1 7 67t 12 67 36.0 2014 49ers 1 0 7 3 42.9 38 5.4 1 0 20t 0 0 100.0 2015 49ers 8 8 282 178 63.1 2,031 7.2 10 7 71t 25 164 86.2 2016 49ers 6 5 160 91 56.9 925 5.8 5 6 75t 11 48 68.4 2017 Cardinals 5 5 171 95 55.6 1,086 6.4 6 6 52t 23 149 71.9 2018 Titans 8 3 101 61 60.4 626 6.2 4 4 35 5 37 74.9 2019 Buccaneers 0 0 0 0 0.0 0 0.0 0 0 0 0 0 0.0 2020 Buccaneers 4 0 16 9 56.3 143 8.9 2 0 35 1 7 125.8 2021 Buccaneers 6 0 11 7 63.6 67 6.1 0 0 23 1 10 80.5 2022 Buccaneers 1 0 8 6 75.0 29 3.6 1 0 13 0 0 119.3 2023 Chiefs 1 0 5 3 60.0 31 6.2 0 2 15 0 0 38.3 TOTALS 68 48 1,538 867 56.4 9,333 6.1 51 49 80T 140 933 72.1 BLAINE GABBERT'S NFL REGULAR SEASON RUSHING STATISTICS DATE TEAM NO. YDS. AVG. LG TD 2011 Jaguars 48 98 2.0 12 0 2012 Jaguars 18 56 3.1 10 0 2013 Jaguars 9 32 3.6 7 0 2014 49ers 1 5 5.0 5 0 2015 49ers 32 185 5.8 44t 1 2016 49ers 40 173 4.3 24 2 2017 Cardinals 22 82 3.7 12 0 2018 Titans 6 0 0.0 1 0 2019 Buccaneers 0 0 0.0 0 0 2020 Buccaneers 9 16 1.8 16 0 2021 Buccaneers 9 -7 -0.8 0 0 2022 Buccaneers 0 0 0.0 0 0 2023 Chiefs 2 -1 -0.5 0 0 TOTALS 196 639 3.3 44T 3
BLAINE GABBERT'S NFL
SEASON PASSING STATISTICS
BLAINE GABBERT'S NFL REGULAR SEASON PASSING/RUSHING STATISTICS
134 @CHIEFS
PASSING RUSHING DATE TEAM GP GS ATT. CMP. PCT. YDS AVG. TD INT. LG SK LST RATE NO. YDS. AVG. LG TD 2011 Jaguars 15 14 413 210 50.8 2,214 5.4 12 11 74t 40 293 65.4 48 98 2.0 12 0 2012 Jaguars 10 10 278 162 58.3 1,662 6.0 9 6 80t 22 158 77.4 18 56 3.1 10 0 2013 Jaguars 3 3 86 42 48.8 481 5.6 1 7 67t 12 67 36.0 9 32 3.6 7 0 2014 49ers 1 0 7 3 42.9 38 5.4 1 0 20t 0 0 100.0 1 5 5.0 5 0 2015 49ers 8 8 282 178 63.1 2,031 7.2 10 7 71t 25 164 86.2 32 185 5.8 44t 1 2016 49ers 6 5 160 91 56.9 925 5.8 5 6 75t 11 48 68.4 40 173 4.3 24 2 2017 Cardinals 5 5 171 95 55.6 1,086 6.4 6 6 52t 23 149 71.9 22 82 3.7 12 0 2018 Titans 8 3 101 61 60.4 626 6.2 4 4 35 5 37 74.9 6 0 0.0 1 0 2019 Buccaneers 0 0 0 0 0.0 0 0.0 0 0 0 0 0 0.0 0 0 0.0 0 0 2020 Buccaneers 4 0 16 9 56.3 143 8.9 2 0 35 1 7 125.8 9 16 1.8 16 0 2021 Buccaneers 6 0 11 7 63.6 67 6.1 0 0 23 1 10 80.5 9 -7 -0.8 0 0 2022 Buccaneers 1 0 8 6 75.0 29 3.6 1 0 13 0 0 119.3 0 0 0.0 0 0 2023 Chiefs 1 0 5 3 60.0 31 6.2 0 2 15 0 0 38.3 2 -1 -0.5 0 0 TOTALS 68 48 1,538 867 56.4 9,333 6.1 51 49 80T 140 933 72.1 196 639 3.3 44T 3 2023 GAME-BY-GAME REGULAR-SEASON STATISTICS (CHIEFS) PASSING RUSHING DATE OPPONENT P/S ATT CMP YDS PCT Y/A Y/C TD INT LG SK/YD RATE ATT YDS LG TD W/L SCORE 09/07 Lions DID NOT PLAY L 20-21 09/17 at Jaguars DID NOT PLAY W 17-9 09/24 Bears P 5 3 31 60.0 6.2 10.3 0 2 15 0/0 38.3 2 -1 0 0 W 41-10 2023 TOTALS 1-0 5 3 31 60.0 6.2 10.3 0 2 15 0/0 38.3 2 -1 0 0 2-1 300-YARD PASSING GAMES (3): REGULAR SEASON DATE TEAM NO. YDS. AVG. LG TD 10/28/12 at Packers 27 303 11.2 36 1 11/29/15 CARDINALS 25 318 12.7 48 1 01/03/16 RAMS 28 354 12.6 44 1 WILLIE GAY'S NFL REGULAR SEASON DEFENSIVE STATISTICS TACKLES INTERCEPTIONS O. FUMB ST MISC DATE TEAM GP GS TK S A TFL YDS SK YDS QBH NO YDS LG TD PD FF FR TD YDS TK S A FF FR S A 2020 Chiefs 16 8 37 27 10 3 9 1.0 1.0 1 0 0 0 0 3 1 0 0 0 2 2 0 0 0 0 0 2021 Chiefs 12 11 48 26 22 1 0 0.5 3.5 1 2 14 13 0 4 0 0 0 0 0 0 0 0 0 0 0 2022 Chiefs 13 13 88 51 37 9 24 2.5 8.0 4 1 47 47t 1 8 0 1 0 0 0 0 0 0 0 0 0 2023 Chiefs 3 3 7 4 3 0 0 0.0 0.0 0 0 0 0 0 0 0 1 0 0 0 0 0 0 0 0 0 NFL TOTALS 44 35 180 108 72 13 33 4.0 12.5 6 3 61 47T 1 15 1 2 0 0 2 2 0 0 0 0 0
2023 GAME-BY-GAME REGULAR-SEASON STATISTICS (CHIEFS)
NOAH GRAY'S NFL REGULAR SEASON RUSHING/RECEIVING STATISTICS
135 @CHIEFS
TACKLES INTERCEPTIONS O. FUMB ST MISC DATE OPPONENT P/S TK S A SK YDS TFL YDS QBH NO YDS LG TD PD FF FR TD YDS TK S A FF FR S A W/L SCORE 09/07 Lions S 3 2 1 0.0 0.0 0 0 0 0 0 0 0 0 0 0 0 0 0 0 0 0 0 0 0 L 20-21 09/17 at Jaguars S 2 1 1 0.0 0.0 0 0 0 0 0 0 0 0 0 0 0 0 0 0 0 0 0 0 0 W 17-9 09/24 Bears S 2 1 1 0.0 0.0 0 0 0 0 0 0 0 0 0 1 0 0 0 0 0 0 0 0 0 W 41-10 2023 TOTALS 3-3 7 4 3 0.0 0.0 0 0 0 0 0 0 0 0 0 1 0 0 0 0 0 0 0 0 0 2-1
RECEIVING RUSHING DATE TEAM GP GS NO. YDS. AVG. LG TD NO. YDS. AVG. LG TD 2021 Chiefs 16 1 7 36 5.1 8 1 0 0 0.0 0 0 2022 Chiefs 17 8 28 299 10.7 27 1 1 1 1.0 1t 1 2023 Chiefs 3 3 7 78 11.1 24 0 0 0 0.0 0 0 NFL TOTALS 36 12 42 413 9.8 27 2 1 1 1.0 1T 1
136 @CHIEFS NOAH GRAY'S NFL REGULAR SEASON RETURN STATISTICS KICKOFF RETURNS PUNT RETURNS DATE TEAM RET. YDS. AVG. LG TD NO. FC YDS. AVG. LG TD 2021 Chiefs 0 0 0.0 0 0 0 0 0 0.0 0 0 2022 Chiefs 0 0 0.0 0 0 0 0 0 0.0 0 0 2023 Chiefs 0 0 0.0 0 0 0 0 0 0.0 0 0 NFL TOTALS 0 0 0.0 0 0 0 0 0 0.0 0 0 2023 GAME-BY-GAME REGULAR-SEASON STATISTICS (CHIEFS) RECEIVING RUSHING DATE OPPONENT P/S NO. YDS. AVG. LG TD NO. YDS. AVG. LG TD W/L SCORE 09/07 Lions S 3 31 10.3 24 0 0 0 0.0 0 0 L 20-21 09/17 at Jaguars S 3 38 12.7 16 0 0 0 0.0 0 0 W 17-9 09/24 Bears S 1 9 9.0 9 0 0 0 0.0 0 0 W 41-10 2023 TOTALS 3-3 7 78 11.1 24 0 0 0 0.0 0 0 2-1 MALIK HERRING'S NFL REGULAR SEASON DEFENSIVE STATISTICS TACKLES INTERCEPTIONS O. FUMB ST MISC DATE TEAM GP GS TK S A TFL YDS SK YDS QBH NO YDS LG TD PD FF FR TD YDS TK S A FF FR S A 2021 Chiefs 0 0 0 0 0 0 0 0.0 0.0 0 0 0 0 0 0 0 0 0 0 0 0 0 0 0 0 0 2022 Chiefs 7 0 6 1 5 0 0 0.0 0.0 0 0 0 0 0 0 0 1 0 0 0 0 0 0 0 0 0 2023 Chiefs 3 0 3 1 2 0 0 0.0 0.0 1 0 0 0 0 0 0 0 0 0 0 0 0 0 0 0 0 NFL TOTALS 10 0 9 2 7 0 0 0.0 0.0 1 0 0 0 0 0 0 1 0 0 0 0 0 0 0 0 0 2023 GAME-BY-GAME REGULAR-SEASON STATISTICS (CHIEFS) TACKLES INTERCEPTIONS O. FUMB ST MISC DATE OPPONENT P/S TK S A SK YDS TFL YDS QBH NO YDS LG TD PD FF FR TD YDS TK S A FF FR S A W/L SCORE 09/07 Lions P 0 0 0 0.0 0.0 0 0 0 0 0 0 0 0 0 0 0 0 0 0 0 0 0 0 0 L 20-21 09/17 at Jaguars P 0 0 0 0.0 0.0 0 0 1 0 0 0 0 0 0 0 0 0 0 0 0 0 0 0 0 W 17-9 09/24 Bears P 3 1 2 0.0 0.0 0 0 0 0 0 0 0 0 0 0 0 0 0 0 0 0 0 0 0 W 41-10 2023 TOTALS 3-0 3 1 2 0.0 0.0 0 0 1 0 0 0 0 0 0 0 0 0 0 0 0 0 0 0 0 2-1
137 @CHIEFS
HUMPHREY'S NFL REGULAR SEASON STATISTICS DATE TEAM GP GS 2021 Chiefs 17 17 2022 Chiefs 17 17 2023 Chiefs 3 3 NFL TOTALS 37 37
STATISTICS
DATE OPPONENT P/S W/L SCORE 09/07 Lions S L 20-21 09/17 at Jaguars S W 17-9 09/24 Bears S W 41-10 2023 TOTALS 3-3 2-1
CREED
2023 GAME-BY-GAME REGULAR-SEASON
(CHIEFS)
TACKLES INTERCEPTIONS O. FUMB ST MISC DATE TEAM GP GS TK S A TFL YDS SK YDS QBH NO YDS LG TD PD FF FR TD YDS TK S A FF FR S A 2023 Chiefs 3 0 0 0 0 0 0 0.0 0.0 0 0 0 0 0 0 0 0 0 0 1 1 0 0 0 0 0 NFL TOTALS 3 0 0 0 0 0 0 0.0 0.0 0 0 0 0 0 0 0 0 0 0 1 1 0 0 0 0 0
CAM JONES' NFL REGULAR SEASON DEFENSIVE STATISTICS
2023 GAME-BY-GAME REGULAR-SEASON STATISTICS (CHIEFS)
138 @CHIEFS
TACKLES INTERCEPTIONS O. FUMB ST MISC DATE OPPONENT P/S TK S A SK YDS TFL YDS QBH NO YDS LG TD PD FF FR TD YDS TK S A FF FR S A W/L SCORE 09/07 Lions P 0 0 0 0.0 0.0 0 0 0 0 0 0 0 0 0 0 0 0 0 0 0 0 0 0 0 L 20-21 09/17 at Jaguars P 0 0 0 0.0 0.0 0 0 0 0 0 0 0 0 0 0 0 0 1 1 0 0 0 0 0 W 17-9 09/24 Bears P 0 0 0 0.0 0.0 0 0 0 0 0 0 0 0 0 0 0 0 0 0 0 0 0 0 0 W 41-10 2023 TOTALS 3-0 0 0 0 0.0 0.0 0 0 0 0 0 0 0 0 0 0 0 0 1 1 0 0 0 0 0 2-1
TACKLES INTERCEPTIONS O. FUMB ST MISC DATE TEAM GP GS TK S A TFL YDS SK YDS QBH NO YDS LG TD PD FF FR TD YDS TK S A FF FR S A 2016 Chiefs 16 11 28 17 11 5 26 2.0 19.0 10 0 0 0 0 4 0 0 0 0 0 0 0 0 0 0 0 2017 Chiefs 16 7 32 22 10 5 24 6.5 42.0 13 1 -3 0 0 7 4 0 0 0 0 0 0 0 0 0 0 2018 Chiefs 16 11 40 35 5 19 112 15.5 122.0 29 1 20 20t 1 5 2 0 0 0 0 0 0 0 0 0 0 2019 Chiefs 13 12 36 23 13 8 63 9.0 75.0 20 0 0 0 0 4 1 1 0 12 0 0 0 0 0 0 0 2020 Chiefs 15 14 36 23 13 3 17 7.5 28.0 28 0 0 0 0 4 2 0 0 0 0 0 0 0 0 0 0 2021 Chiefs 14 14 27 18 9 8 53 9.0 65.5 17 0 0 0 0 5 1 1 0 -2 0 0 0 0 0 0 0 2022 Chiefs 17 17 44 30 14 17 94 15.5 105.5 29 0 0 0 0 4 2 1 0 2 0 0 0 0 0 0 0 2023 Chiefs 2 2 3 2 1 2 13 2.5 14.0 3 0 0 0 0 1 0 0 0 0 0 0 0 0 0 0 0 NFL TOTALS 109 88 246 170 76 67 402 67.5 471.0 149 2 17 20T 1 34 12 3 0 12 0 0 0 0 0 0 0
TACKLES INTERCEPTIONS O. FUMB ST MISC DATE OPPONENT P/S TK S A SK YDS TFL YDS QBH NO YDS LG TD PD FF FR TD YDS TK S A FF FR S A W/L SCORE 09/07 Lions RESERVE/DID NOT REPORT L 20-21 09/17 at Jaguars S 2 1 1 1.5 6.0 1 5 2 0 0 0 0 1 0 0 0 0 0 0 0 0 0 0 0 W 17-9 09/24 Bears S 1 1 0 1.0 8.0 1 8 1 0 0 0 0 0 0 0 0 0 0 0 0 0 0 0 0 W 41-10 2023 TOTALS 2-2 3 2 1 2.5 14.0 2 13 3 0 0 0 0 1 0 0 0 0 0 0 0 0 0 0 0 2-1
CHRIS JONES' NFL REGULAR SEASON DEFENSIVE STATISTICS
2023 GAME-BY-GAME REGULAR-SEASON STATISTICS (CHIEFS)
139 @CHIEFS NIC JONES' NFL REGULAR SEASON DEFENSIVE STATISTICS TACKLES INTERCEPTIONS O. FUMB ST MISC DATE TEAM GP GS TK S A TFL YDS SK YDS QBH NO YDS LG TD PD FF FR TD YDS TK S A FF FR S A 2023 Chiefs 0 0 0 0 0 0 0 0.0 0.0 0 0 0 0 0 0 0 0 0 0 0 0 0 0 0 0 0 NFL TOTALS 0 0 0 0 0 0 0 0.0 0.0 0 0 0 0 0 0 0 0 0 0 0 0 0 0 0 0 0
REGULAR-SEASON STATISTICS
TACKLES INTERCEPTIONS O. FUMB ST MISC DATE OPPONENT P/S TK S A SK YDS TFL YDS QBH NO YDS LG TD PD FF FR TD YDS TK S A FF FR S A W/L SCORE 09/07 Lions INACTIVE L 20-21 09/17 at Jaguars INACTIVE W 17-9 09/24 Bears INACTIVE W 41-10 2023 TOTALS 0 0 0 0.0 0.0 0 0 0 0 0 0 0 0 0 0 0 0 0 0 0 0 0 0 0 2-1
JONES' NFL REGULAR SEASON DEFENSIVE STATISTICS TACKLES INTERCEPTIONS O. FUMB ST MISC DATE TEAM GP GS TK S A TFL YDS SK YDS QBH NO YDS LG TD PD FF FR TD YDS TK S A FF FR S A 2023 Chiefs 0 0 0 0 0 0 0 0.0 0.0 0 0 0 0 0 0 0 0 0 0 0 0 0 0 0 0 0 NFL TOTALS 0 0 0 0 0 0 0 0.0 0.0 0 0 0 0 0 0 0 0 0 0 0 0 0 0 0 0 0
2023 GAME-BY-GAME
(CHIEFS)
TRUMAN
140 @CHIEFS 2023 GAME-BY-GAME REGULAR-SEASON STATISTICS (CHIEFS) TACKLES INTERCEPTIONS O. FUMB ST MISC DATE OPPONENT P/S TK S A SK YDS TFL YDS QBH NO YDS LG TD PD FF FR TD YDS TK S A FF FR S A W/L SCORE 09/07 Lions PRACTICE SQUAD L 20-21 09/17 at Jaguars PRACTICE SQUAD W 17-9 09/24 Bears PRACTICE SQUAD W 41-10 2023 TOTALS 0 0 0 0.0 0.0 0 0 0 0 0 0 0 0 0 0 0 0 0 0 0 0 0 0 0 2-1 GEORGE KARLAFTIS' NFL REGULAR SEASON DEFENSIVE STATISTICS TACKLES INTERCEPTIONS O. FUMB ST MISC DATE TEAM GP GS TK S A TFL YDS SK YDS QBH NO YDS LG TD PD FF FR TD YDS TK S A FF FR S A 2022 Chiefs 17 17 33 18 15 8 38 6.0 40.0 11 0 0 0 0 7 0 2 0 0 0 0 0 0 0 0 0 2023 Chiefs 3 3 13 5 8 2 17 2.0 9.0 3 0 0 0 0 1 0 0 0 0 0 0 0 0 0 0 0 NFL TOTALS 20 20 46 23 23 10 55 8.0 49.0 14 0 0 0 0 8 0 2 0 0 0 0 0 0 0 0 0
TACKLES INTERCEPTIONS O. FUMB ST MISC DATE OPPONENT P/S TK S A SK YDS TFL YDS QBH NO YDS LG TD PD FF FR TD YDS TK S A FF FR S A W/L SCORE 09/07 Lions S 7 3 4 0.0 0.0 1 10 0 0 0 0 0 1 0 0 0 0 0 0 0 0 0 0 0 L 20-21 09/17 at Jaguars S 4 1 3 1.5 9.0 1 7 2 0 0 0 0 0 0 0 0 0 0 0 0 0 0 0 0 W 17-9 09/24 Bears S 2 1 1 0.5 0.0 0 0 1 0 0 0 0 0 0 0 0 0 0 0 0 0 0 0 0 W 41-10 2023 TOTALS 3-3 13 5 8 2.0 9.0 2 17 3 0 0 0 0 1 0 0 0 0 0 0 0 0 0 0 0 2-1
2023 GAME-BY-GAME REGULAR-SEASON STATISTICS (CHIEFS)
141 @CHIEFS
NFL REGULAR SEASON
STATISTICS RECEIVING RUSHING DATE TEAM GP GS NO. YDS. AVG. LG TD NO. YDS. AVG. LG TD 2013 Chiefs 1 0 0 0 0.0 0 0 0 0 0.0 0 0 2014 Chiefs 16 11 67 862 12.9 34 5 0 0 0.0 0 0 2015 Chiefs 16 16 72 875 12.2 42t 5 0 0 0.0 0 0 2016 Chiefs 16 15 85 1,125 13.2 80t 4 1 -5 -5.0 -5 0 2017 Chiefs 15 15 83 1,038 12.5 44 8 2 7 3.5 4 0 2018 Chiefs 16 16 103 1,336 13.0 43 10 0 0 0.0 0 0 2019 Chiefs 16 16 97 1,229 12.7 47 5 1 4 4.0 4t 1 2020 Chiefs 15 15 105 1,416 13.5 45 11 0 0 0.0 0 0 2021 Chiefs 16 16 92 1,125 12.2 69 9 2 3 1.5 4t 1 2022 Chiefs 17 17 110 1,338 12.2 52 12 2 5 2.5 4 0 2023 Chiefs 2 2 11 95 8.6 24 2 0 0 0.0 0 0 NFL TOTALS 146 139 825 10,439 12.7 80T 71 8 14 1.8 4T 2 2023
REGULAR-SEASON
(CHIEFS) RECEIVING RUSHING DATE OPPONENT P/S NO. YDS. AVG. LG TD NO. YDS. AVG. LG TD W/L SCORE 09/07 Lions INACTIVE L 20-21 09/17 at Jaguars S 4 26 6.5 9t 1 0 0 0.0 0 0 W 17-9 09/24 Bears S 7 69 9.9 24 1 0 0 0.0 0 0 W 41-10 2023 TOTALS 2-2 11 95 8.6 24 2 0 0 0.0 0 0 2-1 TRAVIS KELCE'S NFL REGULAR SEASON PASSING/RUSHING STATISTICS PASSING RUSHING DATE TEAM GP GS ATT. CMP. PCT. YDS AVG. TD INT. LG SK LST RATE NO. YDS. AVG. LG TD 2013 Chiefs 1 0 0 0 0.0 0 0.0 0 0 0 0 0 0.0 0 0 0.0 0 0 2014 Chiefs 16 11 0 0 0.0 0 0.0 0 0 0 0 0 0.0 0 0 0.0 0 0 2015 Chiefs 16 16 0 0 0.0 0 0.0 0 0 0 0 0 0.0 0 0 0.0 0 0 2016 Chiefs 16 15 0 0 0.0 0 0.0 0 0 0 0 0 0.0 1 -5 -5.0 0 0 2017 Chiefs 15 15 1 0 0.0 0 0.0 0 1 0 0 0 0.0 2 7 3.5 4 0 2018 Chiefs 16 16 0 0 0.0 0 0.0 0 0 0 0 0 0.0 0 0 0.0 0 0 2019 Chiefs 16 16 0 0 0.0 0 0.0 0 0 0 0 0 0.0 1 4 4.0 4t 1 2020 Chiefs 15 15 2 1 50.0 4 2.0 0 0 4 0 0 56.3 0 0 0.0 0 0 2021 Chiefs 16 16 0 0 0.0 0 0.0 0 0 0 0 0 0.0 2 3 1.5 4t 1 2022 Chiefs 17 17 0 0 0.0 0 0.0 0 0 0 0 0 0.0 2 5 2.5 4 0 2023 Chiefs 2 2 0 0 0.0 0 0.0 0 0 0 0 0 0.0 0 0 0.0 0 0 TOTALS 146 139 3 1 33.3 4 1.3 0 1 4 0 0 2.8 8 14 1.8 4T 2
TRAVIS KELCE'S
RUSHING/RECEIVING
GAME-BY-GAME
STATISTICS
PASSING RUSHING DATE OPPONENT P/S ATT CMP YDS PCT Y/A Y/C TD INT LG SK/YD RATE ATT YDS LG TD W/L SCORE 09/07 Lions INACTIVE L 20-21 09/17 at Jaguars S 0 0 0 0.0 0.0 0.0 0 0 0 0/0 0.0 0 0 0 0 W 17-9 09/24 Bears S 0 0 0 0.0 0.0 0.0 0 0 0 0/0 0.0 0 0 0 0 W 41-10 2023 TOTALS 2-2 0 0 0 0.0 0.0 0.0 0 0 0 0/0 0.0 0 0 0 0 2-1
2023 GAME-BY-GAME REGULAR-SEASON STATISTICS (CHIEFS)
2023 GAME-BY-GAME REGULAR-SEASON STATISTICS (CHIEFS)
142 @CHIEFS DARIAN KINNARD'S NFL REGULAR SEASON STATISTICS DATE TEAM GP GS 2022 Chiefs 1 0 2023 Chiefs 0 0 NFL TOTALS 1 0
DATE OPPONENT P/S W/L SCORE 09/07 Lions PRACTICE SQUAD L 20-21 09/17 at Jaguars PRACTICE SQUAD W 17-9 09/24 Bears PRACTICE SQUAD W 41-10 2023 TOTALS 0-0 2-1 PATRICK MAHOMES' NFL REGULAR SEASON PASSING STATISTICS DATE TEAM GP GS ATT. CMP. PCT. YDS AVG. TD INT. LG SK LST RATE 2017 Chiefs 1 1 35 22 62.9 284 8.1 0 1 51 2 15 76.4 2018 Chiefs 16 16 580 383 66.0 5,097 8.8 50 12 89t 26 171 113.8 2019 Chiefs 14 14 484 319 65.9 4,031 8.3 26 5 83t 17 127 105.3 2020 Chiefs 15 15 588 390 66.3 4,740 8.1 38 6 75t 22 147 108.2 2021 Chiefs 17 17 658 436 66.3 4,839 7.4 37 13 75t 28 146 98.5 2022 Chiefs 17 17 648 435 67.1 5,250 8.1 41 12 67 26 188 105.2 2023 Chiefs 3 3 113 74 65.5 803 7.1 7 2 54 1 7 99.5 TOTALS 83 83 3,106 2,059 66.3 25,044 8.1 199 51 89T 122 801 105.4
PATRICK MAHOMES' NFL REGULAR SEASON RUSHING STATISTICS
2023
GAME-BY-GAME REGULAR-SEASON STATISTICS (CHIEFS)
143 @CHIEFS
DATE TEAM NO. YDS. AVG. LG TD 2017 Chiefs 7 10 1.4 5 0 2018 Chiefs 60 272 4.5 28 2 2019 Chiefs 43 218 5.1 25 2 2020 Chiefs 62 308 5.0 24 2 2021 Chiefs 66 381 5.8 32 2 2022 Chiefs 61 358 5.9 20 4 2023 Chiefs 16 103 6.4 16 0 TOTALS 315 1,650 5.2 32 12
PASSING RUSHING DATE OPPONENT P/S ATT CMP YDS PCT Y/A Y/C TD INT LG SK/YD RATE ATT YDS LG TD W/L SCORE 09/07 Lions S 39 21 226 53.8 5.8 10.8 2 1 34 0/0 77.5 6 45 16 0 L 20-21 09/17 at Jaguars S 41 29 305 70.7 7.4 10.5 2 1 54 1/7 98.1 7 30 14 0 W 17-9 09/24 Bears S 33 24 272 72.7 8.2 11.3 3 0 37 0/0 127.3 3 28 15 0 W 41-10 2023 TOTALS 3-3 113 74 803 65.5 7.1 10.9 7 2 54 1/7 99.5 16 103 16 0 2-1 300-YARD PASSING GAMES (42): REGULAR SEASON DATE TEAM NO. YDS. AVG. LG TD 09/16/18 at Steelers 23 326 14.2 40 6 09/23/18 49ERS 24 314 13.1 42 3 10/01/18 at Broncos 28 304 10.9 35 1 10/07/18 JAGUARS 22 313 14.2 40 0 10/14/18 at Patriots 23 352 15.3 75t 4 10/21/18 BENGALS 28 358 12.8 50 4 10/28/18 BRONCOS 24 303 12.6 40 4 11/04/18 at Browns 23 375 16.3 50t 3 11/19/18 at Rams 33 478 14.5 73t 6 12/09/18 RAVENS 35 377 10.8 48 2 09/08/19 at Jaguars 25 378 15.1 68t 3 09/15/19 at Raiders 30 443 14.8 44t 4 09/22/19 RAVENS 27 374 13.9 83t 3 09/29/19 at Lions 24 315 13.1 33 0 10/06/19 COLTS 22 321 14.6 31 1 11/10/19 at Titans 36 446 12.4 63t 3 12/15/19 BRONCOS 27 340 12.6 41t 2 09/20/20 at Chargers 27 302 11.2 54t 2 09/28/20 at Ravens 31 385 12.4 49t 4 10/11/20 RAIDERS 22 340 15.5 37 2 11/01/20 JETS 31 416 13.4 41t 5 11/08/20 PANTHERS 30 372 12.4 44 4 11/22/20 at Raiders 34 348 10.2 22t 2 11/29/20 at Buccaneers 37 462 12.5 75t 3 12/06/20 BRONCOS 25 318 12.7 30 1 12/13/20 at Dolphins 24 393 16.4 44t 2 09/12/21 BROWNS 27 337 12.5 75t 3 09/19/21 at Ravens 24 343 14.3 46t 3 10/17/21 at Commanders 32 397 12.4 49 2 11/14/21 at Raiders 35 406 11.6 38t 5 12/16/21 at Chargers 31 410 13.2 69 3 09/11/22 at Cardinals 30 360 12.0 35 5 10/16/22 BILLS 25 338 13.5 42t 2 10/23/22 at 49ers 25 423 16.9 57 3 11/06/22 TITANS 43 446 10.4 33 1 11/13/22 JAGUARS 26 331 12.7 46 4 11/20/22 at Chargers 20 329 16.5 40 3 11/27/22 RAMS 27 320 11.9 39t 1 12/11/22 at Broncos 28 352 12.6 56t 3 12/18/22 at Texans 36 336 9.3 21 2 01/01/23 BRONCOS 29 328 11.3 38 3 09/17/23 at Jaguars 29 305 10.5 54 2
(5):
144 @CHIEFS
PASSING GAMES
POSTSEASON DATE TEAM NO. YDS. AVG. LG TD 01/12/20 TEXANS 23 321 14.0 48 5 01/24/21 BILLS 29 325 11.2 71 3 01/16/22 STEELERS 30 404 13.5 48t 5 01/23/22 BILLS 33 378 11.5 64t 3 01/29/23 BENGALS 29 326 11.2 29 2 TRENT MCDUFFIE'S NFL REGULAR SEASON DEFENSIVE STATISTICS TACKLES INTERCEPTIONS O. FUMB ST MISC DATE TEAM GP GS TK S A TFL YDS SK YDS QBH NO YDS LG TD PD FF FR TD YDS TK S A FF FR S A 2022 Chiefs 11 11 44 28 16 1 2 1.0 12.0 1 0 0 0 0 7 1 0 0 0 0 0 0 0 0 0 0 2023 Chiefs 3 3 16 9 7 0 0 0.0 0.0 1 0 0 0 0 1 2 0 0 0 0 0 0 0 0 0 0 NFL TOTALS 14 14 60 37 23 1 2 1.0 12.0 2 0 0 0 0 8 3 0 0 0 0 0 0 0 0 0 0 2023 GAME-BY-GAME REGULAR-SEASON STATISTICS (CHIEFS) TACKLES INTERCEPTIONS O. FUMB ST MISC DATE OPPONENT P/S TK S A SK YDS TFL YDS QBH NO YDS LG TD PD FF FR TD YDS TK S A FF FR S A W/L SCORE 09/07 Lions S 8 6 2 0.0 0.0 0 0 0 0 0 0 0 0 1 0 0 0 0 0 0 0 0 0 0 L 20-21 09/17 at Jaguars S 3 0 3 0.0 0.0 0 0 1 0 0 0 0 1 0 0 0 0 0 0 0 0 0 0 0 W 17-9 09/24 Bears S 5 3 2 0.0 0.0 0 0 0 0 0 0 0 0 1 0 0 0 0 0 0 0 0 0 0 W 41-10 2023 TOTALS 3-3 16 9 7 0.0 0.0 0 0 1 0 0 0 0 1 2 0 0 0 0 0 0 0 0 0 0 2-1
300-YARD
SKYY MOORE'S NFL REGULAR SEASON RUSHING/RECEIVING STATISTICS
145 @CHIEFS
MCKINNON'S NFL REGULAR SEASON RUSHING/RECEIVING STATISTICS RUSHING RECEIVING DATE TEAM GP GS NO. YDS. AVG. LG TD NO. YDS. AVG. LG TD 2014 Vikings 11 6 113 538 4.8 55 0 27 135 5.0 17 0 2015 Vikings 16 0 52 271 5.2 68t 2 21 173 8.2 30 1 2016 Vikings 15 7 159 539 3.4 36 2 43 255 5.9 41 2 2017 Vikings 16 1 150 570 3.8 58t 3 51 421 8.3 41 2 2018 49ers 0 0 0 0 0.0 0 0 0 0 0.0 0 0 2019 49ers 0 0 0 0 0.0 0 0 0 0 0.0 0 0 2020 49ers 16 4 81 319 3.9 55 5 33 253 7.7 26 1 2021 Chiefs 13 0 12 62 5.2 18 0 13 107 8.2 14t 1 2022 Chiefs 17 0 72 291 4.0 30 1 56 512 9.1 56t 9 2023 Chiefs 3 0 3 7 2.3 10 0 7 53 7.6 11 2 NFL TOTALS 107 18 642 2,597 4.0 68T 13 251 1,909 7.6 56T 18 JERICK MCKINNON'S NFL REGULAR SEASON RETURN STATISTICS KICKOFF RETURNS PUNT RETURNS DATE TEAM RET. YDS. AVG. LG TD NO. FC YDS. AVG. LG TD 2014 Vikings 0 0 0.0 0 0 0 0 0 0.0 0 0 2015 Vikings 1 24 24.0 24 0 0 0 0 0.0 0 0 2016 Vikings 0 0 0.0 0 0 0 0 0 0.0 0 0 2017 Vikings 12 312 26.0 39 0 0 0 0 0.0 0 0 2018 49ers 0 0 0.0 0 0 0 0 0 0.0 0 0 2019 49ers 0 0 0.0 0 0 0 0 0 0.0 0 0 2020 49ers 12 239 19.9 30 0 0 0 0 0.0 0 0 2021 Chiefs 0 0 0.0 0 0 0 0 0 0.0 0 0 2022 Chiefs 0 0 0.0 0 0 0 0 0 0.0 0 0 2023 Chiefs 0 0 0.0 0 0 0 0 0 0.0 0 0 NFL TOTALS 25 575 23.0 39 0 0 0 0 0.0 0 0 2023 GAME-BY-GAME REGULAR-SEASON STATISTICS (CHIEFS) RUSHING RECEIVING DATE OPPONENT P/S NO. YDS. AVG. LG TD NO. YDS. AVG. LG TD W/L SCORE 09/07 Lions P 0 0 0.0 0 0 1 10 10.0 10 0 L 20-21 09/17 at Jaguars P 1 -2 -2.0 -2 0 3 24 8.0 11 0 W 17-9 09/24 Bears P 2 9 4.5 10 0 3 19 6.3 10 2 W 41-10 2023 TOTALS 3-0 3 7 2.3 10 0 7 53 7.6 11 2 2-1
JERICK
RECEIVING RUSHING DATE TEAM GP GS NO. YDS. AVG. LG TD NO. YDS. AVG. LG TD 2022 Chiefs 16 3 22 250 11.4 30 0 3 24 8.0 12 0 2023 Chiefs 3 2 7 112 16.0 54 1 1 4 4.0 4 0 NFL TOTALS 19 5 29 362 12.5 54 1 4 28 7.0 12 0
146 @CHIEFS
KICKOFF RETURNS PUNT RETURNS DATE TEAM RET. YDS. AVG. LG TD NO. FC YDS. AVG. LG TD 2022 Chiefs 3 50 16.7 23 0 14 4 86 6.1 15 0 2023 Chiefs 0 0 0.0 0 0 0 0 0 0.0 0 0 NFL TOTALS 3 50 16.7 23 0 14 4 86 6.1 15 0 2023 GAME-BY-GAME REGULAR-SEASON STATISTICS (CHIEFS) RECEIVING RUSHING DATE OPPONENT P/S NO. YDS. AVG. LG TD NO. YDS. AVG. LG TD W/L SCORE 09/07 Lions S 0 0 0.0 0 0 1 4 4.0 4 0 L 20-21 09/17 at Jaguars P 3 70 23.3 54 1 0 0 0.0 0 0 W 17-9 09/24 Bears S 4 42 10.5 21 0 0 0 0.0 0 0 W 41-10 2023 TOTALS 3-2 7 112 16.0 54 1 1 4 4.0 4 0 2-1 WANYA
DATE TEAM GP GS 2023 Chiefs 0 0 NFL TOTALS 0 0 2023 GAME-BY-GAME REGULAR-SEASON STATISTICS (CHIEFS) DATE OPPONENT P/S W/L SCORE 09/07 Lions INACTIVE L 20-21 09/17 at Jaguars INACTIVE W 17-9 09/24 Bears INACTIVE W 41-10 2023 TOTALS 0-0 2-1
SKYY MOORE'S NFL REGULAR SEASON RETURN STATISTICS
MORRIS' NFL REGULAR SEASON STATISTICS
147 @CHIEFS LUCAS NIANG'S NFL REGULAR SEASON STATISTICS DATE TEAM GP GS 2020 Chiefs 0 0 2021 Chiefs 12 9 2022 Chiefs 7 0 2023 Chiefs 0 0 NFL TOTALS 19 9 2023 GAME-BY-GAME REGULAR-SEASON STATISTICS (CHIEFS) DATE OPPONENT P/S W/L SCORE 09/07 Lions INACTIVE L 20-21 09/17 at Jaguars INACTIVE W 17-9 09/24 Bears INACTIVE W 41-10 2023 TOTALS 0-0 2-1
148 @CHIEFS DERRICK NNADI'S NFL REGULAR SEASON DEFENSIVE STATISTICS TACKLES INTERCEPTIONS O. FUMB ST MISC DATE TEAM GP GS TK S A TFL YDS SK YDS QBH NO YDS LG TD PD FF FR TD YDS TK S A FF FR S A 2018 Chiefs 16 11 35 17 18 0 0 0.0 0.0 0 0 0 0 0 0 0 0 0 0 0 0 0 0 0 0 0 2019 Chiefs 16 16 48 18 30 3 3 1.0 1.0 1 1 0 0 0 1 1 0 0 0 0 0 0 0 0 0 0 2020 Chiefs 15 15 47 23 24 0 0 0.0 0.0 1 0 0 0 0 0 0 0 0 0 0 0 0 0 0 0 0 2021 Chiefs 17 10 38 21 17 2 10 3.0 10.0 5 0 0 0 0 0 0 0 0 0 0 0 0 0 0 0 0 2022 Chiefs 17 17 25 11 14 1 4 0.0 0.0 0 0 0 0 0 0 0 0 0 0 0 0 0 0 0 0 0 2023 Chiefs 3 3 9 2 7 0 0 0.0 0.0 0 0 0 0 0 1 0 0 0 0 0 0 0 0 0 0 0 NFL TOTALS 84 72 202 92 110 6 17 4.0 11.0 7 1 0 0 0 2 1 0 0 0 0 0 0 0 0 0 0 2023 GAME-BY-GAME REGULAR-SEASON STATISTICS (CHIEFS) TACKLES INTERCEPTIONS O. FUMB ST MISC DATE OPPONENT P/S TK S A SK YDS TFL YDS QBH NO YDS LG TD PD FF FR TD YDS TK S A FF FR S A W/L SCORE 09/07 Lions S 3 1 2 0.0 0.0 0 0 0 0 0 0 0 0 0 0 0 0 0 0 0 0 0 0 0 L 20-21 09/17 at Jaguars S 3 0 3 0.0 0.0 0 0 0 0 0 0 0 1 0 0 0 0 0 0 0 0 0 0 0 W 17-9 09/24 Bears S 3 1 2 0.0 0.0 0 0 0 0 0 0 0 0 0 0 0 0 0 0 0 0 0 0 0 W 41-10 2023 TOTALS 3-3 9 2 7 0.0 0.0 0 0 0 0 0 0 0 1 0 0 0 0 0 0 0 0 0 0 0 2-1 CHRIS OLADOKUN'S NFL REGULAR SEASON PASSING STATISTICS DATE TEAM GP GS ATT. CMP. PCT. YDS AVG. TD INT. LG SK LST RATE 2022 Chiefs 0 0 0 0 0.0 0 0.0 0 0 0 0 0 0.0 2023 Chiefs 0 0 0 0 0.0 0 0.0 0 0 0 0 0 0.0 TOTALS 0 0 0 0 0.0 0 0.0 0 0 0 0 0 0.0 CHRIS OLADOKUN'S NFL REGULAR SEASON RUSHING STATISTICS DATE TEAM NO. YDS. AVG. LG TD 2022 Chiefs 0 0 0.0 0 0 2023 Chiefs 0 0 0.0 0 0 TOTALS 0 0 0.0 0 0 CHRIS OLADOKUN'S NFL REGULAR SEASON PASSING/RUSHING STATISTICS PASSING RUSHING DATE TEAM GP GS ATT. CMP. PCT. YDS AVG. TD INT. LG SK LST RATE NO. YDS. AVG. LG TD 2022 Chiefs 0 0 0 0 0.0 0 0.0 0 0 0 0 0 0.0 0 0 0.0 0 0 2023 Chiefs 0 0 0 0 0.0 0 0.0 0 0 0 0 0 0.0 0 0 0.0 0 0 TOTALS 0 0 0 0 0.0 0 0.0 0 0 0 0 0 0.0 0 0 0.0 0 0
2023 GAME-BY-GAME REGULAR-SEASON STATISTICS (CHIEFS)
2023 GAME-BY-GAME REGULAR-SEASON STATISTICS (CHIEFS)
149 @CHIEFS
PASSING RUSHING DATE OPPONENT P/S ATT CMP YDS PCT Y/A Y/C TD INT LG SK/YD RATE ATT YDS LG TD W/L SCORE 09/07 Lions PRACTICE SQUAD L 20-21 09/17 at Jaguars PRACTICE SQUAD W 17-9 09/24 Bears PRACTICE SQUAD W 41-10 2023 TOTALS 0-0 0 0 0 0.0 0.0 0.0 0 0 0 0/0 0.0 0 0 0 0 2-1
RUSHING RECEIVING DATE TEAM GP GS NO. YDS. AVG. LG TD NO. YDS. AVG. LG TD 2022 Chiefs 17 11 170 830 4.9 31 5 13 130 10.0 32 0 2023 Chiefs 3 2 35 155 4.4 31 1 7 47 6.7 10 0 NFL TOTALS 20 13 205 985 4.8 31 6 20 177 8.9 32 0
ISIAH PACHECO'S NFL REGULAR SEASON RUSHING/RECEIVING STATISTICS
KICKOFF RETURNS PUNT RETURNS DATE TEAM RET. YDS. AVG. LG TD NO. FC YDS. AVG. LG TD 2022 Chiefs 29 597 20.6 48 0 0 0 0 0.0 0 0 2023 Chiefs 0 0 0.0 0 0 0 0 0 0.0 0 0 NFL TOTALS 29 597 20.6 48 0 0 0 0 0.0 0 0
ISIAH PACHECO'S NFL REGULAR SEASON RETURN STATISTICS
RUSHING RECEIVING DATE OPPONENT P/S NO. YDS. AVG. LG TD NO. YDS. AVG. LG TD W/L SCORE 09/07 Lions P 8 23 2.9 7 0 4 31 7.8 10 0 L 20-21 09/17 at Jaguars S 12 70 5.8 31 0 1 0 0.0 0 0 W 17-9 09/24 Bears S 15 62 4.1 18 1 2 16 8.0 9 0 W 41-10 2023 TOTALS 3-2 35 155 4.4 31 1 7 47 6.7 10 0 2-1
150 @CHIEFS LA'MICAL PERINE'S NFL REGULAR SEASON RUSHING/RECEIVING STATISTICS RUSHING RECEIVING DATE TEAM GP GS NO. YDS. AVG. LG TD NO. YDS. AVG. LG TD 2020 Jets 10 0 64 232 3.6 20 2 11 63 5.7 14 0 2021 Jets 4 0 8 31 3.9 14 0 0 0 0.0 0 0 2022 Dolphins 0 0 0 0 0.0 0 0 0 0 0.0 0 0 2023 Chiefs 0 0 0 0 0.0 0 0 0 0 0.0 0 0 NFL TOTALS 14 0 72 263 3.7 20 2 11 63 5.7 14 0 LA'MICAL PERINE'S NFL REGULAR SEASON RETURN STATISTICS KICKOFF RETURNS PUNT RETURNS DATE TEAM RET. YDS. AVG. LG TD NO. FC YDS. AVG. LG TD 2020 Jets 2 22 11.0 18 0 0 0 0 0.0 0 0 2021 Jets 0 0 0.0 0 0 0 0 0 0.0 0 0 2022 Dolphins 0 0 0.0 0 0 0 0 0 0.0 0 0 2023 Chiefs 0 0 0.0 0 0 0 0 0 0.0 0 0 NFL TOTALS 2 22 11.0 18 0 0 0 0 0.0 0 0 2023 GAME-BY-GAME REGULAR-SEASON STATISTICS (CHIEFS) RUSHING RECEIVING DATE OPPONENT P/S NO. YDS. AVG. LG TD NO. YDS. AVG. LG TD W/L SCORE 09/07 Lions PRACTICE SQUAD L 20-21 09/17 at Jaguars PRACTICE SQUAD W 17-9 09/24 Bears PRACTICE SQUAD W 41-10 2023 TOTALS 0-0 0 0 0.0 0 0 0 0 0.0 0 0 2-1
2023 GAME-BY-GAME REGULAR-SEASON STATISTICS (CHIEFS)
151 @CHIEFS
RECEIVING RUSHING DATE TEAM GP GS NO. YDS. AVG. LG TD NO. YDS. AVG. LG TD 2021 Chiefs 0 0 0 0 0.0 0 0 0 0 0.0 0 0 2022 Chiefs 3 0 0 0 0.0 0 0 0 0 0.0 0 0 2023 Chiefs 0 0 0 0 0.0 0 0 0 0 0.0 0 0 NFL TOTALS 3 0 0 0 0.0 0 0 0 0 0.0 0 0
CORNELL POWELL'S NFL REGULAR SEASON RUSHING/RECEIVING STATISTICS
KICKOFF RETURNS PUNT RETURNS DATE TEAM RET. YDS. AVG. LG TD NO. FC YDS. AVG. LG TD 2021 Chiefs 0 0 0.0 0 0 0 0 0 0.0 0 0 2022 Chiefs 0 0 0.0 0 0 0 0 0 0.0 0 0 2023 Chiefs 0 0 0.0 0 0 0 0 0 0.0 0 0 NFL TOTALS 0 0 0.0 0 0 0 0 0 0.0 0 0
CORNELL POWELL'S NFL REGULAR SEASON RETURN STATISTICS
RECEIVING RUSHING DATE OPPONENT P/S NO. YDS. AVG. LG TD NO. YDS. AVG. LG TD W/L SCORE 09/07 Lions PRACTICE SQUAD L 20-21 09/17 at Jaguars PRACTICE SQUAD W 17-9 09/24 Bears PRACTICE SQUAD W 41-10 2023 TOTALS 0-0 0 0 0.0 0 0 0 0 0.0 0 0 2-1
152 @CHIEFS DENERIC PRINCE'S NFL REGULAR SEASON RUSHING/RECEIVING STATISTICS RUSHING RECEIVING DATE TEAM GP GS NO. YDS. AVG. LG TD NO. YDS. AVG. LG TD 2023 Chiefs 0 0 0 0 0.0 0 0 0 0 0.0 0 0 NFL TOTALS 0 0 0 0 0.0 0 0 0 0 0.0 0 0 DENERIC PRINCE'S NFL REGULAR SEASON RETURN STATISTICS KICKOFF RETURNS PUNT RETURNS DATE TEAM RET. YDS. AVG. LG TD NO. FC YDS. AVG. LG TD 2023 Chiefs 0 0 0.0 0 0 0 0 0 0.0 0 0 NFL TOTALS 0 0 0.0 0 0 0 0 0 0.0 0 0
RUSHING RECEIVING DATE OPPONENT P/S NO. YDS. AVG. LG TD NO. YDS. AVG. LG TD W/L SCORE 09/07 Lions PRACTICE SQUAD L 20-21 09/17 at Jaguars PRACTICE SQUAD W 17-9 09/24 Bears PRACTICE SQUAD W 41-10 2023 TOTALS 0-0 0 0 0.0 0 0 0 0 0.0 0 0 2-1
2023 GAME-BY-GAME REGULAR-SEASON STATISTICS (CHIEFS)
2023 GAME-BY-GAME REGULAR-SEASON STATISTICS (CHIEFS)
153 @CHIEFS
STATISTICS RECEIVING RUSHING DATE TEAM GP GS NO. YDS. AVG. LG TD NO. YDS. AVG. LG TD 2022 Jaguars 0 0 0 0 0.0 0 0 0 0 0.0 0 0 2023 Jaguars 0 0 0 0 0.0 0 0 0 0 0.0 0 0 NFL TOTALS 0 0 0 0 0.0 0 0 0 0 0.0 0 0 GERRIT PRINCE'S NFL REGULAR SEASON RETURN STATISTICS KICKOFF RETURNS PUNT RETURNS DATE TEAM RET. YDS. AVG. LG TD NO. FC YDS. AVG. LG TD 2022 Jaguars 0 0 0.0 0 0 0 0 0 0.0 0 0 2023 Jaguars 0 0 0.0 0 0 0 0 0 0.0 0 0 NFL TOTALS 0 0 0.0 0 0 0 0 0 0.0 0 0
RECEIVING RUSHING DATE OPPONENT P/S NO. YDS. AVG. LG TD NO. YDS. AVG. LG TD W/L SCORE 09/10 at Colts NOT ON ROSTER W 31-21 09/17 Chiefs PRACTICE SQUAD L 9-17 09/24 Texans NOT ON ROSTER L 17-37 2023 TOTALS 0-0 0 0 0.0 0 0 0 0 0.0 0 0 1-2 JUSTIN REID'S NFL REGULAR SEASON DEFENSIVE STATISTICS TACKLES INTERCEPTIONS O. FUMB ST MISC DATE TEAM GP GS TK S A TFL YDS SK YDS QBH NO YDS LG TD PD FF FR TD YDS TK S A FF FR S A 2018 Texans 16 12 81 64 17 2 6 0.0 0.0 1 3 128 101t 1 10 1 2 0 1 7 6 1 0 0 0 0 2019 Texans 15 15 78 57 21 1 0 0.0 0.0 1 2 55 37 0 5 0 1 0 0 0 0 0 0 0 0 0 2020 Texans 13 13 81 60 21 6 27 2.0 16.0 4 0 0 0 0 4 0 0 0 0 2 2 0 0 0 0 0 2021 Texans 13 13 64 39 25 2 2 0.0 0.0 0 2 45 24 0 4 1 0 0 0 2 2 0 0 0 0 0 2022 Chiefs 17 17 81 59 22 2 11 1.0 8.0 4 0 0 0 0 7 0 0 0 0 2 0 2 0 0 0 0 2023 Chiefs 3 3 14 10 4 0 0 0.0 0.0 0 0 0 0 0 3 0 0 0 0 0 0 0 0 0 0 0 NFL TOTALS 77 73 399 289 110 13 46 3.0 24.0 10 7 228 101T 1 33 2 3 0 1 13 10 3 0 0 0 0
GERRIT PRINCE'S NFL REGULAR SEASON RUSHING/RECEIVING
2023 GAME-BY-GAME REGULAR-SEASON STATISTICS (JAGUARS)
TACKLES INTERCEPTIONS O. FUMB ST MISC DATE OPPONENT P/S TK S A SK YDS TFL YDS QBH NO YDS LG TD PD FF FR TD YDS TK S A FF FR S A W/L SCORE 09/07 Lions S 6 4 2 0.0 0.0 0 0 0 0 0 0 0 2 0 0 0 0 0 0 0 0 0 0 0 L 20-21 09/17 at Jaguars S 6 5 1 0.0 0.0 0 0 0 0 0 0 0 0 0 0 0 0 0 0 0 0 0 0 0 W 17-9 09/24 Bears S 2 1 1 0.0 0.0 0 0 0 0 0 0 0 1 0 0 0 0 0 0 0 0 0 0 0 W 41-10 2023 TOTALS 3-3 14 10 4 0.0 0.0 0 0 0 0 0 0 0 3 0 0 0 0 0 0 0 0 0 0 0 2-1
154 @CHIEFS AUSTIN REITER'S NFL REGULAR SEASON STATISTICS DATE TEAM GP GS 2015 Redskins 0 0 2016 Redskins 0 0 Went from Washington to Cleveland 2016 Browns 1 1 2016 TOTAL 1 1 2017 Browns 16 0 2018 Chiefs 11 4 2019 Chiefs 16 16 2020 Chiefs 15 12 2021 Saints 0 0 Went from New Orleans to Miami. 2021 Dolphins 6 5 Went from Miami to L.A. Rams. 2021 Rams 0 0 2021 TOTAL 6 5 2022 Chiefs 0 0 2023 Chiefs 0 0 NFL TOTALS 65 38 2023 GAME-BY-GAME
DATE OPPONENT P/S W/L SCORE 09/07 Lions PRACTICE SQUAD L 20-21 09/17 at Jaguars PRACTICE SQUAD W 17-9 09/24 Bears PRACTICE SQUAD W 41-10 2023 TOTALS 0-0 2-1
REGULAR-SEASON STATISTICS (CHIEFS)
155 @CHIEFS RASHEE RICE'S NFL REGULAR SEASON RUSHING/RECEIVING STATISTICS RECEIVING RUSHING DATE TEAM GP GS NO. YDS. AVG. LG TD NO. YDS. AVG. LG TD 2023 Chiefs 3 0 10 108 10.8 25 1 1 -3 -3.0 -3 0 NFL TOTALS 3 0 10 108 10.8 25 1 1 -3 -3.0 0 0 RASHEE RICE'S NFL REGULAR SEASON RETURN STATISTICS KICKOFF RETURNS PUNT RETURNS DATE TEAM RET. YDS. AVG. LG TD NO. FC YDS. AVG. LG TD 2023 Chiefs 0 0 0.0 0 0 0 0 0 0.0 0 0 NFL TOTALS 0 0 0.0 0 0 0 0 0 0.0 0 0 2023
RECEIVING RUSHING DATE OPPONENT P/S NO. YDS. AVG. LG TD NO. YDS. AVG. LG TD W/L SCORE 09/07 Lions P 3 29 9.7 25 1 1 -3 -3.0 -3 0 L 20-21 09/17 at Jaguars P 2 20 10.0 15 0 0 0 0.0 0 0 W 17-9 09/24 Bears P 5 59 11.8 15 0 0 0 0.0 0 0 W 41-10 2023 TOTALS 3-0 10 108 10.8 25 1 1 -3 -3.0 -3 0 2-1
GAME-BY-GAME REGULAR-SEASON STATISTICS (CHIEFS)
2023 GAME-BY-GAME REGULAR-SEASON STATISTICS (COLTS)
156 @CHIEFS
RECEIVING RUSHING DATE TEAM GP GS NO. YDS. AVG. LG TD NO. YDS. AVG. LG TD 2022 Chiefs 0 0 0 0 0.0 0 0 0 0 0.0 0 0 2023 Chiefs 3 0 1 6 6.0 6 0 0 0 0.0 0 0 NFL TOTALS 3 0 1 6 6.0 6 0 0 0 0.0 0 0 JUSTYN ROSS' NFL REGULAR SEASON RETURN STATISTICS KICKOFF RETURNS PUNT RETURNS DATE TEAM RET. YDS. AVG. LG TD NO. FC YDS. AVG. LG TD 2022 Chiefs 0 0 0.0 0 0 0 0 0 0.0 0 0 2023 Chiefs 0 0 0.0 0 0 0 0 0 0.0 0 0 NFL TOTALS 0 0 0.0 0 0 0 0 0 0.0 0 0
RECEIVING RUSHING DATE OPPONENT P/S NO. YDS. AVG. LG TD NO. YDS. AVG. LG TD W/L SCORE 09/07 Lions P 1 6 6.0 6 0 0 0 0.0 0 0 L 20-21 09/17 at Jaguars P 0 0 0.0 0 0 0 0 0.0 0 0 W 17-9 09/24 Bears P 0 0 0.0 0 0 0 0 0.0 0 0 W 41-10 2023 TOTALS 3-0 1 6 6.0 6 0 0 0 0.0 0 0 2-1 DARIUS RUSH'S NFL REGULAR SEASON DEFENSIVE STATISTICS TACKLES INTERCEPTIONS O. FUMB ST MISC DATE TEAM GP GS TK S A TFL YDS SK YDS QBH NO YDS LG TD PD FF FR TD YDS TK S A FF FR S A 2023 Colts 0 0 0 0 0 0 0 0.0 0.0 0 0 0 0 0 0 0 0 0 0 0 0 0 0 0 0 0 NFL TOTALS 0 0 0 0 0 0 0 0.0 0.0 0 0 0 0 0 0 0 0 0 0 0 0 0 0 0 0 0
TACKLES INTERCEPTIONS O. FUMB ST MISC DATE OPPONENT P/S TK S A SK YDS TFL YDS QBH NO YDS LG TD PD FF FR TD YDS TK S A FF FR S A W/L SCORE 09/10 Jaguars NOT ON ROSTER L 21-31 09/17 at Texans NOT ON ROSTER W 31-20 09/24 at Ravens NOT ON ROSTER W 22-19+ 2023 TOTALS 0 0 0 0.0 0.0 0 0 0 0 0 0 0 0 0 0 0 0 0 0 0 0 0 0 0 2-1 + - Overtime
JUSTYN ROSS' NFL REGULAR SEASON RUSHING/RECEIVING STATISTICS
2023 GAME-BY-GAME REGULAR-SEASON STATISTICS (CHIEFS)
2023 GAME-BY-GAME
157 @CHIEFS
SMITH'S NFL REGULAR SEASON STATISTICS DATE TEAM GP GS 2015 Buccaneers 16 16 2016 Buccaneers 16 16 2017 Buccaneers 16 16 2018 Buccaneers 16 16 2019 Buccaneers 15 15 2020 Buccaneers 15 15 2021 Buccaneers 17 17 2022 Buccaneers 13 13 2023 Chiefs 3 3 NFL TOTALS 127 127
DONOVAN
STATISTICS
DATE OPPONENT P/S W/L SCORE 09/07 Lions S L 20-21 09/17 at Jaguars S W 17-9 09/24 Bears S W 41-10 2023 TOTALS 3-3 2-1
REGULAR-SEASON
(CHIEFS)
2023 GAME-BY-GAME REGULAR-SEASON STATISTICS (CHIEFS)
158 @CHIEFS
DATE TEAM GP GS 2021 Chiefs 17 17 2022 Chiefs 16 16 2023 Chiefs 3 3 NFL TOTALS 36 36 2023 GAME-BY-GAME REGULAR-SEASON STATISTICS (CHIEFS) DATE OPPONENT P/S W/L SCORE 09/07 Lions S L 20-21 09/17 at Jaguars S W 17-9 09/24 Bears S W 41-10 2023 TOTALS 3-3 2-1 L'JARIUS SNEED'S NFL REGULAR SEASON DEFENSIVE STATISTICS TACKLES INTERCEPTIONS O. FUMB ST MISC DATE TEAM GP GS TK S A TFL YDS SK YDS QBH NO YDS LG TD PD FF FR TD YDS TK S A FF FR S A 2020 Chiefs 9 6 41 31 10 2 19 2.0 19.0 3 3 42 39 0 7 0 0 0 0 0 0 0 0 0 0 0 2021 Chiefs 15 15 76 57 19 7 11 1.0 21.0 2 2 2 2 0 8 1 1 0 0 0 0 0 0 0 0 0 2022 Chiefs 17 17 108 75 33 5 11 3.5 31.0 5 3 57 26 0 11 3 1 0 5 0 0 0 0 0 0 0 2023 Chiefs 3 3 14 10 4 3 1 0.0 0.0 1 0 0 0 0 2 0 1 0 0 0 0 0 0 0 0 0 NFL TOTALS 44 41 239 173 66 17 42 6.5 71.0 11 8 101 39 0 28 4 3 0 5 0 0 0 0 0 0 0
TREY SMITH'S NFL REGULAR SEASON STATISTICS
TACKLES INTERCEPTIONS O. FUMB ST MISC DATE OPPONENT P/S TK S A SK YDS TFL YDS QBH NO YDS LG TD PD FF FR TD YDS TK S A FF FR S A W/L SCORE 09/07 Lions S 6 3 3 0.0 0.0 1 0 1 0 0 0 0 0 0 0 0 0 0 0 0 0 0 0 0 L 20-21 09/17 at Jaguars S 7 6 1 0.0 0.0 1 0 0 0 0 0 0 2 0 1 0 0 0 0 0 0 0 0 0 W 17-9 09/24 Bears S 1 1 0 0.0 0.0 1 1 0 0 0 0 0 0 0 0 0 0 0 0 0 0 0 0 0 W 41-10 2023 TOTALS 3-3 14 10 4 0.0 0.0 3 1 1 0 0 0 0 2 0 1 0 0 0 0 0 0 0 0 0 2-1
159 @CHIEFS JAWAAN TAYLOR'S NFL REGULAR SEASON STATISTICS DATE TEAM GP GS 2019 Jaguars 16 16 2020 Jaguars 16 16 2021 Jaguars 17 17 2022 Jaguars 17 17 2023 Chiefs 3 3 NFL TOTALS 69 69 2023 GAME-BY-GAME REGULAR-SEASON STATISTICS (CHIEFS) DATE OPPONENT P/S W/L SCORE 09/07 Lions S L 20-21 09/17 at Jaguars S W 17-9 09/24 Bears S W 41-10 2023 TOTALS 3-3 2-1
TAYLOR'S
DEFENSIVE STATISTICS TACKLES INTERCEPTIONS O. FUMB ST MISC DATE TEAM GP GS TK S A TFL YDS SK YDS QBH NO YDS LG TD PD FF FR TD YDS TK S A FF FR S A 2021 Panthers 17 3 37 30 7 1 5 0.0 0.0 0 0 0 0 0 3 1 0 0 0 1 1 0 0 0 0 0 2022 Panthers 17 2 28 23 5 0 0 0.0 0.0 0 0 0 0 0 3 0 0 0 0 1 1 0 0 2 0 0 2023 Panthers 0 0 0 0 0 0 0 0.0 0.0 0 0 0 0 0 0 0 0 0 0 0 0 0 0 0 0 0 NFL TOTALS 34 5 65 53 12 1 5 0.0 0.0 0 0 0 0 0 6 1 0 0 0 2 2 0 0 2 0 0
KEITH
NFL REGULAR SEASON
2023 GAME-BY-GAME REGULAR-SEASON STATISTICS (CHIEFS)
160 @CHIEFS
DATE TEAM GP GS 2016 Patriots 16 16 2017 Patriots 16 16 2018 Patriots 16 16 2019 Patriots 16 16 2020 Patriots 16 16 2021 Chiefs 17 17 2022 Chiefs 15 15 2023 Chiefs 3 3 NFL TOTALS 115 115
JOE THUNEY'S NFL REGULAR SEASON STATISTICS
DATE OPPONENT P/S W/L SCORE 09/07 Lions S L 20-21 09/17 at Jaguars S W 17-9 09/24 Bears S W 41-10 2023 TOTALS 3-3 2-1
2023 GAME-BY-GAME
161 @CHIEFS KADARIUS TONEY'S NFL REGULAR SEASON RUSHING/RECEIVING STATISTICS RECEIVING RUSHING DATE TEAM GP GS NO. YDS. AVG. LG TD NO. YDS. AVG. LG TD 2021 Giants 10 4 39 420 10.8 38 0 3 6 2.0 7 0 2022 Giants 2 1 2 0 0.0 2 0 2 23 11.5 19 0 Went from N.Y. Giants to Kansas City 2022 Chiefs 7 3 14 171 12.2 38 2 5 59 11.8 32 1 2022 TOTAL 9 4 16 171 10.7 38 2 7 82 11.7 32 1 2023 Chiefs 3 1 7 35 5.0 17 0 2 2 1.0 3 0 NFL TOTALS 22 9 62 626 10.1 38 2 12 90 7.5 32 1 KADARIUS TONEY'S NFL REGULAR SEASON RETURN STATISTICS KICKOFF RETURNS PUNT RETURNS DATE TEAM RET. YDS. AVG. LG TD NO. FC YDS. AVG. LG TD 2021 Giants 0 0 0.0 0 0 1 1 0 0.0 0 0 2022 Giants 0 0 0.0 0 0 0 0 0 0.0 0 0 Went from N.Y. Giants to Kansas City 2022 Chiefs 0 0 0.0 0 0 10 4 61 6.1 9 0 2022 TOTAL 0 0 0.0 0 0 10 4 61 6.1 9 0 2023 Chiefs 0 0 0.0 0 0 0 0 0 0.0 0 0 NFL TOTALS 0 0 0.0 0 0 11 5 61 5.5 9 0
REGULAR-SEASON STATISTICS
RECEIVING RUSHING DATE OPPONENT P/S NO. YDS. AVG. LG TD NO. YDS. AVG. LG TD W/L SCORE 09/07 Lions S 1 1 1.0 1 0 1 -1 -1.0 -1 0 L 20-21 09/17 at Jaguars P 5 35 7.0 17 0 1 3 3.0 3 0 W 17-9 09/24 Bears P 1 -1 -1.0 -1 0 0 0 0.0 0 0 W 41-10 2023 TOTALS 3-1 7 35 5.0 17 0 2 2 1.0 3 0 2-1
(CHIEFS)
162 @CHIEFS TOMMY TOWNSEND'S NFL REGULAR SEASON PUNTING STATISTICS DATE TEAM GP NO. YDS. AVG. OPP. RET. YDS. NET YDS. AVG. TB IN20 LG BK 2020 Chiefs 16 52 2,339 45.0 15 119 2,100 40.4 6 20 67 0 2021 Chiefs 16 37 1,746 47.2 17 64 1,622 43.8 3 20 68 0 2022 Chiefs 17 53 2,672 50.4 22 176 2,416 45.6 4 22 76 0 2023 Chiefs 3 10 495 49.5 3 21 474 47.4 0 5 58 0 NFL TOTALS 52 152 7,252 47.7 57 380 6,612 43.5 13 67 76 0 2023 GAME-BY-GAME REGULAR-SEASON STATISTICS (CHIEFS) DATE OPPONENT NO. YDS. AVG. OPP. RET. YDS. NET YDS. AVG TB IN20 LG BK W/L SCORE 09/07 Lions P 5 247 49.4 1 16 231 46.2 0 3 58 0 L 20-21 09/17 at Jaguars P 4 193 48.3 2 5 188 47.0 0 1 58 0 W 17-9 09/24 Bears P 1 55 55.0 0 0 55 55.0 0 1 55 0 W 41-10 2023 TOTALS 3 10 495 49.5 3 21 474 47.4 0 5 58 0 2-1
163 @CHIEFS DRUE TRANQUILL'S NFL REGULAR SEASON DEFENSIVE STATISTICS TACKLES INTERCEPTIONS O. FUMB ST MISC DATE TEAM GP GS TK S A TFL YDS SK YDS QBH NO YDS LG TD PD FF FR TD YDS TK S A FF FR S A 2019 Chargers 15 3 64 50 14 4 10 0.0 0.0 0 0 0 0 0 1 0 0 0 0 11 11 0 0 0 0 0 2020 Chargers 1 1 1 1 0 0 0 0.0 0.0 0 0 0 0 0 0 0 0 0 0 0 0 0 0 0 0 0 2021 Chargers 14 7 70 42 28 5 22 1.5 14.0 3 0 0 0 0 1 0 1 0 0 6 3 3 0 0 0 0 2022 Chargers 17 16 143 92 51 9 34 5.0 27.0 8 1 20 20 0 4 1 0 0 0 2 2 0 0 0 0 0 2023 Chiefs 3 1 15 9 6 0 0 0.5 0.0 1 0 0 0 0 0 0 0 0 0 0 0 0 0 0 0 0 NFL TOTALS 50 28 293 194 99 18 66 7.0 41.0 12 1 20 20 0 6 1 1 0 0 19 16 3 0 0 0 0
TACKLES INTERCEPTIONS O. FUMB ST MISC DATE OPPONENT P/S TK S A SK YDS TFL YDS QBH NO YDS LG TD PD FF FR TD YDS TK S A FF FR S A W/L SCORE 09/07 Lions P 2 1 1 0.0 0.0 0 0 0 0 0 0 0 0 0 0 0 0 0 0 0 0 0 0 0 L 20-21 09/17 at Jaguars P 5 4 1 0.0 0.0 0 0 0 0 0 0 0 0 0 0 0 0 0 0 0 0 0 0 0 W 17-9 09/24 Bears S 8 4 4 0.5 0.0 0 0 1 0 0 0 0 0 0 0 0 0 0 0 0 0 0 0 0 W 41-10 2023 TOTALS 3-1 15 9 6 0.5 0.0 0 0 1 0 0 0 0 0 0 0 0 0 0 0 0 0 0 0 0 2-1 MARQUEZ VALDES-SCANTLING'S NFL REGULAR SEASON RUSHING/RECEIVING STATISTICS RECEIVING RUSHING DATE TEAM GP GS NO. YDS. AVG. LG TD NO. YDS. AVG. LG TD 2018 Packers 16 10 38 581 15.3 60 2 2 29 14.5 21 0 2019 Packers 16 10 26 452 17.4 74t 2 2 9 4.5 9 0 2020 Packers 16 12 33 690 20.9 78t 6 4 13 3.3 9 0 2021 Packers 11 7 26 430 16.5 75t 3 0 0 0.0 0 0 2022 Chiefs 17 11 42 687 16.4 57 2 1 -3 -3.0 -3 0 2023 Chiefs 3 3 5 98 19.6 37 0 0 0 0.0 0 0 NFL TOTALS 79 53 170 2,938 17.3 78T 15 9 48 5.3 21 0 MARQUEZ VALDES-SCANTLING'S NFL REGULAR SEASON RETURN STATISTICS KICKOFF RETURNS PUNT RETURNS DATE TEAM RET. YDS. AVG. LG TD NO. FC YDS. AVG. LG TD 2018 Packers 1 21 21.0 21 0 0 0 0 0.0 0 0 2019 Packers 0 0 0.0 0 0 0 0 0 0.0 0 0 2020 Packers 0 0 0.0 0 0 0 0 0 0.0 0 0 2021 Packers 0 0 0.0 0 0 0 0 0 0.0 0 0 2022 Chiefs 0 0 0.0 0 0 0 0 0 0.0 0 0 2023 Chiefs 0 0 0.0 0 0 0 0 0 0.0 0 0 NFL TOTALS 1 21 21.0 21 0 0 0 0 0.0 0 0
2023 GAME-BY-GAME REGULAR-SEASON STATISTICS (CHIEFS)
164 @CHIEFS
RECEIVING RUSHING DATE OPPONENT P/S NO. YDS. AVG. LG TD NO. YDS. AVG. LG TD W/L SCORE 09/07 Lions S 2 48 24.0 34 0 0 0 0.0 0 0 L 20-21 09/17 at Jaguars S 2 13 6.5 8 0 0 0 0.0 0 0 W 17-9 09/24 Bears S 1 37 37.0 37 0 0 0 0.0 0 0 W 41-10 2023 TOTALS 3-3 5 98 19.6 37 0 0 0 0.0 0 0 2-1 PRINCE TEGA WANOGHO'S NFL REGULAR SEASON STATISTICS DATE TEAM GP GS 2020 Eagles 1 0 2021 Chiefs 2 0 2022 Chiefs 17 0 2023 Chiefs 3 0 NFL TOTALS 23 0 2023
REGULAR-SEASON STATISTICS
DATE OPPONENT P/S W/L SCORE 09/07 Lions P L 20-21 09/17 at Jaguars P W 17-9 09/24 Bears P W 41-10 2023 TOTALS 3-0 2-1
2023 GAME-BY-GAME REGULAR-SEASON STATISTICS (CHIEFS)
GAME-BY-GAME
(CHIEFS)
165 @CHIEFS
RECEIVING RUSHING DATE TEAM GP GS NO. YDS. AVG. LG TD NO. YDS. AVG. LG TD 2022 Broncos 15 1 4 2 0.5 4 0 5 30 6.0 19 0 2023 Chiefs 1 0 0 0 0.0 0 0 0 0 0.0 0 0 NFL TOTALS 16 1 4 2 0.5 4 0 5 30 6.0 19 0 MONTRELL WASHINGTON'S NFL REGULAR SEASON RETURN STATISTICS KICKOFF RETURNS PUNT RETURNS DATE TEAM RET. YDS. AVG. LG TD NO. FC YDS. AVG. LG TD 2022 Broncos 18 340 18.9 29 0 32 14 271 8.5 30 0 2023 Chiefs 0 0 0.0 0 0 3 1 33 11.0 23 0 NFL TOTALS 18 340 18.9 29 0 35 15 304 8.7 30 0
RECEIVING RUSHING DATE OPPONENT P/S NO. YDS. AVG. LG TD NO. YDS. AVG. LG TD W/L SCORE 09/07 Lions PRACTICE SQUAD L 20-21 09/17 at Jaguars PRACTICE SQUAD W 17-9 09/24 Bears PRACTICE SQUAD W 41-10 2023 TOTALS 0-0 0 0 0.0 0 0 0 0 0.0 0 0 2-1
MONTRELL WASHINGTON'S NFL REGULAR SEASON RUSHING/RECEIVING STATISTICS
2023 GAME-BY-GAME REGULAR-SEASON STATISTICS (CHIEFS)
TACKLES INTERCEPTIONS O. FUMB ST MISC DATE TEAM GP GS TK S A TFL YDS SK YDS QBH NO YDS LG TD PD FF FR TD YDS TK S A FF FR S A 2022 Chiefs 16 6 46 37 9 3 4 0.0 0.0 0 1 99 99t 1 6 0 0 0 0 3 0 3 0 0 0 0 2023 Chiefs 3 0 3 3 0 0 0 0.0 0.0 0 0 0 0 0 0 0 0 0 0 0 0 0 0 0 0 0 NFL TOTALS 19 6 49 40 9 3 4 0.0 0.0 0 1 99 99T 1 6 0 0 0 0 3 0 3 0 0 0 0
GAME-BY-GAME REGULAR-SEASON STATISTICS (CHIEFS) TACKLES INTERCEPTIONS O. FUMB ST MISC DATE OPPONENT P/S TK S A SK YDS TFL YDS QBH NO YDS LG TD PD FF FR TD YDS TK S A FF FR S A W/L SCORE 09/07 Lions P 0 0 0 0.0 0.0 0 0 0 0 0 0 0 0 0 0 0 0 0 0 0 0 0 0 0 L 20-21 09/17 at Jaguars P 2 2 0 0.0 0.0 0 0 0 0 0 0 0 0 0 0 0 0 0 0 0 0 0 0 0 W 17-9 09/24 Bears P 1 1 0 0.0 0.0 0 0 0 0 0 0 0 0 0 0 0 0 0 0 0 0 0 0 0 W 41-10 2023 TOTALS 3-0 3 3 0 0.0 0.0 0 0 0 0 0 0 0 0 0 0 0 0 0 0 0 0 0 0 0 2-1
JAYLEN WATSON'S NFL
REGULAR SEASON DEFENSIVE STATISTICS
2023
2023 GAME-BY-GAME REGULAR-SEASON STATISTICS (CHIEFS)
166 @CHIEFS JUSTIN WATSON'S NFL REGULAR SEASON RUSHING/RECEIVING STATISTICS RECEIVING RUSHING DATE TEAM GP GS NO. YDS. AVG. LG TD NO. YDS. AVG. LG TD 2018 Buccaneers 12 0 1 5 5.0 5 0 0 0 0.0 0 0 2019 Buccaneers 16 2 15 159 10.6 17t 2 0 0 0.0 0 0 2020 Buccaneers 11 2 7 94 13.4 36 0 0 0 0.0 0 0 2021 Buccaneers 1 0 0 0 0.0 0 0 0 0 0.0 0 0 2022 Chiefs 17 5 15 315 21.0 67 2 0 0 0.0 0 0 2023 Chiefs 3 1 7 158 22.6 37 0 0 0 0.0 0 0 NFL TOTALS 60 10 45 731 16.2 67 4 0 0 0.0 0 0 JUSTIN WATSON'S NFL REGULAR SEASON RETURN STATISTICS KICKOFF RETURNS PUNT RETURNS DATE TEAM RET. YDS. AVG. LG TD NO. FC YDS. AVG. LG TD 2018 Buccaneers 0 0 0.0 0 0 0 0 0 0.0 0 0 2019 Buccaneers 0 0 0.0 0 0 2 5 3 1.5 7 0 2020 Buccaneers 2 19 9.5 13 0 0 0 0 0.0 0 0 2021 Buccaneers 0 0 0.0 0 0 0 0 0 0.0 0 0 2022 Chiefs 0 0 0.0 0 0 5 3 39 7.8 17 0 2023 Chiefs 0 0 0.0 0 0 0 0 0 0.0 0 0 NFL TOTALS 2 19 9.5 13 0 7 8 42 6.0 17 0
RECEIVING RUSHING DATE OPPONENT P/S NO. YDS. AVG. LG TD NO. YDS. AVG. LG TD W/L SCORE 09/07 Lions P 2 45 22.5 26 0 0 0 0.0 0 0 L 20-21 09/17 at Jaguars S 3 62 20.7 34 0 0 0 0.0 0 0 W 17-9 09/24 Bears P 2 51 25.5 37 0 0 0 0.0 0 0 W 41-10 2023 TOTALS 3-1 7 158 22.6 37 0 0 0 0.0 0 0 2-1
167 @CHIEFS TERSHAWN WHARTON'S NFL REGULAR SEASON DEFENSIVE STATISTICS TACKLES INTERCEPTIONS O. FUMB ST MISC DATE TEAM GP GS TK S A TFL YDS SK YDS QBH NO YDS LG TD PD FF FR TD YDS TK S A FF FR S A 2020 Chiefs 16 1 27 14 13 4 13 2.0 13.0 4 0 0 0 0 0 1 1 0 -3 0 0 0 0 0 0 0 2021 Chiefs 17 1 29 13 16 0 0 2.0 18.0 2 1 0 0 0 1 2 0 0 0 0 0 0 0 0 0 0 2022 Chiefs 5 0 8 4 4 1 8 1.0 8.0 4 0 0 0 0 0 0 0 0 0 0 0 0 0 0 0 0 2023 Chiefs 3 1 1 1 0 0 0 0.0 0.0 0 0 0 0 0 0 0 0 0 0 0 0 0 0 0 0 0 NFL TOTALS 41 3 65 32 33 5 21 5.0 39.0 10 1 0 0 0 1 3 1 0 -3 0 0 0 0 0 0 0 2023 GAME-BY-GAME REGULAR-SEASON STATISTICS (CHIEFS) TACKLES INTERCEPTIONS O. FUMB ST MISC DATE OPPONENT P/S TK S A SK YDS TFL YDS QBH NO YDS LG TD PD FF FR TD YDS TK S A FF FR S A W/L SCORE 09/07 Lions S 0 0 0 0.0 0.0 0 0 0 0 0 0 0 0 0 0 0 0 0 0 0 0 0 0 0 L 20-21 09/17 at Jaguars P 0 0 0 0.0 0.0 0 0 0 0 0 0 0 0 0 0 0 0 0 0 0 0 0 0 0 W 17-9 09/24 Bears P 1 1 0 0.0 0.0 0 0 0 0 0 0 0 0 0 0 0 0 0 0 0 0 0 0 0 W 41-10 2023 TOTALS 3-1 1 1 0 0.0 0.0 0 0 0 0 0 0 0 0 0 0 0 0 0 0 0 0 0 0 0 2-1
TACKLES INTERCEPTIONS O. FUMB ST MISC DATE TEAM GP GS TK S A TFL YDS SK YDS QBH NO YDS LG TD PD FF FR TD YDS TK S A FF FR S A 2022 Chiefs 17 4 39 28 11 1 2 0.0 0.0 0 1 7 7 0 7 0 0 0 0 1 1 0 0 0 0 0 2023 Chiefs 3 1 5 5 0 0 0 0.0 0.0 0 0 0 0 0 1 0 0 0 0 0 0 0 0 0 0 0 NFL TOTALS 20 5 44 33 11 1 2 0.0 0.0 0 1 7 7 0 8 0 0 0 0 1 1 0 0 0 0 0
JOSHUA WILLIAMS' NFL REGULAR SEASON DEFENSIVE STATISTICS
2023 GAME-BY-GAME REGULAR-SEASON STATISTICS
JAMES WINCHESTER'S NFL REGULAR SEASON STATISTICS
168 @CHIEFS
(CHIEFS) TACKLES INTERCEPTIONS O. FUMB ST MISC DATE OPPONENT P/S TK S A SK YDS TFL YDS QBH NO YDS LG TD PD FF FR TD YDS TK S A FF FR S A W/L SCORE 09/07 Lions P 2 2 0 0.0 0.0 0 0 0 0 0 0 0 0 0 0 0 0 0 0 0 0 0 0 0 L 20-21 09/17 at Jaguars S 1 1 0 0.0 0.0 0 0 0 0 0 0 0 0 0 0 0 0 0 0 0 0 0 0 0 W 17-9 09/24 Bears P 2 2 0 0.0 0.0 0 0 0 0 0 0 0 1 0 0 0 0 0 0 0 0 0 0 0 W 41-10 2023 TOTALS 3-1 5 5 0 0.0 0.0 0 0 0 0 0 0 0 1 0 0 0 0 0 0 0 0 0 0 0 2-1
DATE TEAM GP 2015 Chiefs 16 2016 Chiefs 16 2017 Chiefs 16 2018 Chiefs 16 2019 Chiefs 16 2020 Chiefs 16 2021 Chiefs 17 2022 Chiefs 17 2023 Chiefs 3 NFL TOTALS 133
DATE OPPONENT W/L SCORE 09/07 Lions P L 20-21 09/17 at Jaguars P W 17-9 09/24 Bears P W 41-10 2023 TOTALS 3 2-1
2023 GAME-BY-GAME REGULAR-SEASON STATISTICS (CHIEFS)
RECORDS
Most
Most
Most Consecutive Games Played, Career
224 Will Shields (Sept. 5, 1993 - Dec. 31, 2006)
186 Jan Stenerud (Sept. 9, 1967 - Dec. 16, 1979)
184 Dustin Colquitt (Nov. 9, 2008 - Dec. 29, 2019)
180 Jim Tyrer (Sept. 10, 1961 - Dec. 2, 1973)
168 Bobby Bell (Sept. 7, 1963 - Dec. 14, 1974) 166
Buchanan (Sept. 7, 1963 - Dec. 1, 1974)
Most Consecutive Games Started (Since 1968)
223 Will Shields (Sept. 12, 1993 - Dec. 31, 2006)
144 Emmitt Thomas (Sept. 28, 1968 - Oct. 15, 1978) 134
SCORING POINTS
1 @CHIEFS SERVICE
Seasons, Active Players 15 Jerrel Wilson 1963-77 15 Dustin Colquitt 2005-19 14 Len Dawson 1962-75 14 Ed Budde 1963-76 14 Nick Lowery 1980-93 14 Will Shields 1993-06 13 Jim Tyrer 1961-73 13 Buck Buchanan 1963-75 13 Emmitt Thomas 1966-78 13 Jan Stenerud 1967-79 13 Jack Rudnay 1970-82 13 John Alt 1984-96 13 Derrick Johnson 2005-17 12 Johnny Robinson 1960-71 12 Dave Hill 1963-74 12 Bobby Bell 1963-74 12 Mike Livingston 1968-79 12 Henry Marshall 1976-87 12 Tony Gonzalez 1997-08 12 Tamba Hali 2006-17
Games Played, Career (All 175+) 238 Dustin Colquitt 2005-19 224 Will Shields 1993-06 212 Nick Lowery 1980-93 203 Jerrel Wilson 1963-77 190 Tony Gonzalez 1997-08 186 Jan Stenerud 1967-79 183 Len Dawson 1962-75 183 Buck Buchanan 1963-75 182 Derrick Johnson 2005-17 181 Emmitt Thomas 1966-78 180 Jim Tyrer 1961-73 179 John Alt 1984-96 178 Jack Rudnay 1970-82 177 Ed Budde 1963-76 177 Tamba Hali 2006-17
Most
Most
Games Started, Career
223 Will Shields 1993-06 174 Tony Gonzalez 1997-08 171 Jack Rudnay 1970-82 169 Derrick Johnson 2005-17 164 Tim Grunhard 1990-00 *158 Len Dawson (*Since 1962) 1962-75 157 Derrick Thomas 1989-99 157 Tamba Hali 2006-17
(Since 1968)
Starts,
17 Creed Humphrey 2021 17 Trey Smith 2021 17 George Karlaftis 2022 16 Sylvester Hicks 1978 16 Art Still 1978 16 Dave Lutz 1983 16 Kevin Ross 1984 16 Dino Hackett 1986 16 Derrick Thomas 1989 16 Greg Wesley 2000 16 Derrick Johnson 2005 16 Tamba Hali 2006 16 Brandon Carr 2008 16 Glenn Dorsey 2008 16 Eric Berry 2010 16 Dontari Poe 2012 16 Marcus Peters 2015 16 Kareem Hunt 2017 16 Juan Thornhill 2019
Rookie, Season
Buck
Tim
Tony Gonzalez
Consecutive Games
101 Gary Barbaro 1976-82 64 Brandon Carr 2008-11 51 Art Still 1978-81 41 Tamba Hali 2006-08 37 Greg Wesley 2000-02 Most Games Started, Quarterback, Career 158 Len Dawson 1962-75 88 Trent Green 2001-06 80 Patrick Mahomes 2017-22 77 Bill Kenney 1979-88 76 Alex Smith 2013-17 Most Consecutive Games Started, Quarterback 81 Trent Green (Sept. 9, 2001 - Sept. 10, 2006) 44 Len Dawson (Oct. 31, 1965 - Nov. 3, 1968) 35 Steve DeBerg (Nov. 26, 1989 - Dec. 8, 1991) 34 Patrick Mahomes (Sept. 12, 2021 - Jan. 7, 2023) 28 Steve Bono (Sept. 3, 1995 - Nov. 24, 1996) 28 Elvis Grbac (Dec. 26, 1998 - Nov. 19, 2000) 28 Len Dawson (Sept. 8, 1962 - Nov. 8, 1963) Most Consecutive Seasons Starting Every Game, QB 5 Trent Green 2001-05 2 Len Dawson 1966-67
Jim Lynch (Sept. 9, 1968 - Nov. 6, 1977) 120
Grunhard (Sept. 5, 1993 - Oct. 29, 2000) 120
(Sept. 19, 1999 - Nov. 12, 2006) Most
Started To Begin Career
Most Points, Career (All 400+) 1,466 Nick Lowery 1980-93 1,231 Jan Stenerud 1967-79 763 Harrison Butker 2017-22 517 Ryan Succop 2009-13 500 Priest Holmes 2001-07 462 Tony Gonzalez 1997-08 442 Pete Stoyanovich 1996-00 442 Travis Kelce 2013-22 Most Seasons, 100 or More Points 11 Nick Lowery 1981, 83-86, 88-93 5 Jan Stenerud 1967-71 5 Harrison Butker 2017-21 4 Ryan Succop 2009-10, '12-13 3 Pete Stoyanovich 1997-99 3 Lawrence Tynes 2004-06 3 Cairo Santos 2014-16 2 Lin Elliott 1994-95 2 Morten Andersen 2002-03 2 Priest Holmes 2002-03 2 Larry Johnson 2005-06 1 Jack Spikes 1960 1 Abner Haynes 1962 1 Todd Peterson 2001 1 Tyreek Hill 2020 Most Points, Season (All 125+) 162 Priest Holmes 2003 147 Harrison Butker 2019 144 Priest Holmes 2002 142 Harrison Butker 2017 139 Nick Lowery 1990 137 Harrison Butker 2018 129 Jan Stenerud 1968 129 Cairo Santos 2015 129 Cairo Santos 2016 126 Larry Johnson 2005 125 Lawrence Tynes 2005 Most Points, Non-Kickers, Rookie, Season 72 Abner Haynes 1960 72 Tyreek Hill 2016 66 Billy Jackson 1981 66 Kareem Hunt 2017 48 Johnny Robinson 1960 48 Mike Garrett 1966
TOUCHDOWNS
POINTS AFTER TOUCHDOWNS
FIELD GOALS
2 @CHIEFS
Points,
Season 142 Harrison Butker 2017 113 Cairo Santos 2014 108 Jan Stenerud 1967 104 Jack Spikes 1960 104 Ryan Succop 2009 Most Points, Game 30 Abner Haynes vs. Oakland Nov. 26, 1961 30 Jamaal Charles at Oakland Dec. 15, 2013 24 Frank Jackson vs. Denver Dec. 10, 1961 24 Abner Haynes vs. Boston Sept. 8, 1962 24 Frank Jackson at San Diego Dec. 13, 1964 24 Bert Coan at Denver Oct. 23, 1966 24 Priest Holmes at Cleveland Sept. 8, 2002 24 Priest Holmes vs. Atlanta Oct. 24, 2004 24 Derrick Blaylock vs. Atlanta Oct. 24, 2004 24 Larry Johnson vs. Seattle Oct. 29, 2006 24 Travis Kelce vs. Las Vegas Oct. 10, 2022
Most
Kickers, Rookie,
Most Touchdowns, Career 83 Priest Holmes (76 rush, 7 rec.) 2001-07 76 Tony Gonzalez (0 rush, 76 rec.) 1997-08 72 Travis Kelce (69 rec., 2 rush, 1 fum.) 2013-22 67 Tyreek Hill (6 rush, 56 rec. 1 KR, 4 PR) 2016-21 64 Jamaal Charles (43 rush, 20 rec., 1 KR) 2008-16 61 Larry Johnson (55 rush, 6 rec.) 2003-09 60 Otis Taylor (3 rush, 57 rec.) 1965-75 Most Touchdowns, Season 27 Priest Holmes (27 rush, 0 rec.) 2003 24 Priest Holmes (21 rush, 3 rec.) 2002 21 Larry Johnson (20 rush, 1 rec) 2005 19 Abner Haynes (13 rush, 6 rec.) 1962 19 Larry Johnson (17 rush, 2 rec.) 2006 19 Jamaal Charles (12 rush, 7 rec.) 2013 Most Touchdowns, Rookie, Season 12 Abner Haynes (9 rush, 3 rec.) 1960 12 Tyreek Hill (3 rush, 6 rec., 2 PR, 1 KR) 2016 11 Billy Jackson (10 rush, 1 rec.) 1981 11 Kareem Hunt (8 rush, 3 rec.) 2017
Johnny Robinson (4 rush, 4 rec.) 1960 8 Mike Garrett (6 rush, 1 rec., 1 PR) 1966 Most Touchdowns, Game 5 Abner Haynes vs. Oakland Nov. 26, 1961 5 Jamaal Charles at Oakland Dec. 15, 2013 4 Frank Jackson vs. Denver Dec. 10, 1961 4 Abner Haynes vs. Boston Sept. 8, 1962 4 Frank Jackson at San Diego Dec. 13, 1964 4 Bert Coan at Denver Oct. 23, 1966 4 Priest Holmes at Cleveland Sept. 8, 2002 4 Priest Holmes vs. Atlanta Oct. 24, 2004 4 Derrick Blaylock vs. Atlanta Oct. 24, 2004 4 Larry Johnson vs. Seattle Oct. 29, 2006 4 Travis Kelce vs. Las Vegas Oct. 10, 2022 3 46 times; Last, Travis Kelce at Los Angeles Chargers Nov. 21, 2022 Most Consecutive Games Scoring Touchdowns 11 Priest Holmes 2002 9 Larry Johnson 2006 8 Priest Holmes 2003-04 8 Larry Johnson 2004-05 8 Kareem Hunt 2018 7 Marcus Allen 1993 7 Priest Holmes 2004-05 7 Larry Johnson 2005 7 Dwayne Bowe 2010 7 Jamaal Charles 2013
Most Points After TD Attempted, Career 483 Nick Lowery 1980-93 409 Jan Stenerud 1967-79 289 Harrison Butker 2017-22 164 Pete Stoyanovich 1996-00 160 Ryan Succop 2009-13 149 Tommy Brooker 1962-66 Most Points After TD Attempted, Season 69 Harrison Butker 2018 60 Lawrence Tynes 2004 59 Morten Andersen 2003 54 Harrison Butker 2020 52 Ryan Succop 2013 51 Morten Andersen 2002 Most Points After TD Attempted, Game 8 Tommy Brooker at Denver Sept. 7, 1963 8 Mike Mercer at Denver Oct. 23, 1966 8 Lawrence Tynes vs. Atlanta Oct. 24, 2004 8 Ryan Succop at Oakland Dec. 15, 2013 Most Points After TD Made, Career 479 Nick Lowery 1980-93 394 Jan Stenerud 1967-79 271 Harrison Butker 2017-22 163 Pete Stoyanovich 1996-00 160 Ryan Succop 2009-13 149 Tommy Brooker 1962-66 Most Points After TD Made, Season 65 Harrison Butker 2018 58 Morten Andersen 2003 58 Lawrence Tynes 2004 52 Ryan Succop 2013 51 Morten Andersen 2002 Most Points After TD Made, Game 8 Tommy Brooker at Denver Sept. 7, 1963 8 Mike Mercer at Denver Oct. 23, 1966 8 Lawrence Tynes vs. Atlanta Oct. 24, 2004 8 Ryan Succop at Oakland Dec. 15, 2013 7 Cotton Davidson vs. Denver Dec.10, 1961 7 T. Brooker at N.Y. Titans Nov. 11, 1962 7 Jack Spikes vs. Denver Dec. 8, 1963 7 Tommy Brooker vs. Houston Nov. 28, 1965 7 Morten Andersen vs. Arizona Dec. 1, 2002 7 Morten Andersen vs. St. Louis Dec. 8, 2002 7 Lawrence Tynes at Tennessee Dec. 13, 2004 Most Consecutive Points After TD 197 Nick Lowery 1983-89 160 Ryan Succop 2009-13 155 Jan Stenerud 1968-73 149 Tommy Brooker 1962-66 Highest Point After Percentage, Career (100 PATs) 100.00 Ryan Succop (160-160) 2009-13 100.00 Tommy Brooker (149-149) 1962-66 99.39 Pete Stoyanovich (163-164) 1996-00 99.17 Nick Lowery (479-483) 1980-93 99.09 Morten Andersen (109-110) 2002-03 97.16 Lawrence Tynes (137-141) 2004-06
8
Most Field Goals Attempted, Career 436 Jan Stenerud 1967-79 410 Nick Lowery 1980-93 186 Harrison Butker 2017-22 147 Ryan Succop 2009-13 115 Pete Stoyanovich 1996-00 105 Cairo Santos 2014-17 Most Field Goals Attempted, Season 44 Jan Stenerud 1971 42 Jan Stenerud 1970 42 Harrison Butker 2017 40 Jan Stenerud 1968 Most Field Goals Attempted, Game 7 Cairo Santos at Cincinnati October 4, 2015 7 Jan Stenerud vs. Buffalo Dec. 19, 1971 6 Tommy Brooker vs. San Diego Dec. 16, 1962 6 Jan Stenerud 6 times Last; at Washington Oct. 10, 1976 6 Todd Peterson vs. Denver Dec. 16, 2001 6 Ryan Succop at New Orleans Sept. 23, 2012 6 Harrison Butker vs. Miami Dec. 24, 2017 Most Seasons Leading League, Field Goals Made 3 Jan Stenerud 1967, 70, 75 Most Field Goals Made, Career 329 Nick Lowery 1980-93 279 Jan Stenerud 1967-79 164 Harrison Butker 2017-22 119 Ryan Succop 2009-13 93 Pete Stoyanovich 1996-00 89 Cairo Santos 2014-17 Most Field Goals Made, Season 38 Harrison Butker 2017 34 Nick Lowery 1990 34 Harrison Butker 2019 31 Cairo Santos 2016 30 Jan Stenerud 1968, 70
DEFENSE / SPECIAL TEAMS SCORING
Most Defensive Touchdowns, Career
8 Bobby Bell (6 INTs, 2 FRs)
5 Emmitt Thomas (5 INTs)
5 Jim Kearney (5 INTs)
5 Eric Berry (5 INTs)
4 Lloyd Burruss (4 INTs)
4 Derrick Thomas (4 FRs)
4 James Hasty (3 INTs, 1 FR)
4 Derrick Johnson (4 INTs)
4 Daniel Sorensen (4 INTs)
4 Jim Kearney (4 INTs)
3 David Webster (2 INTs, 1 FR)
3 @CHIEFS 30 Cairo Santos 2015 28 Ryan Succop 2012 Most Field Goals Made, Rookie, Season 38 Harrison Butker 2017 25 Ryan Succop 2009 25 Cairo Santos 2014 21 Jan Stenerud 1967 13 Jack Spikes 1960 12 Tommy Brooker 1962 Most Field Goals Made, Game 7 Cairo Santos at Cincinnati Oct. 5, 2015 6 Ryan Succop at New Orleans Sept. 23, 2012 5 Jan Stenerud 3 times Last; vs. Buffalo Dec. 19, 1971 5 Nick Lowery 4 times Last; vs. Denver Sept. 20, 1993 5 Ryan Succop vs. Minnesota Oct. 2, 2011 5 Cairo Santos at Denver Nov. 15, 2015 5 Harrison Butker 4 times Last; vs. Denver Dec. 6, 2020 4 Tommy Brooker vs. San Diego Dec. 16, 1962 4 Mike Mercer at N.Y. Jets Nov. 27, 1966 4 Lin Elliott vs. Seattle Dec. 24, 1995 4 Jan Stenerud 10 times 4 Nick Lowery 8 times 4 Pete Stoyanovich 2 times 4 Todd Peterson vs. Denver Dec. 16, 2001 4 Lawrence Tynes 2 times Last; vs. Denver Nov. 23, 2006 4 Nick Novak vs. Denver Sept. 28, 2008 4 Ryan Succop 4 times Last; at Tennessee Oct. 6, 2013 4 Cairo Santos 5 times Last; at Carolina Nov. 13, 2016 4 Harrison Butker 6 times Last; vs. Los Angeles Rams Nov. 27, 2022 Most Consecutive Games Scoring Field Goals 16 Harrison Butker 2019-20 15 Lawrence Tynes 2004-05 14 Jan Stenerud 1970 14 Harrison Butker 2017-18 14 Harrison Butker 2021-22 12 Pete Stoyanovich 1997-98 11 Jan Stenerud 1968-69 11 Jan Stenerud 1971-72 11 Nick Lowery 1985-86 11 Morten Andersen 2002 Most Consecutive Games Scoring Field Goals, Single Season 14 Jan Stenerud 1970 14 Harrison Butker 2019 13 Harrison Butker 2017 12 Lawrence Tynes 2005 12 Harrison Butker 2021 11 Morten Andersen 2002 Most Consecutive Field Goals Made 23 Harrison Butker 2017 22 Pete Stoyanovich 1997-98 22 Ryan Succop 2011 21 Nick Lowery 1990 21 Nick Lowery 1991 16 Jan Stenerud 1969 16 Harrison Butker 2019-20 16 Harrison Butker 2020-21 Longest Field Goal 62 Harrison Butker vs. Buffalo Oct. 16, 2022 59 Matthew Wright vs. Las Vegas Oct. 10, 2022 58 Nick Lowery at Washington Sept. 18, 1983 58 Nick Lowery vs. L.A. Raiders Sept. 12, 1985 58 Harrison Butker at L.A. Chargers Sept. 20, 2020 58 Harrison Butker at L.A. Chargers Sept. 20, 2020 57 Nick Lowery vs. Seattle Sept. 14, 1980 Highest Field Goal Percentage, Career (100 Attempts) 88.2 Harrison Butker (164-186) 2017-22 84.8 Cairo Santos (89-105) 2014-17 81.0 Ryan Succop (119-147) 2009-13 80.9 Pete Stoyanovich (93-115) 1996-00 80.2 Nick Lowery (329-410) 1980-93 64.0 Jan Stenerud (279-436) 1967-79 Highest Field Goal Percentage, Season 96.3 Pete Stoyanovich (26-27) 1997 92.6 Harrison Butker (25-27) 2020 91.9 Nick Lowery (34-37) 1990 91.6 Nick Lowery (22-24) 1992 90.5 Harrison Butker (38-42) 2017 Highest Field Goal Percentage, Career At GEHA Field at Arrowhead 88.1 Pete Stoyanovich (52-59) 1996-00 86.7 Harrison Butker (85-98) 2017-22 85.6 Nick Lowery (179-209) 1980-93 82.4 Ryan Succop (61-74) 2009-13 79.2 Cairo Santos (38-48) 2014-17 Attempts Less Than 40 Yards, Season (15 Attempts) 23-26 Cairo Santos 2016 24-25 Harrison Butker 2017 21-21 Nick Lowery 1991 20-20 Pete Stoyanovich 1998 16-20 Ryan Succop 2012 18-19 Harrison Butker 2019 18-18 Harrison Buker 2020 17-18 Cairo Santos 2014 17-18 Cairo Santos 2015 17-17 Ryan Succop 2009 16-16 Morten Andersen 2002 16-16 Harrison Butker 2018 15-16 Ryan Succop 2013 14-15 Ryan Succop 2011 Most Field Goals, No Misses, Game 7 Cairo Santos at Cincinnati Oct. 4, 2015 6 Ryan Succop at New Orleans Sept. 23, 2012 5 Jan Stenerud at Buffalo Nov. 2, 1969 5 Jan Stenerud vs. Buffalo Dec. 7, 1969 5 Nick Lowery vs. L.A. Raiders Sept. 12, 1985 5 Nick Lowery at Chicago Dec. 29, 1990 5 Nick Lowery vs. Denver Sept. 20, 1993 5 Ryan Succop vs. Minnesota Oct. 2, 2011 5 Harrison Butker at Houston Oct. 8, 2017 5 Harrison Butker vs. Denver Oct. 30, 2017 5 Harrison Butker vs. Denver Dec. 6, 2020 Most Field Goals, 50 or More Yards, Career 23 Harrison Butker 2017-22 20 Nick Lowery 1980-93 12 Jan Stenerud 1967-79 9 Ryan Succop 2009-13 7 Cairo Santos 2014-16 Most Field Goals, 50 or More Yards, Season 7 Harrison Butker 2021 4 Nick Lowery 1980 4 Cairo Santos 2015 4 Harrison Butker 2017, 2020 3 Nick Lowery 1985, 1988 3 Ryan Succop 2011 3 Harrison Butker 2019 3 Harrison Butker 2022 2 Pete Stoyanovich 1997, 1998 2 Lawrence Tynes 2004, 2005, 2006
Ryan Succop 2009, 2012
Cairo Santos 2016
Harrison Butker 2018
Field Goals, 50 or More Yards, Game
Nick Lowery vs. Seattle Sept. 14, 1980
Nick Lowery at New Orleans Sept. 8, 1985
Nick Lowery at Detroit Nov. 26, 1987
Lawrence Tynes at Miami Oct. 21, 2005
Ryan Succop vs. Minnesota Oct. 2,
Cairo Santos at Cincinnati Oct. 4,
2
2
2
Most
2
2
2
2
2
2011 2
2015
Sept. 20, 2020
2 Harrison Butker at L.A. Chargers
1963-74
1966-78
1967-75
2010-18
1981-91
1989-99
1995-99
2005-17
2014-21
Most Defensive Touchdowns, Season
1972
1960
RUSHING YARDS
4 @CHIEFS
Lloyd Burruss (3 INTs) 1986
Charles Mincy (2 INTs, 1 FR) 1992
Mark McMillian (3 INTs) 1997
Defensive Touchdowns, Game
Jim Kearney at Denver Oct. 1, 1972
Lloyd Burruss vs. San Diego Oct. 19, 1986
Cris Dishman at Oakland Nov. 28, 1999
Derrick Johnson at Denver Jan. 3, 2010 Most Special Teams Touchdowns, Career 11 Dante Hall (5 PRs, 6 KORs) 2000-06 8 Tamarick Vanover (4 PRs, 4 KORs) 1995-99 5 Tyreek Hill (4 PRs, 1 KOR) 2016-21 4 J.T. Smith (4 PRs) 1978-84 3 Dexter McCluster (3 PRs) 2010-13 2 Six players tied Most Special Teams Touchdowns, Season 4 Dante Hall (2 PRs, 2 KRs) 2003 3 Tamarick Vanover (2 KRs, 1 PR) 1995 3 Dante Hall (2 PRs, 1 KR) 2002 3 Tyreek Hill (2 PRs, 1 KR) 2016 2 J.T. Smith (2 PRs) 1979 2 J.T. Smith (2 PRs) 1980 2 Paul Palmer (2 KRs) 1987 2 Dale Carter (2 PRs) 1992 2 Dante Hall (2 KRs) 2004 2 Dexter McCluster (2 PRs) 2013 Most Safeties, Career 3 Derrick Thomas 1989-98 2 Bill Maas 1984-92 2 Dan Saleaumua 1989-96 2 Joe Phillips 1992-97 1 Buck Buchanan 1963-75 1 Willie Lanier 1967-77 1 John Lohmeyer 1973, 75-77 1 Ed Beckman 1977-84 1 Dino Hackett 1986-92 1 Albert Lewis 1983-93 1 Rob McGovern 1989-90 1 Bernard Pollard 2006-08 1 Tamba Hali 2006-16 1 Justin Houston 2011-18 1 D.J. Alexander 2015-16 1 Chris Jones 2016-20 1 Frank Clark 2019-22 Most Safeties, Season 1 Buck Buchanan 1968 1 Willie Lanier 1974 1 John Lohmeyer 1976 1 Ed Beckman 1978 1 Dino Hackett 1988 1 Albert Lewis 1988 1 Bill Maas 1988, 90 1 Rob McGovern 1989 1 Dan Saleaumua 1991, 96 1 Derrick Thomas 1994, 97, 98 1 Joe Phillips 1997 1 Bernard Pollard 2007 1 Tamba Hali 2009 1 Justin Houston 2012 1 D.J. Alexander 2015 1 Chris Jones 2020 1 Frank Clark 2022 TWO-POINT CONVERSIONS Most Two-Point Conversions, Career 5 Travis Kelce 2013-22 3 Tony Gonzalez 1997-08 3 Patrick Mahomes 2017-22 2 Bo Dickinson 1960-61 2 Curtis McClinton 1962-69 2 Jerrel Wilson 1963-77 2 Reg Carolan 1964-68 2 Trent Green 2001-06 2 Eddie Kennison 2001-07 Most Two-Point Conversions, Season 2 Bo Dickinson 1961 2 Travis Kelce 2015 Most Two-Point Conversion Passes, Career 8 Len Dawson 1962-75 7 Patrick Mahomes 2017-22 4 Trent Green 2001-06 4 Alex Smith 2013-17 2 Randy Duncan 1961 2 Elvis Grbac 1997-00 RUSHING RUSHING ATTEMPTS Most Seasons Leading League in Rushing 1 Abner Haynes 1960 1 Christian Okoye 1989 1 Priest Holmes 2001 1 Kareem Hunt 2017 Most Rushing Attempts, Career 1,375 Larry Johnson 2003-09 1,332 Jamaal Charles 2008-16 1,321 Priest Holmes 2001-07 1,246 Christian Okoye 1987-92 1,157 Ed Podolak 1969-77 Most Rushing Attempts, Season *416 Larry Johnson 2006 370 Christian Okoye 1989 336 Larry Johnson 2005 327 Priest Holmes 2001 320 Priest Holmes 2003 *NFL RECORD Most Rushing Attempts, Consecutive Seasons 752 Larry Johnson (336, 416) 2005-06 640 Priest Holmes (327, 313) 2001-02 633 Priest Holmes (313, 320) 2002-03 615 Christian Okoye (370, 245) 1989-90 574 Larry Johnson (416, 158) 2006-07 Most Rushing Attempts, Rookie, Season 272 Kareem Hunt 2017 234 Joe Delaney 1981 181 Clyde Edwards-Helaire 2020 174 Robert Holmes 1968 170 Isiah Pacheco 2022 Most Rushing Attempts, Game 39 Larry Johnson vs. Seattle Oct. 29, 2006 38 Christian Okoye at Green Bay Dec. 10, 1989 37 Christian Okoye vs. Seattle Nov. 5, 1989 36 Larry Johnson at Houston Nov. 20, 2005 35 Barry Word vs. L.A. Raiders Dec. 22, 1991
3
3
3
Most
2
2
2
2
Most Rushing Yards, Career 7,260 Jamaal Charles 2008-16 6,070 Priest Holmes 2001-07 6,015 Larry Johnson 2003-09 4,897 Christian Okoye 1987-92 4,451 Ed Podolak 1969-77 Most Rushing Yards, Season (All 1,000+) 1,789 Larry Johnson 2006 1,750 Larry Johnson 2005 1,615 Priest Holmes 2002 1,555 Priest Holmes 2001 1,509 Jamaal Charles 2012 1,480 Christian Okoye 1989 1,467 Jamaal Charles 2010 1,420 Priest Holmes 2003 1,327 Kareem Hunt 2017 1,287 Jamaal Charles 2013 1,121 Joe Delaney 1981 1,120 Jamaal Charles 2009 1,087 Mike Garrett 1967 1,053 Tony Reed 1978 1,049 Abner Haynes 1962 1,033 Jamaal Charles 2014 1,031 Christian Okoye 1991 1,015 Barry Word 1990 Most Rushing Yards, Consecutive Seasons 3,539 Larry Johnson (1,750, 1,789) 2005-06 3,170 Priest Holmes (1,555, 1,615) 2001-02 3,035 Priest Holmes (1,615, 1,420) 2002-03 2,796 Jamaal Charles (1,509, 1,287) 2012-13 2,348 Larry Johnson (1,789, 559) 2006-07 Most Rushing Yards, Rookie, Season 1,327 Kareem Hunt 2017 1,121 Joe Delaney 1981 875 Abner Haynes 1960
830 Isiah Pacheco
Most Rushing Yards, Game (All 200+)
Most Rushing Yards, Rookie, Game (All 150+)
Most Rushing Yards, Consecutive Games (All 300+)
RUSHING TOUCHDOWNS
5 @CHIEFS
1968
866 Robert Holmes
2022
Jan. 3, 2010
Sept. 23, 2012
Dec. 23,
Nov. 20,
Jan.
259 Jamaal Charles at Denver
233 Jamaal Charles at New Orleans
226 Jamaal Charles vs. Indianapolis
2012 211 Larry Johnson at Houston
2005 201 Larry Johnson vs. Cincinnati
1, 2006
Oct.
200 Barry Word at Detroit
14, 1990
Nov. 15, 1981
Sept. 24, 2017 161
Diego Dec. 18, 1966
Oct. 19, 2020 158
Nov. 10, 1968
Nov. 24, 1960
Dec. 16,
Nov.
193 Joe Delaney vs. Houston
172 Kareem Hunt at Los Angeles Chargers
Mike Garrett at San
161 Clyde Edwards-Helaire at Buffalo
Robert Holmes at Cincinnati
157 Abner Haynes at N.Y. Titans
155 Kareem Hunt vs. Los Angeles Chargers
2017 150 Kolby Smith vs. Oakland
25, 2007
361 J. Charles
259) Dec. 27, 2009 - Jan. 3, 2010 343 Larry Johnson (132, 211) Nov. 13-20, 2005 332 L. Johnson (131, 201) Dec. 24, 2005 - Jan. 1, 2006 330 Larry Johnson (211, 119) Nov. 20-27, 2005 327 Larry Johnson (155,
Oct. 29 - Nov. 5, 2006
Jamaal
Sept. 23-30, 2012 319 Larry Johnson (121, 198) Sept. 21-28, 2008 311 Larry Johnson (154, 157) Nov. 19-23, 2006 310 Priest Holmes (197, 113) Nov. 24 - Dec. 1, 2002 310 Larry Johnson (143, 167) Dec. 11-17, 2005 301 Priest Holmes (104, 197) Nov. 17-24, 2002
Rushing
Opponent, Season 327 Kareem Hunt vs. Los Angeles Chargers (172, 155) 2017 315 Jamaal Charles vs. Denver (56, 259) 2009 289 Larry Johnson vs. Oakland (154, 135) 2006
Larry Johnson vs. Denver (126, 157) 2006
Christian Okoye
(156, 126) 1989
Games,
Rushing Yards, Career 30 Larry Johnson 2003-09 24 Priest Holmes 2001-07 23 Jamaal Charles 2008-16 14 Christian Okoye 1987-92 13 Abner Haynes 1960-65 Most Games, 100 or More Rushing Yards, Season 11 Larry Johnson 2006 10 Larry Johnson 2005 9 Priest Holmes 2002 8 Christian Okoye 1989 7 Priest Holmes 2001 7 Jamaal Charles 2012 Most Games, 100 or More Rushing Yards, Rookie, Season 6 Kareem Hunt 2017 5 Joe Delaney 1981 3 Curtis McClinton 1962 2 Mike Garrett 1966 2 Robert Holmes 1968 2 Abner Haynes 1960 2 Woody Green 1974 2 Clyde Edwards-Helaire 2020 Most Consecutive Games, 100 or More Rushing Yards 9 Larry Johnson Nov. 6, 2005 - Jan. 1, 2006 5 Priest Holmes Nov. 17 - Dec. 15, 2002 4 Larry Johnson Nov. 19 - Dec. 10, 2006 4 Jamaal Charles Dec. 13, 2009 - Jan. 3 2010 3 Joe Delaney Oct. 4 - Oct. 18, 1981 3 Christian Okoye Sept. 24 - Oct. 8, 1989 3 Christian Okoye Oct. 22 - Nov. 5, 1989 3 Larry Johnson Dec. 5 - Dec. 19, 2004 3 Larry Johnson Oct. 22 - Nov. 5, 2006 3 Jamaal Charles Nov. 25 - Dec. 9, 2012 3 Kareem Hunt Sept.24 - Oct. 8, 2017 Longest Run From Scrimmage 91(TD) Jamaal Charles at New Orleans Sept. 23, 2012 91(TD) Damien Williams vs. Minnesota Nov. 3, 2019 86(TD) Jamaal Charles vs. Indianapolis Dec. 23, 2012 84(TD) Ted McKnight at Seattle Sept. 30, 1979 84(TD) Damien Williams vs. L.A. Chargers Dec. 29, 2019 82(TD) Joe Delaney vs. Denver Oct. 18, 1981 82(TD) Derrick Alexander vs. Pittsburgh Dec. 12, 1999 80(TD) Abner Haynes at N.Y. Jets Nov. 29, 1964 80(TD) Warren McVea vs. Cincinnati Oct. 26, 1969 80 Jamaal Charles at St. Louis Dec. 19, 2010 80(TD) Jamaal Charles at Cleveland Dec. 9, 2012 Most Rushing Yards, QB, Career 1,672 Alex Smith 2013-17 1,547 Patrick Mahomes 2017-22 1,253 Len Dawson 1962-75 712 Steve Fuller 1979-82 692 Trent Green 2001-06 Most Rushing Yards, QB, Season 498 Alex Smith 2015 431 Alex Smith 2013 386 Tyler Thigpen 2008 381 Patrick Mahomes 2021 358 Patrick Mahomes 2022 Most 10+ Yard Rushes, Career 196 Jamaal Charles 2008-16 190 Priest Holmes 2001-07 137 Larry Johnson 2003-09 71 Marcus Allen 1993-97 63 Kimble Anders 1991-00 Most 10+ Yard Rushes, Season 53 Priest Holmes 2002 52 Priest Holmes 2001 49 Larry Johnson 2006 47 Larry Johnson 2005 45 Jamaal Charles 2010 Most 10+ Yard Rushes, Game 10 Priest Holmes at Oakland Dec. 9, 2001 9 Priest Holmes at Seattle Nov. 24, 2002 7 Larry Johnson at N.Y. Giants Dec. 17, 2005 7 Jamaal Charles vs. Buffalo Oct. 31, 2010 Highest Rushing Average, Career (400 attempts) 5.45 Jamaal Charles (1,332-7,260) 2008-16 4.80 Abner Haynes (794-3,814) 1960-64 4.60 Priest Holmes (1,321-6,070) 2001-07 4.57 Kimble Anders (495-2,261) 1991-00 4.44 Ted McKnight (528-2,344) 1977-81 Highest Rushing Average, Season (100 attempts) 6.38 Jamaal Charles (230-1,467) 2010 6.03 Ted McKnight (104-627) 1978 5.89 Jamaal Charles (190-1,120) 2009 5.61 Abner Haynes (156-875) 1960 5.49 Mack Lee Hill (105-576) 1964 Highest Rushing Average, Game (10 attempts) 14.27 A. Haynes at N.Y. Titans (11-157) Nov. 24, 1960 12.25 T. McKnight at Seattle (12-147) Sept. 30, 1979 11.58 E. Podolak vs. Denver (12-139) Dec. 6, 1970 11.45 J. Charles at St. Louis (11-126) Dec. 19, 2010 11.29 A. Haynes vs. Oakland (14-158) Nov. 26, 1961
(102,
172)
321
Charles (233, 88)
Most
Yards vs. One
283
282
vs. Seattle
Most
100 or More
Most Rushing Touchdowns, Career 76 Priest Holmes 2001-07 55 Larry Johnson 2003-09 44 Marcus Allen 1993-97 43 Jamaal Charles 2008-16 40 Christian Okoye 1987-92 39 Abner Haynes 1960-65 Most Rushing Touchdowns, Season 27 Priest Holmes 2003 21 Priest Holmes 2002 20 Larry Johnson 2005 17 Larry Johnson 2006 14 Priest Holmes 2004 Most Rushing Touchdowns, Consecutive Seasons 48 Priest Holmes (21, 27) 2002-03 41 Priest Holmes (27, 14) 2003-04 37 Larry Johnson (20, 17) 2005-06 29 Priest Holmes (8, 21) 2001-02 29 Larry Johnson (9, 20) 2004-05 Most Rushing Touchdowns, Game 4 Abner Haynes vs. Oakland Nov. 26, 1961 4 Priest Holmes at Cleveland Sept. 8, 2002 4 Priest Holmes vs. Atlanta Oct. 24, 2004 4 Derrick Blaylock vs. Atlanta Oct. 24, 2004 3 Jack Spikes vs. Houston Oct. 1, 1961 3 Abner Haynes vs. Boston Sept. 8, 1962 3 Bert Coan at Denver Oct. 23, 1966 3 Ed Podolak at Detroit Nov. 25, 1971 3 Ed Podolak vs. Cleveland Dec. 12, 1976
PASSER RATING
6 @CHIEFS 3 Billy Jackson at Oakland Oct. 25, 1981 3 Marcus Allen at Seattle Dec. 5, 1993 3 Donnell Bennett at Philadelphia Sept. 27, 1998 3 Bam Morris at San Diego Nov. 22, 1998 3 Priest Holmes vs. Denver Oct. 20, 2002 3 Priest Holmes vs. Pittsburgh Sept. 14, 2003 3 Priest Holmes vs. Buffalo Oct. 26, 2003 3 Priest Holmes vs. Detroit Dec. 14, 2003 3 Priest Holmes at Minnesota Dec. 20, 2003 3 Priest Holmes at Denver Sept. 12, 2004 3 Priest Holmes vs. Indianapolis Oct. 31, 2004 3 Larry Johnson at Dallas Dec. 11, 2005 3 Larry Johnson vs. Cincinnati Jan. 1, 2006 3 Larry Johnson vs. Seattle Oct. 29, 2006 3 Larry Johnson vs. Jacksonville Dec. 31, 2006 3 Jamaal Charles at Green Bay Sept. 28, 2015 Most Rushing Touchdowns, Consecutive Games 7 Priest Holmes Oct. 24-31, 2004 6 Priest Holmes Dec. 14-20, 2003 5 Priest Holmes, 5 times Last; Dec. 20-28, 2003 5 Larry Johnson, 3 times Last; Oct. 22-29, 2006 Most Consecutive Games With Rushing Touchdown 11 Priest Holmes Sept. 22 - Dec. 8, 2002 8 Priest Holmes Nov. 23, 2003 - Sept. 19, 2004 8 Larry Johnson Nov. 28, 2004 - Sept. 18, 2005 7 Larry Johnson Nov. 20, 2005 - Jan. 1, 2006 7 Larry Johnson Oct. 15 - Nov. 23, 2006 Most Rushing Touchdowns, Rookie, Season 10 Billy Jackson 1981 9 Abner Haynes 1960 8 Kareem Hunt 2017 7 Robert Holmes 1968 6 Mike Garrett 1966 Most Rushing Touchdowns, QB, Career 12 Patrick Mahomes 2017-22 10 Alex Smith 2013-17 9 Len Dawson 1962-75 7 Mike Livingston 1968-79 6 Pete Beathard 1964-73 6 Rich Gannon 1995-98 Most Rushing Touchdowns, QB, Season 5 Steve Bono 1995 Alex Smith 2016 4 Pete Beathard 1965 Steve Fuller 1980 Patrick Mahomes 2022 3 5 Players Tied; Last, Tyler Thigpen, 2008
PASSING
Most Seasons Leading League in Passing 4 Len Dawson 1962, 1964, 1966, 1968 Highest Passer Rating Career (1,000 attempts) 105.7 Patrick Mahomes 2017-22 94.8 Alex Smith 2013-17 87.3 Trent Green 2001-06 83.2 Len Dawson 1962-75 81.8 Steve DeBerg 1988-91 80.6 Elvis Grbac 1997-00 Highest Passer Rating, Season (200 attempts) 113.8 Patrick Mahomes 2018 108.2 Patrick Mahomes 2020 105.3 Patrick Mahomes 2019 105.2 Patrick Mahomes 2022 104.7 Alex Smith 2017 101.9 Len Dawson 1966 Highest Passer Rating, Rookie, Season 112.3 Todd Blackledge 1983 76.4 Patrick Mahomes 2017 66.7 Hunter Enis 1960 55.8 Steve Fuller 1979 Highest Passer Rating, Game (20 attempts) (All 150.0+) 158.3 Trent Green vs. Detroit Dec. 14, 2003 158.3 Alex Smith at Oakland Dec. 15, 2013 156.6 Steve Bono at Seattle Sept. 3, 1995 154.8 Patrick Mahomes at Pittsburgh Sept. 16, 2018 154.3 Trent Green at Washington Sept. 30, 2001 Most 100.0+ Passer Rating Games, Career 46 Patrick Mahomes 2017-22 30 Len Dawson 1962-75 29 Alex Smith 2013-17 27 Trent Green 2001-06 19 Steve DeBerg 1988-91 14 Bill Kenney 1980-88 Most 100.0+ Passer Rating Games, Season 13 Patrick Mahomes 2018 10 Steve DeBerg 1990 10 Patrick Mahomes 2022 9 Alex Smith 2017 9 Patrick Mahomes 2020 8 Patrick Mahomes 2021 PASSES ATTEMPTED Most Passes Attempted, Career 3,696 Len Dawson 1962-75 2,993 Patrick Mahomes 2017-22 2,777 Trent Green 2001-06 2,436 Alex Smith 2013-17 2,430 Bill Kenney 1979-88 1,751 Mike Livingston 1968-79 Most Passes Attempted, Season (All 500+) 658 Patrick Mahomes 2021 648 Patrick Mahomes 2022 603 Bill Kenney 1983 588 Patrick Mahomes 2020 580 Patrick Mahomes 2018 556 Trent Green 2004 547 Elvis Grbac 2000 523 Trent Green 2001 523 Trent Green 2003 520 Steve Bono 1995 508 Alex Smith 2013 507 Trent Green 2005 505 Alex Smith 2017 Most Passes Attempted, Consecutive Seasons 1,306 Patrick Mahomes (658, 648) 2021-22 1,246 Patrick Mahomes (588, 658) 2020-21 1,079 Trent Green (523, 556) 2003-04 1,072 Patrick Mahomes (484, 588) 2019-20 1,064 Patrick Mahomes (580, 484) 2018-19 1,063 Trent Green (556, 507) 2004-05 Most Passes Attempted, Rookie, Season 270 Steve Fuller 1979 54 Hunter Enis 1960 35 Patrick Mahomes 2017 34 Todd Blackledge 1983 Most Passes Attempted, Game (All 50+) 68 Patrick Mahomes vs. Tennessee Nov. 6, 2022 55 Joe Montana at San Diego Oct. 9, 1994 55 Steve Bono at Miami Dec. 12, 1994 54 Joe Montana at Denver Oct. 17, 1994 54 Steve Bono at San Diego Sept. 29, 1996 54 Patrick Mahomes vs. Buffalo Oct. 10, 2021 53 Elvis Grbac at Oakland Nov. 5, 2000 53 Trent Green at San Diego Jan. 2, 2005 53 Matt Cassel at Denver Nov. 14, 2010 53 Patrick Mahomes vs. Baltimore Dec. 9, 2018 52 Bill Kenney at Denver Oct. 30, 1983 50 Bill Kenney vs. Buffalo Nov. 30, 1986 50 Steve DeBerg at Cleveland Nov. 24, 1991 50 Rich Gannon at Jacksonville Nov. 9, 1997 50 Alex Smith at Pittsburgh Oct. 2, 2016 50 Patrick Mahomes at Tennessee Nov. 10, 2019 50 Patrick Mahomes at Las Vegas Nov. 14, 2021 PASSES COMPLETED Most Passes Completed, Career 2,115 Len Dawson 1962-75 1,985 Patrick Mahomes 2017-22 1,720 Trent Green 2001-06 1,587 Alex Smith 2013-17 1,330 Bill Kenney 1979-88 Most Passes Completed, Season (All 300+) 436 Patrick Mahomes (658 att.) 2021 435 Patrick Mahomes (648 att.) 2022 390 Patrick Mahomes (588 att.) 2020 383 Patrick Mahomes (580 att.) 2018
PASSING YARDS
7 @CHIEFS 369 Trent Green (556 att.) 2004 346 Bill Kenney (603 att.) 1983 341 Alex Smith (505 att.) 2017 330 Trent Green (523 att.) 2003 328 Alex Smith (461 att.) 2016 326 Elvis Grbac (547 att.) 2000 319 Patrick Mahomes (484 att.) 2019 317 Trent Green (507 att.) 2005 308 Alex Smith (508 att.) 2013 307 Alex Smith (470 att.) 2015 303 Alex Smith (464 att.) 2014 Most Passes Completed, Consecutive Seasons (All 600+) 871 Patrick Mahomes (436, 435) 2021-22 826 Patrick Mahomes (390, 436) 2020-21 709 Patrick Mahomes (319, 390) 2019-20 702 Patrick Mahomes (383, 319) 2018-19 699 Trent Green (330, 369) 2003-04 686 Trent Green (369, 317) 2004-05 686 Patrick Mahomes (383, 303) 2018-19 669 Alex Smith (328, 341) 2016-17 635 Alex Smith (307, 328) 2015-16 620 Elvis Grbac (294, 326) 1999-00 617 Trent Green (287, 330) 2002-03 611 Alex Smith (308, 303) 2013-14 610 Alex Smith (303, 307) 2014-15 Most Passes Completed, Rookie, Season 146 Steve Fuller 1979 30 Hunter Enis 1960 22 Patrick Mahomes 2017 20 Todd Blackledge 1983 Most Passes Completed, Game (All 30+) 43 Patrick Mahomes vs. Tennessee Nov. 6, 2022 39 Elvis Grbac at Oakland Nov. 5, 2000 37 Joe Montana at San Diego Oct. 9, 1994 37 Patrick Mahomes at Tampa Bay Nov. 29, 2020 36 Patrick Mahomes at Tennessee Nov. 10, 2019 36 Patrick Mahomes at Houston Dec. 18, 2022 35 Patrick Mahomes at Baltimore Dec. 9, 2018 35 Patrick Mahomes at Las Vegas Nov. 14, 2021 34 Joe Montana at Denver Oct. 17, 1994 34 Trent Green at Denver Dec. 7, 2003 34 Alex Smith vs. San Diego Sept. 11, 2016 34 Patrick Mahomes at Las Vegas Nov. 22, 2020 33 Steve Bono at Miami Dec. 12, 1994 33 Trent Green at San Diego Jan. 2, 2005 33 Matt Cassel at Denver Nov. 14, 2010 33 Patrick Mahomes at L.A. Rams Nov. 19, 2018 33 Patrick Mahomes vs. Buffalo Oct. 10, 2021 32 Trent Green at Tampa Bay Nov. 7, 2004 32 Trent Green vs. Oakland Dec. 25, 2004 32 Patrick Mahomes at Washington Oct. 17, 2021 31 Bill Kenney at San Diego Dec. 11, 1983 31 Elvis Grbac vs. Carolina Dec. 10, 2000 31 Trent Green at San Diego Oct. 30, 2005 31 Alex Smith at Pittsburgh Dec. 21, 2014 31 Alex Smith at Cincinnati Oct. 4, 2015 31 Patrick Mahomes at Baltimore Sept. 28, 2020 31 Patrick Mahomes vs. N.Y. Jets Nov. 1, 2020 31 Patrick Mahomes at Los Angeles Chargers Dec. 16, 2021 30 Steve DeBerg vs. Cleveland Nov. 24, 1991 30 Elvis Grbac vs. Seattle Nov. 21, 1999 30 Alex Smith at Pittsburgh Oct. 2, 2016 30 Patrick Mahomes at Oakland Sept. 15, 2019 30 Patrick Mahomes vs. Carolina Nov. 8, 2020 30 Patrick Mahomes at Arizona Sept. 11, 2022 Most Consecutive Passes Completed 21 Patrick Mahomes at HOU (20), vs. SEA (1) Dec. 18 - Dec. 24, 2022 15 Len Dawson at Houston Sept. 9, 1967 15 Bill Kenney vs. SD (13), at WAS (2) Sept. 12 - Sept. 18, 1983 15 Alex Smith at Oakland Oct. 16, 2016 15 Alex Smith at Atlanta Dec. 4, 2016 14 Trent Green vs. Indianapolis Oct. 31, 2004 Most Seasons Leading League *8 Len Dawson 1962, 64-69, 75 *NFL RECORD Most Consecutive Seasons Leading League *6 Len Dawson 1964-69 *NFL RECORD Highest Completion Percentage, Career (1,000 attempts) 66.32 Patrick Mahomes (2,993-1,985) 2017-22 65.15 Alex Smith (2,436-1,587) 2013-17 61.94 Trent Green (2,777-1,720) 2001-06 57.97 Steve DeBerg (1,616-934) 1988-91 57.94 Elvis Grbac (1,548-897) 1997-00 Highest Completion Percentage, Season (100 attempts) 67.52 Alex Smith (505-341) 2017 67.13 Patrick Mahomes (648-435) 2022 67.08 Alex Smith (489-328) 2016 66.43 Len Dawson (140-93) 1975 66.37 Trent Green (556-369) 2004 66.33 Patrick Mahomes (588-390) 2020 Highest Completion Percentage, Rookie, Season 62.86 Patrick Mahomes (35-22) 2017 58.82 Todd Blackledge (34-20) 1983 55.56 Hunter Enis (54-30) 1960 54.07 Steve Fuller (270-146) 1979 Highest Completion Percentage, Game (20 attempts) 87.80 Patrick Mahomes at Houston (41-36) Dec. 18, 2022 86.36 Alex Smith at Oakland (22-19) Oct. 16, 2016 86.21 Alex Smith vs. St. Louis (29-25) Oct. 26, 2014 85.00 Alex Smith at Oakland (20-17) Dec. 15, 2013 84.00 Alex Smith at Baltimore (25-21) Dec. 20, 2015 84.00 Alex Smith at Atlanta (25-21) Dec. 4, 2016
Most Passing Yards, Career (All 10,000+) 28,507 Len Dawson 1962-75 24,241 Patrick Mahomes 2017-22 21,459 Trent Green 2001-06 17,608 Alex Smith 2013-17 17,277 Bill Kenney 1979-88 11,873 Steve DeBerg 1988-91 11,295 Mike Livingston 1968-79 10,642 Elvis Grbac 1997-00 Most Passing Yards, Season (All 4,000+) 5,250 Patrick Mahomes 2022 5,097 Patrick Mahomes 2018 4,839 Patrick Mahomes 2021 4,740 Patrick Mahomes 2020 4,591 Trent Green 2004 4,348 Bill Kenney 1983 4,169 Elvis Grbac 2000 4,042 Alex Smith 2017 4,039 Trent Green 2003 4,031 Patrick Mahomes 2019 4,014 Trent Green 2005 Most Passing Yards, Consecutive Seasons 10,089 Patrick Mahomes (4,839, 5,250) 2021-22 9,579 Patrick Mahomes (4,740, 4,839) 2020-21 9,128 Patrick Mahomes (5,097, 4,031) 2018-19 8,771 Patrick Mahomes (4,031, 4,740) 2019-20 8,630 Trent Green (4,039, 4,591) 2003-04 8,605 Trent Green (4,591, 4,014) 2004-05 Most Passing Yards, Rookie, Season 1,484 Steve Fuller 1979 357 Hunter Enis 1960 284 Patrick Mahomes 2017 259 Todd Bleckledge 1983 Most Passing Yards, Game (All 400+) 504 Elvis Grbac at Oakland Nov. 5, 2000 478 Patrick Mahomes at L.A. Rams Nov. 19, 2018 469 Matt Cassel at Denver Nov. 14, 2010 462 Patrick Mahomes at Tampa Bay Nov. 29, 2020 446 Patrick Mahomes at Tennessee Nov. 10, 2019 446 Patrick Mahomes vs. Tennessee Nov. 6, 2022 443 Patrick Mahomes at Oakland Sept. 15, 2019 435 Len Dawson vs. Denver Nov. 1, 1964 423 Patrick Mahomes at San Francisco Oct. 23, 2022 416 Patrick Mahomes vs. N.Y. Jets Nov. 1, 2020 411 Bill Kenney at San Diego Dec. 11, 1983 410 Patrick Mahomes at Los Angeles Chargers Dec. 16, 2021 406 Patrick Mahomes at Las Vegas Nov. 14, 2021 400 Trent Green at Green Bay Oct. 12, 2003 Most Games, 300 Yards Passing, Career 41 Patrick Mahomes 2017-22 24 Trent Green 2001-06 15 Bill Kenney 1979-88 9 Len Dawson 1962-75 8 Alex Smith 2013-17 7 Elvis Grbac 1997-00 5 Steve DeBerg 1988-91 Most Games, 300 Yards Passing, Season
7.23 Alex Smith (2,436-17,608)
Highest Passing Average, Season (Qualifiers: 224 attempts/16 G; 238 attemps/17 G) 9.42 Len Dawson (224-2,109)
8.90
Dawson (310-2,759)
TOUCHDOWN PASSES
8 @CHIEFS 10 Patrick Mahomes 2018 10 Patrick Mahomes 2022 9 Patrick Mahomes 2020 8 Trent Green 2004 7 Bill Kenney 1983 7 Patrick Mahomes 2019 5 Elvis Grbac 2000 5 Trent Green 2003 5 Alex Smith 2017 5 Patrick Mahomes 2021 Most Consecutive Games, 300 Yards Passing, Season 8 Patrick Mahomes 2018 6 Patrick Mahomes 2020 6 Patrick Mahomes 2022 5 Patrick Mahomes 2019 4 Bill Kenney 1983 4 Trent Green 2004 3 Elvis Grbac 2000 Long Pass Completion (All TDs) *99 Trent Green vs. San Diego (to Marc Boerigter) Dec. 22, 2002 93 Mike Livingston vs. Miami (to Otis Taylor for 79 yards, lateral to Robert Holmes for 14 yards) Oct. 19, 1969 92 Len Dawson at Denverr (to Tommy Brooker) Nov. 18, 1962 92 Len Dawson at Oakland (to Gloster Richardson) Nov. 3, 1968 90 Len Dawson vs. Houston (to Frank Pitts) Nov. 17, 1968 90 Steve DeBerg vs. San Diego (to J.J. Birden) Nov. 18, 1990
Most 20+ Yard Passes, Career 326 Patrick Mahomes 2017-22 274 Trent Green 2001-06 215 Alex Smith 2013-17 133 Elvis Grbac 1997-00 122 Matt Cassel 2009-12 Most 20+ Yard Passes, Season 75 Patrick Mahomes 2018 73 Patrick Mahomes 2022 67 Patrick Mahomes 2020 59 Trent Green 2004 58 Patrick Mahomes 2021 55 Elvis Grbac 2000 54 Trent Green 2003 Most 20+ Yard Passes, Game 9 Matt Cassel at Denver Nov. 14, 2010 9 Patrick Mahomes at L.A. Rams Nov. 19, 2018 8 Patrick Mahomes at Oakland Sept. 15, 2019 8 Patrick Mahomes at Miami Dec. 13, 2020 7 Dave Krieg at L.A. Raiders Dec. 6, 1992 7 Rich Gannon at San Diego Nov. 22, 1998 7 Elvis Grbac at Oakland Nov. 5, 2000 7 Trent Green at Arizona Oct. 21, 2001 7 Trent Green vs. Indianapolis Oct. 31, 2004 7 Alex Smith at New York Jets Dec. 3, 2017 7 Patrick Mahomes at Cleveland Nov. 4, 2018 7 Patrick Mahomes vs. Las Vegas Oct. 11, 2020 7 Patrick Mahomes vs. Carolina Nov. 8, 2020 7 Patrick Mahomes at Tampa Bay Nov. 29, 2020 7 Patrick Mahomes at Los Angeles Chargers Dec. 16, 2021 7 Patrick Mahomes at San Francisco Oct. 23, 2022 6 22 times; Last P. Mahomes at Denver Dec. 11, 2022
Seasons Leading League 3 Len Dawson 1962, 66, 69 Highest Passing Average, Career (1,000 attempts) 8.10 Patrick Mahomes (2,993-24,241) 2017-22
Trent
2001-06
1962-75
1988-91
2013-17
*NFL RECORD
Most
7.73
Green (2,777-21,459)
7.71 Len Dawson (3,696-28,507)
7.35 Steve DeBerg (1,616-11,873)
1968
1962
Len Dawson (284-2,527) 1966 8.79 Patrick Mahomes (580-5,097) 2018 Highest Passing Average, Game (20 attempts) 15.76 S. DeBerg at New England (21-331) Dec. 2, 1990 14.35 A. Smith at Oakland (20-287) Dec. 15, 2013 13.90 T. Green vs. Denver (21-292) Dec. 16, 2001 12.82 L. Dawson vs. Denver (22-282) Dec. 19, 1965 Most Seasons Leading League *4 Len Dawson 1962, 63, 65, 66 *NFL RECORD
Len
8.90
Most Touchdown Passes, Career 237 Len Dawson 1962-75 192 Patrick Mahomes 2017-22 118 Trent Green 2001-06 105 Bill Kenney 1979-88 102 Alex Smith 2013-17 Most Touchdown Passes, Season 50 Patrick Mahomes 2018 41 Patrick Mahomes 2022 38 Patrick Mahomes 2020 37 Patrick Mahomes 2021 30 Len Dawson 1964 Most Touchdown Passes, Consecutive Seasons 78 Patrick Mahomes (37, 41) 2021-22 76 Patrick Mahomes (50, 26) 2018-19 75 Patrick Mahomes (38, 37) 2020-21 64 Patrick Mahomes (26, 38) 2019-20 56 Len Dawson (26, 30) 1963-64 55 Len Dawson (29, 26) 1962-63 Most Touchdown Passes, Rookie, Season 6 Steve Fuller 1979 3 Todd Blackledge 1983 1 Hunter Enis 1960 Most Touchdown Passes, Game 6 Len Dawson vs. Denver Nov. 1, 1964 6 Patrick Mahomes 2 times Last; at L.A. Rams Nov. 19, 2018 5 Len Dawson 2 times Last; vs. Miami Oct. 8, 1967 5 Elvis Grbac vs. San Diego Sept. 17, 2000 5 Trent Green vs. Miami Sept. 29, 2002 5 Alex Smith at Oakland Dec. 15, 2013 5 Patrick Mahomes 4 times Last; at Arizona Sept. 11, 2022 4 Len Dawson 6 times Last; at Baltimore Sept. 28, 1970 4 Bill Kenney 4 times Last; at Chicago Nov. 1, 1987 4 Trent Green at Cleveland Dec. 3, 2006 4 Matt Cassel 2 times Last; at Indianapolis Oct. 9, 2011 4 Alex Smith 2 times Last; at New York Jets Dec. 3, 2017 4 Patrick Mahomes 10 times Last; vs. Jacksonville Nov. 13, 2022 Most Consecutive Games, Touchdown Passes 31 Patrick Mahomes Oct. 6, 2019 - Oct. 17, 2021 22 Patrick Mahomes Dec. 12, 2021 - Jan. 7, 2023 15 Elvis Grbac Nov. 28, 1999 - Nov. 12, 2000 14 Len Dawson Oct. 3, 1965 - Oct. 8, 1966 14 Patrick Mahomes Oct. 14, 2018 - Sept. 22, 2019 12 Len Dawson Sept. 8, 1962 - Dec. 2, 1962 12 Trent Green Nov. 28, 2001 - Oct. 20, 2002 INTERCEPTIONS Most Consecutive Passes, None Intercepted 312 Alex Smith 2015 297 Alex Smith 2016-17 233 Steve DeBerg 1990 233 Patrick Mahomes 2021-22 219 Patrick Mahomes 2018-19 202 Rich Gannon 1997-98 Most Passes Had Intercepted, Career 178 Len Dawson 1962-75 86 Bill Kenney 1979-88 85 Trent Green 2001-06 83 Mike Livingston 1968-79 50 Steve DeBerg 1988-91 Most Attempts, No Interceptions, Game (All 40+) 53 Matt Cassel at Denver Nov. 14, 2010 50 Patrick Mahomes at Las Vegas Nov. 14, 2021 49 Patrick Mahomes at Tampa Bay Nov. 29, 2020 47 Trent Green at Denver Dec. 7, 2003
PASS RECEIVING RECEPTIONS
9 @CHIEFS 47 Patrick Mahomes at L.A. Chargers Sept. 20, 2020 47 Patrick Mahomes at New Orleans Dec. 20, 2020 45 Patrick Mahomes at Denver Oct. 1, 2018 45 Alex Smith at Cincinnati Oct. 4, 2015 45 Bill Kenney at L.A. Raiders Oct. 9, 1983 45 Steve DeBerg at Denver Sept. 17, 1990 45 Trent Green at Green Bay Oct. 12, 2003 45 Alex Smith at Denver Nov. 17, 2013 45 Alex Smith at Pittsburgh Dec. 21, 2014 45 Patrick Mahomes vs. Carolina Nov. 8, 2020 44 Alex Smith at Denver Nov. 27, 2016 44 Patrick Mahomes at Oakland Sept. 15, 2019 44 Patrick Mahomes at Denver Jan. 8, 2022 43 Bill Kenney at Houston Oct. 23, 1983 43 Rich Gannon at Denver Dec. 6, 1998 43 Trent Green at Denver Dec. 15, 2002 43 Trent Green at San Diego Oct. 30, 2005 43 Matt Cassel vs. Buffalo Dec. 13, 2009 43 Patrick Mahomes vs. Las Vegas Oct. 10, 2022 42 Trent Green vs. Cleveland Nov. 9, 2003 42 Trent Green at Cincinnati Nov. 16, 2003 42 Alex Smith at Denver Sept. 14, 2014 42 Patrick Mahomes at Detroit Sept. 29, 2019 42 Patrick Mahomes at Baltimore Sept. 28, 2020 42 Patrick Mahomes vs. N.Y. Jets Nov. 1, 2020 41 Todd Blackledge vs. Houston Nov. 11, 1984 41 Steve Bono vs. San Diego Oct. 9, 1995 41 Rich Gannon vs. Dallas Dec. 13, 1998 41 Tyler Thigpen at San Diego Nov. 9, 2008 41 Patrick Mahomes at Houston Dec. 18, 2022 40 Steve Bono vs. New England Oct. 15, 1995 40 Elvis Grbac vs. San Diego Oct. 16, 1997 40 Elvis Grbac vs. Oakland Oct. 15, 2000 40 Patrick Mahomes at Seattle Dec. 23, 2018 40 Patrick Mahomes vs. Denver Dec. 6, 2020 Most Passes Had Intercepted, Season 24 Trent Green 2001 23 Cotton Davidson 1961 19 Len Dawson 1963 19 Bill Kenney 1983 17 Len Dawson 1962, '67 17 Trent Green 2004 Most Passes Had Intercepted, Rookie, Season 14 Steve Fuller 1979 2 Hunter Enis 1960 2 Brodie Croyle 2006 1 Tyler Thigpen 2007 1 Patrick Mahomes 2017 0 Todd Blackledge 1983 Most Interceptions, Game 6 Todd Blackledge vs. L.A. Rams Oct. 20, 1985 5 Cotton Davidson at Houston Oct. 16, 1960 5 Len Dawson vs. Oakland Nov. 23, 1969 5 Mike Livingston vs. Pittsburgh Oct. 13, 1974 5 Bill Kenney vs. San Diego Sept. 20, 1981 5 Steve DeBerg at San Diego Sept. 24, 1989 Lowest Percentage, Passes Had Intercepted, Career (1,000 att) 1.35 Alex Smith (2,436-33) 2013-17 1.64 Patrick Mahomes (2,993-49) 2017-22 2.96 Matt Cassel (1,489-44) 2009-12 3.04 Elvis Grbac (1,548-47) 1997-00 3.09 Steve DeBerg (1,616-50) 1988-91 3.54 Bill Kenney (2,430-85) 1979-88 Lowest Percentage, Passes Had Intercepted, Season (300 att) 0.90 Steve DeBerg (444-4) 1990 0.99 Alex Smith (505-5) 2017 1.02 Patrick Mahomes (588-6) 2020 1.03 Patrick Mahomes (484-5) 2019 1.29 Alex Smith (464-6) 2014 1.38 Alex Smith (508-7) 2013
Times Sacked (All 100+) 195.0 Bill Kenney 1979-88 192.0 Alex Smith 2013-17 173.0 Trent Green 2001-06 133.0 Mike Livingston 1968-79 121.0 Patrick Mahomes 2017-22 120.0 Steve Fuller 1979-82 109.0 Matt Cassel 2009-12 Times Sacked, Season 49.0 Steve Fuller 1980 48.0 Dave Krieg 1992 45.0 Alex Smith 2014 45.0 Alex Smith 2015 42.0 Matt Cassel 2009 41.0 Bill Kenney 1983 39.0 Trent Green 2001 39.0 Alex Smith 2013 Times Sacked, Game 10.0 Steve Fuller vs. Baltimore Nov. 2, 1980 8.0 Steve Fuller at Pittsburgh Dec. 5, 1982
SACKS
Most Seasons Leading League 1 MacArthur Lane (66 recs.) 1976 1 Tony Gonzalez (102 recs.) 2004 Most Pass Receptions, Career (All 400+) 916 Tony Gonzalez 1997-08 814 Travis Kelce 2013-22 532 Dwayne Bowe 2007-14 479 Tyreek Hill 2016-21 416 Henry Marshall 1976-87 410 Otis Taylor 1965-75 Most Seasons, 50 or More Pass Receptions 11 Tony Gonzalez 1998-08 9 Travis Kelce 2014-22 6 Dwayne Bowe 2007-08, 2010-13 6 Tyreek Hill 2016-21 5 Kimble Anders 1994-98 5 Eddie Kennison 2002-06 4 Chris Burford 1961, 63-64, 66 4 Otis Taylor 1966-67, 71-72 3 Carlos Carson 1983-84, 87 3 Stephone Paige 1986, 88, 90 3 Derrick Alexander 1998-00 3 Priest Holmes 2001-03 Most Pass Receptions, Season (All 80+) 111 Tyreek Hill 2021 110 Travis Kelce 2022 105 Travis Kelce 2020 103 Travis Kelce 2018 102 Tony Gonzalez 2004 99 Tony Gonzalez 2007 97 Travis Kelce 2019 96 Tony Gonzalez 2008 93 Tony Gonzalez 2000 92 Travis Kelce 2021 87 Jeremy Maclin 2015 87 Tyreek Hill 2018 87 Tyreek Hill 2020 86 Dwayne Bowe 2008 85 Travis Kelce 2016 83 Travis Kelce 2017 81 Dwayne Bowe 2011 80 Carlos Carson 1983 Most Pass Receptions, Consecutive Seasons 202 Travis Kelce (97, 105) 2019-20 202 Travis Kelce (92, 110) 2021-22 200 Travis Kelce (103, 97) 2018-19 198 Tyreek Hill (87, 111) 2020-21 197 Travis Kelce (105, 92) 2020-21 Most Pass Receptions, Game (All 10+) 14 Tony Gonzalez at San Diego Jan. 2, 2005 13 Dwayne Bowe at Denver Nov. 14, 2010 13 Dwayne Bowe at Seattle Nov. 28, 2010 13 Tyreek Hill at Tampa Bay Nov. 29, 2020 12 Ed Podolak vs. Denver Oct. 7, 1973 12 Travis Kelce at Oakland Dec. 2, 2018 12 Tyreek Hill vs. New York Giants Nov. 1, 2021 12 Tyreek Hill at Los Angeles Chargers Dec. 16, 2021 11 Chris Burford at Buffalo Sept. 22, 1963 11 Emile Harry at Cleveland Nov. 24, 1991 11 Kimble Anders vs. N.Y. Giants Sept. 10, 1995 11 Tony Gonzalez at New England Dec. 4, 2000 11 Dante Hall at Denver Dec. 7, 2003 11 Tony Gonzalez vs. Oakland Dec. 25, 2004
10 @CHIEFS 11 Jeremy Maclin at Cincinnati Oct. 4, 2015 11 Travis Kelce vs. Denver Dec. 25, 2016 11 Tyreek Hill at Tennessee Nov. 10, 2019 11 Travis Kelce vs. Denver Dec. 15, 2019 11 Tyreek Hill at Las Vegas Nov. 22, 2020 11 Tyreek Hill vs. Cleveland Sept. 12, 2021 11 Tyreek Hill at Philadelphia Oct. 3, 2021 10 Chris Burford at Boston Oct. 12, 1962 10 Chris Buford vs. Buffalo Oct. 13, 1963 10 Frank Jackson at N.Y. Jets Nov. 29, 1964 10 Chris Burford at Boston Sept. 25, 1966 10 Otis Taylor vs. Cincinnati Oct. 15, 1972 10 Ed Podolak at Houston Sept. 29, 1974 10 Stephone Paige at Denver Sept. 17, 1990 10 J.J. Birden at Miami Dec. 12, 1994 10 Kimble Anders vs. Denver Nov. 16, 1998 10 Tony Gonzalez at Denver Sept. 24, 2000 10 Tony Gonzalez vs. Carolina Dec. 10, 2000 10 Tony Gonzalez vs. Cincinnati Sept. 10, 2006 10 Tony Gonzalez vs. Green Bay Nov. 4, 2007 10 Tony Gonzalez vs. San Diego Dec. 2, 2007 10 Tony Gonzalez at Detroit Dec. 23, 2007 10 Tony Gonzalez at San Diego Nov. 9, 2008 10 Tony Gonzalez vs. Buffalo Nov. 23, 2008 10 Dwayne Bowe at Cincinnati Dec. 28, 2008 10 Tyreek Hill at Carolina Nov. 13, 2016 10 Albert Wilson at Denver Dec. 31, 2017 10 Tyreek Hill at Los Angeles Rams Nov. 19, 2018 10 Travis Kelce at Los Angeles Rams Nov. 19, 2018 10 Travis Kelce vs. Carolina Nov. 8, 2020 10 Travis Kelce at Los Angeles Chargers Dec. 16, 2021 10 Travis Kelce vs. Tennessee Nov. 6, 2022 10 JuJu Smith-Schuster vs. Tennessee Nov. 6, 2022 10 Travis Kelce at Houston Dec. 18, 2022 10 JuJu Smith-Schuster at Houston Dec. 18, 2022 Most Pass Receptions, Half 11 T. Gonzalez (2nd) at San Diego Jan. 2, 2005 10 E. Harry (2nd) at Cleveland Nov. 24, 1991 9 C. Burford (2nd) vs. Buffalo Oct. 13, 1963 9 K. Anders (2nd) vs. N.Y. Giants Sept. 10, 1995 9 T. Gonzalez (1st) vs. Oakland Dec. 25, 2004 Most Consecutive Games, Pass Receptions 143 Travis Kelce Sept. 7, 2014 - Jan. 7, 2023 131 Tony Gonzalez Dec. 4, 2000 - Dec. 28, 2008 83 Stephone Paige Nov. 17, 1985 - Sept. 29, 1991 55 Eddie Kennison Dec. 9, 2001 - Oct. 2, 2005 48 Priest Holmes Sept. 9, 2001 - Sept. 19, 2004 Most Receptions, Running Back, Career 369 Kimble Anders 1991-00 288 Ed Podolak 1969-77 285 Jamaal Charles 2008-16 251 Priest Holmes 2001-07 197 Abner Haynes 1960-64 Most Receptions, Running Back, Season 74 Priest Holmes 2003 70 Priest Holmes 2002 70 Jamaal Charles 2013 67 Kimble Anders 1994 66 MacArthur Lane 1976 Most Receptions, Tight End, Career 916 Tony Gonzalez 1997-08 814 Travis Kelce 2013-22 198 Fred Arbanas 1962-70 163 Walter White 1975-79 135 Jonathan Hayes 1985-93 111 Keith Cash 1992-96 Most Pass Receptions, Tight End, Season 110 Travis Kelce 2022 105 Travis Kelce 2020 103 Travis Kelce 2018 102 Tony Gonzalez 2004 99 Tony Gonzalez 2007 Most Pass Receptions, Rookie, Season 70 Dwayne Bowe 2007 61 Tyreek Hill 2016 55 Abner Haynes (RB) 1960 53 Kareem Hunt (RB) 2017 48 Sylvester Morris 2000 RECEIVING YARDS Most Receiving Yards, Career (All 6,000+) 10,940 Tony Gonzalez 1997-08 10,344 Travis Kelce 2013-22 7,306 Otis Taylor 1965-75 7,155 Dwayne Bowe 2007-14 6,630 Tyreek Hill 2016-21 6,545 Henry Marshall 1976-87 6,360 Carlos Carson 1980-89 6,341 Stephone Paige 1983-91 Most Seasons, 1,000 or More Receiving Yards 7 Travis Kelce 2016-22 4 Tony Gonzalez 2000, 2004, 2007-08 4 Tyreek Hill 2017-18, 2020-21 3 Carlos Carson 1983-84, 87 3 Dwayne Bowe 2008, 2010-11 2 Otis Taylor 1966, 71 2 Eddie Kennison 2004-05 1 Stephone Paige 1990 1 Andre Rison 1997 1 Derrick Alexander 2000 1 Jeremy Maclin 2015 Most Receiving Yards, Season (All 1,000+) 1,479 Tyreek Hill 2018 1,416 Travis Kelce 2020 1,391 Derrick Alexander 2000 1,351 Carlos Carson 1983 1,338 Travis Kelce 2022 1,336 Travis Kelce 2018 1,297 Otis Taylor 1966 1,276 Tyreek Hill 2020 1,258 Tony Gonzalez 2004 1,239 Tyreek Hill 2021 1,229 Travis Kelce 2019 1,203 Tony Gonzalez 2000 1,183 Tyreek Hill 2017 1,172 Tony Gonzalez 2007 1,162 Dwayne Bowe 2010 1,159 Dwayne Bowe 2011 1,125 Travis Kelce 2016 1,125 Travis Kelce 2021 1,110 Otis Taylor 1971 1,102 Eddie Kennison 2005 1,092 Andre Rison 1997 1,086 Eddie Kennison 2004 1,078 Carlos Carson 1984 1,058 Tony Gonzalez 2008 1,044 Carlos Carson 1987 1,038 Travis Kelce 2017 1,034 Jeremy Maclin 2015 1,022 Dwayne Bowe 2008 1,021 Stephone Paige 1990 Most Receiving Yards, Consecutive Seasons 2,662 Tyreek Hill (1,183, 1,479) 2017-18 2,645 Travis Kelce (1,229, 1,416) 2019-20 2,565 Travis Kelce (1,336, 1,229) 2018-19 2,541 Travis Kelce (1,416, 1,125) 2020-21 2,515 Tyreek Hill (1,276, 1,239) 2020-21 Most Receiving Yards, Game (All 200+) 309 Stephone Paige vs. San Diego (8 Receptions) Dec. 22, 1985 269 Tyreek Hill at Tampa Bay (13 Receptions) Nov. 29, 2020 215 Tyreek Hill at L.A. Rams (10 Receptions) Nov. 19, 2018 213 Curtis McClinton vs. Denver (5 Receptions) Dec. 19, 1965 210 Larry Brunson vs. San Diego (9 Receptions) Nov. 10, 1974 206 Stephone Paige at Denver (10 Receptions) Sept. 17, 1990 Most Games, 100 or More Receiving Yards, Career 35 Travis Kelce 2013-22 26 Tony Gonzalez 1997-08 20 Otis Taylor 1965-75 18 Carlos Carson 1980-88 18 Tyreek Hill 2016-21 17 Eddie Kennison 2001-07 Most Games, 100 or More Receiving Yards, Season 6 Otis Taylor 1966 6 Carlos Carson 1983 6 Derrick Alexander 2000 6 Tony Gonzalez 2000 6 Tony Gonzalez 2004 6 Travis Kelce 2016
Longest Pass Receptions (All TDs)
*99 Marc Boerigter vs. San Diego (from Trent Green)
22, 2002
18, 1962 92 Gloster Richardson at Oakland (from Len Dawson)
Tommy Brooker at Denver (from Len Dawson)
3, 1968 90 Frank Pitts vs. Boston (from Len Dawson)
17, 1968 90 J.J. Birden vs. San Diego (from Steve DeBerg)
18, 1990 89 Otis Taylor vs. Miami (from Len Dawson)
13, 1966 89 Demarcus Robinson vs. Oakland (from Patrick Mahomes)
30, 2018 86 Stephone Paige vs. New England (from Steve DeBerg)
2, 1990 86 Derrick Alexander at Chicago (from Elvis Grbac)â
12, 1999
Most Receiving Yards, Running Back, Career
RECEIVING TOUCHDOWNS
11 @CHIEFS
Tyreek
2018
2020
Travis Kelce 2022
Eddie Kennison 2004
Eddie Kennison 2005
Tony Gonzalez 2007
Dwayne Bowe 2010
Travis Kelce 2018
Consecutive
Receiving Yards, Season
Tony
2000
2016
Frank
1964
Otis
1966
1992
Dwayne
2010
Travis
2020
Tyreek
2020
6
Hill
6 Travis Kelce
6
5
5
5
5
5
Most
Games, 100 or More
4
Gonzalez
4 Travis Kelce
3
Jackson
3
Taylor
3 Willie Davis
3
Bowe
3
Kelce
3
Hill
Dec.
Nov.
Nov.
Nov.
Nov.
Nov.
Dec.
Dec.
Sept.
92
*NFL RECORD
Kimble Anders 1991-00 2,739 Abner Haynes 1960-65 2,457 Jamaal Charles 2008-16 2,456 Ed Podolak 1969-77 2,377 Priest Holmes 2001-07 Most Receiving Yards, Running Back, Season 693 Jamaal Charles 2013 690 Priest Holmes 2003 672 Priest Holmes 2002 614 Priest Holmes 2001 590 Curtis McClinton 1965 Most Receiving Yards, Running Back, Game 213 Curtis McClinton vs. Denver Dec. 19, 1965 195 Jamaal Charles at Oakland Dec. 15, 2013 149 Abner Haynes vs. San Diego Oct. 20, 1963 130 Johnny Robinson vs. Buffalo Dec. 18, 1960 129 Spencer Ware vs. San Diego Sept. 11, 2016 127 Abner Haynes at N.Y. Titans Dec. 3, 1961 Most Games, 100 or More Receiving Yards, RB, Career 5 Abner Haynes 1960-65 5 Priest Holmes 2001-07 3 Johnny Robinson 1960-71 3 Paul Palmer 1987-88 2 Curtis McClinton 1962-69 2 Larry Johnson 2003-09 2 Jamaal Charles 2008-16 Most Games, 100 or More Receiving Yards, RB, Season 3 Paul Palmer 1988 2 Johnny Robinson 1960 2 Abner Haynes 1964 2 Priest Holmes 2001 Most Receiving Yards, Tight End, Career (All 1,000+) 10,940 Tony Gonzalez 1997-08 10,344 Travis Kelce 2013-22 3,101 Fred Arbanas 1962-70 2,396 Walter White 1975-79 1,541 Jonathan Hayes 1985-93 1,046 Keith Cash 1992-96 1,009 Tony Moeaki 2010-12 Most Receiving Yards, Tight End, Season 1,416 Travis Kelce 2020 1,338 Travis Kelce 2022 1,336 Travis Kelce 2018 1,258 Tony Gonzalez 2004 1,229 Travis Kelce 2019 1,203 Tony Gonzalez 2000 Most Receiving Yards, Tight End, Game 191 Travis Kelce at Los Angeles Chargers Dec. 16, 2021 168 Travis Kelce at Oakland Dec. 2, 2018 160 Travis Kelce vs. Denver Dec. 25, 2016 159 Travis Kelce vs. Carolina Nov. 8, 2020 147 Tony Gonzalez at New England Dec. 4, 2000 Most Receiving Yards, Rookie, Season 995 Dwayne Bowe 2007 789 Chris Burford 1960 678 Sylvester Morris 2000 611 Johnny Robinson (RB) 1960 593 Tyreek Hill 2016 576 Abner Haynes (RB) 1960 Highest Receiving Average, Career (200 receptions) 18.12 Carlos Carson (351-6,360) 1980-89 17.82 Otis Taylor (410-7,306) 1965-75 17.30 Derrick Alexander (213-3,685) 1998-01 16.82 Stephone Paige (377-6,341) 1983-91 16.29 Eddie Kennison (321-5,230) 2001-07 Highest Receiving Average, Season (24 receptions) 22.36 Otis Taylor (58-1,297) 1966 21.93 Stephone Paige (43-943) 1985 21.83 Frank Pitts (30-655) 1968 Highest Receiving Average, Game (3 receptions) 42.60 C. McClinton vs. Denver (5-213) Dec. 19, 1965 40.00 J. Robinson vs. N.Y. Titans (3-120) Oct. 2, 1960 39.67 Otis Taylor at Denver (3-119) Dec. 14, 1968 Most 20+ Yard Receptions, Career 144 Travis Kelce 2013-22 130 Tony Gonzalez 1997-08 101 Dwayne Bowe 2007-14 99 Tyreek Hill 2016-21 81 Eddie Kennison 2001-07 Most 20+ Yard Receptions, Season 27 Tyreek Hill 2018 24 Derrick Alexander 2000 23 Travis Kelce 2020 20 Derrick Alexander 1998 19 Tony Gonzalez 2004 19 Dwayne Bowe 2010 19 Dwayne Bowe 2011 19 Travis Kelce 2017 19 Tyreek Hill 2020 19 Travis Kelce 2022 Most 20+ Yard Receptions, Game 6 Tyreek Hill at Tampa Bay Nov. 29, 2020 5 Derrick Alexander at San Diego Nov. 22, 1998 5 Tyreek Hill at Los Angeles Chargers Sept. 9, 2018 5 Tyreek Hill at Los Angeles Rams Nov, 19, 2018 4 Derrick Alexander vs. St. Louis Oct. 22, 2000 4 Eddie Kennison vs. Jacksonville Dec. 31, 2006 4 Dwayne Bowe at Denver Nov. 14, 2010 4 Travis Kelce at Oakland Dec. 2, 2018 4 Sammy Watkins at Jacksonville Sept. 8, 2019 4 Demarcus Robinson at Oakland Sept. 15, 2019 4 Tyreek Hill vs. Cleveland Sept. 12, 2021 3 49 times; Last, Travis Kelce vs. Seattle Dec. 24, 2022
2,829
Most Receiving Touchdowns, Career 76 Tony Gonzalez 1997-08 69 Travis Kelce 2013-22 57 Otis Taylor 1965-75 56 Tyreek Hill 2016-21 55 Chris Burford 1960-67 Most Receiving Touchdowns, Season 15 Dwayne Bowe 2010 15 Tyreek Hill 2020 12 Chris Burford 1962 12 Tyreek Hill 2018 12 Travis Kelce 2022 11 Otis Taylor 1967 11 Stephone Paige 1986 11 Tony Gonzalez 1999 11 Travis Kelce 2020 Most Receiving Touchdowns, Consecutive Seasons 24 Tyreek Hill (15, 9) 2020-21 22 Tyreek Hill (7, 15) 2019-20 21 Chris Burford (12, 9) 1962-63 21 Stephone Paige (10, 11) 1985-86 21 Travis Kelce (9, 12) 2021-22 20 Tony Gonzalez (11, 9) 1999-00 20 Dwayne Bowe (15, 5) 2010-11 20 Travis Kelce (11, 9) 2020-21 Most Receiving Touchdowns, Rookie, Season
6 Fred Arbanas 1962
6 Stephone Paige 1983
6 Tyreek Hill 2016
6 Mecole Hardman 2019
5 Chris Burford 1960
5 Otis Taylor 1965
5 Bill Jones 1990
5 Tim Barnett 1991
5 Dwayne Bowe 2007
Most Receiving Touchdowns, Game
4 Frank Jackson at San Diego
4 Jamaal Charles at Oakland
4 Travis Kelce vs. Las Vegas
3 Chris Burford at Oakland
3 Chris Burford at Boston
3 Otis Taylor at Denver
3 Otis Taylor at N.Y. Jets
3 Sylvester Morris vs. San Diego
3 Tony Gonzalez vs. Miami
3 Dwayne Bowe at Seattle
3 Tyreek Hill at New England
3 Sammy Watkins at Jacksonville
3 Tyreek Hill at Tampa Bay
3 Tyreek Hill at Philadelphia
3 Travis Kelce at Los Angeles Chargers
TOTAL YARDS FROM SCRIMMAGE
Dec. 13, 1964
Dec. 15, 2013
Oct. 10, 2022
Sept. 23, 1962
Sept. 25, 1966
Dec. 17, 1967
Nov. 16, 1969
Sept. 17, 2000
Sept. 29, 2002
Nov. 28, 2010
Oct. 14, 2018
Sept. 8, 2019
Nov. 29, 2020
Oct. 3, 2021
Nov. 20, 2022
Most Consecutive Games, Touchdown Receptions
7 Dwayne Bowe
6 Travis Kelce
Oct. 17, 2010 - Nov. 28, 2010
Dec. 6, 2020 - Sept. 19, 2021
6 Jerick McKinnon Dec. 4, 2022 - Jan. 7, 2023
5 Chris Burford
Sept. 8, 1962 - Oct. 12, 1962
5 Otis Taylor Oct. 23, 1966 - Nov. 20, 1966
5 Tyreek Hill
4 Johnny Robinson
4 Chris Burford
4 Fred Arbanas
4 Chris Burford
4 Otis Taylor
4 Curtis McClinton
4 Willie Frazier
4 Otis Taylor
4 Stephone Paige
4 Tony Gonzalez
4 Tony Gonzalez
4 Tony Gonzalez
4 Jeremy Maclin
4 Kareem Hunt
4 Tyreek Hill
4 Travis Kelce
Oct. 25, 2020 - Nov. 29, 2020
Nov. 12, 1961 - Dec. 10, 1961
Oct. 28, 1962 - Nov. 18, 1962
Nov. 11, 1962 - Dec. 2, 1962
Oct. 31, 1965 - Nov. 21, 1965
Nov. 28, 1965 - Sept. 11, 1966
Sept. 11, 1966 - Oct. 2, 1966
Sept. 17, 1972 - Oct. 8, 1972
Sept. 25, 1972 - Oct. 15, 1972
Nov. 23, 1986 - Dec. 14, 1986
Nov. 28, 1999 - Dec. 18, 1999
Sept. 24, 2000 - Oct. 22, 2000
Dec. 7, 2008 - Dec. 28, 2008
Dec. 20, 2015 - Sept. 11, 2016
Oct. 14, 2018 - Nov. 4, 2018
Sept. 10, 2020 - Oct. 5, 2020
Dec. 16, 2021 - Sept. 11, 2022
Highest TD Catch Percentage, Season (20 recs.) 40.0 Marc Boerigter (20 recs., 8 TDs)
YARDS
at New Orleans (233 rush, 55 rec.)
Hill at Tampa Bay (0 rush, 269 rec.)
2001
Yards Per Touch Average, RB, Career (350 touches) 6.60 Abner Haynes (993-6,553)
(1,668-10,963)
5.89 Kimble Anders (864-5,890)
5.53 Curtis McClinton (916-5,069)
COMBINED YARDAGE ATTEMPTS
Most Combined Attempts, Career (All 1,000+)
12 @CHIEFS
2002
1962
1968
1967
1964
2019
Combinations 46 Len Dawson - Otis Taylor 1965-75 46 Patrick Mahomes - Travis Kelce 2017-22 43 Len Dawson - Chris Burford 1962-67 41 Patrick Mahomes - Tyreek Hill 2017-21 34 Trent Green - Tony Gonzalez 2001-06
33.3 Chris Burford (45 recs., 12 TDs)
27.3 Gloster Richardson (22 recs., 6 TDs)
25.0 Fred Arbanas (20 recs., 5 TDs)
23.5 Fred Arbanas (34 recs., 8 TDs)
23.1 Mecole Hardman (25 recs., 6 TDs)
Most Touchdown Receptions, QB-Pass Catcher
ATTEMPTS Most Attempts From Scrimmage, Career 1,617 Jamaal Charles (1,332 rush, 285 rec.) 2008-16 1,572 Priest Holmes (1,321 rush, 251 rec.) 2001-07 1,526 Larry Johnson (1,375 rush, 151 rec.) 2003-09 1,445 Ed Podolak (1,157 rush, 288 rec.) 1969-77 1,288 Christian Okoye (1,246 rush, 42 rec.) 1987-92 1,073 Marcus Allen (932 rush, 141 rec.) 1993-97 Most Attempts From Scrimmage, Season 457 Larry Johnson (416 rush, 41 rec.) 2006 394 Priest Holmes (320 rush, 74 rec.) 2003 389 Priest Holmes (327 rush, 62 rec.) 2001 383 Priest Holmes (313 rush, 70 rec.) 2002 372 Christian Okoye (370 rush, 2 rec.) 1989 Most Attempts From Scrimmage, Game 41 L. Johnson vs. Seattle (39 rush, 2 rec.) Oct. 29, 2006 39 J. Charles at New Orleans (33 rush, 6 rec.) Sept. 23, 2012 38 C. Okoye at Green Bay (38 rush, 0 rec.) Dec. 10, 1989 38 L. Johnson vs. JAX (33 rush, 5 rec.) Dec. 31, 2006 37 C. Okoye vs. Seattle (37 rush, 0 rec.) Nov. 5, 1989 37 L. Johnson at Houston (36 rush, 1 rec.) Nov. 20, 2005
Most Yards From Scrimmage, Career 10,954 Tony Gonzalez (14 rush, 10,940 rec.) 1997-08 10,358 Travis Kelce (14 rush, 10,344 rec.) 2013-22 9,717 Jamaal Charles (7,260 rush, 2,457 rec.) 2008-16 8,447 Priest Holmes (6,070 rush, 2,377 rec.) 2001-07 7,467 Otis Taylor (161 rush, 7,306 rec.) 1965-75 7,384 Larry Johnson (6,015 rush, 1,369 rec.) 2003-09 Most Yards From Scrimmage, Season 2,287 Priest Holmes (1,615 rush, 672 rec.) 2002 2,199 Larry Johnson (1,789 rush, 410 rec.) 2006 2,169 Priest Holmes (1,555 rush, 614 rec.) 2001 2,110 Priest Holmes (1,420 rush, 690 rec.) 2003 2,093 Larry Johnson (1,750 rush, 343 rec.) 2005
Yards From Scrimmage, Game 309 Stephone Paige vs. San Diego (0 rush, 309 rec.) Dec. 22, 1985 307 Priest Holmes at Seattle (197 rush, 110 rec.) Nov. 24, 2002 288 Jamaal Charles
Sept.
Dec.
Nov.
Jan.
Most
23, 2012 277 Priest Holmes at Oakland (168 rush, 109 rec.)
9,
269 Tyreek
29, 2020 262 Jamaal Charles at Denver (259 rush, 3 rec.)
3, 2009
1960-64
2008-16
6.57 Jamaal Charles
1991-00
1962-69
1977-80
7.0 Jamaal Charles
2010 6.9 Abner Haynes (211-1,451) 1960 6.6 Abner Haynes (213-1,399) 1961 6.2 Abner Haynes (260-1,622) 1962 6.2 Jamaal Charles (230-1,417) 2009
5.48 Tony Reed (651-3,566)
Yards Per Touch Average, RB, Season (200 touches)
(275-1,935)
1,668 Jamaal Charles 2008-16 1,572 Priest Holmes 2001-07 1,569 Ed Podolak 1969-77 1,526 Larry Johnson 2003-09 1,289 Christian Okoye 1987-92 1,114 Abner Haynes 1960-65 Most Combined Attempts, Season (All 300+) 457 Larry Johnson 2006 394 Priest Holmes 2003 389 Priest Holmes 2001 383 Priest Holmes 2002 372 Christian Okoye 1989 329 Jamaal Charles 2013 325 Kareem Hunt 2017
PUNTING DISTANCE
YARDS
PUNTS BLOCKED
INSIDE THE 20
13 @CHIEFS 320 Jamaal Charles 2012 Most Combined Attempts, Game 41 Larry Johnson vs. Seattle Oct. 29, 2006 39 Jamaal Charles at New Orleans Sept. 23, 2012 38 Christian Okoye at Green Bay Dec. 10, 1989 38 Larry Johnson vs. Jacksonville Dec. 31, 2006 37 Christian Okoye vs. Seattle Nov. 5, 1989 37 L. Johnson at Houston Nov. 20, 2005 36 Abner Haynes at Denver Oct. 30, 1960 36 Derrick Blaylock at New Orleans Nov. 14, 2004 36 L. Johnson vs. New England Nov. 27, 2005 36 L. Johnson vs. San Diego Dec. 24, 2005
Most Combined Yards, Career (All 7,500+) 12,356 Dante Hall 2000-06 10,963 Tony Gonzalez 1997-08 10,963 Jamaal Charles 2008-16 10,358 Travis Kelce 2013-22 8,447 Abner Haynes 1960-65 8,447 Priest Holmes 2001-07 8,343 Ed Podolak 1969-77 7,677 Carlos Carson 1980-89 Most Combined Yards, Season 2,446 Dante Hall 2003 2,342 Jamaal Charles 2009 2,287 Priest Holmes 2002 2,236 Dante Hall 2004 2,283 Dante Hall 2005 Most Combined Yards, Game 309 Stephone Paige vs. San Diego Dec. 22, 1985 307 Priest Holmes at Seattle Nov. 24, 2002 296 Dante Hall at Denver Dec. 7, 2003 290 Noland Smith at San Diego Oct. 15, 1967 288 Jamaal Charles at New Orleans Sept. 23, 2012
Most Seasons Leading League *4 Jerrel Wilson 1965, 68, 72-73 1 Bob Grupp 1979 1 Jim Arnold 1984 *NFL RECORD Most Punts, Career 1,124 Dustin Colquitt 2005-19 1,018 Jerrel Wilson 1963-77 421 Louie Aguiar 1994-98 284 Jim Arnold 1983-85 272 Bryan Barker 1990-93 Most Punts, Season 101 Daniel Pope 1999 99 Lewis Colbert 1986 98 Jim Arnold 1984 96 Dustin Colquitt 2009 95 Dustin Colquitt 2007 Most Punts, Game 11 Bob Grupp vs. Baltimore Sept. 2, 1979 11 Jim Arnold at San Francisco Nov. 17, 1985 11 Kelly Goodburn vs. Cleveland Nov. 19, 1989 11 Louie Aguiar vs. San Diego Nov. 13, 1994 11 Dustin Colquitt at Chicago Dec. 4, 2011 10 Jerrel Wilson at N.Y. Jets Sept. 18, 1965 10 Jerrel Wilson vs. Denver Oct. 6, 1974 10 Kelly Goodburn at N.Y. Jets Oct. 2, 1988 10 Todd Sauerbrun at San Diego Nov. 26, 2000 10 Dustin Colquitt at N.Y. Jets Dec. 30, 2007 10 Dustin Colquitt at Jacksonville Sept. 8, 2013 Longest Punt (All 70+) 81 Dustin Colquitt vs. San Diego Dec. 2, 2007 77 Dustin Colquitt at Denver Dec. 31, 2017 76 Dan Stryzinski vs. Oakland Sept. 9, 2001 76 Tommy Townsend at Denver Dec. 11, 2022 74 Bob Grupp vs. San Diego Nov. 4, 1979 74 Tommy Townsend vs. Los Angeles Chargers Sept. 15, 2022 73 Dustin Colquitt vs. Oakland Sept. 14, 2008 72 Jerrel Wilson at San Diego Sept. 29, 1963 72 Dustin Colquitt at Oakland Dec. 23, 2006 72 Dustin Colquitt at St. Louis Dec. 19, 2010 71 Dustin Colquitt at Oakland Dec. 16, 2012 70 Jerrel Wilson at Denver Oct. 11, 1964 70 Jerrel Wilson vs. Buffalo Oct. 18, 1964 70 Jerrel Wilson vs. Houston Nov. 28, 1968 70 Dustin Colquitt at Jacksonville Nov. 8, 2009
PUNTING PUNTS
Most Punting Yards, Career 50,393 Dustin Colquitt 2005-19 44,218 Jerrel Wilson 1963-77 17,930 Louie Aguiar 1994-98 11,934 Jim Arnold 1983-85 11,267 Bryan Barker 1990-93 Most Punting Yards, Season 4,397 Jim Arnold 1984 4,361 Dustin Colquitt 2009 4,322 Dustin Colquitt 2007 4,218 Daniel Pope 1999 4,084 Dustin Colquitt 2011 Highest Punting Average, Career (200 punts) 44.83 Dustin Colquitt (1,124-50,393) 2005-19 43.44 Jerrel Wilson (1,018-44,218) 1963-77 42.59 Louie Aguiar (421-17,930) 1994-98 42.02 Jim Arnold (284-11,934) 1983-85 Highest Punting Average, Season (50 punts) 50.42 Tommy Townsend (53-2,672) 2022 46.83 Dustin Colquitt (83-3,887) 2012 46.03 Dustin Colquitt (87-4,005) 2013 45.89 Dustin Colquitt (89-4,084) 2011 45.70 Dustin Colquitt (65-2,971) 2015 Highest Punting Average, Game (4 punts) 60.75 Tommy Townsend vs. New England (4-243) Oct. 5, 2020 57.20 Dustin Colquitt vs. San Diego (5-286) Oct. 31, 2011 56.83 Tommy Townsend vs. Green Bay (6-341) Nov. 7, 2021 56.40 Jerrel Wilson vs. Boston (5-282) Oct. 11, 1970 55.60 Louie Aguiar at Arizona (5-278) Oct. 1, 1995 Highest Net Punting Average, Career (200 Punts) 39.74 Dustin Colquitt 2005-19 35.48 Louie Aguiar 1994-98 35.42 Jerrel Wilson 1963-77 35.13 Bob Grupp 1979-81 34.82 Bryan Barker 1990-93 Highest Net Punting Average, Season (50 Punts) 45.58 Tommy Townsend 2022 41.11 Dustin Colquitt 2017 40.84 Dustin Colquitt 2015 40.78 Dustin Colquitt 2009 40.78 Dustin Colquitt 2012 Highest Net Punting Average, Game (4 Punts) 54.33 Tommy Townsend vs. Green Bay Nov. 7, 2021 52.50 Dustin Colquitt vs. Denver Sept. 15, 2015 52.20 Dustin Colquitt at L.A. Chargers Sept. 9, 2018 52.00 Dustin Colquitt at Indianapolis Oct. 10, 2010 51.86 Dustin Colquitt at Oakland Dec. 16, 2012
Most Consecutive Punts, None Blocked 458 Dustin Colquitt 2013-19 377 Louie Aguiar 1994-98 256 Jerrel Wilson 1968-71 233 Jim Arnold 1983-85 Punts Had Blocked, Career 12 Jerrel Wilson 1963-77 5 Dustin Colquitt 2005-19 2 Bob Grupp 1979-81 2 Jim Arnold 1983-85 2 Bryan Barker 1990-93 2 Daniel Pope 1999 Punts Had Blocked, Season 2 Jerrel Wilson 1974 2 Jim Arnold 1985 2 Daniel Pope 1999 Punts Had Blocked, Game 2 Jim Arnold vs. Denver Oct. 27, 1985
Most Punts Inside the 20, Career 462 Dustin Colquitt 2005-19 117 Louie Aguiar 1994-98 62 Bryan Barker 1990-93 62 Tommy Townsend 2020-22 58 Jim Arnold 1983-85 Most Punts Inside the 20, Season
PUNT RETURNS
PUNT RETURN TOUCHDOWNS
KICKOFF RETURNS
PUNT RETURN YARDS
Highest Punt Return Average, Career (50 returns) 12.14
10.60
Highest Punt Return Average, Season (12 returns)
16.28
14 @CHIEFS 45 Dustin Colquitt 2012 41 Dustin Colquitt 2009 38 Dustin Colquitt 2016 37 Dustin Colquitt 2015 35 Dustin Colquitt 2013
Most Punt Returns, Career 220 J.T. Smith 1979-84 188 Dante Hall 2000-06 181 Tamarick Vanover 1995-99 105 Javier Arenas 2010-12 86 Ed Podolak 1969-77 86 Tyreek Hill 2016-21 Most Punt Returns, Season 58 J.T. Smith 1979 58 Dexter McCluster 2013 51 Tamarick Vanover 1995 51 Tamarick Vanover 1999 50 J.T. Smith 1981 Most Punt Returns, Game 8 Ed Podolak vs. San Diego Nov. 10, 1974 8 De'Anthony Thomas vs. Oakland Dec. 14, 2014 7 J.T. Smith vs. Baltimore Sept. 2, 1979 7 J.T. Smith vs. N.Y. Giants Oct. 21, 1979 7 Tamarick Vanover vs. Detroit Sept. 26, 1999 7 Tamarick Vanover at Denver Dec. 5, 1999 7 Eddie Drummond at Oakland Oct. 21, 2007 7 Dexter McCluster at Jacksonville Sept. 8, 2013 7 Dexter McCluster at Washington Dec. 8, 2013 Most Seasons Leading League 2 J.T. Smith 1979-80
Most Punt Return Yards, Career 2,322 J.T. Smith 1979-84 1,930 Tamarick Vanover 1995-99 1,882 Dante Hall 2000-06 1,029 Javier Arenas 2010-12 1,009 Tyreek Hill 2016-21 959 Dexter McCluster 2010-13 Most Punt Return Yards, Season 686 Dexter McCluster 2013 640 Tamarick Vanover 1999 612 J.T. Smith 1979 592 Tyreek Hill 2016 581 J.T. Smith 1980 Most Punt Return Yards, Game 177 Dexter McCluster at Washington Dec. 8, 2013 156 De'Anthony Thomas vs. Oakland Dec. 14, 2014 141 J.T. Smith vs. Oakland Sept. 23, 1979 130 Tamarick Vanover vs. New Orleans Dec. 21, 1997 128 Dante Hall vs. Arizona Dec. 1, 2002 Longest Punt Return (All TDs) 95 Tyreek Hill at San Diego Jan. 1, 2017 94 Dexter McCluster vs. San Diego Sept. 13, 2010 93 Dante Hall vs. Denver Oct. 5, 2003 91 Tyreek Hill at L.A. Chargers Sept. 9, 2018 90 Dante Hall vs. Arizona Dec. 1, 2002 89 Dexter McCluster vs. N.Y. Giants Sept. 29, 2013 Most Seasons Leading League 1 Abner Haynes 1960 1 Noland Smith 1968 1 Ed Podolak 1970 1 J.T. Smith 1980 1 Dante Hall 2003
Tyreek Hill 2016
1
Dexter McCluster
2010-13
Tyreek Hill
2016-21
Noland Smith (53-589) 1967-69
Abner Haynes (54-587) 1960-64
Tamarick
1995-99
(79-959)
11.73
(86-1,009)
11.11
10.87
10.66
Vanover (181-1,930)
J.T.
Smith (216-2,289) 1978-84
Dante Hall (29-472) 2003 15.54 Dexter McCluster (13-202) 2010 15.36 Abner Haynes (14-215) 1960 15.18 Tyreek Hill (39-592) 2016 15.00 Noland Smith (18-270) 1968
Punt Return Average, Game (3 returns) 35.00 D. Hall vs. Denver (3-105) Oct. 5, 2003 33.33 D. McCluster vs. San Diego (3-100) Sept. 13, 2010 28.67 M. Garrett at Buffalo (3-86) Sept. 11, 1966 28.67 N. Smith vs. N.Y. Jets (3-86) Sept. 15, 1968 28.25 D. McCluster vs. N.Y. Giants (4-113) Sept. 29, 2013
Highest
Most Punt Return Touchdowns, Career 5 Dante Hall 2000-06 4 J.T. Smith 1979-84 4 Tamarick Vanover 1995-99 4 Tyreek Hill 2016-21 Most Punt Return Touchdowns, Season 2 J.T. Smith 1979 2 J.T. Smith 1980 2 Dale Carter 1992 2 Tamarick Vanover 1999 2 Dante Hall 2002 2 Dante Hall 2003 2 Dexter McCluster 2013 2 Tyreek Hill 2016 Most Punt Return Touchdowns, Game 1 29 times, Last; Mecole Hardman at Miami Dec. 13, 2020
Most Kickoff Returns, Career 360 Dante Hall 2000-06 212 Tamarick Vanover 1995-99 84 Dave Grayson 1961-64 72 Knile Davis 2013-16 68 Noland Smith 1967-69 Most Kickoff Returns, Season 68 Dante Hall 2004 65 Dante Hall 2005 57 Dante Hall 2002 57 Dante Hall 2003 53 Dante Hall 2006 Most Kickoff Returns, Game 9 Noland Smith vs. Oakland Nov. 23, 1967 9 Paul Palmer at Seattle Sept. 20, 1987 KICKOFF RETURN YARDS Most Kickoff Return Yards, Career 8,644 Dante Hall 2000-06 5,099 Tamarick Vanover 1995-99 2,231 Dave Grayson 1961-64 1,942 Knile Davis 2013-16 1,822 Noland Smith 1967-69 1,326 Abner Haynes 1960-64 Most Kickoff Return Yards, Season 1,718 Dante Hall 2004 1,560 Dante Hall 2005 1,478 Dante Hall 2003 1,354 Dante Hall 2002 1,308 Tamarick Vanover 1997 Most Kickoff Return Yards, Game (All 200+) 251 Jon Vaughn at Miami Dec. 12, 1994 244 Noland Smith at San Diego Oct. 15, 1967 234 Dante Hall vs. Philadelphia Oct. 2, 2005 233 Dante Hall vs. San Diego Nov. 28, 2004 221 Paul Palmer at Seattle Sept. 20, 1987 206 Noland Smith vs. Oakland Nov. 23, 1967 Longest Kickoff Return (All TDs) 108 Knile Davis vs. Denver Dec. 1, 2013 106 Noland Smith at Denver Dec. 17, 1967 104 Mecole Hardman vs. L.A. Chargers Dec. 29, 2019 102 Byron Pringle at Denver Oct. 25, 2020 100 Dante Hall vs. Pittsburgh Sept. 14, 2003 99 Dave Grayson at Denver Sept. 7, 1963 99 Tamarick Vanover at Seattle Sept. 3, 1995 99 Knile Davis vs. St. Louis Oct. 26, 2014 97 Boyce Green at Pittsburgh Dec. 21, 1986 97 Tamarick Vanover at Denver Oct. 27, 1996 97 Dante Hall at Baltimore Sept. 28, 2003 97 Dante Hall vs. Denver Dec. 19, 2004 97 Jamaal Charles vs. Pittsburgh Nov. 22, 2009 Most Seasons Leading League 1 Dave Grayson 1961 Highest Kickoff Return Average, Career (50 returns)
KICKOFF RETURN TOUCHDOWNS
FUMBLES
INTERCEPTION RETURN YARDS
INTERCEPTION RETURN
TOUCHDOWNS
15 @CHIEFS 26.97 Knile Davis (72-1,942) 2013-16 26.79 Noland Smith (68-1,822) 1967-69 26.56 Dave Grayson (84-2,231) 1961-64 25.17 Abner Haynes (52-1,309) 1960-64 24.43 Jamaal Charles (51-1,246) 2008-16 24.05 Tamarick Vanover (212-5,099) 1995-99 Highest Kickoff Return Average, Season (15 returns) 30.06 Quintin Demps (33-992) 2013 28.31 Dave Grayson (16-453) 1961 28.30 Larry Marshall (23-651) 1972 29.71 Dave Grayson (18-535) 1962 Highest Kickoff Return Average, Game (3 returns) 48.67 Dante Hall vs. Pittsburgh (3-146) Sept. 14, 2003 45.00 Tremon Smith at New England (4-180) Oct. 14, 2018 44.67 Dante Hall vs. St. Louis (3-134) Dec. 8, 2002 44.33 Paul Palmer vs. Seattle (3-133) Dec. 27, 1987 40.67 Noland Smith at San Diego (6-244) Oct. 15, 1967 40.33 L. Williams vs. Cincinnati (3-121) Nov. 21, 1976 40.33 Dante Hall at Baltimore (3-121) Sept. 28, 2003
Most Kickoff Return Touchdowns, Career 6 Dante Hall 2000-06 4 Tamarick Vanover 1995-99 2 Paul Palmer 1987-88 2 Knile Davis 2013-16 Most Kickoff Return Touchdowns, Season 2 Paul Palmer 1987 2 Tamarick Vanover 1995 2 Dante Hall 2003 2 Dante Hall 2004 Most Kickoff Return Touchdowns, Game 1 25 times Last; Byron Pringle vs. Denver Oct. 25, 2020
Most Opponents Fumbles Forced, Career 45 Derrick Thomas 1989-99 33 Tamba Hali 2006-17 29 Neil Smith 1988-96 23 Derrick Johnson 2005-17 14 Justin Houston 2011-18 13 Kevin Ross 1984-93, 97 13 Jared Allen 2004-07 Most Opponents Fumbles Forced, Season 8 Derrick Thomas 1992 7 Jared Allen 2005 7 Dee Ford 2018 6 Derrick Thomas 1990 6 Derrick Thomas 1994 6 Tamba Hali 2006 Most Fumbles Forced, Rookie, Season 6 Tamba Hali 2006 4 Kevin Ross 1984 4 Tim Cofield 1986
Most Seasons, Leading League 2 Johnny Robinson 1966, 70 2 Emmitt Thomas 1969, 74 Most Interceptions By, Career 58 Emmitt Thomas 1966-78 57 Johnny Robinson 1960-71 50 Deron Cherry 1981-91 39 Gary Barbaro 1976-82 38 Albert Lewis 1983-93 Most Interceptions By, Season 12 Emmitt Thomas 1974 10 Johnny Robinson 1966 10 Bobby Hunt 1966 10 Johnny Robinson 1970 10 Gary Barbaro 1980 9 Emmitt Thomas 1969 9 Deron Cherry 1986 Most Interceptions By, Rookie, Season 8 Marcus Peters 2015 8 Bobby Hunt 1962 7 Dale Carter 1992 6 Kevin Ross 1984 4 Bobby Ply 1962 4 Emmitt Thomas 1967 4 Lloyd Burruss 1981 4 Albert Lewis 1983 4 Eric Berry 2010 3 14 players; Last L. Sneed (2020) Most Interceptions By, Game *4 Bobby Ply vs. San Diego Dec. 16, 1962 4 Bobby Hunt vs. Houston Oct. 4, 1964 4 Deron Cherry vs. Seattle Sept. 29, 1985 3 Bobby Ply vs. Denver Dec. 9, 1962 3 Johnny Robinson at Baltimore Sept. 28, 1970 3 Albert Lewis vs. Atlanta Dec. 8, 1985 3 Lloyd Burruss vs. San Diego Oct. 19, 1986 3 Albert Lewis vs. Atlanta Sept. 1, 1991 3 Greg Wesley vs. Miami Sept. 29, 2002 3 Greg Wesley vs. New England Nov. 27, 2005 *NFL RECORD Most Consecutive Games, Passes Intercepted By 6 Eric Harris 1980
INTERCEPTIONS
Most Interception Return Yards, Career 938 Emmitt Thomas (58 INTs) 1966-78 771 Gary Barbaro (39 INTs) 1975-82 741 Johnny Robinson (57 INTs) 1960-71 688 Deron Cherry (50 INTs) 1981-91 674 Bobby Hunt (37 INTs) 1962-67 Most Interception Return Yards, Season 280 Marcus Peters (8 INTs) 2015 274 Mark McMillian (8 INTs) 1997 228 Bobby Hunt (6 INTs) 1963 214 Emmitt Thomas (12 INTs) 1974 193 Lloyd Burruss (5 INTs) 1986 175 Derrick Johnson (3 INTs) 2009 Most Interception Return Yards Gained, Game 121 Lloyd Burruss vs. San Diego (3 INTs) Oct. 19, 1986 118 Brandon Flowers at N.Y. Jets (2 INTs) Oct. 26, 2008 108 Bobby Ply vs. San Diego (4 INTs) Dec. 16, 1962 105 Derrick Johnson vs. Denver (2 INTs) Jan. 3, 2010 102 Gary Barbaro vs. Seattle (1 INT) Dec. 11, 1977 Longest Interception Return 102 Gary Barbaro vs. Seattle Dec. 11, 1977 100 Tim Collier at Oakland Dec. 18, 1977 100 Sean Smith at Buffalo Nov. 3, 2013 99 Dave Grayson vs. N.Y. Titans Dec. 17, 1961 99 Kevin Ross at San Diego Sept. 6, 1992 99 Jaylen Watson vs. Los Angeles Chargers Sept. 15, 2022
Most Interception Return Touchdowns, Career 6 Bobby Bell 1963-74 5 Emmitt Thomas 1966-78 5 Jim Kearney 1967-75 5 Eric Berry 2010-17 4 Lloyd Burruss 1981-91 4 Derrick Johnson 2005-17 4 Daniel Sorensen 2014-21 Most Interception Return Touchdowns, Season *4 Jim Kearney 1972 3 Lloyd Burruss 1986 3 Mark McMillian 1997 2 Sherrill Headrick 1961 2 Emmitt Thomas 1974 2 Charles Mincy 1992 2 Jerome Woods 1993 2 Derrick Johnson 2009 2 Eric Berry 2013 2 Marcus Peters 2015 2 Eric Berry 2016 *NFL RECORD Most Interception Return Touchdowns, Game *2 Jim Kearney at Denver Oct. 1, 1972 2 Lloyd Burruss vs. San Diego Oct. 19, 1986 2 Derrick Johnson at Denver Jan. 3, 2010 *NFL RECORD SACKS
Sacks, Career (All
Most
50.0+)
SPECIAL TEAM TACKLES
BLOCKED KICKS
16 @CHIEFS 126.5 Derrick Thomas 1989-99 89.5 Tamba Hali 2006-17 85.5 Neil Smith 1988-96 78.5 Justin Houston 2011-18 73.0 Art Still 1978-87 65.0 Chris Jones 2016-22 51.0 Mike Bell 1979-85, 87-91 Most Sacks, Season 22.0 Justin Houston 2014 20.0 Derrick Thomas 1990 15.5 Jared Allen 2007 15.5 Chris Jones 2018 15.5 Chris Jones 2022 15.0 Neil Smith 1993 Most Sacks, Consecutive Seasons 33.5 Derrick Thomas (20.0, 13.5) 1990-91 33.0 Justin Houston (11.0, 22.0) 2013-14 30.0 Derrick Thomas (10.0, 20.0) 1989-90 29.5 Neil Smith (14.5, 15.0) 1992-93 29.5 Justin Houston (22.0, 7.5) 2014-15 28.0 Derrick Thomas (13.5, 14.5) 1991-92 26.5 Neil Smith (15.0, 11.5) 1993-94 26.5 Tamba Hali (14.5, 12.0) 2010-11 Most Sacks, Rookie, Season 10.0 Derrick Thomas 1989 9.0 Jared Allen 2004 8.0 Tamba Hali 2006 6.5 Art Still 1978 6.0 George Karlaftis 2022 Most Sacks, Game *7.0 Derrick Thomas vs. Seattle Nov. 11, 1990 6.0 Derrick Thomas vs. Oakland Sept. 6, 1998 4.5 Justin Houston at Philadelphia Sept. 19, 2013 4.0 Wilbur Young at San Diego Oct. 19, 1975 4.0 Art Still at Oakland Oct. 5, 1980 4.0 Derrick Thomas vs. Buffalo Oct. 7, 1991 4.0 Derrick Thomas vs. San Diego Nov. 8, 1992 4.0 Neil Smith vs. L.A. Raiders Oct. 3, 1993 4.0 Justin Houston vs. San Diego Dec. 28, 2014 *NFL RECORD Most Sack Yards, Career 699.0 Derrick Thomas 1989-99 591.5 Tamba Hali 2006-17 506.5 Neil Smith 1988-96 457.0 Chris Jones 2016-22 452.0 Justin Houston 2011-18 Most Sack Yards, Season 127.0 Neil Smith 1993 122.0 Chris Jones 2018 114.5 Neil Smith 1992 113.0 Derrick Thomas 1992 111.0 Jared Allen 2007 Most Sack Yards, Game 36.0 Derrick Thomas vs. San Diego Nov. 8, 1992 36.0 Derrick Thomas vs. Oakland Sept. 6, 1998 35.0 Neil Smith vs. Los Angeles Oct. 3, 1993 34.0 Vonnie Holliday vs. San Diego Sept. 7, 2003 33.0 Darren Mickell vs. Denver Dec. 17, 1995 TACKLES Most Tackles, Career 1,262 Derrick Johnson 2005-17 999 Gary Spani 1978-86 992 Art Still 1978-87 927 Deron Cherry 1981-91 876 Donnie Edwards 1996-01, 2007-08 827 Kevin Ross 1984-93, 97 Most Tackles, Season 180 Nick Bolton 2022 179 Derrick Johnson 2011 162 Mike Maslowski 2002 157 Gary Spani 1979 153 Gary Spani 1981 Most Tackles, Rookie, Season 144 Gary Spani 1978 140 Dino Hackett 1986 126 Eric Berry 2010 120 Art Still 1978 112 Nick Bolton 2021 101 Greg Wesley 2000 Most Tackles, Consecutive Seasons 326 Derrick Johnson (147, 179) 2010-11 306 Gary Spani (157, 149) 1979-80 304 Derrick Johnson (179, 125) 2011-12 302 Gary Spani (149, 153) 1980-81 301 Gary Spani (144, 157) 1978-79
Most Special Teams Tackles, Career 148 Gary Stills 1999-05 147 Greg Manusky 1994-99 97 Danan Hughes 1993-98 96 Tony Richardson 1995-05 94 Louis Cooper 1985-90 Most Special Teams Tackles, Season 34 Gary Stills 2002 29 Gary Stills 2003 29 Rich Scanlon 2005 28 Ken Jolly 1984 27 Albert Lewis 1983 27 Todd McNair 1990 27 Bennie Thompson 1992 27 Greg Manusky 1999 Most Special Teams Tackles, Consecutive Seasons 63 Gary Stills 2002-03 54 Gary Stills 2003-04 52 Gary Stills 2001-02 51 Greg Manusky 1996-97 50 Greg Manusky 1998-99 50 Gary Stills 2004-05
Most Opponents Punts Blocked, Career 10 Albert Lewis 1983-93 3 Bernard Pollard 2006-08 2 Ed Beckman 1977-84 2 Gary Green 1977-83 2 Sherrill Headrick 1960-67 2 Bernard Pollard 2006 1 D.J. Alexander 2015 Most Opponents Punts Blocked, Season 4 Albert Lewis 1990 3 Albert Lewis 1986 2 Sherrill Headrick 1963 2 Bernard Pollard 2006 Most Opponents Punts Blocked, Game 2 Sherrill Headrick vs. Denver Dec. 8, 1963 Longest Return of Blocked Field Goal 78 (TD) Lloyd Burruss at Pittsburgh Dec. 21, 1986 65 (TD) Kevin Ross at Cincinnati Dec. 6, 1987
GAMES WON
Most 40-Point Games, Season
5 2003, 2018
4 1966, 2002, 2004
3 1961, 1962, 1963, 1964, 1967, 2021, 2022
2 1965, 1968, 1983, 2000, 2010, 2013, 2017, 2019, 2020
Most 30-Point Games, Season
GAMES LOST
Most Points Scored, Game
Largest
Most
Fewest
17 @CHIEFS
Most Consecutive Games Won 11 2015-16 10 2019-20, 2020 9 2003, 2013, 2017-18 8 2021 7 1968-69, 1969, 1995, 1997-98, 2016-17 6 1968, 1997 5 1961-62, 1966-67, 1971, 1984-85, 2014, 2016,
2022 (2) Most Consecutive Games Won, Single Season 10 2015, 2020 9 2003, 2013 8 2021 7 1969, 1995 6 1968, 1997, 2019 5 1968, 1971, 2014, 2016, 2017, 2018, 2022 (2) Most Consecutive Games Won, Start of Season 9 2003, 2013 5 2017, 2018 4 1996, 2018, 2019, 2020 3 1962, 1966, 1994, 1995, 2010 Most Consecutive Games Won, End of Season 10 2015 6 1997, 2019 5 1968, 2022 4 2017, 2018 3 1960, 1963, 1966, 1967, 1971, 1972, 1984, 1986 Most Consecutive Home Games Won 13 2002-03 11 1994-96, 1997-98 10 1968-69, 2015-16 9 1970-71, 2017-18 Most Consecutive Road Games Won 11 2019-20 9 1966-67, 2016-17 6 1967-68 5 1968-69, 1971-72
Most Consecutive Games Lost 12 2007-08 9 1987, 2008-09 8 1975-76, 2012 7 1985, 2008 Most Consecutive Games Lost, Start of Season 5 1977, 2009 4 1976, 1980 3 1975, 2004, 2008, 2011 Most Consecutive Games Lost, End of Season 9 2007 6 1977 4 1975, 2008, 2012 Most Consecutive Home Games Lost 10 2008-09 8 1974-75 7 1975-76, 2011-12 6 1977-78, 2007-08 Most Consecutive Road Games Lost 9 2007-08 8 1978-79, 1985-86 6 1988, 2008-09, 2012
Most Points, Season (All 400+) 565 2018 496 2022 484 2003 483 2004 480 2021 473 2020 467 2002 451 2019 448 1966 430 2013 415 2017 408 1967 405 2015 403 2005 Highest Scoring Average, Season 35.3 2018 (565 in 16 games) 32.0 1966 (448 in 14 games) 30.3 2003 (484 in 16 games) 30.2 2004 (483 in 16 games) 29.6 2020 (473 in 16 games) Most Points, Consecutive Seasons 1,016 2018-19 (565, 451) 980 2017-18 (415, 565) 976 2021-22 (480, 496) 967 2003-04 (484, 483) 953 2020-21 (473, 480) Fewest Points, Season 176 1982 (9 games) 211 2012 212 2011 225 1977 226 2007 Lowest Scoring Average, Season 13.2 2012 (211 in 16 games) 13.3 2011 (212 in 16 games) 14.1 2007 (226 in 16 games) 14.9 1979 (238 in 16 games) 15.2 1978 (243 in 16 games) 15.9 1988 (254 in 16 games)
Scoring Differential, Season 201 1968 (371 - 170) 182 1969 (359 - 177) 176 1966 (448 - 276) 156 1962 (369 - 233) 154 1967 (408 - 254)
2018-19,
SCORING POINTS
Largest
9
8
6
12 2018
2020, 2021
1966, 2002, 2004, 2022 7 1999, 2003, 2019
1960, 1967, 2010 5 1962, 1965, 1968, 1983, 1994, 2005, 2006, 2015, 2016, 2017
59
Sept.
56
Oct.
56
54
4
Oct.
at Denver
7, 1963
at Denver
23, 1966
vs. Atlanta Oct. 24, 2004 56 at Oakland Dec. 15, 2013
vs. St. Louis Oct. 22, 2000 52
times; Last vs. Denver
29, 1967
52 Kansas City (59) at Denver (7) Sept. 7, 1963 49 Kansas City (49) vs. Arizona (0) Dec. 1, 2002 48 Kansas City (48) vs. N.Y. Jets (0) Dec. 22, 1963 46 Kansas City (56) vs. Denver (10) Oct. 16, 1966 46 Kansas City (56) vs. Atlanta (10) Oct. 24, 2004
Margin of Victory, Game
Points, Both Teams, Game
KC (51) at LAR (54) Nov. 19, 2018 99 KC (48) at Seattle (51) Nov. 27, 1983 (OT) 88 KC (49) vs. Denver (39) Nov. 1, 1964 88 KC (54) vs. St. Louis (34) Oct. 22, 2000
105
Points, Both Teams, Game
KC (0) at Tampa Bay (3) Dec. 16, 1979
KC (3) vs. Cleveland (6) Sept. 4, 1988
KC (7) at Denver (3) Jan. 1, 2012 12 KC (6) vs. St. Louis (6) Nov. 22, 1970 12 KC (3) at Miami (9) Oct. 20, 1974
3
9
10
Most
Largest
Largest
TOUCHDOWNS
18 @CHIEFS
Victory, Game 49 vs. Arizona Dec. 1, 2002 48 vs. N.Y. Jets Dec. 22, 1963 41 vs. Miami Oct. 8, 1967 41 vs. San Francisco Oct. 1, 2006 34 vs. Boston Dec. 11, 1960 34 vs. Houston Nov. 26, 1989 34 vs. Cleveland Sept. 30, 1990 34 vs. San Diego Oct. 31, 1999 Fewest Points, Shutout Victory, Game 14 vs. Baltimore Sept. 2, 1979 16 vs. Denver Dec. 6, 1970 17 vs. L.A. Chargers Sept. 25, 1960
Points Shutout
Fourth-Quarter Comebacks Opponent Deficit Final Date 17 at Green Bay 14-31 40-34 (OT) Oct. 12, 2003 17 vs. San Diego 10-27 33-27 (OT) Sept. 11, 2016 14 at N.Y. Jets 3-17 17-17 (OT) Oct. 2, 1988 14 vs. N.Y. Giants 3-17 20-17 (OT) Sept. 10, 1995 14 at Oakland 20-34 37-34 Nov. 28, 1999 14 at Carolina 3-17 20-17 Nov. 13,2016
Second-Half Comebacks Opponent Deficit Final Date 21 vs. San Diego 3-24 33-27 (OT) Sept. 11, 2016 18 at New Orleans 6-24 27-24 Sept. 23, 2012 17 at Buffalo 10-27 27-27 Sept. 22, 1963 17 at Oakland 0-17 28-17 Oct. 25, 1981 17 at Green Bay 14-31 40-34 (OT) Oct. 12, 2003 16 at San Diego 0-16 24-23 Nov. 2, 1986 14 at N.Y. Jets 3-17 17-17 (OT) Oct. 2, 1988 14 vs. San Diego 0-14 20-17 (OT) Dec. 8, 1991 14 vs. N.Y. Giants 3-17 20-17 (OT) Sept. 10, 1995 14 at Oakland 13-27 28-27 Sept. 8, 1997 14 at Oakland 20-34 37-34 Nov. 28, 1999 14 at Carolina 3-17 20-17 Nov. 13, 2016 Most Consecutive Games Scoring 179 1963-76 164 2012-22 139 1994-2002 91 1987-93 84 2003-08 Most Points, Two Consecutive Games 104 Oct. 23, 1966 - Oct. 30, 1966 (56, 48) 101 Dec. 8, 2013 - Dec. 15, 2013 (45, 56) Most First-Half Points, Game 42 vs. Denver Oct. 29, 1967 38 at Miami Sept. 28, 1968 38 at Washington Dec. 8, 2013 35 vs. Arizona Dec. 1, 2002 35 vs. St. Louis Dec. 8, 2002 35 vs. Atlanta Oct. 24, 2004 35 at Oakland Dec. 15, 2013 35 vs. San Francisco Sept. 23, 2018 35 vs. Las Vegas Dec. 12, 2021 Most First-Quarter Points, Season 158 1966 147 2018 130 2021 124 2013 113 2004 112 2003 Most First-Quarter Points, Game 24 at Miami Sept. 28, 1968 21 13 times, last at Pittsburgh Sept. 16, 2018 Most Second-Quarter Points, Season 177 2019 172 2022 153 2003 150 2018 149 1997, 2020 Most Second-Quarter Points, Game 28 vs. Denver Oct. 29, 1967 28 vs. Pittsburgh Oct. 18, 1971 28 vs. Denver Dec. 7, 1980 28 vs. San Diego Dec. 22, 1985 28 at Washington Sept. 30, 2001 28 at Oakland Sept. 15, 2019 24 vs. Houston Oct. 30, 1966 24 vs. Indianapolis Oct. 31, 2004 Most Second-Half Points, Game 35 at Denver Oct. 23, 1966 35 at Denver Dec. 1, 1972 35 at Tennessee Dec. 13, 2004 34 at Denver Jan. 3, 2010 31 at Denver Sept. 7, 1963 31 at New England Oct. 14, 2018 30 vs. Cleveland Dec. 14, 1975 Most Third-Quarter Points, Season 134 2018 110 2022 109 1963 107 2022 106 1964 105 1998 103 2019 Most Third-Quarter Points, Game 22 vs. New York Jets Nov. 5, 1967 22 vs. Buffalo Oct. 18, 1969 22 vs. Oakland Nov. 26, 1961 21 at Buffalo Nov. 6, 1960 21 at Denver Sept. 7, 1963 21 at Denver Oct. 1, 1972 21 vs. Oakland Oct. 3, 1977 Most Fourth-Quarter Points, Season 168 2002 140 2004 136 2020 131 2003, 2018 129 1962, 2021 127 1960 Most Fourth-Quarter Points, Game 23 at Buffalo Nov. 2, 1969 23 at Cleveland Sept. 8, 2002 22 at N.Y. Titans Nov. 24, 1960 21 at New England Sept. 7, 2017 20 at Green Bay Oct. 12, 2003
Most Touchdowns, Season 71 2018 63 2003 62 2004 61 2022 57 2002, 2020, 2021 Most Touchdowns, Consecutive Seasons 125 2003-04 (63, 62) 121 2018-19 (71, 50) 120 2002-03 (57, 63) 118 2021-22 (57, 61) 114 2020-21 (57, 57) Fewest Touchdowns, Season 17 1982 (9 games) 18 2012 20 2011 23 1973 24 1988, 2007 Most Touchdowns, Game 8 at Denver Sept. 7, 1963 8 at Denver Oct. 23, 1966 8 vs. Atlanta Oct. 24, 2004 8 at Oakland Dec. 15, 2013 7 12 times; Last at Tennessee Dec. 13, 2004 Most Touchdowns, Both Teams, Game 14 Kansas City (7) at Los Angeles Rams (7) Nov. 19, 2018 13 Kansas City (7) at Seattle (6) Nov. 27, 1983 (OT) 13 Kansas City (8) at Oakland (5) Dec. 15, 2013 12 Kansas City (7) vs. Denver (5) Nov. 1, 1964 12 Kansas City (7) vs. St. Louis (5) Oct. 22, 2000 12 Kansas City (7) at Tennesse (5) Dec. 13, 2004 Most Consecutive Games Scoring Touchdowns 96 1963-70 64 1997-01 60 2017-21 52 1960-63 35 1994-96 33 1976-78 Most Offensive Touchdowns, Season
1992, 1999, 2013
1992
2013, 2015
1972, 1974, 1977
1960, 1967, 1981, 1986, 1995, 1997, 2016, 2018, 2021 Fewest Defensive Touchdowns, Season
1962, 1976, 1978, 1988, 2006, 2012
1961, 1975, 1976, 1989, 1998, 2001, 2002, 2007 Most Defensive Touchdowns, Game
1974, 1999, 2013
4 1960, 1986, 1997, 2015, 2016
Most Fumble Return TDs, Season 4 1999 3 1997, 1980, 1981, 2017
1989, 1991, 1992, 1993, 1995, 2013, 2019, 2021
1986, 1987, 2013
POINT AFTER TOUCHDOWNS
FIELD GOALS
19 @CHIEFS 66 2018 59 2022 58 2004 56 2003 53 2002, 2020, 2021 Fewest Offensive Touchdowns, Season 13 1982 (9 games) 17 2012 18
21 1973, 1974 23
24
25
Return Touchdowns, Season 11
8
7
9
8
3
Dec.
Dec.
2011
2007
1970, 1977, 1987, 1988
1979 Most
2016
1995, 1997, 2003 Most Defensive Touchdowns, Season
1999
6
5
4
0
1
vs. Denver
27, 1992 2 15 times, last at Baltimore
20, 2015 Most Interception Return TDs, Season 6 1992 5 1972,
5
4
3
Most Special Teams Touchdowns, Game 3 at Pittsburgh Dec. 21, 1986 2 vs. Cleveland Sept. 30, 1990 2 vs. St. Louis Dec. 8, 2002 2 at Washington Dec. 8, 2013
2
Most Special Teams Touchdowns, Season
1995, 2003, 2016
1969, 1992, 2002, 2009
Most Points After Touchdown, Season 65 2018 58 2003, 2004 54 2002, 2020 52 2013 50 2021, 2022 Fewest Points After Touchdown, Season 17 1982 (9 games), 2012 20 2011 21 1973, 2007 23 1988 Most Points After Touchdown, Game 8 at Denver Sept. 8, 1963 8 at Denver Oct. 23, 1966 8 vs. Atlanta Oct. 24, 2004 8 at Oakland Dec. 15, 2013 Most Two-Point Attempts, Season 6 2001 5 1997, 2022 4 1961, 1994, 2008, 2015 3 1964, 1965, 1966, 1967, 1995, 2002, 2003, 2007, 2020, 2021 Most Two-Point Conversions, Season 3 1961, 1965, 1994,
2020, 2022 2 1966, 1967, 1997, 2015, 2016, 2021 1 12 times, Last; 2019 Most Two-Point Attempts, Game 2 vs. Buffalo Oct. 18, 1964 2 at Houston Oct. 24, 1965 2 at St. Louis Oct. 26, 1997 2 at Denver Nov. 14, 2010 2 at Greeb Bay Sept. 28, 2015 2 at Oakland Nov. 20, 2015 Most Two-Point Conversions, Game 2 at Houston Oct. 24, 1965 2 at St. Louis Oct. 26, 1997
2001,
Most Field Goals Attempted, Season 45 2017 44 1971 42 1970 40 1968 Fewest Field Goals Attempted, Season 17 1964 18 1977 20 2003 22 1979, 2008 Most Field Goals Attempted, Game 7 vs. Buffalo Dec. 19, 1971 7 vs. Cincinnati Oct. 4, 2015 6 8 times; Last at New Orleans Sept. 23, 2012 Most Field Goals Attempted, Both Teams, Game 10 Kansas City (7) vs. Buffalo (3) Dec. 19, 1971 10 Kansas City (5) at San Diego (5) Oct. 29, 1972 10 Kansas City (6) vs. Denver (4) Dec. 16, 2001 10 Kansas City (5) vs. Denver (5) Sept. 28, 2008 Most Field Goals Made, Season 41 2017 34 1990, 2019 31 2016 30 1968, 1970, 2015 28 2012, 2021 Fewest Field Goals Made, Season 7 1961 8 1963, 1964 12 1979 Most Field Goals Made, Game 7 at Cincinnati Oct. 4, 2015 6 at New Orleans Sept. 23, 2012 5 at Buffalo Nov. 2, 1969 5 vs. Buffalo Dec. 7, 1969 5 vs. Buffalo Dec. 19, 1971 5 vs. L.A. Raiders Sept. 12, 1985 5 vs. Cincinnati Nov. 13, 1988 5 at Chicago Dec. 29, 1990 5 vs. Denver Sept. 20, 1993 5 vs. Minnesota Oct. 2, 2011 5 at Houston Oct. 8, 2017 5 vs. Denver Oct. 30, 2017 5 vs. Miami Dec. 24, 2017 5 vs. Denver Dec. 6, 2020 Most Field Goals Made, Both Teams, Game *9 Kansas City (4) at San Diego (5) Sept. 29, 1996 8 Kansas City (5) vs. Buffalo (3) Dec. 19, 1971 8 Kansas City (4) vs. Denver (4) Sept. 28, 2008 7 Kansas City (5) vs. Buffalo (2) Dec. 7, 1969 7 Kansas City (4) vs. Denver (3) Dec. 16, 2001 7 Kansas City (3) at Indianapolis (4) Oct. 10, 2010 7 Kansas City (6) at New Orleans (1) Sept. 23, 2012 7 Kansas City (7) at Cincinnati (0) Oct. 4, 2015 7 Kansas City (5) vs. Denver (2) Oct. 30, 2017 7 Kansas City (5) vs. Miami (2) Dec. 24, 2017 *NFL RECORD Most Consecutive Games Scoring Field Goals 19 2021-22 18 2001-02 16 2017-18, 2019-20 15 2005 14 1970
Safeties, Season 3 1988, 1997 Most Safeties, Game 1 23 times; Last at San Francisco Oct. 23, 2022
Most First Downs, Season 419 2021 408 2022 398 2004 397 2020 387 2022 Fewest First Downs, Season
SAFETIES Most
FIRST DOWNS
RUSHING FIRST DOWNS
FIRST DOWNS BY PENALTY
NET YARDS PASSING AND RUSHING
PASSING FIRST DOWNS
20 @CHIEFS 163 1982 (9 games) 183 1970 208 1973 Most First Downs, Game (All 30+) 36 vs. Atlanta Oct. 24, 2004 36 at Las Vegas Nov. 22, 2020 34 at New Orleans Dec. 20, 2020 33 vs. Indianapolis Oct. 31, 2004 33 vs. Cincinnati Oct. 21, 2018 33 vs. Los Angeles Chargers Sept. 26, 2021 33 at Arizona Sept. 11, 2022 33 at Houston Dec. 18, 2022 32 at Houston Oct. 24, 1965 32 at Seattle Nov. 24, 2002 32 vs. Oakland Dec. 25, 2004 31 at Oakland Nov. 5, 2000 31 vs. San Francisco Sept. 23, 2018 31 at Philadelphia Oct. 3, 2021 30 vs. Cleveland Nov. 9, 2003 30 at L.A. Raiders Dec. 22, 1991 30 vs. Seattle Oct. 29, 2006 30 at Denver Nov. 14, 2010 30 vs. Baltimore Dec. 9, 2018 Fewest First Downs, Game 4 at Tampa Bay Dec. 16, 1979 5 at San Diego Dec. 12, 2010 7 at Boston Oct. 23, 1964 7 at Oakland Dec. 12, 1970 7 at Denver Dec. 9, 2007 7 at Oakland Dec. 16, 2012 8 12 times; Last at Denver Dec. 30, 2012 Most First Downs, Both Teams, Game 64 KC (32) at Seattle (32) Nov. 24, 2002 62 KC (31) at Oakland (31) Nov. 5, 2000 61 KC (36) at Las Vegas (25) Nov. 22, 2020 61 KC (31) at Philadelphia (30) Oct. 3, 2021 59 KC (26) at Seattle (33) Nov. 27, 1983 (OT) 58 KC (24) at Denver (34) Nov. 18, 1974 Fewest First Downs, Both Teams, Games 15 Kansas City (7) vs. Denver (8) Dec. 6, 1970 18 Kansas City (7) at Boston (11) Oct. 23, 1964
Most Rushing First Downs, Season 160 1978, 1981 140 2002 138 2004, 2005 130 1980 129 1969, 1997, 2010 Fewest Rushing First Downs, Season 66 2007 71 1982 (9 games) 79 1985 83 1970, 1983, 1986 84 2000 Most Rushing First Downs, Game 21 vs. Atlanta Oct. 24, 2004 20 vs. Houston Oct. 1, 1961 18 vs. Oakland Oct. 20, 1968 18 vs. Seattle Nov. 22, 1981 18 at Detroit Nov. 28, 1996 16 8 times; Last vs. Buffalo Oct. 7, 1991 Fewest Rushing First Downs, Game *0 at Cincinnati Nov. 24, 1974 0 vs. Pittsburgh Nov. 10, 1985 0 at L.A. Raiders Dec. 6, 1992 0 at Denver Oct. 27, 1996 0 at Arizona Oct. 8, 2006 0 vs. Jacksonville Oct. 7, 2007 0 at Oakland Dec. 16, 2012 1 12 times; Last vs. Pittsburgh Oct. 15, 2017 *NFL RECORD
Most Passing First Downs, Season 272 2022 267 2021 255 2020 239 2018 228 2004 Fewest Passing First Downs, Season 79 1982 (9 games) 86 1970 89 1968 91 1979 93 1973 Most Passing First Downs, Game (All 20+) 26 vs. Oakland Dec. 25, 2004 24 at Denver Nov. 14, 2010 23 at Oakland Nov. 5, 2000 23 at Las Vegas Nov. 14, 2021 23 vs. Tennessee Nov. 6, 2022 22 at Las Vegas Nov. 22, 2020 22 at Arizona Sept. 11, 2022 21 at Dallas Nov. 20, 1983 21 at Denver Oct. 17, 1994 21 at Denver Dec. 7, 2003 21 at Houston Oct. 8, 2017 21 at Los Angeles Rams Nov. 19, 2018 21 at Washington Oct. 17, 2021 20 vs. Indianapolis Oct. 31, 2004 20 at Tennessee Nov. 10, 2019 20 at Los Angeles Chargers Dec. 16, 2021 20 vs. Los Angeles Rams Nov. 27, 2022 20 at Houston Dec. 18, 2022 Fewest Passing First Downs, Game 1 vs. Oakland Oct. 20, 1968 1 vs. Houston Sept. 10, 1978 1 at Tampa Bay Dec. 16, 1979 2 5 times; Last at Denver Dec. 30, 2012
Most Penalty First Downs, Season 46 2019 37 2018 34 2013 33 1996, 1998, 2021 32 2004, 2015, 2020 Fewest Penalty First Downs, Season 4 1969 8 1965 9 1973 10 1999 11 1968, 1972 Most Penalty First Downs, Game 9 vs. L.A. Raiders Oct. 3, 1993 7 vs. L.A. Raiders Sept. 17, 1989 7 vs. Seattle Oct. 17, 1996 7 vs. San Francisco Sept. 23, 2018 6 at Tennessee Dec. 13, 2004 6 at Oakland Nov. 7, 2010 5 12 times; Last vs. Buffalo Oct. 11, 2021 Fewest Penalty First Downs, Game 0 Many times; Last, at Denver Dec. 11, 2022
Most Net Yards, Season 7,032 2022 6,810 2018 6,746 2021 6,695 2004 6,653 2020 Most Net Yards, Consecutive Seasons 13,778 2021-22 (6,746, 7,032) 13,399 2020-21 (6,653, 6,746) 12,887 2004-05 (6,695, 6,192) 12,877 2018-19 (6,810, 6,067) 12,817 2017-18 (6,007, 6,810) Fewest Net Yards, Season 2,498 1982 (9 games) 3,536 1973 3,577 1970 3,828 1974 3,936 1977 Most Net Yards, Game (All 500+) 614 at Denver Oct. 23, 1966 590 vs. Indianapolis Oct. 31, 2004 566 vs. Detroit Oct. 14, 1990 552 at Seattle Nov. 24, 2002 551 vs. Buffalo Sept. 30, 1962
RUSHING ATTEMPTS
21 @CHIEFS 551 vs. Cincinnati Oct. 21, 2018 546 at Washington Sept. 30, 2001 546 at Los Angeles Rams Nov. 19, 2018 543 at Tampa Bay Nov. 29, 2020 542 at Houston Oct. 24, 1965 540 vs. Atlanta Oct. 24, 2004 537 at San Diego Dec. 11, 1983 537 vs. Cincinnati Jan. 1, 2006 537 at New England Sept. 7, 2017 530 at Tennessee Nov. 10, 2019 529 at San Francisco Oct. 23, 2022 524 at Denver Jan. 3, 2010 521 vs. Detroit Dec. 14, 2003 520 vs. Denver Nov. 1, 1964 517 at Baltimore Sept. 28, 2020 516 at Las Vegas Nov. 14, 2021 513 at Oakland Nov. 5, 2000 512 vs. Seattle Dec. 27, 1987 510 vs. Houston Nov. 28, 1965 510 at New Orleans Sept. 23, 2012 508 at Cincinnati Sept. 28, 1969 507 vs. Indianapolis Dec. 23, 2012 506 vs. San Diego Oct. 14, 1984 504 at New Orleans Sept. 8, 1985 504 at N.Y. Jets Oct. 6, 2002 503 at Seattle Nov. 28, 2010 503 vs. L.A. Chargers Dec. 29, 2019 502 at Buffalo Oct. 3, 1976 502 at Houston Dec. 18, 2022 500 at Oakland Dec. 5, 2004 Fewest Net Yards, Game 62 vs. Oakland Nov. 8, 1963 67 at San Diego Dec. 12, 2010 80 at Tampa Bay Dec. 16, 1979 104 at Buffalo Oct. 29, 1973 106 at Oakland Dec. 8, 1973 Most Net Yards, Both Teams, Game 1,095 KC (590) vs. Indianapolis (505) Oct. 31, 2004 1,086 KC (552) at Seattle (534) Nov. 24, 2002 1,036 KC (524) at Denver (512) Jan. 3, 2010 1,013 KC (537) at San Diego (476) Dec. 11, 1983 1,001 KC (546) at L.A. Rams (455) Nov. 19, 2018 986 KC (513) at Oakland (473) Nov. 5, 2000 Fewest Net Yards, Both Teams, Game 323 KC (178) at N.Y. Jets (145) Nov. 7, 1971 335 KC (244) vs. Houston (91) Oct. 12, 1969 338 KCâ (62) vs. Oakland (276) Nov. 8, 1963 Most Games, 400 or More Net Yards, Season 11 2018 10 2020 9 2004, 2022 7 2005, 2010, 2017, 2021 6 1994, 2000, 2002, 2019 5 1969, 2001, 2003 4 1960, 1961, 1962, 1976, 1983, 1997, 2016 Most Consecutive Games, 400 or More Net Yards 5 2004, 2020, 2022 4 1976, 2005, 2018, 2019 3 1974, 2000, 2010, 2018, 2021 Most Games, 300 or More Net Yards, Season 16 2022 15 2004, 2018, 2021 14 2005, 2019, 2020 13 2002, 2017 12 1989, 1995, 1999, 2003, 2010, 2013, 2015 Most Consecutive Games, 300 or More Net Yards 19 2021-22 18 2017-18 16 2004-05 13 2001-02 11 2005 10 1966-67, 1989, 2003, 2019-2020 Most Plays, Season 1,134 2021 1,098 1994 1,094 2022 1,089 2004 1,074 1983 Fewest Plays, Season 573 1982 (9 games) 712 2017 775 1970 831 1968 833 1965 836 1971 Most Plays, Game 92 at New Orleans Sept. 23, 2012 92 at New Orleans Dec. 20, 2020 91 at Cincinnati Sept. 3, 1978 91 vs. Tennessee Nov. 6, 2022 86 vs. N.Y. Giants Nov. 3, 1974 86 vs. Seattle Sept. 28, 1997 85 at Jacksonville Nov. 9, 1997 84 vs. Denver Oct. 24, 1976 84 at San Diego Nov. 12, 1978 Fewest Plays, Game 38 at Oakland Dec. 12, 1970 38 at Tampa Bay Dec. 16, 1979 41 at San Diego Oct. 7, 1962 41 at San Diego Dec. 12, 2010 42 at Oakland Dec. 8, 1973 44 at Detroit Nov. 25, 1971 44 at New England Oct. 11, 1998 44 at Baltimore Sept. 13, 2009
Most Rushing Attempts, Season 663 1978 610 1981 569 1979 559 1989 556 2010 552 1980 Most Rushing Attempts, Consecutive Seasons 1,232 1978-79 (663, 569) 1,162 1980-81 (552, 610) 1,121 1979-80 (569, 552) 1,089 1977-78 (456, 663) 1,063 1989-90 (559, 504) Fewest Rushing Attempts, Season 269 1982 (9 games) 375 2019 379 2008 383 2000, 2007 387 1983, 2018 400 1963 Most Rushing Attempts, Game 69 at Cincinnati Sept. 3, 1978 60 vs. Oakland Oct. 20, 1968 57 vs. Seattle Nov. 5, 1989 Fewest Rushing Attempts, Game 9 at Oakland Nov. 5, 2000 10 vs. Jacksonville Oct. 7, 2007 10 at Oakland Dec. 16, 2012 11 at New England Oct. 11, 1998 11 at New York Jets Dec. 3, 2017 11 vs. Houston Texans Oct. 13, 2019 12 at Oakland Dec. 8, 1973 12 at Denver Oct. 27, 1996 13 vs. Buffalo Nov. 23, 2008
Rushing Attempts, Both Teams, Game 102 KC (52) at San Diego (50) Nov. 12, 1978 (OT) 100 KC (41) vs. Denver (59) Sept. 24, 1978
Rushing Attempts, Both Teams, Game 37 KC (21) vs. Houston (16) Dec. 16, 1990 39 KC (25) at Las Vegas (14) Nov. 14, 2021 40 KC (17) at Buffalo (23) Dec. 12, 1965 40 KC (16) vs. Denver (24) Jan. 1, 2023
Games, 40 or More Rushing Attempts, Season
1978
Most
Fewest
Most
9
8 1973, 1981 7 1968 6 1962, 1969, 1989 5 1976, 1979, 1980, 1997, 2010 Most Games, 30 or More Rushing Attempts, Season 14 1978 13 1981 12 1971, 1975, 1980 11 1969, 1989, 1990, 2005, 2006
10 1968, 1972, 1973, 1974, 1979, 1995, 1999, 2010
Most Consecutive Games, 40 or More Rushing Attempts
4 1968, 1978
3 1962, 1973, 1996
Most Consecutive Games, 30 or More Rushing Attempts
15 1980-81
8 1975, 1977-78
7 1972, 1978, 1978-79
6 1970, 1980, 1989, 1999
YARDS
Fewest Rushing Yards, Both Teams, Game
Most 10+ Yard Rushes, Season (Since 1990)
Most Rushing Yards, Game (All 300+)
RUSHING TOUCHDOWNS
22 @CHIEFS
2,986 1978 2,633 1981 2,627 2010 2,407 1962 2,395 2012 Most Rushing Yards, Home, Season 1,488 1981 1,468 1962 1,463 2010 1,436 1978 1,390 1961 Most Rushing Yards Per Game, Season 213.3 1978 (2,986 in 16 games) 171.9 1962 (2,407 in 14 games) 164.6 1981 (2,633 in 16 games) 164.2 2010 (2,627 in 16 games) 162.4 1966 (2,274
14 games) Most Rushing Yards Per Game, Home, Season 209.7 1962 (1,468 in 7 games) 198.6 1961 (1,390 in 7 games) 186.0 1981 (1,488 in 8 games) 182.9 2010 (1,463 in 8 games) 179.5 1978 (1,436 in 8 games) Most Rushing Yards, Consecutive Seasons 5,302 1978-79 (2,986, 2,316) 4,829 1977-78 (1,843, 2,986) 4,671 2004-05 (2,289, 2,382) 4,590 1961-62 (2,183, 2,407) Fewest Rushing Yards, Season 943 1982 (9 games) 1,248 2007 1,254 1983 1,351 2017 1,465 2000 1,468 1986 Fewest Rushing Yards Per Game, Season 78.0 2007 (1,248 in 16 games) 78.4 1983 (1,254 in 16 games) 91.6 2000 (1,465 in 16 games) 91.8 1986 (1,468 in 16 games) 92.9 1985
Most Rushing Yards, Season
in
(1,486 in 16 games)
398 vs. Houston Oct. 1, 1961 380 at Denver Oct. 23, 1966 352 vs. Indianapolis Dec. 23, 2012 320 vs. Buffalo Sept. 30, 1962 317 at Denver Jan. 3, 2010 313 vs. Cincinnati Oct. 26, 1969 310 vs. Detroit Oct. 14, 1990 302 at Houston Oct. 24, 1965
0 vs. Denver Dec. 19, 1965 10 vs. Jacksonville Oct. 7, 2007 10 at Oakland Dec. 16, 2012 14 at New England Oct. 11, 1998 16 at Denver Dec. 9, 2007 17 at Boston Nov. 18, 1960 17 at L.A. Raiders Dec. 6, 1992
8 1978 6 2010 5 1962 4 1968, 1979, 1981, 2002 3 1961,
1991, 2001, 2004, 2012 2 1960,
1965, 1966, 1969,
1996, 1997, 2005, 2006
519 Kansas City (168) vs. Cleveland (351) Dec. 20, 2009 502 Texans (398) vs. Houston (104) Oct. 1, 1961 502 Texans (284) vs. Oakland (218) Nov. 26, 1961 479 Kansas City (251) vs. Detroit (228) Nov. 23, 1975
Fewest Rushing Yards, Game
Most Games, 200 or More Rushing Yards
1967,
1963,
1970, 1975, 1989,
Most Rushing Yards, Both Teams, Game
75 KC (20) at Houston (55) Sept. 29, 1974 105 KC (27) vs. Boston (78) Nov. 17, 1968 111 Dallas Texans (108) at SD (3) Nov. 19, 1961 111 KC (48) at San Diego (63) Oct. 13, 1985
73 2002 72 2010 67 2005 64 2012 63 2001 Most 10+ Yard Rushes, Game (Since 1990) 11 at Oakland (10 Holmes, 1 Cloud) Dec. 9, 2001 10 at Seattle (9 Holmes, 1 Morton) Nov. 24, 2002 10 vs. Buffalo (7 Charles, 3 Jones) Oct. 31, 2010 9 vs. Detroit (5 Word, 3 Okoye, 1 McNair) Oct. 14, 1990 9 vs. Denver (5 Richardson, 2 Grbac, 1 Alexander, 1 Moreau) Dec. 17, 2000 9 vs. Atlanta (6 Holmes, 3 Blaylock, 1 Hall) Oct. 24, 2004 9 vs. Indianapolis (6 Holmes, 2 Morton, 1 Johnson) Oct. 31, 2004 9 vs. Indianapolis (4 Charles, 4 Hillis, 1 McCluster) Dec. 23, 2012 Highest Rushing Average, Season 5.18 1966 5.15 2002 5.03 1962 4.97 1961 4.91 2017 Lowest Rushing Average, Season 3.24 1983 3.26 2007 3.39 1980 3.40 1986 3.43 1992
Most Rushing Touchdowns, Season 32 2003 31 2004 26 2002, 2005 24 1960 23 1961 Most Rushing Touchdowns, Consecutive Seasons *63 2003-04 (32, 31) 58 2002-03 (26, 32) 57 2004-05 (31, 26) 47 1960-61 (24, 23) 44 1961-62 (23, 21) *NFL RECORD Fewest Rushing Touchdowns, Season 3 1982 (9 games) 5 2011 6 1972, 2007 7 1987 8 1988, 2009 Most Rushing Touchdowns, Game *8 vs. Atlanta Oct. 24, 2004 5 at Denver Oct. 23, 1966 4 14 times; Last vs. Detroit Nov. 1, 2015 *NFL RECORD Most Rushing Touchdowns, Both Teams, Game 8 Kansas City (8) vs. Atlanta (0) Oct. 24, 2004 7 Texans (4) vs. Boston (3) Sept. 8, 1962 7 Kansas City (4) at Denver (3) Oct. 10, 1965
Highest Passer Rating, Season 113.8 2018 107.3 2020 104.7 2022 104.4 2019 100.8 2017 Lowest Passer Rating, Season 52.7 1961 52.9 1977 54.0 1979 55.2 1974 59.3 1978 PASSING ATTEMPTS
PASSING RATING
Most
9 at Denver (9 Cassel)
9 at L.A. Rams (9 Mahomes)
8 at Oakland (8 Mahomes)
8 at Miami (8 Mahomes)
1 Morris)
14, 2010
19, 2018
15, 2019
13, 2020
7 at L.A. Raiders (7 Krieg) Dec. 6, 1992
7 at San Diego (7 Gannon) Nov. 22, 1998
7 at Oakland (7 Grbac)
7 at Arizona (7 Green)
7 vs. Indianapolis (7 Green)
7 at New York Jets (7 Smith)
7 at Cleveland (7 Mahomes)
7 at Tampa Bay (7 Mahomes)
7 at Los Angeles Chargers (7 Mahomes)
7 at San Francisco (7 Mahomes)
PASSING YARDS
Nov. 5, 2000
Oct. 21, 2001
Oct. 31, 2004
Dec. 3, 2017
Nov. 4, 2018
Nov. 29, 2020
Dec. 16, 2021
Oct. 23, 2022
Most
23 @CHIEFS Most Passes Attempted, Season 675 2021 651 2022 641 1983 630 2020 615 1994 Most Passes Attempted, Consecutive Seasons 1,326 2021-22(675, 651) 1,305 2020-21 (630, 675) 1,234 1983-84 (641, 593) 1,206 2019-20 (576, 630) 1,159 2018-19 (583, 576) Fewest Passes Attempted, Season 264 1982 (9 games) 270 1968 289 1970 313 1973 322 1962 Most Passes Attempted, Game 68 vs. Tennessee Nov. 6, 2022 59 at Dallas Nov. 20, 1983 55 at San Diego Oct. 9, 1994 55 at Miami Dec. 12, 1994 54 at Denver Nov. 16, 1986 54 at Denver Oct. 17, 1994 54 at San Diego Sept. 29, 1996 54 vs. San Diego Nov. 24, 1996 54 vs. Buffalo Oct. 10, 2021 Fewest Passes Attempted, Game 3 vs. Oakland Oct. 20, 1968 6 at Oakland Dec. 13, 1969 10 vs. Denver Sept. 24, 1978 Most Passes Attempted, Both Teams, Game 100 KC (46) vs. Tampa Bay (54) Oct. 28, 1964 95 KC (54) at San Diego (41) Sept. 29, 1996 95 KC (46) at L.A. Rams (49) Nov. 19, 2018 95 KC (45) vs. Carolina (50) Nov. 8, 2020 94 KC (52) at Denver (42) Oct. 30, 1983 94 KC (46) at New England (48) Dec. 4, 2000 Fewest Passes Attempted, Both Teams, Game 26 KC (6) at Oakland (20) Dec. 13, 1969 26 KC (13) at Tampa Bay (13) Dec. 16, 1979 27 KC (14) vs. Houston (13) Sept. 10, 1978
Most Passes Completed, Season 448 2021 435 2022 420 2020 385 2018 378 2019 Most Passes Completed, Consecutive Seasons 883 2021-22 (448, 435) 868 2020-21 (420, 448) 798 2019-20 (378, 420) 763 2018-19 (385, 378) 748 2017-18 (363, 385) Fewest Passes Completed, Season 145 1982 (9 games) 154 1970 156 1968 Most Passes Completed, Game 43 vs. Tennessee Nov. 6, 2022 39 at Oakland Nov. 5, 2000 37 at San Diego Oct. 9, 1994 37 at Tampa Bay Nov. 29, 2020 36 at Tennessee Nov. 10, 2019 36 at Las Vegas Nov. 14, 2021 36 at Houston Dec. 18, 2022 35 vs. N.Y. Jets Nov. 1, 2020 34 at Denver Oct. 17, 1994 34 at Denver Dec. 7, 2003 34 vs. San Diego Sept. 11, 2016 33 at Dallas Nov. 20, 1983 33 at Miami Dec. 12, 1994 33 at San Diego Jan. 2, 2005 33 at Detroit Dec. 23, 2007 33 at Denver Nov. 14, 2010 33 at Los Angeles Rams Nov. 19, 2018 33 vs. Buffalo Oct. 10, 2021 Fewest Passes Completed, Game 2 vs. Oakland Oct. 20, 1968 2 at Oakland Dec. 13, 1969 5 7 times: Last at Seattle Dec. 17, 1978
Passes Completed, Both Teams, Game (60+) 67 Kansas City (30) vs. Carolina (37) Nov. 8, 2020 64 Kansas City (33) at L.A. Rams (31) Nov. 19, 2018 64 Kansas City (37) at Tampa Bay (27) Nov. 29, 2020 62 Kansas City (31) at San Diego (31) Dec. 11, 1983 62 Kansas City (23) at Tampa Bay (39) Oct. 2, 2022 61 Kansas City (35) at Las Vegas (25) Nov. 14, 2021
Passes Completed, Both Teams, Game 11 Kansas City (10) vs. San Diego (1) Sept. 20, 1998 12 Kansas City (7) at Tampa Bay (5) Dec. 16, 1979 13 Kansas City (2) at Oakland (11) Dec. 13, 1969 13 Kansas City (8) vs. Boston (5) Oct. 11, 1970
COMPLETIONS
Most
Fewest
20+ Yard Completions,
76 2018 73 2022 69 2020 60 2004 59 2000, 2019 58 2021
20+ Yard Completions, Game
9 vs. St. Louis (6 Grbac, 2 Moon,
Oct.
Season (Since 1990)
Most
(Since 1990)
22, 2000
Nov.
Nov.
Sept.
Dec.
Net Passing Yards, Season 5,062 2022 4,955 2018 4,854 2020 4,791 2021 4,498 2019
Net Passing Yards, Consecutive Seasons 9,853 2021-22 (4,791, 5,062) 9,645 2020-21 (4,854, 4,791) 9,453 2018-19 (4,955, 4,498) 9,352 2019-20 (4,498, 4,854) 9,059 2017-18 (4,104, 4,955) Fewest Passing Yards, Season 1,555 1982 (9 games) 1,660 1979 1,719 1970 Most Gross Passing Yards, Game (All 400+) 504 at Oakland Nov. 5, 2000 478 at L.A. Rams Nov. 19, 2018 469 at Denver Nov. 14, 2010 462 at Tampa Bay Nov. 29, 2020 446 at Tennessee Nov. 10, 2019 446 vs. N.Y. Jets Nov. 1, 2020 446 vs. Tennessee Nov. 6, 2022 443 at Oakland Sept. 15, 2019 435 vs. Denver Nov. 1, 1964 433 at Tennessee Nov. 10, 2019 432 at Dallas Nov. 20, 1983 423 at San Francisco Oct. 23, 2022 422 at Las Vegas Nov. 14, 2021 412 vs. Denver Dec. 19, 1965 411 at San Diego Dec. 11, 1983 410 at Los Angeles Chargers Dec. 16, 2021 400 at Green Bay Oct. 12, 2003
Net Passing Yards, Game 474 at Oakland Nov. 5, 2000 456 at Tampa Bay Nov. 29, 2020 448 at L.A. Rams Nov. 19, 2018 446 vs. N.Y. Jets Nov. 1, 2020 433 at Denver Nov. 14, 2010 433 at Oakland Sept. 15, 2019 422 at Las Vegas Nov. 14, 2021
Most
Most
SACKS
INTERCEPTIONS
24 @CHIEFS 422 vs. Tennessee Nov. 6, 2022 417 at San Francisco Oct. 23, 2022 410 at Los Angeles Chargers Dec. 16, 2021 406 at San Diego Dec. 11, 1983 400 at Green Bay Oct. 12, 2003
Gross Passing Yards, Game 16 vs. Oakland Oct. 20, 1968 39 vs. Houston Nov. 15, 1981 42 at Seattle Sept. 30, 1979 44 at Denver Oct. 8, 1961 46 at Tampa Bay Dec. 16, 1979
Net Passing Yards, Game -22 vs. Oakland Nov. 8, 1963 15 at Seattle Sept. 30, 1979 16 vs. Oakland Oct. 20, 1968 18 at Denver Oct. 4, 1970 19 at San Diego Dec. 12, 2010
Fewest
Fewest
Both Teams, Game 859 Kansas City (387) vs. Indianapolis (472) Oct. 31, 2004 827 Kansas City (448) at L.A. Rams (379) Nov. 19, 2018 798 Kansas City (456) at Tampa Bay (342) Nov. 29, 2020 782 Kansas City (406) at San Diego (376) Dec. 11, 1983 764 Kansas City (322) at Pittsburgh (442) Sept. 16, 2018 760 Kansas City (417) at San Francisco (343) Oct. 23, 2022 748 Kansas City (331) at Oakland (417) Oct. 19, 2017 732 Kansas City (433) at Denver (299) Nov. 14, 2010 716 Kansas City (474) at Oakland (242) Nov. 5, 2000
Passing Yards, Both Teams, Game 67 Kansas City (22) at Tampa Bay (45) Dec. 16, 1979 81 Kansas City (34) vs. Houston (47) Sept. 10, 1978
Individual
Receiving Games, Season 14 2000, 2004 11 1964, 2018 10 2022 9 2017, 2020, 2021 8 1966, 1983 7 1987, 2003, 2006, 2007, 2016, 2019
Season 7 2000 6 2004, 2020 4 1964, 2016,
2021 3 1966,
2007, 2010, 2022 (2 times) 2 1961, 1962, 1963, 1965, 1968, 1969, 1980, 1982, 1983, 1985, 1987, 1988, 1989, 1998, 1999, 2001, 2006, 2007, 2008, 2011, 2017 (3 times), 2018, 2019 Most Consecutive Seasons Leading League, Completion Percentage *4 1966-69 *NFL RECORD COMPLETION PERCENTAGE Highest Completion Percentage, Season 66.85 (543-363) 2017 66.85 (546-365) 2016 66.82 (651-435) 2022 66.67 (630-420) 2020 66.37 (675-448) 2021 Lowest Completion Percentage, Season 44.36 1961 (399-177) 48.05 1960 (435-209) 48.90 1965 (409-200) 49.33 1986 (521-257) 50.38 1965 (395-199)
TOUCHDOWNS Most Passing Touchdowns, Season 50 2018 41 2022 40 2020 37 2021 32 1964 Fewest Passing Touchdowns, Season 7 1978, 1979 8 2012 10 1973, 1982 (9 games) 11 1974, 1977 13 1981, 2011 Most Passing Touchdowns, Game 6 vs. Denver Nov. 1, 1964 6 at Pittsburgh Sept. 16, 2018 6 at Los Angeles Rams Nov. 19, 2018 5 11 times; Last at Arizona Sept. 11, 2022 Most Passing Touchdowns, Both Teams, Game 10 Kansas City (6) at L.A. Rams (4) Nov. 19, 2018 9 Kansas City (4) at Denver (5) Nov. 14, 2010 9 Kansas City (6) at Pittsburgh (3) Sept. 16, 2018 8 Kansas City (6) vs. Denver (2) Nov. 1, 1964 8 Kansas City (4) at San Diego (4) Dec. 11, 1983 8 Kansas City (3) vs. IND (5) Oct. 31, 2004
Most Net Passing Yards,
Fewest
Most
100-Yard
Most Consecutive Individual 100-Yard Receiving Games,
2018,
1984, 1992, 1994, 2005,
PASSING
Most Consecutive Games Without Allowing A Sack 3 1988, 2000 Most Times Sacked, Season 57 1980 55 2007 53 1975 Fewest Times Sacked, Season 19 1994 21 1978, 1991, 1995, 2003 22 1990 Most Times Sacked, Game 10 vs. Baltimore Nov. 2, 1980 9 vs. San Diego Dec. 2, 2007 8 at Pittsburgh Dec. 5, 1982 8 vs. L.A. Raiders Dec. 12, 1982 Most Times Sacked, Both Teams, Game 13 Kansas City (2) vs. Cleveland (11) Sept. 30, 1984 13 Kansas City (6) vs. Houston (7) Sept. 21, 1986
Passes Had Intercepted, Season 27 1961 26 1977 25 1974 Fewest Passes Had Intercepted, Season 5 1990, 2019 6 2014 7 2015, 2020 8 1982 (9 games), 2010, 2016, 2017 9 2013 10 1993, 1994, 1997, 2005 Most Passes Had Intercepted, Game 7 vs. Pittsburgh Oct. 13, 1974 6 at Seattle Nov. 4, 1984 6 vs. L.A. Raiders Oct. 20, 1985 Most Passes Had Intercepted, Both Teams, Game 9 Kansas City (3) vs. Miami (6) Nov. 13, 1966 8 8 times, Last; Kansas City (2) at Oakland (6) Oct. 23, 2011 PUNTING
Seasons Leading League (Average Distance) *6 1968, 1971-73, 1979, 1984 *NFL RECORD Most Consecutive Seasons Leading League 3 1971-73 Most Punts, Season 104 1999 99 1986 98 1984 Fewest Punts, Season 38 1982 (9 games) 40 2021 45 2018 49 2019 52 2020 Most Punts, Game 11 at N.Y. Jets Sept. 18, 1965 11 vs. Baltimore Sept. 2, 1979 11 at San Francisco Nov. 17, 1985 11 at Cleveland Nov. 19, 1989 11 vs. San Diego Nov. 13, 1994 11 at Chicago Dec. 4, 2011 10 vs. Denver Oct. 6, 1974 10 at Oakland Oct. 5, 1980 10 at N.Y. Jets Oct. 2, 1988 10 at San Diego Nov. 26, 2000 10 at N.Y. Jets Dec. 30, 2007 10 at Jacksonville Sept. 8, 2013 Fewest Punts, Game 0 at L.A. Raiders Dec. 22, 1991 0 vs. Carolina Dec. 10, 2000 0 vs. Cincinnati Oct. 21, 2018
Most
Most
PUNTING AVERAGE
KICKOFF RETURNS
PUNTS BLOCKED
PUNT RETURNS
KICKOFF RETURN YARDS
KICKOFF RETURN TOUCHDOWNS
25 @CHIEFS 0 at Philadelphia Oct. 3, 2021
Highest Punting Average Distance, Season 50.42 2022 (53-2,672) 46.83 2012 (83-3,887) 46.70 2021 (40-1,768) 45.89 2011 (89-4,084) 45.53 1973 (80-3,642) Lowest Punting Average Distance, Season 36.06 1962 (54-1,947) 37.83 2002 (64-2,422) 38.53 1981 (70-2,697)
Most Punts Had Blocked, Season 2 1974, 1975, 1985, 1999 Most Punts Had Blocked, Game 2 vs. Denver Oct. 27, 1985
Most Seasons Leading League (Average Return) 6 1960, 1968, 1970, 1979-80, 2003 Most Punt Returns, Season (All 50+) 59 2013 58 1979, 1995, 1999 52 2010 Fewest Punt Returns, Season 15 1982 (9 games) 19 2021 22 2018 24 2004 26 1961, 1963, 2008 Most Punt Returns, Game 9 at Oakland Nov. 15, 2009 8 vs. San Diego Nov. 10, 1974 8 at St. Louis Dec. 19, 2010 7 vs. Oakland Sept. 23, 1979 7 vs. N.Y. Giants Oct. 21, 1979 7 vs. Detroit Sept. 26, 1999 7 at Denver Dec. 5, 1999 7 at Oakland Oct. 21, 2007 7 at Jacksonville Sept. 8, 2013 7 at Washington Dec. 8, 2013 Most Punt Returns, Both Teams, Game 15 Kansas City (6) vs. Baltimore (9) Sept. 2, 1979
Most Punt Return Yards, Season (All 600+) 695 2013 640 1999 612 1979 Fewest Punt Return Yards, Season 126 1972 129 1982 (9 games) 150 1971 Most Punt Return Yards, Game 177 at Washington Dec. 8, 2013 160 vs. San Diego Sept. 13, 2010 141 vs. Oakland Sept. 23, 1979 139 at Denver Dec. 5, 1999 131 vs. Boston Dec. 11, 1960 Highest Punt Return Average, Season 16.42 2003 (33-542) 15.03 1960 (33-496) 14.80 2016 (40-592) 14.53 1980 (40-581) 14.52 1968 (31-450) Lowest Punt Return Average, Season 4.34 1972 (29-126) 4.69 1971 (32-150) 5.82 2020 (28-163) 6.29 2017 (35-220) 6.50 2008 (26-169) PUNT RETURN TOUCHDOWNS Most Punt Return Touchdowns, Season 2 1968, 1979, 1980, 1992, 1999, 2002, 2003, 2013, 2016 1 1960, 1965, 1966, 1987, 1995, 1997, 2006, 2010, 2017, 2018, 2020 Most Punt Return Touchdowns, Game 1 30 times; Last at Miami Dec. 13, 2020 Most Punt Return Touchdowns, Both Teams, Game *2 Kansas City (1) at Buffalo (1) Sept. 11, 1966 *NFL RECORD
PUNT RETURN YARDS
Most Kickoff Returns, Season 80 2008 77 2009 75 2004 70 1987, 2000 68 2005 Fewest Kickoff Returns, Season 25 2020 30 2021 31 1973 34 1982 (9 games) 35 2015 Most Kickoff Returns, Game 11 vs. Buffalo Nov. 23, 2008 10 vs. Oakland Nov. 2, 1967 10 vs. Seattle Sept. 20, 1987 9 vs. Pittsburgh Nov. 10, 1985
Most Kickoff Return Yards, Season 1,820 2004 1,716 2008 1,666 2009 1,591 2005 1,577 2003 Fewest Kickoff Return Yards, Season 646 2020 692 2022 702 2021 722 1992 723 1982 (9 games) Most Kickoff Return Yards, Game 251 at Miami Dec. 12, 1994 245 at San Diego Oct. 15, 1967 236 vs. Pittsburgh Nov. 10, 1985 Highest Kickoff Return Average, Season *29.91 2013 (44-1,316) 27.64 1961 (53-1,465) 26.59 1969 (41-1,090) 25.84 2020 (25-646) 25.81 1962 (37-955) *NFL RECORD Lowest Kickoff Return Average, Season 16.52 1988 (56-925) 17.04 1990 (46-784) 17.20 1983 (54-929)
Most Kickoff Return Touchdowns, Season 2 1987, 1995, 2003, 2004, 2013 1 1961, 1963, 1967, 1969, 1986, 1994, 1996, 1997, 2002, 2005, 2009, 2014, 2016, 2019, 2020 Most Kickoff Return Touchdowns, Game 1 25 times; Last at Denver Oct. 25, 2020
Most Fumbles, Season 42 1980 Fewest Fumbles, Season 7 2002 13 1982 (9 games), 2003 14 2017 15 2010 16 2015 Most Fumbles, Game *10 vs. Houston Oct. 12, 1969 *NFL RECORD Most Fumbles, Both Teams, Game *14 Kansas City (10) vs. Houston (4) Oct. 12, 1969 *NFL RECORD Most Fumbles Lost, Season 24 1981, 1987 21 1965, 1977 Fewest Fumbles Lost, Season
FUMBLES
YARDS PENALIZED
26 @CHIEFS *2 2002 3 2017 4 1982 (9 games) 6 2003, 2010, 2018 8 1967, 1991, 2008, 2015 *NFL RECORD Most Fumbles Lost, Game 6 vs. Houston Oct. 12, 1969 Most Turnovers, Season 47 1977 46 1981 41 1965, 1987, 1989 40 1964 Fewest Turnovers, Season 11 2017 12 1982 (9 games) 14 2010 15 2002, 2015, 2019 16 2020 17 2014, 2016 Most Turnovers, Game 9 vs. Buffalo Oct. 17, 1965 9 vs. Pittsburgh Oct. 13, 1974 8 vs. San Diego Sept. 20, 1981 Most Turnovers, Both Teams, Game 16 Kansas City (7) vs. Houston (9) Oct. 12, 1969
Fewest Penalties, Season 43 1982 (9 games) 52 1963 56 1964 61 1966 Most Penalties, Season *158 1998 137 2018 127 1994 126 1999 122 1993, 1996 *NFL RECORD Fewest Penalties, Game *0 vs. Buffalo Oct. 2, 1966 0 vs. Oakland Dec. 8, 1974 0 vs. Oakland Dec. 1, 2019 0 vs. Jacksonville Nov. 13, 2022 1 26 times; Last at Denver Oct. 25, 2020 *NFL RECORD Most Penalties, Game 17 at Seattle Nov. 8, 1998 15 vs. San Diego Sept. 20, 1998 15 at New England Sept. 7, 2017 14 at Atlanta Sept. 18, 1994 14 at Denver Oct. 17, 1994 Fewest Penalties, Both Teams, Game 1 Kansas City (0) vs. Buffalo (1) Oct. 2, 1966 Most Penalties, Both Teams, Game 30 Kansas City (17) at Seattle (13) Nov. 8, 1998 27 Kansas City (12) at Oakland (15) Nov. 7, 2010 26 Kansas City (7) vs. San Diego (19) Oct. 16, 1997 26 Kansas City (11) vs. Oakland (15) Dec. 24, 2011 25 Kansas City (11) vs. Denver (14) Sept. 20, 1993 24 Kansas City (13) at L.A. Raiders (11) Oct. 9, 1983 24 Kansas City (12) vs. L.A. Raiders (12) Sept. 16, 1984 24 Kansas City (10) vs. L.A. Raiders (14) Dec. 13, 1987 24 Kansas City (14) at Atlanta (10) Sept. 18, 1994 24 Kansas City (14) at Denver (10) Oct. 17, 1994 24 Kansas City (15) vs. San Diego (9) Sept. 20, 1998 24 Kansas City (10) at Oakland (14) Oct. 23, 2011 24 Kansas City (9) at Denver (15) Nov. 27, 2016 24 Kansas City (12) at Pittsburgh (12) Sept. 16, 2018
PENALTIES
Fewest Yards Penalized, Season 371 1982 (9 games) 515 1974 577 2006 602 2001 604 1964 Most Yards Penalized, Season 1,304 1998 1,152 2018 Fewest Yards Penalized, Game 0 vs. Buffalo Oct. 2, 1966 0 vs. Oakland Dec. 8, 1974 0 vs. Oakland Dec. 1, 2019 0 vs. Jacksonville Nov. 13, 2022 1 vs. San Diego Dec. 22, 2002 3 vs. Buffalo Sept. 11, 2011 5 13 times; Last vs. Houston Sept. 10, 2020 Most Yards Penalized, Game 154 vs. Oakland Nov. 1, 1970 152 at Seattle Nov. 8, 1998 141 at San Diego Oct. 25, 1987 Fewest Yards Penalized, Both Teams, Game 10 Kansas City (10) vs. Boston (0) Nov. 17, 1968 10 Kansas City (0) vs. Oakland (10) Dec. 8, 1974 10 Kansas City (5) at Denver (5) Dec. 7, 2008 Most Yards Penalized, Both Teams, Game 259 KC (141) at San Diego (118) Oct. 25, 1987 258 KCâ (126) vs. L.A. Raiders (132) Sept. 16, 1984
SCORING POINTS
TOUCHDOWNS
NOTABLE GAMES
27 @CHIEFS
Fewest Points Allowed, Season 170 1968 177 1969 184 1982 (9 games) 192 1973 208 1971 Lowest Scoring Average, Season 12.1 1968 (170 in 14 games) 12.6 1969 (177 in 14 games) 13.7 1973 (192 in 14 games) 14.5 1997 (232 in 16 games) 14.9 1971 (208 in 14 games) Most Points Allowed, Season 440 2008 435 2004 425 2012 424 2009 Highest Scoring Average, Season 27.5 2008 (440 in 16 games) 27.2 2004 (435 in 16 games) 26.9 1976 (376 in 14 games) 26.6 2012 (425 in 16 games) 26.5 2009 (424 in 16 games) Most Points Allowed, Game 54 vs. Buffalo Nov. 23, 2008 54 at L.A. Rams Nov. 19, 2018 51 at Seattle Nov. 27, 1983 (OT) 50 at Buffalo Oct. 3, 1976 49 at Oakland Nov. 5, 2000 49 at Denver Nov. 14, 2010 Most First-Half Points Allowed, Game 35 at San Diego Oct. 25, 1987 35 at Denver Nov. 14, 2010 34 vs. Seattle Dec. 11, 1977 31 Seven times, last at Pittsburgh Oct. 15, 2006 Fewest First-Half Points Allowed, Season 74 1969 95 1982 (9 games) 97 1965 101 1973 103 1968 Most First-Quarter Points Allowed, Season 101 1998 95 1976, 2012 93 2009 92 1997 88 1987 Fewest First-Quarter Points Allowed, Season 29 1963, 1969 30 1973 32 1970 33 1965, 1966 37 1984 Most First-Quarter Points Allowed, Game 31 at Buffalo Sept. 13, 1962 22 at Pittsburgh Oct. 2, 2016 21 at Denver Nov. 16, 1986 21 at Denver Nov. 14, 2010 17 vs. Oakland Nov. 23, 1967 17 at Denver Oct. 27, 1996 17 vs. Pittsburgh Sept. 14, 2003 17 at Denver Sept. 26, 2005 17 vs. San Diego Sept. 30, 2012 Most Second-Quarter Points Allowed, Season 152 2004 141 2008 135 1985, 2021 133 1999 132 2022 Fewest Second-Quarter Points Allowed, Season 45 1969 55 1979, 1982 (9 games) 57 1968, 1992 59 1995 64 1965 Most Second-Quarter Points Allowed, Game 28 vs. San Diego Nov. 15, 1964 28 vs. Oakland Oct. 16, 1966 28 at Baltimore Dec. 21, 1980 28 at Seattle Nov. 4, 1984 28 at Seattle Sept. 11, 1988 24 at Oakland Nov. 3, 1968 Most Third-Quarter Points Allowed, Season 106 2008, 2012 103 2001 100 2009 98 1975, 2018 95 2011 Fewest Third-Quarter Points Allowed, Season 22 1971 28 2020 29 1995 31 1982 (9 games) 34 1974 35 1973 Most Third-Quarter Points Allowed, Game 28 at Houston Oct. 24, 1965 22 at Boston Nov. 18, 1960 21 Nine times; Last at Baltimore Sept. 13, 2009 Most Fourth-Quarter Points Allowed, Season 147 2020 139 1961 136 2018 130 1983, 2002 129 2004 Fewest Fourth-Quarter Points Allowed, Season 27 1968 44 1997 54 2013 56 1973 57 1960, 1962, 1981 Most Fourth-Quarter Points Allowed, Game 24 at New Orleans Sept. 8, 1985 22 vs. Denver Nov. 1, 1964 21 13 times; Last at Houston Oct. 8, 2017 Most Second-Half Points Allowed, Game 38 at Houston Oct. 24, 1965 37 at Seattle* Nov. 27, 1983 35 vs. San Diego Oct. 20, 1963 35 vs. Pittsburgh Nov. 7, 1976 31 at Miami Sept. 22, 1985 31 at Miami Dec. 12, 1994 31 vs. San Diego Nov. 24, 2013 31 at L.A. Rams Nov. 19, 2018 *Includes three in OT Fewest Second-Half Points Allowed, Season 67 1968 89 1982 (9 games) 91 1973, 1997 96 1971 101 1972
Fewest Touchdowns Allowed, Season 18 1968 19 1969 21 1971 Most Touchdowns Allowed, Season 53 2004 51 1976, 2018 49 2008 48 2009 47 2012 Most Touchdowns Allowed, Game 7 at Los Angeles Rams Nov. 19, 2018 7 at Buffalo Oct. 3, 1976 7 at Oakland Nov. 5, 2000 7 at Denver Nov. 14, 2010 6 16 times; Last at Pittsburgh Oct. 2, 2016
Most Shutouts, Season 3 1960 2 1967, 1969 Most Consecutive Shutouts 2 1960 Dec. 4-11, 1960 Most Games Allowed 10 Points or Less, Season
FIRST DOWNS BY PENALTY
FIRST DOWNS
FIRST DOWNS RUSHING
NET YARDS ALLOWED PASSING AND RUSHING
FIRST DOWNS PASSING
28 @CHIEFS 9 1968 7 1969 6 1973, 1979, 1990, 1995 Most Consecutive Games Allowed 10 Points or Less 5 1968 3 1960, 1968, 1995, 1997, 2021 Largest Opponent Comeback Victories Opponent Deficit Final Date 21 vs. Tampa Bay 24-3 27-30 (OT) Nov. 2, 2008 18 vs. Philadelphia 24-6 31-37 Oct. 2, 2005 18 vs. San Diego 21-3 21-22 Dec. 14, 2008 17 at Houston 17-0 36-38 Oct. 24, 1965 17 vs. L.A. Raiders 17-0 17-24 Oct. 5, 1986 17 at Chicago 17-0 27-28 Nov. 13, 1977 17 at San Diego 34-17 37-38 Nov. 22, 1998 17 vs. Oakland 17-0 38-41 (OT) Jan. 2, 2000
Fewest First Downs Allowed, Season 170 1982 (9 games) 181 1969 200 1965 204 1964 Most First Downs Allowed, Season 419 2018 367 2002 363 2021 353 2020 352 2017 Fewest First Downs Allowed, Game 5 vs. Oakland Dec. 7, 1997 6 at Boston Sept. 21, 1969 6 vs. Boston Oct. 11, 1970 6 at Chicago Dec. 29, 1990 7 10 times; Last at Washington Oct. 18, 2009 Most First Downs Allowed, Game 35 vs. San Diego Oct. 19, 1986 35 vs. Houston Oct. 13, 2019 34 at Denver Nov. 18, 1974 34 at Cleveland Oct. 30, 1977
Fewest Rushing First Downs Allowed, Season 52 1968 53 1969 67 1965 Most Rushing First Downs Allowed, Season 169 1977 162 1988 149 1975 Fewest Rushing First Downs Allowed, Game *0 vs. Houston Dec. 4, 1960 0 vs. Buffalo Dec. 3, 1967 0 at Denver Oct. 3, 1971 0 at Oakland Dec. 3, 1995 0 vs. Oakland Dec. 7, 1997 0 vs. St. Louis Dec. 8, 2002 0 vs. N.Y. Jets Sept. 11, 2005 1 20 times; Last vs. Dallas Nov. 21, 2021 *NFL RECORD Most Rushing First Downs Allowed, Game 21 vs. Pittsburgh Nov. 7, 1976 20 at Oakland Dec. 28, 2002 19 at Cleveland Oct. 30, 1977
Fewest Passing First Downs Allowed, Season 92 1982 (9 games) 95 1973 111 1969, 1970 Most Passing First Downs Allowed, Season 247 2018 227 2002 209 2016, 2021 207 2022 204 2017 Fewest Passing First Downs Allowed, Game *0 at Houston Oct. 9, 1988 0 vs. San Diego Sept. 20, 1998 2 8 times; Last at Denver Jan. 1, 2012 *NFL RECORD Most Passing First Downs Allowed, Game 25 at Denver Nov. 18, 1974 25 at Denver Nov. 14, 2010 25 at Pittsburgh Sept. 16, 2018 23 at Oakland Oct. 19, 2017 23 at L.A. Chargers Sept. 9, 2018 23 at Tampa Bay Oct. 2, 2022
Fewest Penalty First Downs Allowed, Season 9 1982 (9 games) 11 1964 13 1980 Most Penalty First Downs Allowed, Season 56 1998 43 2018 40 2004 39 2019 38 2020 36 1993, 2017 Most Penalty First Downs Allowed, Game 7 2 times; Last N.Y. Jets Dec. 11, 2011 6 13 times; Last at Cincinnati Jan. 2, 2022
Fewest Yards Allowed, Season 2,733 1982 (9 games) 3,163 1969 3,575 1973 3,667 1970 3,749 1965 Most Yards Allowed, Season 6,488 2018 6,291 2008 6,272 2021 6,248 2002 6,211 2009 Fewest Yards Allowed, Game 89 vs. Seattle Dec. 24, 1995 91 vs. Houston Oct. 12, 1969 93 vs. Oakland Dec. 7, 1997 100 at Boston Sept. 21, 1969 105 vs. Boston Dec. 14, 1963 105 vs. Boston Oct. 11, 1970 Most Yards Allowed, Game 563 vs. Houston Dec. 16, 1990 542 at N.Y. Jets Oct. 2, 1988 (OT) 542 at Tennessee Dec. 13, 2004 541 at L.A. Chargers Sept. 9, 2018 539 at Oakland Nov. 3, 1968 539 vs. Oakland Oct. 3, 1977 PLAYS Fewest Plays Allowed, Season 556 1982 (9 games) 808 1969 813 1971 Most Plays Allowed, Season 1,159 1984 1,126 1985 1,109 2018 1,102 1981 Fewest Plays Allowed, Game 39 vs. Houston Oct. 22, 1967 39 vs. Oakland Dec. 7, 1997 40 vs. Cincinnati Oct. 13, 1968 40 at Boston Sept. 21, 1969 Most Plays Allowed, Game 97 at N.Y. Jets Oct. 2, 1988 (OT) 95 vs. San Diego Oct. 19, 1986 91 vs. Chicago Nov. 8, 1981 RUSHING RUSHING ATTEMPTS Fewest Rushing Attempts Allowed, Season
COMPLETIONS
RUSHING YARDS
PASSING YARDS
RUSHING TOUCHDOWNS
PASSING TOUCHDOWNS
29 @CHIEFS 279 1982 (9 games) 316 1969 343 1967 Most Rushing Attempts Allowed, Season 634 1977 609 1988 601 1978 Fewest Rushing Attempts Allowed, Game 6 at Tampa Bay Oct. 2, 2022 9 at Oakland Dec. 5, 2004 11 at New Orleans Sept. 4, 1994 11 at Oakland Dec. 3, 1995 11 vs. Oakland Dec. 10, 2017 12 at N.Y. Jets Nov. 27, 1966 12 at Seattle Nov. 28, 2010 12 vs. Las Vegas Dec. 12, 2021 Most Rushing Attempts Allowed, Game 65 at Buffalo Oct. 29, 1973 62 at Tampa Bay Dec. 16, 1979 61 at Oakland Dec. 8, 1973 61 vs. Chicago Nov. 8, 1981
Fewest Rushing Yards Allowed, Season 980 1960 1,066 1982 (9 games) 1,091 1969 Fewest Rushing Yards Per Game Allowed, Season 70.0 1960 (980 in 14 games) 77.9 1969 (1,091 in 14 games) 82.9 1995 (1,327 in 16 games) Most Rushing Yards Allowed, Season 2,971 1977 2,861 1976 2,712 1975 Most Rushing Yards Per Game Allowed, Season 211.8 1977 (2,971 in 14 games) 204.4 1976 (2,861 in 14 games) 193.7 1975 (2,712 in 14 games) Fewest Rushing Yards Allowed, Game 3 at San Diego Nov. 19, 1961 3 at Tampa Bay Oct. 2, 2022 8 at Oakland Dec. 3, 1995 12 Tampa Bay Sept. 13, 1981 14 at Tampa Bay Oct. 31, 1976 Most Rushing Yards Allowed, Game 351 vs. Cleveland Dec. 20, 2009 332 vs. Tennessee Oct. 19, 2008 330 vs. Pittsburgh Nov. 7, 1976 322 at Cleveland Oct. 30, 1977 300 vs. Oakland Sept. 14, 2008 Fewest Individual 100-Yard Games Allowed, Season 0 1960, 1969, 1971, 1981, 1995 Most Individual 100-Yard Games Allowed, Season 9 2003 8 1976, 1977, 2007
Fewest Rushing Touchdowns Allowed, Season 4 1968 5 2016 6 1969, 1971 7 1982 (9 games), 1995, 2013, 2015 Most Rushing Touchdowns Allowed, Season 25 2008 24 1975, 1976 23 1977, 1988 Most Rushing Touchdowns Allowed, Game 5 vs. Pittsburgh Nov. 7, 1976 5 at Denver Dec. 7, 2003 4 8 times; Last vs Cleveland Sept. 12, 2021 PASSING ATTEMPTS Fewest Pass Attempts Allowed, Season 262 1982 (9 games) 324 1973 325 1975 333 1977 Most Pass Attempts Allowed, Season 632 2018 619 2022 616 2002 610 2021 607 2015 Fewest Pass Attempts Allowed, Game 8 vs. Denver Nov. 13, 2011 9 at N.Y. Jets Nov. 7, 1971 9 vs. Oakland Dec. 8, 1974 10 vs. L.A. Raiders Sept. 16, 1973 10 at San Diego Dec. 18, 1988 Most Pass Attempts Allowed, Game 65 vs. San Diego Oct. 19, 1986 61 vs. Seattle Sept. 29, 1985 61 vs. Jacksonville Oct. 7, 2018 60 at Oakland Oct. 5, 1980 60 at Pittsburgh Sept. 16, 2018
Fewest Pass Completions Allowed, Season 155 1982 (9 games) 157 1973 175 1977 186 1972, 1975 195 1970 Most Pass Completions Allowed, Season 408 2022 406 2018 403 2002 401 2021 352 2019 Fewest Pass Completions Allowed, Game 1 vs. San Diego Sept. 20, 1998 2 vs. Denver Nov. 13,2011 3 vs. Houston Oct. 22, 1967 3 at N.Y. Jets Nov. 7, 1971 3 vs. Oakland Dec. 8, 1974 4 at San Diego Nov. 2, 1986 4 at Houston Oct. 9, 1988 Most Pass Completions Allowed, Game 39 at New England Sept. 22, 2002 39 at Pittsburgh Sept. 16, 2018 39 at Tampa Bay Oct. 2, 2022 37 vs. San Diego Dec. 22, 1985 37 vs. San Diego Oct. 19, 1986 37 vs. New Orleans Oct. 23, 2016 35 vs. Oakland Oct. 27, 2002
Fewest Net Passing Yards Allowed, Season 1,619 1973 1,667 1982 (9 games) 1,942 1973 2,010 1970 Most Net Passing Yards Allowed, Season 4,374 2018 4,273 2021 4,203 2004 4,181 2002 3,962 2013 Fewest Net Passing Yards Allowed, Game -19 vs. San Diego Sept. 20, 1998 9 vs. N.Y. Jets Nov. 7, 1971 12 vs. Oakland Dec. 8, 1974 Most Net Passing Yards Allowed, Game 505 vs. Houston Dec. 16, 1990 472 vs. Indianapolis Oct. 31, 2004 469 at Oakland Nov. 3, 1968 Fewest Individual 300-Yard Games Allowed, Season 0 1962, 1970, 1971, 1972, 1973, 1974, 1977, 1978, 1988, 2000 Most Individual 300-Yard Games Allowed, Season 8 2002
Fewest Passing Touchdowns Allowed, Season 10 1969 11 1971, 1973
SACKS
INTERCEPTIONS BY
OPPONENTS INTERCEPTIONS
INTERCEPTION RETURNS
30 @CHIEFS 12 1982 (9 games), 1988 Most Passing Touchdowns Allowed, Season 33 2022 32 2004 30 2018 29 2012, 2020 27 2002, 2021 Most Passing Touchdowns Allowed, Game 5 at Houston Oct. 24, 1965 5 vs. Indianapolis Oct. 31, 2004 5 at Denver Nov. 14, 2010 5 vs. Denver Dec. 1, 2013 5 at Green Bay Sept. 28, 2015 5 at Pittsburgh Oct. 2, 2016 5 at Houston Oct. 8, 2017 4 20 times; Last at Denver Dec. 11, 2022
Most Seasons Leading League 4 1960, 1965, 1969, 1990 Most Sacks, Season 60.0 1990 55.0 2022 54.0 1997 52.0 2018 51.0 2000 Fewest Sacks, Season *10.0 2008 15.0 1982 (9 games) 22.0 1976, 2009 23.0 1988 *NFL RECORD Most Sacks, Game 11.0 vs. Cleveland Sept. 30, 1984 10.0 vs. Oakland Sept. 6, 1998 9.0 at Buffalo Nov. 2, 1969 9.0 vs. Seattle Nov. 11, 1990 9.0 vs. Oakland Oct. 13, 2013 9.0 at Denver Oct. 17, 2019 Most Opponents Yards Lost Attempting to Pass, Season 439 1968 Fewest Opponents Yards Lost Attempting to Pass, Season 62 2008 120 1982 (9 games) 137 2009
Most Consecutive Seasons Leading League 5 1966-70 Most Passes Intercepted By, Season 37 1968 33 1966 32 1960, 1962, 1969 Fewest Passes Intercepted By, Season 7 2012 11 1987, 2022 12 1982 (9 games), 1994 Most Passes Intercepted By, Game 7 at San Diego Dec. 8, 1968 6 8 times; Last vs. New York Jets Sept. 25, 2016 Most Consecutive Games, One or More Interceptions By 23 1967-69 18 1966-67 16 1982-83
Most Yards Returning Interceptions, Season 596 1969 578 1967 567 1986 Fewest Yards Returning Interceptions, Season 119 2012 124 2006 140 1987 141 2019 Most Yards Returning Interceptions, Game 188 vs. N.Y. Titans Dec. 17, 1961 162 at Oakland Dec. 6, 2015 142 vs. L.A. Raiders Oct. 28, 1991 136 vs. Seattle Dec. 11, 1977 Most Touchdowns Returning Interceptions, Season 6 1992 5 1972, 1974, 1999, 2013 4 1960, 1967, 1986, 1997, 2015, 2016 Most Touchdowns Returning Interceptions, Game 2 vs. N.Y. Titans Dec. 17, 1961 2 at Denver Oct. 1, 1972 2 at Denver Dec. 19, 1982 2 vs. San Diego Oct. 19, 1986 2 vs. Denver Dec. 27, 1992 2 at Baltimore Oct. 21, 1999 2 at Denver Jan. 3, 2010 2 at Oakland Oct. 23, 2011 Most Touchdowns Returning Interceptions, Both Teams, Game *4 Kansas City (0) at Seattle (4) Nov. 4, 1984 3 Kansas City (2) vs. San Diego (1) Oct. 19, 1986 *NFL RECORD
Most Yards, Interception Returns Opponents, Season 688 1984 Most Yards Interception Returns, Opponent, Game *325 at Seattle Nov. 4, 1984 *NFL RECORD Most Touchdowns Returning Interceptions Opponents, Season 7 1984 Most Touchdowns Returning Interceptions Opponent, Game *4 at Seattle Nov. 4, 1984 *NFL RECORD
Most Opponents Punts, Season 102 1995 98 1999 94 1969 Fewest Opponents Punts, Season 38 1982 (9 games) 50 2008 52 2018, 2021 55 1962 Lowest Opponents Average Distance, Season 37.0 1986, 1990 38.6 1982 (9 games) 38.9 1981 Highest Opponents Average Distance, Season 48.1 2021 47.6 2011 47.6 2022 46.8 2012 46.6 2013 Most Opponents Punts Blocked, Season 6 1990 4 1986 3 1963, 1982 2 1966, 1979, 1980, 1989, 1997, 2001, 2002, 2006 Most Opponents Punts Blocked, Game 3 vs. Denver Dec. 8, 1963 2 at Seattle Sept. 30, 1979 2 vs. Cleveland Sept. 30, 1990 PUNT RETURNS Fewest Opponents Punt Returns, Season 15 2020 17 2018, 2021 19 2019 20 1961 22 1982, 2022
PUNTING
KICKOFF RETURNS
BLOCKED FIELD GOALS
FUMBLES
TURNOVERS
31 @CHIEFS Most Opponents Punt Returns, Season 60 1984 55 1974, 1976 54 1983 Most Opponents Punt Returns, Game 9 at Cincinnati Nov. 24, 1974 Fewest Punt Return Yards Allowed, Season 84 2021 89 2019 97 2018 119 2020 157 1960, 2016 Most Punt Return Yards Allowed, Season 702 1977 634 1974 572 1986 Most Punt Return Yards Allowed, Game 170 at San Diego Sept. 26, 1965 Lowest Punt Return Average Allowed, Season 4.68 2019 (19-89) 4.94 2021 (17-84) 5.23 2016 (30-157) 5.71 2018 (17-97) 5.81 1960 (27-157) Highest Punt Returns Average Allowed, Season 15.36 1982 (22-338) (9 games) 14.93 1965 (29-433) 14.04 1977 (50-702) Most Punt Returns Touchdowns Allowed, Season 2 1982, 1990, 2004, 2012
Fewest Opponents Kickoff Returns, Season 25 2011, 2017 27 2012 33 2022 34 2021 35 2016 Most Opponents Kickoff Returns, Season 88 2002 87 2003 85 2004 84 1966 Fewest Kickoff Return Yards Allowed, Season 486 2017 549 2020 605 2011 658 2021 690 2012 Most Kickoff Return Yards Allowed, Season 2,053 2005 2,045 1966 2,043 2003 1,908 2004 1,880 2002 Most Kickoff Return Yards Allowed, Game 289 at Denver Sept. 7, 1963 278 vs. Cleveland Dec. 20, 2009 Lowest Kickoff Return Average Allowed, Season
1990 (81-1,391)
1986 (71-1,278)
(23-427)
1992 (64-1,203) Highest Kickoff Return Average Allowed, Season 25.78 1973 (40-1,031) 25.56
25.37
Most Kickoff Return Touchdowns Allowed, Season 2 1988 2 1989 2 2009
17.17
18.00
18.57 2017
18.80
2012 (27-690)
1974 (54-1,370)
Blocked Field Goals, Season 6 1960 5 1966 4 1962, 1965, 1973 3 1963, 1967, 1996 2 1982 (9 games), 1986, 1992, 1993, 2003 Most Blocked Field Goals, Game 3 at San Diego Oct. 15, 1967 2 vs. Buffalo Dec. 18, 1960 2 at Oakland Nov. 3, 1963 2 at Oakland Sept. 18, 1966 2 at San Diego Oct. 15, 1967 2 at Green Bay Oct. 4, 1973 2 at San Diego Oct. 17, 1993 2 at San Diego Nov. 30, 2003
Most
Fewest Opponents Fumbles, Season 16 1971, 2020, 2022 18 1984, 2011 19 2000, 2012, 2015, 2017 Fewest Opponents Fumbles Recovered, Season 6 2011, 2012, 2020 7 1971, 2015, 2019 8 1966, 2004, 2007 9 2010, 2022 10 1982 (9 games), 1996, 2017 Most Opponents Fumbles, Season 42 1981 40 1975 39 1977 Most Opponents Fumbles Recovered, Season 26 1994 25 1990 23 1977
Fewest Opponents Turnovers, Season 13 2012 20 2022 21 2004 22 1982 (9 games), 2007, 2020 23 2010, 2019 Most Opponents Turnovers, Season 51 1983 49 1962, 1968, 1986 Most Opponents Turnovers, Game 9 vs. Houston Oct. 28, 1962 9 vs. Houston Oct. 12, 1969 9 vs. St. Louis Oct. 2, 1983 Best Turnover Ratio, Season 26 1990 (45 takes/19 gives) 22 1968 (49 takes/27 gives) 21 1999 (45 takes/21 gives) 18 1962 (49 takes/31 gives) 18 1992 (39 takes/21 gives) 18 2013 (36 takes/18 gives) Worst Turnover Ratio, Season -24 2012 (13 takes/37 gives) -13 1987 (28 takes/41 gives) -11 2007 (22 takes/33 gives) -8 1965 (33 takes/41 gives) -8 1989 (33 takes/41 gives)
SINGLE GAME
PASSING
5 Alan Pastrana, Denver
5 James Harris, San Diego
5 Jim Plunkett, Oakland
5 Jim Zorn, Seattle
5 Dave Krieg, Seattle
5 John Elway, Denver
Long Pass (All 80+)
Dec. 6, 1970
Nov. 26, 1978
Oct. 5, 1980
Nov. 9, 1980
Dec. 9, 1984
Dec. 14, 1985
RECEIVING
Passing Yards (All 400+)
Derek Carr, Oakland
19, 2017
Pete Beathard, Houston Sept. 9, 1968 413 Jared Goff, L.A. Rams Nov. 19, 2018
Tom Brady, New England Sept. 22, 2002 403 Peyton Manning, Denver Dec. 1, 2013
400 John Elway, Denver
Touchdown Passes
5 George Blanda, Houston
5 Peyton Manning, Indianapolis
5 Peyton Manning, Denver
5 Aaron Rodgers, Green Bay
5 Ben Roethlisberger, Pittsburgh
5 Deshaun Watson, Houston
Interceptions Thrown
6 John Hadl, San Diego
6 Ryan Fitzpatrick, N.Y. Jets
5 George Blanda, Houston
5 John Hadl, San Diego
5 Babe Parilli, Boston
5 George Blanda, Houston
5 Pete Beathard, Houston
5 Marty Domres, San Diego
Dec. 6, 1998
Oct. 24, 1965
Oct. 31, 2004
Dec. 1, 2013
Sept. 28, 2015
Oct. 2, 2016
Oct. 8, 2017
Dec. 8, 1968
Sept. 25, 2016
Oct. 28, 1962
Dec. 16, 1962
Dec. 14, 1963
Oct. 4, 1964
Oct. 12, 1969
Nov. 9, 1969
Pass Receptions 16
Rushing
3
RUSHING
3 Greg Pruitt, Cleveland Dec. 14, 1975
3 Pete Banaszak, Oakland
3 Walter Payton, Chicago
Dec. 21, 1975
Nov. 13, 1977
3 Curt Warner, Seattle Nov. 27, 1983 (OT)
3 Marcus Allen, L.A. Raiders
3 Rodney Hampton, N.Y. Giants
3 Terrell Davis, Denver
3 Curtis Martin, N.Y. Jets
3 Clinton Portis, Denver
3 Onterrio Smith, Minnesota
3 Michael Pittman, Tampa Bay
3 Michael Turner, Atlanta
3 LenDale White, Tennessee
3 Jerome Harrison, Cleveland
3 Jeremy Hill, Cincinnati
3 Mike Gillislee, New England
3 Mark Ingram, Baltimore
Long Run (All 80+)
Nov. 25, 1990
Dec. 19, 1992
Dec. 6, 1998
Nov. 11, 2001
Dec. 15, 2002
Dec. 20, 2003
Nov. 7, 2004
Sept. 21, 2008
Oct. 19, 2008
Dec. 20, 2009
Oct. 4, 2015
Sept. 7, 2017
Sept. 22, 2019
32 @CHIEFS
Pass Attempts (All 50+) 61 Blake Bortles, Jacksonville Oct. 7, 2018 60 Ben Roethlisberger, Pittsburgh Sept. 16, 2018 58 Mark Hermann, San Diego Dec. 22, 1985 56 Kyle Orton, Denver Jan. 3, 2010 55 Rich Gannon, Oakland Oct. 27, 2002 54 Steve DeBerg, Tampa Bay Oct. 28, 1984 54 Tom Brady, New England Sept. 22, 2002 52 Jim Plunkett, Oakland Oct. 5, 1980 52 Derek Carr, Oakland Oct. 19, 2017 52 Philip Rivers, L.A. Chargers Nov. 18, 2019 52 Tom Brady, Tampa Bay Oct. 2, 2022 51 Philip Rivers, L.A. Chargers Sept. 9, 2018 50 Brian Griese, Denver Oct. 20, 2002 Pass Completions (All 30+) 39 Tom Brady, New England Sept. 22, 2002 39 Ben Roethlisberger, Pittsburgh Sept. 16, 2018 39 Tom Brady, Tampa Bay Oct. 2, 2022 37 Mark Hermann, San Diego Dec. 22, 1985 37 Drew Brees, New Orleans Oct. 23, 2016 35 Rich Gannon, Oakland Oct. 27, 2002 34 Jim Plunkett, Oakland Sept. 12, 1985 34 Philip Rivers, San Diego Dec. 14, 2008 34 Philip Rivers, L.A. Chargers Sept. 9, 2018 33 Drew Bledsoe, New England Dec. 4, 2000 33 Donovan McNabb, Philadelphia Oct. 2, 2005 33 Blake Bortles, Jacksonville Oct. 7, 2018 33 Derek Carr, Las Vegas Dec. 12, 2021 33 Justin Herbert, Los Angeles Chargers Sept. 15, 2022 32 Jay Cutler, Denver Dec. 7, 2008 32 Ben Roethlisberger, Pittsburgh Nov. 22, 2009 32 Kyle Orton, Denver Jan. 3, 2010 32 Jalen Hurts, Philadelphia Oct. 3, 2021 31 Jim Zorn, Seattle Sept. 27, 1981 31 Rich Gannon, Oakland Sept. 9, 2001 31 Marc Bulger, St. Louis Nov. 5, 2006 31 Jeff Garcia, Tampa Bay Nov. 2, 2008 31 Derek Carr, Oakland Dec. 6, 2015 31 Jared Goff, L.A. Rams Nov. 19, 2018 31 Philip Rivers, L.A. Chargers Dec. 29, 2019 30 Dan Fouts, San Diego Oct. 14, 1984 30 Tony Romo, Dallas Sept. 15, 2013 30 Deshaun Watson, Houston Oct. 13, 2019 30 Joe Burrow, Cincinnati Jan. 2, 2022
527 Warren Moon, Houston Dec. 16, 1990 472 Peyton Manning, Indianapolis Oct. 31, 2004 452 Ben Roethlisberger, Pittsburgh Sept. 16, 2018 446 Joe Burrow,
445
Nov.
431
Jan.
430
Oct.
426
Dec.
424
Sept.
417
Cincinnati Jan. 2, 2022
Charley Johnson, Denver
18, 1974
Kyle Orton, Denver
3, 2010
Blake Bortles, Jacksonville
7, 2018
Billy Volek, Tennessee
13, 2004
Philip Rivers, L.A. Chargers
9, 2018
Oct.
413
410
Denver Sept. 21,
90 N. Johnson to R. Upchurch,
1975
Oct. 13,
Baltimore Dec. 10, 2006
M. Hasselbeck
Obomanu, SEA Nov. 28, 2010
J. Lee
A. Denson, Denver Nov. 1, 1964
D. Lamonica to F. Biletnikoff, Oakland Nov. 3, 1968
B. Griese
S. Sharpe, Denver Oct. 20, 2002
J. Lee to B. Groman Oct. 22, 1961
S. Wyche to B. Trumpy Sept. 28, 1969
89 J. Kemp to E. Dubenion, Buffalo
1963 87 S. McNair to M. Clayton,
87
to B.
82
to
82
82
to
80
80
Troy Brown, New England Sept. 22, 2002 14 Kellen Winslow, San Diego Dec. 11, 1983 14 Jabar Gaffney, Denver Jan. 3, 2010 13 Joe Washington, Baltimore Sept. 2, 1979 13 Terrance Mathis, Atlanta Sept. 18, 1994
Tim Brown, Oakland Oct. 27, 2002
Steven Jackson, St. Louis Nov. 5, 2006
Hunter Renfrow, Las Vegas Dec. 12, 2021 Receiving Yards (All 200+) 266 Ja'Marr Chase, Cincinnati Jan. 2, 2022 250 Miles Austin, Dallas Oct. 11, 2009 245 Haywood Jeffires, Houston Dec. 16, 1990 233 Drew Bennett, Tennessee Dec. 13, 2004 232 Lance Alworth, San Diego Oct. 20, 1963 214 Shannon Sharpe, Denver Oct. 20, 2002 213 Jabar Gaffney, Denver Jan. 3, 2010 210 Amari Cooper, Oakland Oct. 19, 2017 203 Don Maynard, N.Y. Jets Sept. 15, 1968 Touchdown Receptions 4 Eric Decker, Denver Dec. 1, 2013 3 Bob Chandler, Buffalo Oct. 3, 1976 3 Kellen Winslow, San Diego Dec. 11, 1983 3 Shannon Sharpe, Denver Dec. 12, 1993 3 Drew Bennett, Tennessee Dec. 13, 2004 3 Antonio Gates, San Diego Oct. 30, 2005 3 Randall Cobb, Green Bay Sept. 28, 2015 3 DeAndre Hopkins, Houston Oct. 8, 2017 3 Ja'Marr Chase, Cincinnati Jan. 2, 2022 3 Jerry Jeudy, Denver Dec. 11, 2022
13
13
13
Attempts 39 O.J. Simpson, Buffalo Oct. 29, 1973 39 Ricky Bell, Tampa Bay Dec.
1979 39 Marion Butts, San Diego Dec. 17, 1989
Yards (All 200+) 286 Jerome Harrison, Cleveland Dec. 20, 2009 220 Tiki Barber, N.Y. Giants Dec. 17, 2005 218 Clinton Portis, Denver Dec. 7, 2003 217 Gary Anderson, San Diego Dec. 18, 1988 214 Greg Pruitt, Cleveland Dec. 14, 1975 207 Curt Warner, Seattle Nov. 27, 1983 (OT)
Rushing
16,
Rushing
Touchdowns
Dec.
5 Clinton Portis, Denver
7, 2003
Nov.
Jon Keyworth, Denver
18, 1974
Long
82
Long
DEFENSE / SPECIAL TEAMS
55
55
55
33 @CHIEFS
Paul Lowe, San Diego Sept. 10, 1961
LaDainian Tomlinson, San Diego Dec. 17, 2006 80 LenDale White, Tennessee Oct. 19, 2008
Touchdowns
Clinton Portis, Denver Dec. 7, 2003
Clinton Portis, Denver Dec. 15, 2002
Eric Decker, Denver Dec. 1, 2013
87
85
Total
5
4
4
Made
Deltha O Neal, Denver Oct. 7, 2001
David Fulcher, Cincinnati Oct. 1, 1989
Interception Return (All 100+) 102 Marcus Coleman, Houston Sept. 26, 2004 101 Tony Greene, Buffalo Oct. 3, 1976 100 Speedy Duncan, San Diego Oct. 15, 1967 Long Punt Return
Johnny Bailey, Chicago Dec. 29, 1990
Kickoff Return (All 100+)
Joshua Cribbs, Cleveland Dec. 20, 2009 100 Nemiah Wilson, Denver Oct. 8, 1966 100 Joshua Cribbs, Cleveland Dec. 20, 2009
Interceptions
4
3
Long
95
Long
103
Punt (All 80+)
Sept.
1984
83 Chris Norman, Denver
23,
Nov. 5,
Paul Maguire, San Diego
1961
Field Goal (All 55+)
Dec. 4, 2016
59 Matt Bryant, Atlanta
Janikowski, Oakland Dec. 16, 2012
57 Sebastian
Janikowski, Oakland Sept. 14, 2008
56 Sebastian
Denver Sept. 28, 2008
56 Matt Prater,
Seattle Jan. 2,
55 John Kasay,
1994
14,
Kris Brown, Pittsburgh Oct.
2001
Oakland
25,
Sebastian Janikowski,
Nov.
2007
Nov.
Nate Kaeding, San Diego
29, 2009
Times Sacked (All 10.0+)
11 Paul McDonald, Cleveland Sept. 30, 1984
Oakland
6, 1998
10 Jeff George,
Sept.
Interception Returns
Touchdowns On
Seattle Nov. 4, 1984
Dave Krieg, Seattle Nov. 5, 1989
2 Dave Brown,
Fumbles 6
Most Points After Touchdown, Career
54 Harrison Butker (15 games - 57 Att.)
13 Nick Lowery (8 games - 14 Att.)
Most Games Played, Career
SCORING
2 Priest Holmes vs. Indianapolis
2 Knile Davis at Indianapolis
Jan. 11, 2004
Jan. 11, 2004
Jan. 4, 2014
2 Damien Williams vs. San Francisco Feb. 2, 2020
2 Travis Kelce vs. Buffalo Jan. 24, 2021
2 Byron Pringle vs. Pittsburgh Jan. 16, 2022
2 Travis Kelce vs. Jacksonville Jan. 21, 2023
2017-22
1980-93
1967-79 6
8 Jan Stenerud (5 games - 8 Att.)
Most Points After Touchdown, Game
Most
Most Field Goals Made, Career 21
RUSHING
Most
34 @CHIEFS
SERVICE
18 Travis Kelce 2013-22 18 James Winchester 2015-22 15 Daniel Sorensen 2014-21 15 Harrison Butker 2017-22 15 Chris Jones 2016-22 14 Patrick Mahomes 2017-22 14 Derrick Nnadi 2018-22 13 Tyreek Hill 2016-21 13 Demarcus Robinson 2016-21 13 Anthony Sherman 2013-20 12 Dustin Colquitt 2005-19 12 Nick Allegretti 2019-22 12 Frank Clark 2019-22 11 Anthony Hitchens 2018-21 11 Ben Niemann 2018-21 11 Charvarius Ward 2018-21 11 Eric Fisher 2013-20 11 Andrew Wylie 2017-22 10 John Alt 1984-96 10 Tim Grunhard 1990-00 10 Dave Szott 1990-00 10 Derrick Thomas 1989-99 10 Mecole Hardman 2019-22 10 Marcus Kemp 2017-22
Most Points,
117 Harrison Butker (15 games - 21 FGs, 54 PATs) 2017-22 90 Travis Kelce (17 games - 15 TDs) 2013-22 60 Damien Williams (5 games - 10 TDs) 2018-19 37 Nick Lowery (8 games - 8 FGs, 13 PATs) 1980-93 36 Tyreek Hill (13 games - 6 TDs) 2016-21 35 Jan Stenerud (5 games - 9 FGs, 8 PATs) 1967-79 30 Patrick Mahomes (14 games - 5 TDs) 2017-22 24 Cairo Santos (3 games - 6 FGs, 6 PATs) 2014-16 Most Points, Game 18 Damien Williams vs. New England Jan. 20, 2019 18 Damien Williams vs. Houston Jan. 12, 2020 18 Travis Kelce vs. Houston Jan. 12, 2020 14 Ryan Succop at Indianapolis Jan. 4, 2014 12 Abner Haynes vs. Houston Dec. 23, 1962 12 Mike Garrett at Buffalo Jan. 1, 1967 12 Ed Podolak vs. Miami Dec. 25, 1971 12 Dante Hall vs. Indianapolis Jan. 11, 2004 12 Priest Holmes vs. Indianapolis Jan. 11, 2004 12 Knile Davis at Indianapolis Jan. 4, 2014 12 Cairo Santos at Houston Jan. 9, 2016 12 Damien Williams vs. San Francisco Feb. 2, 2020 12 Travis Kelce vs. Buffalo Jan. 24, 2021 12 Byron Pringle vs. Pittsburgh Jan. 16, 2022 12 Harrison Butker vs. Buffalo Jan. 23, 2022 12 Travis Kelce vs. Jacksonville Jan. 21, 2023 Most Touchdowns, Career 16 Travis Kelce (18 games)
10 Damien Williams (5 games)
6 Tyreek Hill (13 games)
5 Patrick Mahomes (14 games)
Marcus Allen (6 games) 1993-97
Mike Garrett (6 games) 1966-70 3 Knile Davis (3 games) 2013-16
Byron Pringle (9 games) 2018-21 3 Mecole Hardman (10 games) 2019-21 Most Touchdowns,
3 Damien Williams vs. New England Jan. 20, 2019 3 Damien Williams vs. Houston Jan. 12, 2020 3 Travis Kelce vs. Houston Jan. 12, 2020 2 Abner Haynes vs. Houston Dec. 23, 1962 2 Mike Garrett at Buffalo Jan. 1, 1967 2 Ed Podolak vs. Miami Dec. 25, 1971 2 Dante Hall vs. Indianapolis
Career
2013-22
2018-19
2016-21
2017-21 3
3
3
Game
Ryan Succop (2 games - 6 Att.) 2009-13
Cairo Santos (3 games - 6 Att.) 2014-17
Mike Mercer (2 games - 5 Att.) 1966
6
5
Harrison Butker vs. Houston (7 Att.) Jan. 12, 2020 6 Harrison Butker vs. Pittsburgh (6 att.) Jan. 16, 2022
Ryan Succop at Indianapolis (5 Att.) Jan. 4, 2014
Harrison Butker vs. Tennessee (5 Att.) Jan. 19, 2020
Harrison Butker vs. Buffalo (5 Att.) Jan. 24, 2021 5 Harrison Butker vs. Philadelphia (5 Att.) Feb. 12, 2023
Mike Mercer at Buffalo (4 Att.) Jan. 1, 1967
Nick Lowery at Houston (4 Att.) Jan. 16, 1994 4 Morten Andersen vs. Indianapolis (4 Att.) Jan. 11, 2004 4 Harrison Butker vs. Indianapolis (4 Att.) Jan. 12, 2019 4 Harrison Butker vs. New England (4 Att.) Jan. 20, 2019 4 Harrison Butker vs. San Francisco (4 Att.) Feb. 2, 2020
6
5
5
5
4
4
Points
No Misses, Career
Jan Stenerud (5 games)
After Touchdown,
8
1967-79
Goals Attempted, Career
Harrison Butker (15 games) 2017-22
Jan Stenerud (5 games) 1967-79
Nick Lowery (8 games) 1980-93
Most Field
25
17
12
Game
Jan Stenerud vs. N.Y. Jets Dec. 20, 1969
Nick Lowery vs. Miami Jan. 5, 1991
Jan Stenerud vs. Miami Dec. 25, 1971
Harrison Butker vs. Buffalo Jan. 23, 2022
Most Field Goals Attempted,
5
4
4
4
Harrison Butker (15 games - 25 Att.)
Jan Stenerud (5 games - 17 Att.)
Nick Lowery (8 games - 12 Att.) 1980-93
2017-22 9
1967-79 8
Game 3 Jan Stenerud vs. Minnesota Jan. 11, 1970 3 Nick Lowery at Miami Jan. 5, 1991 3 Ryan Succop at Indianapolis Jan. 4, 2014 3 Cairo Santos at Houston Jan. 9, 2016 3 Harrison Butker vs. Cleveland Jan. 17, 2021 3 Harrison Butker at Tampa Bay Feb. 7, 2021 3 Harrison Butker vs. Buffalo Jan. 23, 2022 3 Harrison Butker
Jan.
Field Goal 52 Harrison Butker at Tampa Bay Feb. 7, 2021 50 Harrison Butker vs. Cleveland Jan. 17, 2021 50 Harrison Butker vs. Jacksonville Jan. 21, 2023 50 Harrison Butker vs. Jacksonville Jan. 21, 2023 49 Cairo Santos at Houston Jan. 9, 2016 49 Cairo Santos at Houston Jan. 9, 2016 49 Harrison Butker at Tampa Bay Feb. 7, 2021 49 Harrison Butker vs. Buffalo Jan. 24, 2022
Most Field Goals Made,
vs. Cincinnati
29, 2023 Longest
Rushing Attempts, Career 100 Marcus Allen (6 games) 1993-97 81 Damien Williams (5 games) 2018-19 67 Patrick Mahomes (14 games) 2017-22 61 Mike Garrett (6 games) 1966-70 59 Barry Word (4 games) 1990-92 Most Rushing Attempts, Game 33 Barry Word vs. L.A. Raiders Dec. 28, 1991 25 Damien Williams vs. Indianapolis Jan. 12, 2019 24 Curtis McClinton vs. Houston Dec. 23, 1962 24 Priest Holmes vs. Indianapolis Jan. 11, 2004 22 Wendell Hayes vs. Miami Dec. 25, 1971 21 Marcus Allen vs. Pittsburgh Jan. 8, 1994 21 Marcus Allen vs. Indianapolis Jan. 7, 1996 Most Rushing Yards Gained, Career 386 Marcus Allen (6 games) 1993-97 384 Patrick Mahomes (14 games) 2017-22 355 Damien Williams (5 games) 2018-19 208 Wendell Hayes (5 games) 1968-74 197 Barry Word (4 games) 1990-92 Most Rushing Yards Gained, Game 176 Priest Holmes vs. Indianapolis Jan. 11, 2004 130 Barry Word vs. L.A. Raiders Dec. 28, 1991 129 Damien Williams vs. Indianapolis Jan. 12, 2019 104 Damien Williams vs. San Francisco Feb. 2, 2020
Longest
PASSING
(to Tyreek Hill)
63 Len Dawson vs. Miami (to Elmo Wright)
63 Alex Smith at Indianapolis (to Dwayne Bowe)
61 Len Dawson at N.Y. Jets (to Otis Taylor)
60 Patrick Mahomes vs. Tennessee (to Sammy Watkins)
Most Touchdown Passes, Career
35 Patrick Mahomes (14 games)
9 Alex Smith (5 games)
7 Len Dawson (8 games)
6 Joe Montana (4 games)
2 Steve DeBerg (3 games)
2 Trent Green (2 games)
Most Touchdown Passes, Game
5 Patrick Mahomes vs. Houston
5 Patrick Mahomes vs. Pittsburgh
4 Alex Smith at Indianapolis
3 Joe Montana at Houston
3 Patrick Mahomes vs. New England
3 Patrick Mahomes vs. Buffalo
3 Patrick Mahomes vs. Buffalo
3 Patrick Mahomes vs. Cincinnati
3 Patrick Mahomes vs. Philadelphia
Most Passes Had Intercepted, Career
8 Len Dawson (8 games)
7 Patrick Mahomes (14 games)
4 Mark Vlasic (1 game)
4 Joe Montana (4 games)
Most Passes Had Intercepted, Game
4 Len Dawson at Oakland
4 Mark Vlasic at Buffalo
Jan. 23, 2022
Dec. 25, 1971
Jan. 4, 2014
Dec. 20, 1969
Jan. 19, 2020
2017-22
2013-17
1962-75
1993-94
1988-91
2001-06
Jan. 12, 2020
Jan. 16, 2022
Jan. 4, 2014
Jan. 16, 1994
Jan. 20, 2019
Jan. 24, 2021
Jan. 23, 2022
Jan. 30, 2022
Feb. 12, 2023
1962-75
2017-22
1991-92
1993-94
22, 1968
1992
PASS RECEIVING
Highest Completion Percentage, Game (15 completions)
Most Passing Yards, Career
1,497 Len Dawson (8 games)
1,250 Alex Smith (5 games)
1,014 Joe Montana (4 games)
454 Dave Krieg (4 games)
Most Passing Yards, Game (All 300+)
404 Patrick Mahomes vs. Pittsburgh
378 Alex Smith at Indianapolis
378 Patrick Mahomes vs. Buffalo
326 Patrick Mahomes vs. Cincinnati
325 Patrick Mahomes vs. Buffalo
321 Patrick Mahomes vs. Houston
314 Joe Montana at Miami
Longest Pass Completion
79 Alex Smith at Indianapolis (to Donnie Avery)
71 Patrick Mahomes vs. Buffalo (to Tyreek Hill)
64 Patrick Mahomes vs. Buffalo
1962-75
2013-17
1993-94
1992-93
Jan. 16, 2022
Jan. 4, 2014
Jan. 23, 2022
Jan. 29, 2023
Jan. 24, 2021
Jan. 12, 2020
Dec. 31, 1994
Jan. 4, 2014
Jan. 24, 2021
35 @CHIEFS 100 Wendell Hayes vs. Miami Dec. 25, 1971
Games, 100 or More Rushing Yards, Career 2 Damien Williams (5 games) 2018-19 1 Wendell Hayes (5 games) 1968-74 1 Barry Word (3 games) 1990-92 1 Priest Holmes (1 game) 2001-07
Most
Run From Scrimmage 50 Mecole Hardman vs. Buffalo Jan. 24, 2021 48 Priest Holmes vs. Indianapolis Jan. 11, 2004 41 Jamaal Charles vs. Baltimore Jan. 9, 2011 39 Isiah Pacheco vs. Jacksonville Jan. 21, 2023 38 Damien Williams vs. San Francisco Feb. 2, 2020 Most Rushing Touchdowns, Career 6 Damien Williams (5 games) 2018-19 5 Patrick Mahomes (14 games) 2017-22 3 Marcus Allen (6 games) 1993-97 3 Mike Garrett (6 games) 1966-70 Most Rushing Touchdowns, Game 2 Mike Garrett at Buffalo Jan. 1, 1967 2 Priest Holmes vs. Indianapolis Jan. 11, 2004 2 Damien Williams vs. Houston Jan. 12, 2020
Most Passes Attempted, Career 523 Patrick Mahomes (14 games) 2017-22 188 Len Dawson (8 games) 1962-75 185 Alex Smith (5 games) 2013-17 141 Joe Montana (4 games) 1993-94 64 Dave Krieg (4 games) 1992-93 Most Passes Attempted, Game 50 Alex Smith at New England Jan. 16, 2016 49 Patrick Mahomes at Tampa Bay Feb. 7, 2021 46 Alex Smith at Indianapolis Jan. 4, 2014 44 Patrick Mahomes vs. Buffalo Jan. 23, 2022 43 Joe Montana vs. Pittsburgh Jan. 8, 1994 43 Patrick Mahomes vs. Cincinnati Jan. 29, 2023 Most Passes Completed, Career 352 Patrick Mahomes (14 games) 2017-22 120 Alex Smith (5 games) 2013-17 107 Len Dawson (8 games) 1962-75 85 Joe Montana (4 games) 1993-94 33 Dave Krieg (4 games) 1992-93 Most Passes Completed, Game 33 Patrick Mahomes vs. Buffalo Jan. 23, 2022 30 Alex Smith at Indianapolis Jan. 4, 2014 30 Patrick Mahomes vs. Pittsburgh Jan. 16, 2022 29 Alex Smith at New England Jan. 16, 2016 29 Patrick Mahomes vs. Buffalo Jan. 24, 2021 29 Patrick Mahomes vs. Cincinnati Jan. 29, 2023 Highest Completion Percentage, Career (100 attempts) 67.3 Patrick Mahomes (14 games: 523-352) 2017-22 64.9 Alex Smith (5 games: 185-120) 2013-17 60.3 Joe Montana (4 games: 141-85) 1993-94 56.9 Len Dawson (8 games: 188-107) 1962-75
77.8 Patrick
Feb. 12,
77.3 Alex Smith
Jan. 9, 2016 76.9 Patrick Mahomes vs. Pittsburgh (39-30) Jan. 16, 2022 76.3 Patrick Mahomes vs. Buffalo
Jan. 24, 2021 75.0 Patrick Mahomes vs.
Jan. 23, 2022
Mahomes vs. Philadelphia (27-21)
2023
at Houston (22-17)
(38-29)
Buffalo (44-33)
Patrick Mahomes
2017-22
4,084
(14 games)
Dec.
Jan.
(Min.
att.) 107.4 Patrick Mahomes 2017-22 96.0 Alex Smith 2013-17 77.4 Len Dawson 1962-75 Highest Passer Rating, Game (Min. 20 att.) 138.2 Patrick Mahomes vs. Pittsburgh Jan. 16, 2022 134.6 Patrick Mahomes vs. Houston Jan. 12, 2020 131.8 Patrick Mahomes vs. Philadelphia Feb. 12, 2023 127.6 Patrick Mahomes vs. Buffalo Jan. 24, 2021 124.8 Len Dawson at Buffalo Jan. 1, 1967
5,
Highest Passer Rating, Career
150
Most Pass Receptions, Career 133 Travis Kelce (18 games) 2013-22 84 Tyreek Hill (13 games) 2016-21 27 Otis Taylor (7 games) 1965-75 27 J.J. Birden (8 games) 1990-94 25 Sammy Watkins (6 games) 2018-20 Most Pass Receptions, Game 14 Travis Kelce vs. Jacksonville Jan. 21, 2023 13 Travis Kelce vs. Buffalo Jan. 24, 2021 11 Tyreek Hill vs. Buffalo Jan. 23, 2022 10 Travis Kelce vs. Houston Jan. 12, 2020 10 Travis Kelce at Tampa Bay Feb. 7, 2021 10 Travis Kelce vs. Cincinnati Jan. 30, 2022 Most Receiving Yards, Career 1,548 Travis Kelce (18 games) 2013-22 1,081 Tyreek Hill (13 games) 2016-21 481 Otis Taylor (7 games) 1965-75 477 Sammy Watkins (6 games) 2018-20 363 J.J. Birden (8 games) 1990-94 Most Receiving Yards, Game (All 100+) 172 Tyreek Hill vs. Buffalo Jan. 24, 2021 150 Dwayne Bowe at Indianapolis Jan. 4, 2014 150 Tyreek Hill vs. Buffalo Jan. 23, 2022 142 Stephone Paige at Miami Jan. 5, 1991 134 Travis Kelce vs. Houston Jan. 12, 2020 133 Travis Kelce at Tampa Bay Feb. 7, 2021 128 Travis Kelce at Houston Jan. 9, 2016 118 Travis Kelce vs. Buffalo Jan. 24, 2021 117 Otis Taylor at Oakland Dec. 22, 1968 116 Marquez Valdes-Scantling vs. Cincinnati Jan. 29, 2023 114 Sammy Watkins vs. New England Jan. 20, 2019 114 Sammy Watkins vs. Tennessee Jan. 19, 2020 110 Ed Podolak vs. Miami Dec. 25, 1971 110 Andre Rison vs. Denver Jan. 4, 1998
7 Travis Kelce (18
4 Tyreek Hill (13 games)
2 Sammy Watkins (6 games)
1 By seven players; Last, Dwayne Bowe vs. Indianapolis Colts
Longest
79 Donnie Avery at Indianapolis (from Alex Smith)
71 Tyreek Hill vs. Buffalo (from Patrick Mahomes)
64 Tyreek Hill vs. Buffalo (from Patrick Mahomes)
63 Elmo Wright vs. Miami (from Len Dawson)
63 Dwayne Bowe at Indianapolis (from Alex Smith)
61 Otis Taylor at N.Y. Jets (from Len Dawson)
60 Sammy Watkins vs. Tennessee (from Patrick Mahomes)
Most Receiving Touchdowns, Career
16 Travis Kelce (18 games)
5 Tyreek Hill (13 games)
4 Damien Williams (5 games)
2013-21
2016-21
2018-20
Jan. 4, 2013
Jan. 4, 2014
Jan. 24, 2021
Jan. 23, 2022
Dec. 25, 1971
Jan. 4, 2014
Dec. 20, 1969
Jan. 19, 2020
2013-22
2016-21
2018-19
3 Byron Pringle (8 games) 2018-21
2 Otis Taylor (7 games) 1965-75
2 Fred Jones (6 games)
COMBINED NET YARDS
24 Tommy Townsend (9 games)
11 Louie Aguiar (3 games)
Most Punts, Game
8 Jerrel Wilson at Oakland
Jan. 4, 1970
8 Bryan Barker at San Diego Jan. 2, 1993
Longest Punt
66
PUNT RETURNS
KICKOFF RETURNS
36 @CHIEFS 110 Tyreek Hill vs. Cleveland Jan.
109 Travis Kelce vs. Cleveland Jan.
108 Travis Kelce vs. Indianapolis Jan.
108 Travis Kelce vs. Pittsburgh Jan.
105 Tyreek Hill vs. San Francisco Feb.
104 Elmo Wright vs. Miami Dec.
Kimble Anders at Miami Dec.
Games, 100 or More Receiving Yards, Career
17, 2021
17, 2021
12, 2019
16, 2022
2, 2020
25, 1971 103
31, 1994 Most
games)
Pass Reception
1990-94
1997-08
2014-16 2
(9 games) 2019-22
Receiving Touchdowns, Game
Houston Jan. 12,
Jan.
Jan.
vs. Pittsburgh Jan. 16, 2022 2 Travis Kelce vs. Jacksonville Jan. 21, 2023
1990-93 2 J.J. Birden (8 games)
2 Tony Gonzalez (3 games)
2 Albert Wilson (4 games)
Mecole Hardman
Most
3 Travis Kelce vs.
2020 2 Damien Williams vs. New England
20, 2019 2 Tyreek Hill vs. Tennessee
19, 2020 2 Byron Pringle
Most Attempts, Career 134 Travis Kelce (18 games) 2013-22 115 Marcus Allen (6 games) 1993-97 102 Damien Williams (5 games) 2018-19 96 Tyreek Hill (13 games) 2016-21 74 Mike Garrett (6 games) 1966-70 Most Attempts, Game 34 Barry Word vs. L.A. Raiders Dec. 28, 1991 30 Ed Podolak vs. Miami Dec. 25, 1971 30 Damien Williams vs. Indianapolis Jan. 12, 2019 29 Priest Holmes vs. Indianapolis Jan. 11, 2004 Most Net Yards, Career 1,550 Travis Kelce (18 games) 2013-22 1,172 Tyreek Hill (13 games) 2016-21 541 Marcus Allen (6 games) 1993-97 540 Damien Williams (5 games) 2018-19 489 Sammy Watkins (6 games) 2018-20 Most Net Yards, Game *350 Ed Podolak vs. Miami Dec. 25, 1971 227 Dante Hall vs. Indianapolis Jan. 11, 2004 208 Priest Holmes vs. Indianapolis Jan. 11, 2004 172 Tyreek Hill vs. Buffalo Jan. 24,
154 Damien Williams vs. Indianapolis Jan. 12,
150 Dwayne Bowe at Indianapolis Jan. 4, 2014
RECORD
Most Punts, Career 43 Dustin Colquitt (12 games) 2005-19 39 Jerrel Wilson (7 games) 1963-77 38 Bryan Barker (7 games) 1990-93
2021
2019
*NFL
PUNTING
2020-22
1994-98
Dustin Colquitt at Indianapolis Jan. 6, 2007
Louie Aguiar vs. Denver Jan. 4, 1998
Jerrel Wilson vs. Green Bay Jan. 15, 1967
Tommy Townsend vs. Jacksonville Jan. 21, 2023 59 Jerrel Wilson vs. Minnesota Jan. 11, 1970 Highest Punting Average, Career (20 punts) 44.8 Dustin Colquitt (12 games: 1,938-43) 2005-19 43.4 Jerrel Wilson (7 games: 1,693-39) 1963-77 43.3 Tommy Townsend (9 games: 1,038-24) 2020-22 42.4 Bryan Barker (7 games: 1,613-38) 1990-93
Punting Average, Game (4 punts) 52.3 Dustin Colquitt at IND (314-6) Jan. 6, 2007 52.3 Tommy Townsend vs. Cincinnati (209-4) Jan. 30, 2022 50.8 Tommy Townsend vs. Jacksonville (203-4) Jan. 21, 2023 50.0 Dustin Colquitt vs. Tennessee (250-5) Jan. 6, 2018 48.5 Jerrel Wilson vs. Minnesota (194-4) Jan. 11, 1970
62
61
60
Highest
Most Punt Returns, Career 12 Tyreek Hill (13 games) 2016-21 11 Mike Garrett (6 games) 1966-70 7 Danan Hughes (6 games) 1993-98 7 Mecole Hardman (9 games) 2019-21 Most Punt Returns, Game 5 Tyreek Hill vs. Indianapolis Jan. 12, 2019 4 Mike Garrett vs. Oakland Jan. 4, 1970 4 Tamarick Vanover vs. Indianapolis Jan. 7, 1996 4 Frankie Hammond Jr. at Houston Jan. 9, 2016 Most Punt Return Yards, Career 112 Kadarius Toney (3 games) 2022 86 Mecole Hardman (10 games) 2019-22 84 Danan Hughes (6 games) 1993-98 73 Mike Garrett (6 games) 1966-70 61 Frankie Hammond Jr. (2 games) 2015 Most Punt Return Yards, Game 77 Kadarius Toney vs. Philadelphia Feb. 12, 2023 70 Mecole Hardman vs. Pittsburgh Jan. 16, 2022 45 Tyreek Hill vs. Buffalo Jan. 23, 2022 42 Danan Hughes at Houston Jan. 16, 1994 37 Mike Garrett at Buffalo Jan. 1, 1967 Longest Punt Return 65 Kadarius Toney vs. Philadelphia Feb. 12, 2023 48 Mecole Hardman vs. Pittsburgh Jan. 16, 2022 45 Tyreek Hill vs. Buffalo Jan. 23, 2022 35 Danan Hughes at Houston Jan. 16, 1994 29 Skyy Moore vs. Cincinnati Jan. 29, 2023 Highest Punt Return Average, Career (10 returns) 6.6 Mike Garrett (6 games: 11-73) 1966-70 3.3 Tyreek Hill (13 games: 12-40) 2016-21 Highest Punt Return Average, Game (3 returns) 23.3 Mecole Hardman vs. Pittsburgh (3-70) Jan. 16, 2022 14.0 Danan Hughes at Houston (3-42) Jan. 16, 1994 12.3 Mike Garrett at Buffalo (3-37) Jan. 1, 1967 10.3 Danan Hughes vs. Pittsburgh (3-31) Jan. 8, 1994 Most Touchdowns None
Kickoff Returns, Career 14 Mecole Hardman (6 games) 2019-21 10 John Stephens (3 games) 1993 10 Dante Hall (2 games) 2000-06 10 Byron Pringle (9 games) 2018-21
Quintin Demps (1 game)
Kickoff Returns, Game
Dante Hall vs. Indianapolis Jan. 11, 2004 7 Quintin Demps at Indianapolis Jan. 4, 2014 6 Mecole Hardman vs. Houston Jan. 12, 2020 5 Noland Smith vs. Oakland Dec. 22, 1968 5 John Stephens at Buffalo Jan. 23, 1994 Most Kickoff Return Yards, Career 312 Mecole Hardman (9 games) 2019-21 266 Dante Hall (2 games) 2000-06
Most
7
2013 Most
7
SACKS
37 @CHIEFS 243 Byron Pringle (9 games) 2018-21 199 John Stephens (3 games) 1993 196 Knile Davis (3 games) 2013-15
Kickoff Return Yards, Game 208 Dante Hall vs. Indianapolis Jan. 11, 2004 187 Quintin Demps at Indianapolis Jan. 4, 2014 154 Ed Podolak vs. Miami Dec. 25, 1971 142 Mecole Hardman vs. Houston Jan. 12, 2020 106 Knile Davis at Houston Jan. 9, 2016
Most
106 (TD) Knile Davis at Houston Jan. 9, 2016 92 (TD) Dante Hall vs. Indianapolis Jan. 11, 2004 78 Ed Podolak vs. Miami Dec. 25, 1971 58 Mecole Hardman vs. Houston Jan. 12, 2020 46 Dante Hall vs. Indianapolis Jan. 11, 2004 36 Dexter McCluster vs. Baltimore Jan. 9, 2011 35 Bert Coan at Buffalo Jan. 1, 1967
Longest Kickoff Return
26.6 Dante Hall (2 games: 10-266) 2000-06 24.3 Byron Pringle (9 games: 10-243) 2018-21 22.3 Mecole Hardman (9 games: 14-312) 2019-21 19.9 John Stephens (3 games: 10-199) 1993
Highest Kickoff Return Average, Career (10 returns)
Ed Podolak vs. Miami (3-154) Dec. 25, 1971
Knile Davis at New England (3-90) Jan. 16, 2016 29.7 Dante Hall vs. Indianapolis (7-208) Jan. 11, 2004 26.7 Quintin Demps at Indianapolis (7-187) Jan. 4, 2014 24.8 Tremon Smith vs. New England (4-99) Jan. 20, 2019 24.0 John Stephens vs. Pittsburgh (3-72) Jan. 8, 1994 23.7 Mecole Hardman vs. Houston (6-142) Jan. 12, 2020 23.0 Tamarick Vanover vs. Denver (3-69) Jan. 4, 1998 Most Kickoff Return Touchdowns, Career 1 Dante Hall (2 games) 2000-06 1 Knile Davis (2 games) 2013-15
Most Interceptions, Career 5 Emmitt Thomas (7 games) 1966-78 4 Johnny Robinson (8 games) 1960-70 3 Jim Marsalis (4 games) 1969-75 3 Deron Cherry (4 games) 1981-91 Most Interceptions, Game 2 Johnny Robinson vs. Houston Dec. 23, 1962 2 Jim Marsalis at N.Y. Jets Dec. 20, 1969 2 Emmitt Thomas at Oakland Jan. 4, 1970 2 Deron Cherry vs. L.A. Raiders Dec. 28, 1991 2 Ty Law at Indianapolis Jan. 6, 2007 2 Husain Abdullah at Indianapolis Jan. 4, 2014 Most Interception Return Yards, Career 131 Johnny Robinson (8 games) 1960-71 101 Emmitt Thomas (7 games) 1966-78 65 Jim Marsalis (4 games) 1969-75 Most Interception Return Yards, Game 72 Johnny Robinson at Bufalo Jan. 1, 1967 69 Emmitt Thomas vs. Oakland Jan. 4, 1970 50 Johnny Robinson vs. Houston Dec. 23, 1962 Longest Interception Return 72 Johnny Robinson at Buffalo Jan. 1, 1967 62 Emmitt Thomas at Oakland Jan. 4, 1970 43 Ty Law at Indianapolis Jan. 6, 2007 37 Johnny Robinson vs. Houston Dec. 23, 1962 Most Interception Return TDs, Career None
Highest Kickoff Return Average, Game (3 returns) 51.3
30.0
INTERCEPTIONS BY
Most Sacks, Career 10.5 Frank Clark (11 games) 2019-22 6.5 Derrick Thomas (10 games) 1989-99 6.5 Neil Smith (9 games) 1988-96 5.0 Aaron Brown (6 games) 1966-72 4.0 Justin Houston (7 games) 2011-18 Most Sacks, Game 3.0 Aaron Brown at Oakland Jan. 4, 1970 3.0 Frank Clark vs. Houston Jan. 12, 2020 2.0 11 times; By 10 players Last: Chris Jones vs. Cincinnati Jan. 29, 2023
SCORING
FIRST DOWNS
NET YARDS RUSHING AND PASSING
PASSING
RUSHING
38 @CHIEFS
Most Points, Game 51 vs. Houston Jan. 12, 2020 44 at Indianapolis Jan. 4, 2014 42 vs. Pittsburgh Jan. 16, 2022 42 vs. Buffalo Jan. 23, 2022 38 vs. Buffalo Jan. 24, 2021 38 vs. Philadelphia Feb. 12, 2023 Most Touchdowns, Game 7 vs. Houston Jan. 12, 2020 6 vs. Pittsburgh Jan. 16, 2022 5 at Indianapolis Jan. 4, 2014 5 vs. Tennessee Jan. 19, 2020 5 vs. Buffalo Jan. 24, 2021 4 Six times; Last, vs. San Francisco Feb. 2, 2020
Most First Downs, Game 30 at Indianapolis Jan. 4, 2014 30 vs. Buffalo Jan. 23, 2022 29 vs. Indianapolis Jan. 12, 2019 29 vs. Houston Jan. 12, 2020 29 vs. Buffalo Jan. 24, 2021 28 vs. Pittsburgh Jan. 8, 1994 Fewest First Downs, Game 7 at Indianapolis Jan. 6, 2007 8 vs. Baltimore Jan. 9, 2011 13 at Oakland Dec. 22, 1968 13 at Oakland Jan. 4, 1970 14 Three times; Last, at Buffalo Jan. 5, 1992
Most Net Yards, Game (All 400+) 552 vs. Buffalo Jan. 23, 2022 513 at Indianapolis Jan. 4, 2014 478 vs. Pittsburgh Jan. 16, 2022 451 vs. Miami Dec. 25, 1971 439 vs. Buffalo Jan. 24, 2021 438 vs. Cleveland Jan. 17, 2021 434 vs. Houston Jan. 12, 2020 433 vs. Indianapolis Jan. 12, 2019 414 at Miami Dec. 31, 1994 408 vs. Indianapolis Jan. 11, 2004 404 vs. Tennessee Jan. 19, 2020 401 vs. Pittsburgh Jan. 8, 1994 Fewest Net Yards, Game 126 at Indianapolis Jan. 6, 2007 161 vs. Baltimore Jan. 9, 2011 204 vs. L.A. Raiders Dec. 28, 1991 207 at Oakland Jan. 4, 1970 213 at Buffalo Jan. 5, 1992
Most Rushing Attempts, Game 54 vs. Houston Dec. 23, 1962 44 vs. Miami Dec. 25, 1971 41 vs. Minnesota Jan. 11, 1970 Fewest Rushing Attempts, Game 12 vs. New England Jan. 20, 2019 14 vs. Pittsburgh Jan. 15, 2017 16 vs. Tennessee Jan. 6, 2018 17 at Indianapolis Jan. 6, 2007 17 at Tampa Bay Feb. 7, 2021 Most Rushing Yards, Game 213 vs. Miami Dec. 25, 1971 199 vs. Houston Dec. 23, 1962 196 vs. Indianapolis Jan. 11, 2004 182 vs. Buffalo Jan. 23, 2022 180 vs. Indianapolis Jan. 12, 2019
Rushing Yards, Game 41 vs. New England Jan. 20, 2019 42 vs. Cincinnati Jan. 29, 2023 44 at Indianapolis Jan. 6, 2007 52 at Buffalo Jan. 23, 1994 61 at San Diego Jan. 2, 1993 61 vs. Pittsburgh Jan. 15, 2017 Most Rushing Touchdowns, Game 4 vs. Indianapolis Jan. 12, 2019 2 at Buffalo Jan. 1, 1967 2 at Oakland Jan. 4, 1970 2 vs. Miami Dec. 25, 1971 2 vs. Indianapolis Jan. 11, 2004 2 vs. Houston Jan. 12, 2020 2 vs. Tennessee Jan. 19, 2020 2 vs. San Francisco Feb. 2, 2020 2 vs. Buffalo Jan. 24, 2021 2 vs. Buffalo Jan. 23, 2022
Fewest
Passing Attempts, Game (All 40+) 52 at Buffalo Jan. 23, 1994 50 at New England Jan. 16, 2016 49 at Tampa Bay Feb. 7, 2021 46 at Indianapolis Jan. 4, 2014 44 vs. Pittsburgh Jan. 8, 1994 44 vs. Buffalo Jan. 23, 2022 43 vs. Cincinnati Jan. 29, 2023 42 vs. San Francisco Feb. 2, 2020 41 vs. Indianapolis Jan. 12, 2019 40 vs. Pittsburgh Jan. 16, 2022 Fewest Passing Attempts, Game 14 vs. Houston Dec. 23, 1962 14 vs. L.A. Raiders Dec. 28, 1991 17 at Oakland Jan. 4, 1970 17 vs. Minnesota Jan. 11, 1970 Most Completions, Game 33 vs. Buffalo Jan. 23, 2022 31 vs. Pittsburgh Jan. 16, 2022 30 at Indianapolis Jan. 4, 2014 29 vs. Pittsburgh Jan. 8, 1994 29 at New England Jan. 16, 2016 29 vs. Buffalo Jan. 24, 2021 29 vs. Cincinnati Jan. 29, 2023 Fewest Completions, Game 7 at Oakland Jan. 4, 1970 9 vs. Houston Dec. 23, 1962 9 vs. L.A. Raiders Dec. 28, 1991 9 vs. Baltimore Jan. 9, 2011 Most Gross Passing Yards, Game (All 300+) 406 vs. Pittsburgh Jan. 16, 2022 378 at Indianapolis Jan. 4, 2014 378 vs. Buffalo Jan. 23, 2022 326 vs. Cincinnati Jan. 29, 2023 325 vs. Buffalo Jan. 24, 2021 323 at Buffalo Jan. 23, 1994 321 vs. Houston Jan. 12, 2020 321 vs. Cleveland Jan. 17, 2021 314 at Miami Dec. 31, 1994 Fewest Gross Passing Yards, Game 70 vs. Baltimore Jan. 9, 2011 88 vs. Houston Dec. 23, 1962 79 vs. L.A. Raiders Dec. 28, 1991 107 at Indianapolis Jan. 6, 2007 Most Times Sacked, Game 9 at Buffalo Jan. 1, 1967 7 at San Diego Jan. 2, 1993 6 vs. Houston Dec. 23, 1962 6 vs. Green Bay Jan. 15, 1967 Most Passing Touchdowns, Game 6 vs. Pittsburgh Jan. 16, 2022 5 vs. Houston Jan. 12, 2020 4 at Indianapolis Jan. 4, 2014 3 at Houston Jan. 16, 1994 3 vs. New England Jan. 20, 2019 3 vs. Tennessee Jan. 19, 2020 3 vs. Buffalo Jan. 24, 2021 3 vs. Buffalo Jan. 23, 2022 3 vs. Cincinnait Jan. 30, 2022 3 vs. Jacksonville Jan. 21, 2023
Most
39 @CHIEFS 3 vs. Philadelphia Feb. 12, 2023 Most Interceptions Thrown, Game 4 at Oakland Dec. 22, 1968 4 at Buffalo Jan. 5, 1992 3 vs. Indianapolis Jan. 7, 1996 3 vs. Baltimore Jan. 9, 2011 PENALTIES Most Penalties, Game 10 at Buffalo Jan. 5, 1992 9 vs. Tennessee Jan. 19, 2020 8 vs. Tennessee Jan. 6, 2018 7 Four times; Last vs. Cleveland Jan. 17, 2021 Fewest Penalties, Game 1 at N.Y. Jets Dec. 28, 1986 1 vs. Buffalo Jan. 23, 2022 2 at Indianapolis Jan. 6, 2007 2 at Indianapolis Jan. 4, 2014 2 vs. Cincinnati Jan. 30, 2022 3 Six times; Last vs. Philadelphia Feb. 12, 2023 Most Yards Penalized, Game 68 vs. Tennessee Jan. 6, 2018 65 vs. Denver Jan. 4, 1998 63 at N.Y. Jets Dec. 20, 1969 62 at San Diego Jan. 2, 1993
Yards Penalized, Game 5 at N.Y. Jets Dec. 28, 1986 10 vs. Buffalo Jan. 23, 2022 11 vs. Cincinnati Jan. 30, 2022 13 at Indianapolis Jan. 6, 2007 14 vs. Philadelphia Feb. 12, 2023 FUMBLES Most Fumbles, Game 5 at Oakland Jan. 4, 1970 3 Five times; Last, vs. San Francisco Feb. 2, 2020 Most Fumbles Lost, Game 4 at Oakland Jan. 4, 1970 2 vs. Miami Dec. 25, 1971 2 vs. Baltimore Jan. 9, 2011 Most Turnovers, Game 5 vs. Baltimore Jan. 9, 2011 4 at Oakland Dec. 22, 1968 4 at Oakland Jan. 4, 1970 4 vs. Miami Dec. 25, 1971 4 at Buffalo Jan. 5, 1992 4 vs. Indianapolis Jan. 7, 1996
Fewest
FIRST DOWNS
NET YARDS RUSHING AND PASSING
PASSING
40 @CHIEFS
Fewest Points Allowed, Game 0 at Houston Jan. 9, 2016 6 at N.Y. Jets Dec. 20, 1969 6 vs. L.A. Raiders Dec. 28, 1991 Most Points Allowed, Game 45 at Indianapolis Jan. 4, 2014 41 at Oakland Dec. 22, 1968 38 vs. Indianapolis Jan. 11, 2004 37 at Buffalo Jan. 5, 1992 37 vs. New England (OT) Jan. 20, 2019 Fewest Touchdowns Allowed, Game 0 at N.Y. Jets Dec. 20, 1969 0 vs. L.A. Raiders Dec. 28, 1991 0 at Houston Jan. 9, 2016 0 vs. Pittsburgh Jan. 15, 2017 Most Touchdowns Allowed, Game 6 at Indianapolis Jan. 4, 2014 5 vs. Green Bay Jan. 15, 1967 5 at Oakland Dec. 22, 1968 5 at N.Y. Jets Dec. 28, 1986 5 vs. Indianapolis Jan. 11, 2004 5 vs. New England Jan. 20, 2019 5 vs. Buffalo Jan. 23, 2022
SCORING
Fewest First Downs Allowed, Game 9 at Buffalo Jan. 1, 1967 13 vs. Minnesota Jan. 11, 1970 14 at Houston Jan. 9, 2016 15 vs. Indianapolis Jan. 12, 2019 16 Three times; Last vs. Denver Jan. 4, 1998 Most First Downs Allowed, Game 36 vs. New England Jan. 20, 2019 30 at Buffalo Jan. 23, 1994 29 at Buffalo Jan. 5, 1992 28 at Indianapolis Jan. 6, 2007 28 at Indianapolis Jan. 4, 2014
Fewest Net Yards Allowed, Game 226 at Houston Jan. 9, 2016 233 at Oakland Jan. 4, 1970 235 at N.Y. Jets Dec. 20, 1969 239 vs. Minnesota Jan. 11, 1970 249 vs. Indianapolis Jan. 7, 1996 Most Net Yards Allowed, Game 536 at Indianapolis Jan. 4, 2014 524 vs. New England Jan. 20, 2019 454 at Oakland Dec. 22, 1968 448 at Buffalo Jan. 5, 1992 442 vs. Houston Jan. 12, 2020 RUSHING Fewest Rushing Attempts, Game 13 at Buffalo Jan. 1, 1967 14 at Houston Jan. 16, 1994 14 at New England Jan. 16, 2016 14 vs. Indianapolis Jan. 12, 2019 17 vs. Cincinnati Jan. 29, 2023 Most Rushing Attempts, Game 48 vs. New England Jan. 20, 2019 46 at Buffalo Jan. 5, 1992 46 at Buffalo Jan. 23, 1994 43 vs. Miami Dec. 25, 1971 Fewest Rushing Yards Allowed, Game 38 at New England Jan. 16, 2016 39 at Houston Jan. 16, 1994 40 at Buffalo Jan. 1, 1967 56 vs. Pittsburgh Jan. 16, 2022 67 vs. Minnesota Jan. 11, 1970 Most Rushing Yards Allowed, Game 229 at Buffalo Jan. 23, 1994 202 vs. Tennessee Jan. 6, 2018 192 at San Diego Jan. 2, 1993 188 at Indianapolis Jan. 6, 2007 180 at Buffalo Jan. 5, 1992 Most Rushing Touchdowns Allowed, Game 4 vs. New England Jan. 20, 2019 3 vs. Green Bay Jan. 15, 1967 3 at Buffalo Jan. 23, 1994 3 vs. Philadelphia Feb. 12, 2023 2 Four times; Last, vs. Indianapolis Jan. 11, 2004
Fewest Passing Attempts Allowed, Game 19 vs. Denver Jan. 4, 1998 23 at N.Y. Jets Dec. 28, 1986 23 vs. L.A. Raiders Dec. 28, 1991 23 at San Diego Jan. 2, 1993 Most Passing Attempts Allowed, Game 52 vs. Houston Jan. 12, 2020 48 vs. Buffalo Jan. 24, 2021 46 vs. Houston Dec. 23, 1962 46 vs. New England Jan. 20, 2019 45 at Oakland Jan. 4, 1970 45 at Indianapolis Jan. 4, 2014 Fewest Completions Allowed, Game 10 vs. Denver Jan. 4, 1998 12 at Buffalo Jan. 1, 1967 12 vs. L.A. Raiders Dec. 28, 1991 12 vs. Indianapolis Jan. 7, 1996 Most Completions Allowed, Game 32 at Houston Jan. 16, 1994 31 at Indianapolis Jan. 6, 2007 31 vs. Houston Jan. 12, 2020 30 vs. New England Jan. 20, 2019 29 at Indianapolis Jan. 4, 2014 29 vs. Pittsburgh Jan. 16, 2022 Fewest Gross Passing Yards Allowed, Game 112 vs. Indianapolis Jan. 7, 1996 136 at Houston Jan. 9, 2016 140 vs. L.A. Raiders Dec. 28, 1991 153 at N.Y. Jets Dec. 28, 1986 160 at Buffalo Jan. 23, 1994 Most Passing Yards Allowed, Game 443 at Indianapolis Jan. 4, 2014 388 vs. Houston Jan. 12, 2020 348 vs. New England Jan. 20, 2019 347 at Oakland Dec. 22, 1968 329 vs. Buffalo Jan. 23, 2022 Most Passing Touchdowns Allowed, Game 5 at Oakland Dec. 22, 1968 4 at Indianapolis Jan. 4, 2014 4 vs. Buffalo Jan. 23, 2022 3 Five times; Last, at Tampa Bay Feb. 7, 2021
Most Sacks, Game 9 at Houston Jan. 16, 1994 5 at San Diego Jan. 2, 1993 5 vs. Houston Jan. 12, 2020 5 vs. Cincinnati Jan. 29, 2023 4 at Buffalo Jan. 1, 1967 4 at Oakland Jan. 4, 1970 4 vs. Baltimore Jan. 9, 2011 4 vs. Buffalo Jan. 24, 2021
Most Interceptions By, Game 5 vs. Houston Dec. 23, 1962 4 at Oakland Jan. 4, 1970 4 vs. L.A. Raiders Dec. 28, 1991 4 at Houston Jan. 9, 2016
SACKS
INTERCEPTIONS
SINGLE GAME SCORING
3 Peyton Manning, Indianapolis
3 Tom Brady, Tampa Bay
Jan. 11, 2004
Jalen Hurts, Philadelphia
12, 2023 2 Max McGee, Green Bay Jan. 15, 1967 2 Elijah Pitts, Green Bay Jan. 15, 1967
2 Warren Wells, Oakland
Dec. 22, 1968
2 Freeman McNeil, N.Y. Jets Dec. 28, 1986
2 Andre Reed, Buffalo
2 Terrell Davis, Denver
2 Edgerrin James, Indianapolis
Jan. 5, 1992
Jan. 4, 1998
Jan. 11, 2004
2 T.Y. Hilton, Indianapolis Jan. 4, 2014
2 Donald Brown, Indianapolis
Jan. 4, 2014
2 Rob Gronkowski, New England Jan. 16, 2016
2 Rex Burkhead, New England Jan. 20, 2019
2 Sony Michel, New England Jan. 20, 2019
2 Rob Gronkowski, Tampa Bay Feb. 7, 2021 Field Goals 6 Chris Boswell, Pittsburgh Jan. 15, 2017
4 Tyler Bass, Buffalo
4 Evan McPherson, Cincinnati
3 Scott Norwood, Buffalo
3 Steve Christie, Buffalo
3 Adam Vinatieri, Indianapolis
3 Billy Cundiff, Baltimore
Jan. 24, 2021
Jan. 30, 2022
Jan. 5, 1992
Jan. 23, 1994
Jan. 6, 2007
Jan. 9, 2011
PASSING
RUSHING Rushing
Passing
302 Tom Brady, New England
Long Pass
75 Josh Allen to Gabriel Davis, Buffalo
69 Jack Kemp to Elbert Dubenion, Buffalo
Touchdown Passes
5 Daryle Lamonica, Oakland
4 Andrew Luck, Indianapolis
4 Josh Allen, Buffalo
3 Pat Ryan, N.Y. Jets
3 Jim Kelly, Buffalo
3 Neil O'Donnell, Pittsburgh
Jan. 16, 2016
Jan. 23, 2022
Jan. 1, 1967
Dec. 22, 1968
Jan. 4, 2014
Jan. 23, 2022
Dec. 28, 1986
Jan. 5, 1992
Jan. 8, 1994
41 @CHIEFS
Total Points 24 Gabriel Davis, Buffalo Jan. 23, 2022 18 Fred Biletnikoff, Oakland Dec. 22, 1968 18 Thurman Thomas, Buffalo Jan. 23, 1994 18 Chris Boswell, Pittsburgh Jan. 15, 2017 18 Jalen Hurts, Philadelphia Feb. 12, 2023 15 Scott Norwood, Buffalo Jan. 5,
14 Steve Christie. Buffalo Jan.
Total Touchdowns 4
3
3
3
1992
23, 1994
Gabriel Davis, Buffalo Jan. 23, 2022
Fred Biletnikoff, Oakland Dec. 22, 1968
Thurman Thomas, Buffalo Jan. 23, 1994
Feb.
Pass Attempts (All 40+) 52 Deshaun Watson, Houston Jan. 12, 2020 48 Josh Allen, Buffalo Jan. 24, 2021 46 George Blanda, Houston Dec. 23, 1962 46 Tom Brady, New England Jan. 20, 2019 45 Andrew Luck, Indianapolis Jan. 4, 2014 44 Ben Roethlisberger, Pittsburgh Jan. 16, 2022 43 Warren Moon, Houston Jan. 16, 1994 42 Neil O Donnell, Pittsburgh Jan. 8, 1994 42 Tom Brady, New England Jan. 16, 2016 41 Joe Burrow, Cincinnati Jan. 29, 2023 40 Joe Namath, N.Y. Jets Dec. 20, 1969 Pass Completions 32 Warren Moon, Houston Jan. 16, 1994 31 Peyton Manning, Indianapolis Jan. 6, 2007 31 Deshaun Watson, Houston Jan. 12, 2020 30 Tom Brady, New England Jan. 20, 2019 29 Andrew Luck, Indianapolis Jan. 4, 2014 29 Ben Roethlisberger, Pittsburgh
28 Tom Brady, New England
16,
28 Josh Allen, Buffalo
24,
Jan. 16, 2022
Jan.
2016
Jan.
2021
Yards
300+) 443 Andrew Luck, Indianapolis
4,
388 Deshaun Watson, Houston Jan. 12,
348 Tom Brady, New England
20,
345 Daryle Lamonica, Oakland
22, 1968 329 Josh Allen, Buffalo
306 Warren Moon, Houston
304 Peyton Manning, Indianapolis
Jalen
Philadelphia
(All
Jan.
2014
2020
Jan.
2019
Dec.
Jan. 23, 2022
Jan. 16, 1994
Jan. 11, 2004 304
Hurts,
Feb. 12, 2023
Feb.
Thrown 5 George Blanda, Houston Dec. 23, 1962
Marinovich, L.A. Raiders Dec. 28, 1991 4
Hoyer, Houston Jan. 9, 2016
Namath, N.Y. Jets Dec. 20, 1969
Lamonica, Oakland Jan. 4, 1970
Buffalo Jan. 5, 1992
Indianapolis Jan. 6, 2007
Luck, Indianapolis Jan. 4, 2014
7, 2021 Interceptions
4 Todd
Brian
3 Joe
3 Daryle
3 Jim Kelly,
3 Peyton Manning,
3 Andrew
Attempts 33 Thurman Thomas, Buffalo Jan. 23, 1994 31 Freeman McNeil, N.Y. Jets Dec. 28, 1986 30 Le'Veon Bell, Pittsburgh Jan. 15, 2017 29 Sony Michel, New England Jan. 20, 2019 26 Edgerrin James, Indianapolis Jan. 11, 2004 Rushing Yards (All 100+) 186 Thurman Thomas, Buffalo Jan. 23, 1994 170 Le'Veon Bell, Pittsburgh Jan. 15, 2017 156 Derrick Henry, Tennessee Jan. 6, 2018 135 Freeman McNeil, N.Y. Jets Dec. 28, 1986 125 Edgerrin James, Indianapolis Jan. 11, 2004 122 Joseph Addai, Indianapolis Jan. 6, 2007 119 Marion Butts, San Diego Jan. 2, 1993 113 Sony Michel, New England Jan. 20, 2019 107 Nick Bell, L.A. Raiders Dec. 28, 1991 101 Terrell Davis, Denver Jan. 4, 1998 100 Thurman Thomas, Buffalo Jan. 5, 1992 Rushing Touchdowns 3 Thurman Thomas, Buffalo Jan. 23, 1994 3 Jalen Hurts, Philadelphia Feb. 12, 2023 2 Elijah Pitts, Green Bay Jan. 15, 1967 2 Freeman McNeil, N.Y. Jets Dec. 28, 1986 2 Terrell Davis, Denver Jan. 4, 1998 2 Edgerrin James, Indianapolis Jan. 11, 2004 2 Rex Burkhead, New England Jan. 20, 2019 2 Sony Michel, New England Jan. 20, 2019 Long Run 54 Marion Butts, San Diego Jan. 2, 1993 RECEVING Pass Receptions 13 T.Y. Hilton, Indianapolis Jan. 4, 2014 10 Todd Heap, Baltimore Jan. 9, 2011 10 Julian Edelman, New England Jan. 16, 2016 9 Haywood Jeffires, Houston Jan. 16, 1994 9 Dallas Clark, Indianapolis Jan. 6, 2007 8 Charles Smith, Oakland Jan. 4, 1970 8 Gabriel Davis, Buffalo Jan. 23, 2022 Receiving Yards (All 100+) 224 T.Y. Hilton, Indianapolis Jan. 4, 2014 201 Gabriel Davis, Buffalo Jan. 23, 2022 180 Fred Biletnikoff, Oakland Dec. 22, 1968 140 Paul Warfield, Miami Dec. 25, 1971 138 Max McGee, Green Bay Jan. 15, 1967 127 Bobby Burnett, Buffalo Jan. 11, 1967 118 DeAndre Hopkins, Houston Jan. 12, 2020 111 John Henderson, Minnesota Jan. 11, 1970 108 Todd Heap, Baltimore Jan. 9, 2011 108 Antonio Brown, Pittsburgh Jan. 15, 2017 103 Dallas Clark, Indianapolis Jan. 6, 2007 103 Tee Higgins, Cincinnati Jan. 30, 2022 100 Andre Reed, Buffalo Jan. 5, 1992 100 Julian Edelman, New England Jan. 16, 2016 100 DeVonta Smith, Philadelphia Feb. 12, 2023 Touchdown Receptions 4 Gabriel Davis, Buffalo Jan. 23, 2022 3 Fred Biletnikoff, Oakland Dec. 22, 1968 2 Max McGee, Green Bay Jan. 15, 1967 2 Warren Wells, Oakland Dec. 22, 1968 2 Andre Reed, Buffalo Jan. 5, 1992 2 T.Y. Hilton, Indianapolis Jan. 4, 2014
2 Rob Gronkowski, New England
2 Rob Gronkowski, Tampa Bay
Jan. 16, 2016
Feb. 7, 2021
DEFENSE / SPECIAL TEAMS
Interceptions Made
2 Kirby Jackson, Buffalo
Long Interception Return
50 Willie Wood, Green Bay
Long Punt Return
27 Britain Covey, Philadelphia
Long Kickoff Return
63 Jamal Agnew, Jacksonville
Long Punt
64 Reggie Roby, Miami
Long Field Goal (All 50+)
58 Pete Stoyanovich, Miami
52 Ryan Succop, Tampa Bay
52 Evan McPherson, Cincinnati
51 Tyler Bass, Buffalo
50 Adam Vinatieri, Indianapolis
Sacks
3 Gerald Williams, Pittsburgh
3 Whitney Mercilus, Houston
Jan. 5, 1992
Jan. 15, 1967
Feb. 12, 2023
Jan. 21, 2023
Jan. 5, 1991
Jan. 5, 1991
Feb. 7, 2021
Jan. 30, 2022
Jan. 24, 2021
Jan. 6, 2007
Jan. 8, 1994
Jan. 9, 2016
42 @CHIEFS
CHIEFS SUPERLATIVES RECEIVING
43 @CHIEFS
100-Yard Pass Receivers (1960-2006) Date Opponent Player Rec.Yds.Avg.LGTD Result 1. 10/2/60 N.Y. Titans Johnny Robinson 3 120 40.0 72 0 L, 35-37 2. 12/18/60 Buffalo Johnny Robinson 4 130 32.574t 1 W, 24-7 3. 9/24/61 @ Oakland Chris Burford 6 101 16.8 32 1 W, 42-35 4. 11/3/61 @ Boston Chris Burford 7 137 19.642t 1 L, 21-28 5. 11/12/61 Buffalo Chris Burford 9 102 11.3 36 0 L, 20-30 6. 12/3/61 @ N.Y. Titans Abner Haynes 6 127 21.2 43 0 L, 7-28 7. 12/3/61 @ N.Y. Titans Chris Burford 3 105 35.0 54 0 8. 12/10/61 Denver Johnny Robinson 6 112 18.745t 1 W, 49-21 9. 10/12/62 @ Boston Chris Burford 10 171 17.131t 1 W, 27-7 10. 10/21/62 N.Y. Titans Abner Haynes 4 121 30.3 78 1 W, 20-17 11. 11/18/62 @ Denver Fred Arbanas 3 117 39.047t 1 W, 24-3 12. 9/7/63 @ Denver Frank Jackson 7 149 21.381t 2 W, 59-7 13. 9/22/63 @ Buffalo Chris Burford 11 106 9.6 19t 2 T, 27-27 14. 10/13/63 Buffalo Chris Burford 10 100 10.033t 1 L, 26-35 15. 10/20/63 San Diego Abner Haynes 8 149 18.673t 1 L, 17-38 16. 12/1/63 @ N.Y. Jets Frank Jackson 6 110 18.3 48 0 L, 0-17 17. 9/13/64 @ Buffalo Fred Arbanas 6 113 18.8 42 1 L, 17-34 18. 9/27/64 @ Oakland Abner Haynes 5 117 23.456t 1 W, 21-9 19. 10/4/64 Houston Chris Burford 8 143 17.950t 2 W, 28-7 20. 10/4/64 Houston Fred Arbanas 4 131 32.8 59 0 21. 10/11/64 @ Denver Chris Burford 5 108 21.6 36 2 L, 27-33 22. 10/11/64 @ Denver Fred Arbanas 5 103 20.6 33 1 23. 11/1/64 Denver Abner Haynes 5 106 21.2 40 1 W, 49-39 24. 11/1/64 Denver Curtis McClinton 4 103 25.866t 2 25. 11/29/64 @ N.Y. Jets Frank Jackson 10 175 17.5 34 0 L, 14-27 26. 12/6/64 Boston Frank Jackson 7 144 20.6 72 0 L, 24-31 27. 12/13/64 @ San Diego Frank Jackson 8 142 17.864t 4 W, 49-6 28. 11/21/65 @ Boston Chris Burford 9 120 13.3 34 1 T, 10-10 29. 11/28/65 Houston Frank Jackson 5 118 23.6 45 1 W, 52-21 30. 12/19/65 Denver Curtis McClinton 5 213 42.6 69 0 W, 45-35 31. 12/19/65 Denver Otis Taylor 6 110 18.3 41 1 32. 9/25/66 @ Boston Chris Burford 10 155 15.531t 3 W, 43-24 33. 10/2/66 Buffalo Otis Taylor 4 125 31.371t 1 L, 14-29 34. 10/8/66 Denver Otis Taylor 5 103 20.6 55 0 W, 37-10 35. 10/30/66 Houston Otis Taylor 5 187 37.477t 1 W, 48-23 36. 11/13/66 Miami Otis Taylor 4 113 28.389t 1 W, 34-16 37. 11/20/66 Boston Otis Taylor 9 133 14.8 26 2 T, 27-27 38. 11/27/66 @ N.Y. Jets Otis Taylor 6 136 22.7 45 0 W, 32-24 39. 11/27/66 @ N.Y. Jets Chris Burford 8 109 13.6 32 1 40. 10/15/67 San Diego Otis Taylor 9 134 14.9 45 0 L, 31-45 41. 9/28/68 Miami Otis Taylor 3 113 37.7 44 1 W, 48-3 42. 11/3/68 Oakland Gloster Richardson 2 121 60.592t 2 L, 21-38 43. 11/17/68 Boston Frank Pitts 5 126 25.290t 1 W, 31-17 44. 11/28/68 Houston Frank Pitts 7 124 17.743t 2 W, 24-10 45. 12/14/68 @ Denver Otis Taylor 3 119 39.767t 1 W, 30-7 46. 9/14/69 @ San Diego Otis Taylor 5 111 22.255t 2 W, 27-9 47. 10/19/69 Miami Otis Taylor 4 131 32.8 79 0 W, 17-10 48. 10/26/69 Cincinnati Mike Garrett 5 101 20.2 41 1 W, 42-22 49. 11/23/69 Oakland Otis Taylor 6 103 17.2 36 1 L, 24-27 50. 9/20/70 @ Minnesota Otis Taylor 5 100 20.059t 1 L, 10-27 51. 11/1/70 Oakland Otis Taylor 4 129 32.3 56 1 T, 17-17 52. 10/18/71 Pittsburgh Otis Taylor 6 190 31.7 82 2 W, 38-16 53. 10/24/71 Washington Otis Taylor 5 105 21.028t 2 W, 27-20 54. 12/12/71 Oakland Otis Taylor 8 113 14.129t 1 W, 16-14 55. 10/15/72 Cincinnati Otis Taylor 10 149 14.9 26 1 L, 16-23 56. 9/23/73 @ New England Otis Taylor 5 115 23.0 46 0 W, 10-7 57. 11/10/74 San Diego Larry Brunson 9 210 23.384t 1 L, 7-14 58. 10/19/75 @ San Diego Walter White 2 105 52.560t 1 W, 12-10 59. 12/21/75 @ Oakland Barry Pearson 6 103 17.2 27 1 L, 20-28 60. 10/3/76 @ Buffalo Larry Brunson 6 106 17.7 24 0 L, 17-50 61. 11/7/76 Pittsburgh Walter White 6 105 17.5 40 0 L, 0-45 62. 10/21/79 N.Y. Giants Tony Reed 8 103 12.9 26 0 L, 17-21 63. 10/19/80 @ Denver Henry Marshall 6 103 17.246t 1 W, 23-17 64. 11/23/80 @ St. Louis Henry Marshall 7 117 16.7 36 0 W, 21-13 65. 12/21/80 @ Baltimore Henry Marshall 9 176 19.675t 2 W, 38-28 66. 12/21/80 @ Baltimore J.T. Smith 7 129 18.437t 1 67. 9/20/81 San Diego J.T. Smith 9 140 15.6 33 0 L, 31-42 68. 10/11/81 Oakland Henry Marshall 6 110 18.3 43 1 W, 27-0 69. 10/11/81 Oakland Joe Delaney 3 104 34.7 61 0 70. 11/21/82 @ New Orleans J.T. Smith 6 101 16.8 51 0 L, 17-27 71. 12/12/82 L.A. Raiders Al Dixon 6 102 17.0 37 0 L, 16-21 72. 12/19/82 @ Denver Carlos Carson 3 110 36.7 51 1 W, 37-16 73. 9/4/83 Seattle Carlos Carson 7 104 14.9 48 1 W, 17-13 74. 9/18/83 @ Washington Carlos Carson 6 109 18.2 34 0 L, 12-27 75. 10/16/83 N.Y. Giants Henry Marshall 7 131 18.746t 2 W, 38-17 76. 11/6/83 L.A. Raiders Carlos Carson 5 103 20.6 39 0 L, 20-28 77. 11/20/83 @ Dallas Carlos Carson 7 135 19.348t 2 L, 21-41 78. 11/20/83 @ Dallas Henry Marshall 8 115 14.4 35 0 79. 11/27/83 @ Seattle Carlos Carson 7 149 21.3 35 1 L, 48-51 OT 80. 12/11/83 @ San Diego Carlos Carson 7 165 23.650t 1 L, 38-41 81. 9/9/84 Cincinnati Anthony Hancock 3 109 36.346t 1 W, 27-22 82. 9/23/84 @ Denver Henry Marshall 8 148 18.5 37 0 L, 0-21 83. 10/14/84 San Diego Carlos Carson 7 165 23.6 29 0 W, 31-13 84. 10/28/84 Tampa Bay Carlos Carson 7 131 18.7 56 0 W, 24-20 85. 11/25/84 @ N.Y. Giants Carlos Carson 5 153 30.6 56 1 L, 27-28 86. 12/2/84 Denver Carlos Carson 7 126 18.0 36 1 W, 16-13 87. 12/9/84 Seattle Henry Marshall 8 166 20.8 36 1 W, 34-7 88. 9/8/85 @ New Orleans Carlos Carson 8 173 21.6 37 2 W, 47-27 89. 9/12/85 L.A. Raiders Carlos Carson 5 118 23.6 26 1 W, 36-20 90. 12/22/85 San Diego Stephone Paige 8 309 38.684t 2 W, 38-34 91. 11/30/86 Buffalo Stephone Paige 9 119 13.2 26 1 L, 14-17 92. 10/25/87 @ San Diego Carlos Carson 9 197 21.963t 2 L, 21-42 93. 11/1/87 @ Chicago Stephone Paige 5 121 24.2 51 1 L, 28-31 94. 11/1/87 @ Chicago Carlos Carson 7 117 16.729t 1 95. 11/15/87 N.Y. Jets Jonathan Hayes 5 105 21.0 33 0 L, 9-16 96. 12/13/87 L.A. Raiders Carlos Carson 4 142 35.567t 1 W, 16-10 97. 12/27/87 Seattle Carlos Carson 4 120 30.081t 1 W, 41-20 98. 12/27/87 Seattle Stephone Paige 8 110 15.746t 1 99. 9/11/88 @ Seattle Paul Palmer 8 105 13.1 27 0 L, 10-31 100. 9/25/88 San Diego Paul Palmer 5 122 24.471t 2 L, 23-24 101. 10/2/88 @ N.Y. Jets Carlos Carson 5 162 32.480t 1 T, 17-17 102. 10/16/88 L.A. Raiders Paul Palmer 5 103 20.648t 1 L, 17-27 103. 11/20/88 Seattle Stephone Paige 5 106 21.2 49 0 W, 27-24 104. 12/4/88 N.Y. Jets Stephone Paige 4 113 28.341t 2 W, 38-34 105. 10/29/89 @ Pittsburgh Stephone Paige 7 163 23.3 50 0 L, 17-23 106. 11/26/89 Houston Stephone Paige 7 114 16.3 42 0 W, 34-0 107. 12/3/89 Miami Stephone Paige 7 133 19.0 38 1 W, 26-21 108. 9/17/90 @ Denver Stephone Paige 10 206 20.683t 2 L, 23-24 109. 12/23/90 @ San Diego Todd McNair 3 111 37.0 65 1 W, 24-21 110. 11/24/91 @ Cleveland Emile Harry 11 159 14.5 36 1 L, 15-20 111. 12/22/91 @ L.A. Raiders J.J. Birden 8 188 23.5 57 2 W, 27-21 112. 10/4/92 @ Denver Willie Davis 5 127 25.450t 1 L, 19-20 113. 10/11/92 Philadelphia Willie Davis 5 167 33.474t 1 W, 24-17 114. 10/18/92 @ Dallas Willie Davis 6 100 16.7 38 0 L, 10-17 115. 11/15/92 Washington Tim Barnett 6 148 24.744t 2 W, 35-16 116. 9/20/93 Denver Willie Davis 6 139 23.2 35 0 W, 15-7 117. 11/14/93 @ L.A. Raiders Willie Davis 5 115 23.066t 1 W, 31-20 118. 9/4/94 @ New Orleans Willie Davis 7 109 15.6 42 1 W, 30-17 119. 12/4/94 Denver Willie Davis 3 107 35.762t 1 L, 17-20 OT 120. 12/4/94 Denver J.J. Birden 7 101 14.4 44 0 121. 12/12/94 @ Miami J.J. Birden 10 131 13.122t 1 L, 28-45 122. 12/18/94 Houston Lake Dawson 5 101 20.2 50 1 W, 31-19 123. 9/3/95 @ Seattle Willie Davis 6 155 25.860t 2 W, 34-10 124. 9/24/95 @ Cleveland Keith Cash 8 111 13.938t 1 L, 17-35 125. 9/8/97 @ Oakland Andre Rison 8 162 20.3 43 1 W, 28-27 126. 11/30/97 San Francisco Andre Rison 5 117 23.4 45 2 W, 44-9 127. 11/22/98 @ San Diego Derrick Alexander 5 173 34.6 41 1 L, 37-38 128. 11/29/98 Arizona Derrick Alexander 6 116 19.330t 2 W, 34-24 129. 9/12/99 @ Chicago Derrick Alexander 6 154 25.786t 1 L, 17-20 130. 9/19/99 Denver Derrick Alexander 6 117 19.5 49 0 W, 26-10 131. 10/31/99 San Diego Derrick Alexander 2 113 56.581t 1 W, 34-0 132. 11/21/99 Seattle Derrick Alexander 8 101 12.6 25 0 L, 19-30 133. 9/17/00 San Diego Sylvester Morris 6 112 18.736t 3 W, 42-10 134. 9/24/00 @ Denver Tony Gonzalez 10 127 12.7 17 1 W, 23-22 135. 10/2/00 Seattle Derrick Alexander 5 153 30.6 73 1 W, 24-17 136. 10/15/00 Oakland Tony Gonzalez 7 100 14.3 22 1 L, 17-20 137. 10/22/00 St. Louis Derrick Alexander 5 117 23.4 31 1 W, 54-34 138. 10/22/00 St. Louis Tony Gonzalez 5 117 23.4 39 1 139. 10/29/00 @ Seattle Tony Gonzalez 8 101 12.6 22 0 W, 24-19 140. 10/29/00 @ Seattle Derrick Alexander 4 137 34.359t 2 141. 11/5/00 @ Oakland Derrick Alexander 9 139 15.448t 2 L, 31-49 142. 11/5/00 @ Oakland Tony Gonzalez 9 134 14.9 29 0 143. 11/5/00 @ Oakland Sylvester Morris 6 102 17.0 47 0 144. 11/19/00 Buffalo Derrick Alexander 7 146 20.9 35 0 L, 17-21 145. 12/4/00 @ New England Tony Gonzalez 11 147 13.4 29 1 L, 24-30 146. 12/4/00 @ New England Derrick Alexander 5 116 23.281t 1 147. 10/7/01 @ Denver Tony Gonzalez 8 129 16.1 35 0 L, 6-20 148. 11/29/01 Philadelphia Priest Holmes 8 100 12.5 37 0 L, 10-23 149. 12/9/01 @ Oakland Priest Holmes 5 109 21.867t 1 L, 26-28 150. 12/30/01 @ Jacksonville Eddie Kennison 6 121 20.2 50 0 W, 30-26 151. 9/8/02 @ Cleveland Eddie Kennison 4 120 30.0 64 0 W, 40-39 152. 9/29/02 Miami Tony Gonzalez 7 140 20.042t 3 W, 48-30 153. 11/10/02 @ San Francisco Eddie Kennison 8 134 16.8 23 0 L, 13-17 154. 11/24/02 @ Seattle Priest Holmes 7 110 15.764t 1 L, 32-39
100-Yard Pass Receivers (2007-Present)
Note: The Chiefs have registered 259 regular season games in franchise history with at least one 100-yard receiver. In those games with at least one 100-yard receiver, the Chiefs are 148-106-5 (.581).
Kansas City has 31 regular season games with two or more 100-yard receivers in franchise history. They are 18-13-0 (.581) in those games.
44 @CHIEFS 155. 12/15/02 @ Denver Dante Hall 5 143 28.675t 2 L, 24-31 156. 12/22/02 San Diego Marc Boerigter 5 144 28.899t 2 W, 24-22 157. 10/12/03 @ Green Bay Tony Gonzalez 4 121 30.0 67 1 W, 40-34 OT 158. 10/12/03 @ Green Bay Johnnie Morton 6 109 18.2 38 1 159. 10/26/03 Buffalo Dante Hall 4 107 26.867t 1 W, 38-5 160. 11/9/03 Cleveland Eddie Kennison 7 115 16.4 36 0 W, 41-20 161. 11/23/03 Oakland Priest Holmes 6 100 16.7 36 0 W, 27-24 162. 12/7/03 @ Denver Dante Hall 11 124 11.3 34 0 L, 27-45 163. 12/14/03 Detroit Derrick Blaylock 5 106 21.263t 1 W, 45-17 164. 9/12/04 @ Denver Eddie Kennison 6 101 16.8 57 0 L, 24-34 165. 9/26/04 Houston Tony Gonzalez 8 106 13.3 25 1 L, 21-24 166. 10/17/04 @ Jacksonville Johnnie Morton 7 111 15.9 52 0 L, 16-22 167. 10/31/04 Indianapolis Tony Gonzalez 8 125 15.6 32 2 W, 45-35 168. 11/7/04 @ Tampa Bay Tony Gonzalez 9 123 13.7 29 1 L, 31-34 169. 11/7/04 @ Tampa Bay Eddie Kennison 6 104 17.3 59 0 170. 11/14/04 @ New Orleans Eddie Kennison 7 121 17.3 23 1 L, 20-27 171. 11/22/04 New England Johnnie Morton 5 107 21.4 36 0 L, 19-27 172. 11/28/34 San Diego Tony Gonzalez 8 105 13.1 27 0 L, 31-34 173. 12/5/04 @ Oakland Eddie Kennison 8 149 18.670t 1 W, 34-27 174. 12/19/04 Denver Eddie Kennison 7 101 14.4 42 2 W, 45-17 175. 12/25/04 Oakland Tony Gonzalez 11 124 11.326t 2 W, 31-30 176. 1/2/05 @ San Diego Tony Gonzalez 14 144 10.3 32 0 L, 17-24 177. 1/2/05 @ San Diego Larry Johnson 8 115 14.4 40 1 178. 9/26/05 @ Denver Eddie Kennison 8 112 14.0 26 0 L, 10-30 179. 10/2/05 Philadelphia Eddie Kennison 7 109 15.6 49 1 L, 31-37 180. 10/16/05 Washington Priest Holmes 5 100 20.060t 1 W, 28-21 181. 10/30/05 @ San Diego Eddie Kennison 7 115 16.4 33 1 W, 20-7 182. 12/4/05 Denver Eddie Kennison 4 108 27.0 54 0 W, 31-27 183. 1/1/06 Cincinnati Eddie Kennison 7 151 21.6 55 0 W, 37-3 184. 10/8/06 @ Arizona Larry Johnson 6 106 17.7 78 1 W, 23-20 185. 10/22/06 San Diego Tony Gonzalez 6 138 23.0 57 0 W, 30-27 186. 10/29/06 Seattle Eddie Kennison 6 132 22.0 51 0 W, 35-28 187. 10/29/06 Seattle Tony Gonzalez 6 116 19.3 37 0 188. 12/3/06 @ Cleveland Eddie Kennison 7 117 16.7 39 1 L, 28-31 OT 189. 12/3/06 @ Cleveland Tony Gonzalez 9 105 11.723t 2 190. 12/31/06 Jacksonville Eddie Kennison 6 144 24.0 40 1 W, 35-30
Date Opponent Player Rec.Yds. Avg. LG TD Result 191. 9/30/07 @ San Diego Dwayne Bowe 8 164 20.5 51t 1 W,30-16 192. 10/7/07 Jacksonville Tony Gonzalez 8 100 12.5 22 0 L, 7-17 193. 10/14/07 Cincinnati Tony Gonzalez 9 102 11.3 26t 2 W, 27-20 194. 11/4/07 Green Bay Tony Gonzalez 10 109 10.9 25 1 L, 22-33 195. 11/11/07 Denver Dwayne Bowe 9 105 11.7 23 0 L, 11-27 196. 12/2/07 San Diego Tony Gonzalez 10 140 14.0 31 0 L, 10-24 197. 12/23/07 @ Detroit Tony Gonzalez 10 137 13.7 29 0 L, 20-25 198. 10/26/08 @ N.Y. Jets Dwayne Bowe 6 102 17.0 26 0 L, 24-28 199. 11/9/08 @ San Diego Tony Gonzalez 10 113 11.3 34t 2 L, 19-20 200. 11/23/08 Buffalo Tony Gonzalez 10 113 11.3 35 1 L, 31-54 201. 11/30/08 @ Oakland Tony Gonzalez 8 110 13.8 23 0 W, 20-13 202. 12/21/08 Miami Jamaal Charles 3 102 34.0 75 0 L, 31-38 203. 12/28/08 @ Cincinnati Dwayne Bowe 10 103 10.3 32 0 L, 6-16 204. 10/18/09 @ Washington Dwayne Bowe 6 109 18.2 32 0 W, 14-6 205. 11/22/09 Pittsburgh Chris Chambers 4 119 29.8 61 0 W, 27-24 OT 206. 12/20/09 Cleveland Chris Chambers 5 114 22.8 39 1 L, 34-41 207. 10/17/10 @ Houston Dwayne Bowe 6 108 18.0 42t 2 L, 31-35 208. 11/14/10 @ Denver Dwayne Bowe 13 186 14.3 24 2 L, 29-49 209. 11/21/10 Arizona Dwayne Bowe 6 109 18.2 38t 2 W, 31-13 210. 11/28/10 @ Seattle Dwayne Bowe 13 170 13.1 36t 3 W, 42-24 211. 12/26/10 Tennessee Dwayne Bowe 6 153 25.5 75t 1 W, 34-14 212. 9/18/11 @ Detroit Dwayne Bowe 5 101 20.2 45 0 L, 3-48 213. 10/2/11 Minnesota Dwayne Bowe 5 107 21.4 52t 1 W, 22-17 214. 10/9/11 @ Indianapolis Dwayne Bowe 7 128 18.3 41t 2 W, 28-24 215. 11/6/11 Miami Steve Breaston 7 115 16.4 37 0 L, 3-31 216. 9/16/12 @ Buffalo Dwayne Bowe 8 102 12.8 33t 2 L, 17-35 217. 9/30/12 San Diego Dwayne Bowe 7 108 15.4 29t 1 L, 20-37 218. 9/19/13 @ Philadelphia Donnie Avery 7 141 20.1 51 0 W, 26-16 219. 12/15/13 @ Oakland Jamaal Charles 8 195 24.4 71 4 W, 56-31 220. 12/7/14 @ Arizona Travis Kelce 7 110 15.7 29 0 L,14-17 221. 9/13/15 @ Houston Travis Kelce 6 106 17.7 42t 2 W,31-24 222. 9/28/15 @ Green Bay Jeremy Maclin 8 141 17.6 61 1 L, 28-38 223. 10/4/15 @ Cincinnati Jeremy Maclin 11 148 13.5 44 0 L, 36-21 224. 11/29/15 Buffalo Jeremy Maclin 9 160 17.8 41 1 W, 30-22 225. 1/9/16 @ Houston Travis Kelce 8 128 16.0 48 0 W,30-0 226. 9/11/16 San Diego Spencer Ware 7 129 18.4 45 0 W, 33-27 OT 227. 10/30/16 @ Indianapolis Travis Kelce 7 101 14.4 21 1 W,30-14 228. 11/20/16 Tampa Bay Travis Kelce 7 108 15.4 44 0 L,17-19 229. 11/27/16 @ Denver Travis Kelce 8 101 12.6 21 0 W,30-27 OT 230. 12/4/16 @ Atlanta Travis Kelce 8 140 17.5 35 0 W,29-28 231. 12/8/16 Oakland Travis Kelce 5 101 20.2 34 0 W,21-13 232. 12/25/16 Denver Travis Kelce 11 160 14.5 80t 1 W,33-10 233. 9/7/17 @ New England Tyreek Hill 7 133 19.0 75t 1 W, 42-27 234. 9/17/17 Philadelphia Travis Kelce 8 103 12.9 44 1 W,27-20 235. 10/2/17 Washington Travis Kelce 7 111 15.9 32 1 W,29-20 236. 10/19/17 @ Oakland Tyreek Hill 6 125 20.8 64t 1 L, 30-31 237. 10/30/17 Denver Travis Kelce 7 133 19.0 33 1 W,29-19 238. 11/19/17 @ New York Giants Travis Kelce 8 109 13.6 32 0 L,9-12 OT 239. 12/3/17 @ New York Jets Tyreek Hill 6 185 30.8 79t 2 L, 31-38 240. 12/24/17 Miami Tyreek Hill 6 109 18.2 52 0 W, 29-13 241. 12/31/17 @ Denver Albert Wilson 10 147 14.7 24 0 W, 27-24 242. 9/9/18 @ Los Angeles Chargers Tyreek Hill 7 169 24.1 58t 2 W, 38-28 243. 9/16/18 @ Pittsburgh Travis Kelce 7 109 15.6 31 2 W,42-37 244. 9/16/18 @ Pittsburgh Sammy Watkins 6 100 16.7 40 0 245. 9/23/18 San Francisco Travis Kelce 8 114 14.3 25 0 W,38-27 246. 10/7/18 Jacksonville Travis Kelce 5 100 20.0 40 0 W,30-14 247. 10/14/18 @ New England Tyreek Hill 7 142 20.3 75t 3 L, 40-43 248. 10/14/18 @ New England Kareem Hunt 5 105 21.0 67t 1 249. 10/28/18 Denver Sammy Watkins 8 107 13.4 24 2 W, 30-23 250. 11/11/18 Arizona Tyreek Hill 7 117 16.7 38 2 W, 26-14 251. 11/19/18 @ Los Angeles Rams Tyreek Hill 10 215 21.5 73t 2 L, 51-54 252. 11/19/18 @ Los Angeles Rams Travis Kelce 10 127 12.7 37 1 253. 12/2/18 @ Oakland Travis Kelce 12 168 14.0 28 2 W,40-33 254. 12/9/18 Baltimore Tyreek Hill 8 139 17.4 48 0 W, 27-24 OT 255. 12/30/18 Oakland Tyreek Hill 5 101 20.2 67t 1 W, 35-3 256. 9/8/19 @ Jacksonville Sammy Watkins 9 198 22 68t 3 W, 40-26 257. 9/15/19 @ Oakland Demarcus Robinson 6 172 28.7 44t 2 W, 28-10 258. 9/15/19 @ Oakland Travis Kelce 7 107 15.3 34 1 259. 10/6/19 Indianapolis Byron Pringle 6 103 17.2 28 1 L, 13-19 260. 11/3/19 Minnesota Tyreek Hill 6 140 23.3 41 1 W, 26-23 261. 11/10/19 @ Tennessee Tyreek Hill 11 157 14.3 39 1 L, 32-35 262. 12/15/19 Denver Travis Kelce 11 142 12.9 21 0 W,23-3 263. 10/11/20 Las Vegas Travis Kelce 8 108 13.5 32 1 L,32-40 264. 11/1/20 New York Jets Travis Kelce 8 109 13.6 25 1 W,35-9 265. 11/8/20 Carolina Travis Kelce 10 159 15.9 44 0 W,33-31 266. 11/8/20 Carolina Tyreek Hill 9 113 12.6 28t 2 267. 11/22/20 @ Las Vegas Travis Kelce 8 127 15.9 22t 1 W,35-31 268. 11/22/20 @ Las Vegas Tyreek Hill 11 102 9.3 15 1 269. 11/29/20 @ Tampa Bay Tyreek Hill 13 269 20.7 75t 3 W, 27-24 270. 12/6/20 Denver Travis Kelce 8 136 17.0 28 1 W,22-16 271. 12/13/20 @ Miami Travis Kelce 8 136 17.0 32 1 W,33-27 272. 9/12/21 Cleveland Tyreek Hill 11 197 17.9 75t 1 W, 33-29 273. 9/19/21 @ Baltimore Travis Kelce 7 109 15.6 46t 1 L,35-36 274. 9/26/21 L.A. Chargers Travis Kelce 7 104 14.9 28 0 L,24-30 275. 10/3/21 @ Philadelphia Tyreek Hill 11 186 16.9 44t 3 W, 42-30 276. 11/14/21 @ Las Vegas Travis Kelce 8 119 14.9 30 0 W,41-14 277. 11/14/21 @ Las Vegas Darrel Williams 9 101 11.2 38t 1 278. 12/16/21 @ L.A. Chargers Tyreek Hill 12 148 12.3 40 1 W, 34-28 OT 279. 12/16/21 @ L.A. Chargers Travis Kelce 10 191 19.1 69 2 280. 1/8/22 @ Denver Mecole Hardman 8 103 12.9 44 0 W, 28-24 281. 9/11/22 @ Arizona Travis Kelce 8 121 15.1 35 1 W,44-21 282. 10/16/22 Buffalo JuJu Smith-Schuster 5 113 22.6 42t 1 L, 20-24 283. 10/16/22 Buffalo Travis Kelce 8 108 13.5 25 0 284. 10/23/22 @ San Francisco JuJu Smith-Schuster 7 124 17.7 45t 1 W, 44-23 285. 10/23/22 @ San Francisco Marquez ValdesScantling 3 111 37.0 57 0 286. 11/6/22 Tennessee Travis Kelce 10 106 10.6 23 0 W,20-17 OT 287. 11/20/22 @ Los Angeles Chargers Travis Kelce 6 115 19.2 34 3 W,30-27 288. 12/11/22 @ Denver Jerick McKinnon 7 112 16.0 56t 2 W,34-28 289. 12/18/22 @ Houston Travis Kelce 10 105 10.5 18 0 W,30-24 OT 290. 12/24/22 Seattle Travis Kelce 6 113 18.8 52 0 W,24-10
Career 100-Yard Receiving Games Player 100-Yard Games
1. Travis Kelce (2013-22) 35
26
2. Tony Gonzalez (1997-08)
RUSHING
100-Yard Rushers (209)
45 @CHIEFS 3. Otis Taylor (1965-75) 20 4. Carlos Carson (1980-89) 18 Tyreek Hill (2016-21) 18 6. Eddie Kennison (2001-07) 17 7. Dwayne Bowe (2007-14) 15 8. Chris Burford (1960-67) 12 Derrick Alexander (1998-01) 12 10. Stephone Paige (1983-91) 11 11. Henry Marshall (1976-87) 8 Willie Davis (1991-95) 8 13. Frank Jackson (1961-65) 6 14. Abner Haynes (1960-65) 5 Priest Holmes (2001-07) 5 16. Fred Arbanas (1962-70) 4 17. Johnny Robinson (1960-71) 3 J.T. Smith (1978-84) 3 Paul Palmer (1987-88) 3 J.J. Birden (1990-94) 3 Dante Hall (2000-06) 3 Johnnie Morton (2002-04) 3 Jeremy Maclin (2015-16) 3 Sammy Watkins (2018-20) 3 25. Curtis McClinton (1962-69) 2 Frank Pitts (1965-71) 2 Larry Brunson (1974-77) 2 Walter White (1975-79) 2 Andre Rison (1997-99) 2 Sylvester Morris (2000-03) 2 Larry Johnson (2003-09) 2 Chris Chambers (2009-10) 2 Jammal Charles (2008-16) 2 JuJu Smith-Schuster (2022) 2 35. Gloster Richardson (1967-70) 1 Mike Garrett (1966-70) 1 Barry Pearson (1974-76) 1 Tony Reed (1977-80) 1 Joe Delaney (1981-82) 1 Al Dixon (1979-82) 1 Anthony Hancock (1982-86) 1 Jonathan Hayes (1985-93) 1 Todd McNair (1989-93, 96) 1 Emile Harry (1986-92) 1 Tim Barnett (1991-93) 1 Lake Dawson (1994-97) 1 Keith Cash (1992-96) 1 Marc Boerigter (2002-05) 1 Derrick Blaylock (2001-04) 1 Donnie Avery (2013-14) 1 Steve Breaston (2011-12) 1 Spencer Ware (2015-19) 1 Albert Wilson (2014-17) 1 Kareem Hunt (2017-18) 1 Demarcus Robinson (2016-21) 1 Byron Pringle (2019-21) 1 Darrel Williams (2018-21) 1 Mecole Hardman (2019-22) 1 Marquez Valdes-Scantling (2022) 1 Jerick McKinnon (2021-22) 1 100-Yard Rushing / Receiving Games (5) Date OpponentPlayer Att.YardsTDRec.YardsTD Result 1. 9/27/64 @ Oakland Abner Haynes 12 106 0 5 117 1 W, 21-9 2. 10/21/79 N.Y. Giants Tony Reed 20 106 0 8 103 0 L, 17-21 3. 10/11/81 Oakland Joe Delaney 28 106 0 3 104 0 W, 27-0 4. 12/9/01 @ Oakland Priest Holmes 28 168 1 5 109 1 L, 26-28 5. 11/24/02 @ Seattle Priest Holmes 23 197 2 7 110 1 L, 32-39
Date Opponent Player Att.Yds.Avg. LG TD Result 1. 11/13/60 Denver Abner Haynes 15 114 7.6 58 1 W,34-7 2. 11/24/60 @ N.Y. Titans Abner Haynes 11 157 14.3 67t 2 L,35-41 3. 9/10/61 San Diego Jack Spikes 7 109 15.6 74t 1 L,10-26 4. 10/1/61 Houston Abner Haynes 19 117 6.2 35 1 W,26-21 5. 10/1/61 Houston Jack Spikes 15 146 9.7 73t 3 6. 10/8/61 @ Denver Abner Haynes 26 139 5.3 53 0 W,19-12 7. 11/26/61 Oakland Abner Haynes 14 158 11.3 33 5 W,43-11 8. 12/10/61 Denver Frank Jackson 16 106 6.6 49t 4 W,49-21 9 12/17/61 N.Y. Titans Abner Haynes 19 107 5.6 34 2 W,35-24 10. 9/8/62 Boston Abner Haynes 19 122 6.4 30t 4 W,42-38 11. 9/30/62 Buffalo Abner Haynes 16 164 10.3 71t 2 W,41-21 12. 11/11/62 @ N.Y. Titans Abner Haynes 24 107 4.5 21 2 W,52-31 13. 11/11/62 @ N.Y. Titans Curtis McClinton 19 102 5.4 11 1 14. 11/25/62 Oakland Abner Haynes 18 112 6.2 33t 2 W,35-7 15. 11/25/62 Oakland Curtis McClinton 12 109 9.1 46 0 16. 12/9/62 Denver Curtis McClinton 15 105 7.0 69t 1 W,17-10 17. 11/3/63 @ Oakland Curtis McClinton 15 101 6.7 36 0 L,7-10 18. 9/27/64 @ Oakland Abner Haynes 12 106 8.8 41 0 W,21-9 19. 11/22/64 @ Houston Abner Haynes 25 156 6.2 42 0 W,28-19 20. 11/29/64 @ N.Y. Jets Abner Haynes 11 120 10.9 80t 2 L,14-27 21. 10/24/65 @ Houston Mack Lee Hill 17 130 7.6 30 1 L,36-38 22. 11/28/65 Houston Mack Lee Hill 9 119 13.2 66t 1 W,52-21 23. 9/11/66 @ Buffalo Bert Coan 11 101 9.2 32 1 W,42-20 24. 10/23/66 @ Denver Bert Coan 13 111 8.5 35t 3 W,56-10 25. 10/30/66 Houston Mike Garrett 9 102 11.3 77t 1 W,48-23 26. 12/18/66 @ San Diego Mike Garrett 25 161 6.4 26 1 W,27-17 27. 9/24/67 @ Miami Mike Garrett 20 131 6.5 28 0 W,24-0 28. 10/29/67 Denver Mike Garrett 20 101 5.1 20t 2 W,52-9 29. 11/5/67 N.Y. Jets Mike Garrett 23 192 8.3 28 1 W,42-18 30. 12/17/67 @ Denver Mike Garrett 20 169 8.5 58 0 W,38-24 31. 9/28/68 @ Miami Robert Holmes 13 123 9.5 76t 1 W,48-3 32. 10/20/68 Oakland Mike Garrett 24 109 4.5 16 0 W,24-10 33. 11/10/68 @ Cincinnati Robert Holmes 21 158 7.5 27t 1 W,16-9 34. 10/26/69 Cincinnati Warren McVea 17 141 8.3 80t 1 W,42-22 35. 11/16/69 @ N.Y. Jets Warren McVea 15 102 6.8 22 1 W,34-16 36. 11/1/70 Oakland Ed Podolak 19 108 5.7 39 0 T,17-17 37. 11/22/70 St. Louis Ed Podolak 23 112 4.9 32 0 T,6-6 38. 12/6/70 Denver Ed Podolak 12 139 11.6 65t 1 W,16-0 39. 10/24/71 Washington Ed Podolak 24 110 4.6 21 0 W,27-20 40. 11/5/72 Oakland Ed Podolak 27 115 4.3 30 0 W,27-14 41. 12/10/72 Baltimore Wendell Hayes 19 104 5.5 16 0 W,24-10 42. 11/12/73 Chicago Ed Podolak 28 134 4.8 13 0 W,19-7 43. 12/2/73 Cleveland Willie Ellison 20 108 5.4 19 0 T,20-20 44. 10/27/74 @ San Diego Woody Green 23 146 6.3 43 1 W,24-14 45. 11/18/74 @ Denver Woody Green 18 114 6.3 24 1 W,42-34 46. 12/8/74 Oakland Jeff Kinney 21 124 5.9 21 0 L,6-7 47. 10/12/75 Oakland Woody Green 24 101 4.2 18 1 W,42-10 48. 11/23/75 Detroit Woody Green 19 135 7.1 42 0 W,24-21 OT 49. 11/23/75 Detroit MacArthur Lane 16 108 6.8 39 2 50. 11/28/76 @ San Diego Ed Podolak 25 127 5.1 12 2 W,23-20 51. 12/12/76 Cleveland Ed Podolak 29 137 4.9 22t 4 W,39-14 52. 10/3/77 Oakland Tony Reed 12 119 9.9 59 0 L,28-37 53. 11/13/77 @ Chicago Ed Podolak 29 102 3.5 14t 2 L,27-28 54. 9/3/78 @ Cincinnati Mark Bailey 26 106 4.1 12 0 W,24-23 55. 9/10/78 Houston Tony Reed 16 141 8.8 28 1 L,17-20 56. 9/17/78 @ N.Y. Giants Tony Reed 14 114 8.1 48 0 L,10-26 57. 10/1/78 @ Buffalo MacArthur Lane 17 144 8.5 30 0 L,13-28 58. 11/12/78 @ San Diego Arnold Morgado 29 115 4.0 12 2 L,23-29 OT 59. 11/26/78 San Diego Ted McKnight 11 104 9.5 22 0 W,23-0 60. 12/17/78 @ Seattle Tony Reed 11 121 11.0 62t 1 L,19-23 61. 9/30/79 @ Seattle Ted McKnight 12 147 12.3 84t 2 W,24-6 62. 10/21/79 N.Y. Giants Tony Reed 20 106 5.3 14 0 L,17-21 63. 11/18/79 @ Oakland Mike Williams 28 109 3.9 21 0 W,24-21 64. 10/4/81 @ New England Joe Delaney 18 101 5.6 18t 1 L,17-33 65. 10/11/81 Oakland Joe Delaney 28 106 3.8 12 0 W,27-0 66. 10/18/81 Denver Joe Delaney 21 149 7.1 82t 1 W,24-14 67. 11/1/81 @ San Diego Joe Delaney 23 117 5.1 19 0 L,20-22 68. 11/15/81 Houston Joe Delaney 23 193 6.7 26 1 W,23-10 69. 11/22/81 Seattle James Hadnot 10 106 10.6 24 0 W,40-13 70. 12/20/81 @ Minnesota Billy Jackson 25 102 4.1 18 0 W,10-6 71. 12/8/85 Atlanta Mike Pruitt 16 102 6.4 54 0 W,38-10 72. 9/13/87 San Diego Christian Okoye 21 105 5.0 43t 1 W,20-13 73. 12/27/87 Seattle Herman Heard 12 107 8.9 37t 1 W,41-20 74. 11/13/88 Cincinnati Christian Okoye 16 102 6.4 48 1 W,31-28 75. 9/24/89 @ San Diego Christian Okoye 16 112 7.0 59 0 L,6-21 76. 10/1/89 Cincinnati Christian Okoye 25 101 4.0 16 1 L,17-21 77. 10/8/89 @ Seattle Christian Okoye 30 156 5.2 14 1 W,20-16 78. 10/22/89 Dallas Christian Okoye 33 170 5.2 23 2 W,36-28 79. 10/29/89 @ Pittsburgh Christian Okoye 23 101 4.4 19 0 L,17-23 80. 11/5/89 Seattle Christian Okoye 37 126 3.4 16 1 W,20-10 81. 12/3/89 Miami Christian Okoye 32 148 4.6 13 1 W,26-21 82. 12/10/89 @ Green Bay Christian Okoye 38 131 3.5 12 1 W,21-3 83. 9/23/90 @ Green Bay Christian Okoye 23 122 5.3 32 1 W,17-3 84. 10/14/90 Detroit Barry Word 18 200 11.1 53t 2 W,43-24 85. 12/2/90 @ New England Barry Word 19 112 5.9 18 0 W,37-7 86. 12/23/90 @ San Diego Barry Word 28 106 3.8 14 1 W,24-21 87. 9/1/91 Atlanta Christian Okoye 22 143 6.5 48 1 W,14-3 88. 10/7/91 Buffalo Christian Okoye 29 122 4.5 14 2 W,33-6 89. 10/7/91 Buffalo Harvey Williams 20 103 5.2 21 0 90. 10/13/91 Miami Christian Okoye 23 153 6.7 38t 2 W,42-7 91. 12/14/91 @ San Francisco Barry Word 17 115 6.8 37 1 L,14-28
Note: The Chiefs have registered 203 regular season games with one or more 100-yard rushers in franchise history. The team is 145-55-3 (.722) all-time in regular season games with at least one 100-yard rusher.
The team has six regular season games with two or more 100-yard rushers in franchise history. They are 5-1-0 (.833) all-time in those games.
Career 100-Yard Rushing Games
46 @CHIEFS 92. 12/22/91 @ L.A. Raiders Barry Word 35 152 4.3 15 1 W,27-21 93. 9/20/92 @ Houston Barry Word 22 114 5.2 13 0 L,20-23 OT 94. 9/28/92 L.A. Raiders Barry Word 27 125 4.6 16 0 W,27-7 95. 12/24/94 @ L.A. Raiders Marcus Allen 33 132 4.0 14 0 W,19-9 96. 9/3/95 @ Seattle Greg Hill 15 109 7.3 27 0 W,34-10 97. 10/22/95 Denver Marcus Allen 21 121 5.8 17 1 W,21-7 98. 12/3/95 @ Oakland Marcus Allen 21 124 5.9 38 1 W,29-23 99. 12/24/95 Seattle Greg Hill 21 113 5.4 16 0 W,26-3 100. 11/3/96 @ Minnesota Greg Hill 15 100 6.7 28 2 W,21-6 101. 11/28/96 @ Detroit Greg Hill 17 103 6.1 16 0 W,28-24 102. 9/6/98 Oakland Donnell Bennett 24 115 4.8 26 1 W,28-8 103. 12/13/98 Dallas Bam Morris 27 137 5.1 25 1 W,20-17 104. 9/19/99 Denver Kimble Anders 22 142 6.5 46 0 W,26-10 105. 10/22/00 St. Louis Kimble Anders 13 102 7.8 69 2 W,54-34 106. 12/17/00 Denver Tony Richardson 23 156 6.8 33 1 W,20-7 107. 9/30/01 @ Washington Priest Holmes 23 147 6.4 27 2 W,45-13 108. 10/14/01 Pittsburgh Priest Holmes 20 150 7.5 26t 2 L,17-20 109. 11/4/01 @ San Diego Priest Holmes 30 181 6.0 26 1 W,25-20 110. 11/25/01 Seattle Priest Holmes 26 120 4.6 12 0 W,19-7 111. 12/9/01 @ Oakland Priest Holmes 28 168 6.0 20 1 L,26-28 112. 12/16/01 Denver Priest Holmes 29 121 4.2 14 1 W,26-23 OT 113. 1/6/02 @ Seattle Priest Holmes 23 117 5.1 22 0 L,18-21 114. 9/8/02 @ Cleveland Priest Holmes 22 122 5.5 26t 4 W,40-39 115. 9/22/02 @ New England Priest Holmes 30 180 6.0 25 2 L,38-41 OT 116. 10/6/02 @ N.Y. Jets Priest Holmes 23 152 6.6 27 1 W,29-25 117. 10/20/02 Denver Priest Holmes 24 113 4.7 14 3 L,34-37 OT 118. 11/17/02 Buffalo Priest Holmes 31 104 3.4 15 1 W,17-16 119. 11/24/02 @ Seattle Priest Holmes 23 197 8.6 30 2 L,32-39 120. 12/1/02 Arizona Priest Holmes 16 113 7.1 21 2 W,49-0 121. 12/8/02 St. Louis Priest Holmes 24 132 5.5 17 2 W,49-10 122. 12/15/02 @ Denver Priest Holmes 18 161 8.9 56 0 L,24-31 123. 9/14/03 Pittsburgh Priest Holmes 26 122 4.7 31t 3 W,41-20 124. 10/20/03 @ Oakland Priest Holmes 27 123 4.6 20 1 W,17-10 125. 11/30/03 @ San Diego Priest Holmes 31 162 5.2 25 2 W,28-24 126. 9/12/04 @ Denver Priest Holmes 26 151 5.8 33t 3 L,24-34 127. 9/26/04 Houston Priest Holmes 32 134 4.2 18 0 L,21-24 128. 10/4/04 @ Baltimore Priest Holmes 33 125 3.8 16 2 W,27-24 129. 10/24/04 Atlanta Priest Holmes 22 139 6.3 16 4 W,56-10 130. 10/31/04 Indianapolis Priest Holmes 32 143 4.5 21t 3 W,45-35 131. 11/14/04 @ New Orleans Derrick Blaylock 33 186 5.6 24 1 L,20-27 132. 12/5/04 @ Oakland Larry Johnson 20 118 5.9 34 1 W,34-27 133. 12/13/04 @ Tennessee Larry Johnson 7 104 14.9 46t 2 W,49-38 134. 12/19/04 Denver Larry Johnson 30 151 5.0 32t 2 W,45-17 135. 9/11/05 N.Y. Jets Larry Johnson 9 110 12.2 35t 2 W,27-7 136. 11/6/05 Oakland Larry Johnson 22 107 4.9 15t 2 W,27-23 137. 11/13/05 @ Buffalo Larry Johnson 27 132 4.9 24 0 L,3-13 138. 11/20/05 @ Houston Larry Johnson 36 211 5.9 30 2 W,45-17 139. 11/27/05 New England Larry Johnson 31 119 3.8 16 1 W,26-16 140. 12/4/05 Denver Larry Johnson 30 140 4.7 30 2 W,31-27 141. 12/11/05 @ Dallas Larry Johnson 26 143 5.5 26 3 L,28-31 142. 12/17/05 @ N.Y. Giants Larry Johnson 31 167 5.4 28 2 L,17-27 143. 12/24/05 San Diego Larry Johnson 32 131 4.1 21 1 W,20-7 144. 1/1/06 Cincinnati Larry Johnson 26 201 7.7 49t 3 W,37-3 145. 9/17/06 @ Denver Larry Johnson 27 126 4.7 24 0 L,6-9 OT 146. 10/1/06 San Francisco Larry Johnson 30 101 3.4 28 2 W,41-0 147. 10/22/06 San Diego Larry Johnson 28 132 4.7 22 2 W,30-27 148. 10/29/06 Seattle Larry Johnson 39 155 4.0 38 3 W,35-28 149. 11/5/06 @ St. Louis Larry Johnson 27 172 6.4 45 1 W,31-17 150. 11/19/06 Oakland Larry Johnson 31 154 5.0 18 2 W,17-13 151. 11/23/06 Denver Larry Johnson 34 157 4.6 21 1 W,19-10 152. 12/3/06 @ Cleveland Larry Johnson 28 110 3.9 24 0 L,28-31 OT 153. 12/10/06 Baltimore Larry Johnson 23 120 5.2 47 0 L,10-20 154. 12/23/06 @ Oakland Larry Johnson 31 135 4.4 19 1 W,20-9 156. 9/30/07 @ San Diego Larry Johnson 25 123 4.9 37 0 W,30-16 157. 10/14/07 Cincinnati Larry Johnson 31 119 3.8 34 1 W,27-20 158. 10/21/07 @ Oakland Larry Johnson 24 112 4.7 54 1 W,12-10 159. 11/25/07 Oakland Kolby Smith 31 150 4.8 19 2 L,17-20 160. 9/21/08 @ Atlanta Larry Johnson 24 121 5.0 48 1 L,14-38 161. 9/28/08 Denver Larry Johnson 28 198 7.1 65 2 W,33-19 162. 11/2/08 Tampa Bay Jamaal Charles 18 106 5.9 22 0 L,27-30 (OT) 163. 12/21/08 Miami Larry Johnson 12 108 9.0 33 1 L,31-38 164. 11/15/09 @ Oakland Jamaal Charles 18 103 5.7 44 1 W,16-10 165. 12/13/09 Buffalo Jamaal Charles 20 143 7.2 76 1 L,10-16 166. 12/20/09 Cleveland Jamaal Charles 25 154 6.2 47 1 L,34-41 167. 12/27/09 @ Cincinnati Jamaal Charles 24 102 4.3 14 0 L,10-17 168. 1/3/10 @ Denver Jamaal Charles 25 259 10.4 56 2 W,44-24 169. 10/17/10 @ Houston Thomas Jones 19 100 5.3 19 1 L,31-35 170. 10/24/10 Jacksonville Thomas Jones 20 125 6.3 70 1 W,42-20 171. 10/31/10 Buffalo Jamaal Charles 22 177 8.0 32 0 W,13-10 (OT) 172. 11/28/10 @ Seattle Jamaal Charles 22 174 7.9 29 1 W,42-24 173. 12/5/10 Denver Jamaal Charles 21 116 5.5 16 0 W,10-6 174. 12/19/10 @ St. Louis Jamaal Charles 11 126 11.5 80 1 W,27-13 175. 10/9/11 @ Indianapolis Jackie Battle 19 119 6.3 24 0 W,28-24 176. 9/23/12 @ New Orleans Jamaal Charles 33 233 7.1 91t 1 W,27-24 (OT) 177. 10/7/12 Baltimore Jamaal Charles 31 140 4.5 25 0 L,6-9 178. 11/12/12 @ Pittsburgh Jamaal Charles 23 100 4.3 12t 1 L,13-16 179. 11/25/12 Denver Jamaal Charles 23 107 4.7 15 0 L,9-17 180. 12/2/12 Carolina Jamaal Charles 27 127 4.7 16 0 W,27-21 181. 12/9/12 @ Cleveland Jamaal Charles 18 165 9.2 80t 1 L,7-30 182. 12/23/12 Indianapolis Jamaal Charles 22 226 10.3 86t 1 L,13-20 183. 12/23/12 Indianapolis Peyton Hillis 15 101 6.7 16 0 184. 10/6/13 @ Tennessee Jamaal Charles 22 108 4.9 19 1 W,26-17 185. 11/24/13 San Diego Jamaal Charles 14 115 8.2 46 2 L,38-41 186. 12/8/13 @ Washington Jamaal Charles 19 151 7.9 35 2 W,45-10 187. 12/22/13 Indianapolis Jamaal Charles 13 106 8.2 31 1 L,7-23 188. 9/21/14 @ Miami Knile Davis 32 132 4.1 21 1 W,34-15 189. 9/29/14 New England Knile Davis 16 107 6.7 48 0 W,41-14 190. 11/16/14 Seattle Jamaal Charles 20 159 8.0 47 2 W,24-20 191. 9/17/15 Denver Jamaal Charles 21 125 6.0 34 1 L,31-24 192. 10/25/15 Pittsburgh Charcandrick West 22 110 5.0 36 1 W,23-13 193. 11/29/15 Buffalo Spencer Ware 19 114 6.0 35 1 W,30-22 194. 10/16/16 @ Oakland Spencer Ware 24 131 5.5 45 1 W,26-10 195. 9/7/17 @ New England Kareem Hunt 17 148 8.7 58 1 W,42-27 196. 9/24/17 @ Los Angeles Chargers Kareem Hunt 17 172 10.1 69t 1 W,24-10 197. 10/2/17 Washington Kareem Hunt 21 101 4.8 17 0 W,29-20 198. 10/8/17 @ Houston Kareem Hunt 29 107 3.7 23 0 W,42-34 199. 12/10/17 Oakland Kareem Hunt 25 116 4.6 17 1 W,26-15 200. 12/16/17 Los Angeles Chargers Kareem Hunt 24 155 6.5 23 1 W,30-13 201. 10/1/18 @ Denver Kareem Hunt 19 121 6.4 45 1 W,27-23 202. 12/23/18 @ Seattle Damien Williams 13 103 7.9 25 0 L,31-38 203. 11/3/19 Minnesota Damien Williams 12 125 10.4 91t 1 W,26-23 204. 12/29/19 Los Angeles Chargers Damien Williams 12 124 10.3 84t 2 W,31-21 205. 9/10/20 Houston C.Edwards-Helaire 25 138 5.5 27t 1 W,34-20 206. 10/19/20 @ Buffalo C.Edwards-Helaire 26 161 6.2 31 0 W,26-17 207. 9/26/21 Los Angeles Chargers C.Edwards-Helaire 17 100 5.9 14 0 L,24-30 208. 10/3/21 @ Philadelphia C.Edwards-Helaire 14 102 7.3 17 0 W,42-30 209. 11/20/22 @ Los Angeles Chargers Isiah Pacheco 15 107 7.1 28 0 W,30-27
Player 100-Yard Games 1. Larry Johnson (2003-09) 30 2. Priest Holmes (2001-07) 24 3. Jamaal Charles (2008-16) 23 4. Christian Okoye (1987-92) 14 5. Abner Haynes (1960-65) 13 6. Ed Podolak (1967-77) 9 7. Mike Garrett (1966-70) 7 Barry Word (1990-92) 7 Kareem Hunt (2017-18) 7 10. Tony Reed (1977-80) 5 Joe Delaney (1981-82) 5 Curtis McClinton (1962-69) 5 13. Woody Green (1974-76) 4 Greg Hill (1994-97) 4 Clyde Edwards-Helaire (2020-22) 4 16. Marcus Allen (1993-97) 3 Damien Williams (2018-19) 3 18. Jack Spikes (1960-64) 2 Bert Coan (1963-68) 2 Robert Holmes (1968-71) 2 Warren McVea (1969-73) 2 MacArthur Lane (1975-78) 2 Ted McKnight (1977-81) 2 Kimble Anders (1991-00) 2 Thomas Jones (2010-11) 2 Spencer Ware (2015-19) 2 Knile Davis (2013-15) 2
PASSING
47 @CHIEFS 28. Frank Jackson (1961-65) 1 Mack Lee Hill (1964-65) 1 Wendell Hayes (1968-74) 1 Willie Ellison (1973-74) 1 Jeff Kinney (1972-76) 1 Mark Bailey (1977-78) 1 Arnold Morgado (1977-80) 1 Mike Williams (1979-81) 1 James Hadnot (1980-83) 1 Billy Jackson (1981-84) 1 Mike Pruitt (1985-86) 1 Herman Heard (1984-89) 1 Harvey Williams (1991-93) 1 Donnell Bennett (1994-00) 1 Bam Morris (1998-99) 1 Tony Richardson (1995-05) 1 Derrick Blaylock (2001-04) 1 Kolby Smith (2007-09) 1 Jackie Battle (2007-11) 1 Peyton Hillis (2012) 1 Charcandrick West (2014-18) 1 Isiah Pacheco (2022) 1
300-Yard Passers (134) Date Opponent Player Att.Comp. Yds. LG TDINT Result 1. 10/2/60 N.Y. Titans Cotton Davidson 31 19 333 72 1 1 L,35-37 2. 12/18/60 Buffalo Cotton Davidson 37 18 334 74t 2 0 W,24-7 3. 11/3/61 @ Boston Cotton Davidson 34 18 300 48t 2 2 L,21-10 4. 10/12/62 @ Boston Len Dawson 31 16 302 63t 2 2 W,27-7 5. 10/4/64 Houston Len Dawson 36 19 320 59 3 3 W,28-7 6. 11/1/64 Denver Len Dawson 38 23 435 66t 6 3 W,49-39 7. 12/12/65 @ Buffalo Len Dawson 37 23 356 67t 3 1 L,25-34 8. 11/20/66 Boston Len Dawson 38 25 324 26t 2 1 T,27-27 9. 10/15/67 @ San Diego Len Dawson 37 24 364 53 1 3 L,31-45 10. 11/17/68 Boston Len Dawson 31 17 333 90t 3 3 W,31-17 11. 10/19/69 Miami Mike Livingston 34 17 308 93t 1 1 W,17-10 12. 11/10/74 San Diego Len Dawson 44 26 381 84t 1 1 L,7-14 13. 11/30/75 @ Baltimore Len Dawson 36 25 307 51 2 2 L,14-28 14. 10/3/76 @ Buffalo Tony Adams 32 17 319 49t 2 3 L,17-50 15. 10/10/76 @ Washington Mike Livingston 29 15 332 38 2 2 W,33-30 16. 12/21/80 @ Baltimore Bill Kenney 28 17 316 75t 3 0 W,38-28 17. 9/20/81 San Diego Bill Kenney 41 22 303 33 1 5 L,31-42 18. 9/18/83 @ Washington Bill Kenney 46 20 330 52 0 2 L,12-27 19. 10/16/83 N.Y. Giants Bill Kenney 36 25 342 46t 4 1 W,38-17 20. 10/30/83 @ Denver Bill Kenney 52 27 365 35 1 2 L,24-27 21. 11/20/83 @ Dallas Bill Kenney 39 23 337 48t 2 2 L,21-41 22. 11/27/83 @ Seattle Bill Kenney 38 21 311 35 4 0 L,48-51 OT 23. 12/4/83 Buffalo Bill Kenney 43 22 306 40 0 2 L,9-14 24. 12/11/83 @ San Diego Bill Kenney 41 31 411 50t 4 1 L,38-41 25. 10/28/84 Tampa Bay Bill Kenney 46 26 332 56 2 2 W,24-20 26. 12/9/84 Seattle Bill Kenney 37 18 312 36 2 0 W,34-7 27. 9/8/85 @ New Orleans Bill Kenney 34 22 397 50 3 1 W,47-27 28. 10/13/85 @ San Diego Bill Kenney 36 24 304 40 2 2 L,20-31 29. 10/25/87 @ San Diego Bill Kenney 37 22 328 63t 2 1 L,21-42 30. 12/27/87 Seattle Bill Kenney 35 23 320 81t 3 0 W,41-20 31. 10/2/88 @ N.Y. Jets Steve DeBerg 34 17 312 80t 2 2 T,17-17 32. 10/29/89 @ Pittsburgh Steve DeBerg 36 24 338 50 1 2 L,17-23 33. 9/17/90 @ Denver Steve DeBerg 45 26 395 83t 2 0 L,23-24 34. 12/2/90 @ New England Steve DeBerg 21 15 331 86t 2 0 W,37-7 35. 11/24/91 @ Cleveland Steve DeBerg 50 30 319 36 1 2 L,15-20 36. 10/4/92 @ Denver Dave Krieg 31 22 301 50t 1 0 L,19-20 37. 11/15/92 Washington Dave Krieg 29 19 302 44t 2 1 W,35-16 38. 9/4/94 @ New Orleans Joe Montana 33 24 315 42 2 0 W,30-17 39. 9/18/94 @ Atlanta Joe Montana 39 28 361 35 2 2 W,30-10 40. 10/9/94 @ San Diego Joe Montana 55 37 310 25 0 1 L,6-20 41. 10/17/94 @ Denver Joe Montana 54 34 393 26 3 1 W,31-28 42. 12/4/94 Denver Steve Bono 37 18 323 62t 1 1 L,17-20 OT 43. 12/12/94 @ Miami Steve Bono 55 33 314 22t 2 3 L,28-45 44. 10/9/95 San Diego Steve Bono 41 27 329 38 2 0 W,29-23 OT 45. 9/8/97 @ Oakland Elvis Grbac 35 21 312 43t 2 0 W,28-27 46. 11/9/97 @ Jacksonville Rich Gannon 50 29 314 47 0 2 L,10-24 47. 11/22/98 @ San Diego Rich Gannon 33 20 304 41 1 1 L,37-38 48. 11/21/99 Seattle Elvis Grbac 49 30 320 29 0 1 L,19-30 49. 10/29/00 @ Seattle Elvis Grbac 35 22 342 59t 3 3 W,24-19 50. 11/5/00 @ Oakland Elvis Grbac 53 39 504 48t 2 2 L,31-49 51. 11/19/00 Buffalo Elvis Grbac 48 28 341 35 2 1 L,17-21 52. 12/4/00 @ New England Elvis Grbac 46 25 350 81t 3 1 L,24-30 53. 12/10/00 Carolina Elvis Grbac 44 31 315 24 1 2 W,15-14 54. 9/30/01 @ Washington Trent Green 26 21 307 35 3 0 W,45-13 55. 10/21/01 @ Arizona Trent Green 44 21 352 44 1 2 L,16-24 56. 10/25/01 Indianapolis Trent Green 43 22 324 35t 3 3 L,28-35 57. 9/29/02 Miami Trent Green 34 24 328 46 5 0 W,48-30 58. 11/24/02 @ Seattle Trent Green 34 26 343 64t 2 1 L,32-39 59. 12/15/02 @ Denver Trent Green 42 18 310 75t 2 0 L,24-31 60. 12/22/02 San Diego Trent Green 35 23 337 99t 3 1 W,24-22 61. 10/12/03 @ Green Bay Trent Green 45 27 400 67 3 0 W,40-34 OT 62. 11/9/03 Cleveland Trent Green 42 29 368 30 3 0 W,41-20 63. 11/16/03 @ Cincinnati Trent Green 42 28 313 23 2 0 L,19-24 64. 12/7/03 @ Denver Trent Green 47 34 397 42t 1 0 L,27-45 65. 12/14/03 Detroit Trent Green 25 20 341 63t 3 0 W,45-17 66. 10/17/04 @ Jacksonville Trent Green 33 23 315 52 2 1 L,16-22 67. 10/31/04 Indianapolis Trent Green 34 27 389 52 3 0 W,45-35 68. 11/7/04 @ Tampa Bay Trent Green 42 32 369 59 3 2 L,31-34 69. 11/14/04 @ New Orleans Trent Green 33 22 311 29 1 2 L,20-27 70. 11/22/04 New England Trent Green 42 27 381 65t 2 1 L,19-27 71. 12/5/04 @ Oakland Trent Green 35 23 340 70t 3 1 W,34-27 72. 12/25/04 Oakland Trent Green 45 32 358 26t 2 1 W,31-30 73. 1/2/05 @ San Diego Trent Green 53 33 373 40 1 4 L,17-24 74. 10/30/05 @ San Diego Trent Green 43 31 347 36 2 0 L,20-28 75. 11/27/05 New England Trent Green 26 19 323 52t 1 0 W,26-16 76. 12/11/05 @ Dallas Trent Green 32 20 340 47t 1 0 L,28-31 77. 1/1/06 Cincinnati Trent Green 29 23 344 55 1 0 W,37-3 78. 10/29/06 Seattle Damon Huard 25 17 312 51 1 0 W,35-28 79. 12/23/07 @ Detroit Damon Huard 36 24 305 34t 2 0 L,20-25 80. 12/21/08 Miami Tyler Thigpen 41 20 320 75 2 3 L,31-38 81. 12/20/09 Cleveland Matt Cassel 40 22 331 39 2 0 L,34-41 82. 11/14/10 @ Denver Matt Cassel 53 33 469 36 4 0 L,29-49 83. 12/26/10 Tennessee Matt Cassel 34 24 314 75t 3 0 W,34-14 84. 12/24/11 Oakland Kyle Orton 36 21 300 49 1 0 L,13-16 OT 85. 9/16/12 @ Buffalo Matt Cassel 42 23 301 33t 2 1 L,17-35 86. 12/21/14 @ Pittsburgh Alex Smith 45 31 311 33 0 0 L,20-12 87. 10/4/15 @ Cincinnati Alex Smith 45 31 386 44 0 0 L,36-21 88. 9/11/16 San Diego Alex Smith 48 34 363 45 2 0 W,33-27 89. 9/7/17 @ New England Alex Smith 35 28 368 78t 4 0 W,42-27 90. 10/8/17 @ Houston Alex Smith 37 29 324 38 3 0 W,42-34 91. 10/19/17 @ Oakland Alex Smith 36 25 342 64t 3 0 L,30-31 92. 12/3/17 @ New York Jets Alex Smith 33 19 366 79t 4 0 L,31-38 93. 12/24/17 Miami Alex Smith 39 25 304 52 1 0 W,29-13 94. 9/16/18 @ Pittsburgh P.Mahomes 28 23 326 40 6 0 W,42-37 95. 9/23/18 San Francisco P.Mahomes 38 24 314 42 3 0 W,38-27 96. 10/1/18 @ Denver P.Mahomes 45 28 304 35 1 0 W,27-23 97. 10/7/18 Jacksonville P.Mahomes 38 22 313 40 0 2 W,30-14 98. 10/14/18 @ New England P.Mahomes 36 23 352 75t 4 2 L,40-43 99. 10/21/18 Cincinnati P.Mahomes 39 28 358 50 4 1 W,45-10 100. 10/28/18 Denver P.Mahomes 34 24 303 40 4 1 W,30-23 101. 11/4/18 @ Cleveland P.Mahomes 32 23 375 50t 3 1 W,37-21 102. 11/19/18 @ LA Rams P.Mahomes 46 33 478 73t 6 3 L,51-54 103. 12/9/18 Baltimore P.Mahomes 53 35 377 48 2 1 W,27-24 OT 104. 9/8/19 @ Jacksonville P.Mahomes 33 25 378 68t 3 0 W,40-26 105. 9/15/19 @ Oakland P.Mahomes 44 30 443 44t 4 0 W,28-10 106. 9/22/19 Baltimore P.Mahomes 37 27 374 83t 3 0 W,33-28 107. 9/29/19 @ Detroit P.Mahomes 42 24 315 33 0 0 W,34-30 108. 10/6/19 Indianapolis P.Mahomes 39 22 321 31 1 0 L,13-19 109. 11/10/19 @ Tennessee P.Mahomes 50 36 446 63t 3 0 L,32-35 110. 12/15/19 Denver P.Mahomes 34 27 340 41t 2 1 W,23-3 111. 9/20/20 @ LA Chargers P.Mahomes 47 27 302 54t 2 0 W,23-20 OT 112. 9/28/20 @ Baltimore P.Mahomes 42 31 385 49t 4 0 W,34-20 113. 10/11/20 Las Vegas P.Mahomes 43 22 340 37 2 1 L,32-40 114. 11/1/20 New York Jets P.Mahomes 43 31 416 41t 5 0 W,35-9 115. 11/8/20 Carolina P.Mahomes 45 30 372 44 4 0 W,33-31 116. 11/22/20 @ Las Vegas P.Mahomes 45 34 348 22t 2 1 W,35-31 117. 11/29/20 @ Tampa Bay P.Mahomes 49 37 462 75t 3 0 W,27-24 118. 12/6/20 Denver P.Mahomes 40 25 318 30 1 0 W,22-16 119. 12/13/20 @ Miami P.Mahomes 34 24 393 44t 2 3 W,33-27 120. 9/12/21 Cleveland P.Mahomes 36 27 337 75t 3 0 W,33-27 121. 9/19/21 @ Baltimore P.Mahomes 31 24 343 46t 3 1 L,35-36 122. 10/17/21 @ Washington P.Mahomes 47 32 397 49 2 2 W,31-13 123. 11/14/21 @ Las Vegas P.Mahomes 50 35 406 38t 5 0 W,41-14
The Chiefs have recorded 134 games with an individual
The club is 73-59-2 (.552) all-time in regular season games with a 300-yard passer.
Career 300-Yard Passing Games
48 @CHIEFS 124. 12/16/21 @ LA Chargers P.Mahomes 47 31 410 69 3 1 W,34-28 OT 125. 9/11/22 @ Arizona P.Mahomes 39 30 360 35 5 0 W,44-21 126. 10/16/22 Buffalo P.Mahomes 40 25 338 42t 2 2 L,20-24 127. 10/23/22 @ San Francisco P.Mahomes 34 25 423 57 3 1 W,44-23 128. 11/6/22 Tennessee P.Mahomes 68 43 446 33 1 1 W,20-17 OT 129. 11/13/22 Jacksonville P.Mahomes 35 26 331 46 4 1 W,27-17 130. 11/20/22 @ Los Angeles Chargers P.Mahomes 34 20 329 40 3 0 W,30-27 131. 11/27/22 Los Angeles Rams P.Mahomes 42 27 320 39t 1 1 W,26-10 132. 12/11/22 @ Denver P.Mahomes 42 28 352 56t 3 3 W,34-28 133. 12/18/22 @ Houston P.Mahomes 41 36 336 21 2 0 W,30-24 OT 134. 1/1/23 Denver P.Mahomes 42 29 328 38 3 1 W,27-24
300-yard passer.
Note:
Player Games Record 1. Patrick Mahomes (2017-22) 41 34-7 (.829) 2. Trent Green (2001-06) 24 11-13 (.450) 3. Bill Kenney (1979-88) 15 6-9 (.400) 4. Len Dawson (1962-75) 9 4-4-1 (.500) 5. Alex Smith (2013-17) 8 4-4 (.500) 6. Elvis Grbac (1997-00) 7 3-4 (.429) 7. Steve DeBerg (1988-91) 5 1-3-1 (.300) 8. Joe Montana (1993-94) 4 3-1 (.750) Matt Cassel (2009-12) 4 1-3 (.250) 10. Cotton Davidson (1960-61) 3 1-2 (.333) Steve Bono (1994-96) 3 1-2 (.333) 12. Mike Livingston (1968-79) 2 2-0 (1.000) Dave Krieg (1992-93) 2 1-1 (.500) Rich Gannon (1995-98) 2 0-2 (.000) Damon Huard (2004-08) 2 1-1 (.500) 16. Tony Adams (1975-78) 1 0-1 (.000) Tyler Thigpen (2007-09) 1 0-1 (.000) Kyle Orton (2011) 1 0-1 (.000)
RECEIVING 100-Yard Pass Receivers (1960-2006) Date Opponent Player Rec.Yds.Avg.LGTD Result 1. 9/10/60 @ L.A. Chargers Ralph Anderson 5 103 20.646t 1 L, 20-21 2. 10/16/60 @ Houston Bill Groman 10 140 14.0 21 1 L, 10-20 3. 11/6/60 @ Buffalo Elbert Dubenion 8 161 20.1 43 1 W, 45-28 4. 11/24/60 @ N.Y. Titans Don Maynard 10 179 17.945t 1 L, 35-41 5. 10/1/61 Houston Charley Hennigan 3 101 33.763t 1 W, 26-21 6. 10/8/61 @ Denver Lionel Taylor 7 120 17.1 34 1 W, 19-12 7. 10/15/61 @ Buffalo Glenn Bass 4 159 39.876t 1 L, 24-27 8. 10/22/61 @ Houston Bill Groman 4 123 30.880t 2 L, 7-38 9. 10/22/61 @ Houston Charley Hennigan 4 108 27.066t 1 10. 11/19/61 @ San Diego Dave Kocourek 7 169 24.161t 1 L, 14-24 11. 11/19/61 @ San Diego Don Norton 6 120 20.0 42 0 12. 12/3/61 @ N.Y. Titans Dick Christy 6 145 24.2 68 0 L, 7-28 13. 10/21/61 N.Y. Titans Art Powell 7 134 19.1 49 1 W, 20-17 14. 10/21/61 N.Y. Titans Don Maynard 4 102 25.5 62 0 15. 12/2/62 @ Buffalo Ernie Warlick 9 117 13.0 20 1 L, 14-23 16. 12/9/62 Denver Lionel Taylor 7 110 15.7 41 0 W, 17-10 17. 9/22/63 @ Buffalo Elbert Dubenion 5 100 20.0 28 0 T, 27-27 18. 10/20/63 San Diego Lance Alworth 9 232 25.872t 2 L, 17-38 19. 11/17/63 @ Boston Tony Romeo 10 149 14.9 39 1 T, 24-24 20. 11/17/63 @ Boston Jim Coclough 9 137 15.2 38 0 21. 10/18/64 Buffalo Elbert Dubenion 5 122 24.455t 2 L, 22-35 22. 11/1/64 Denver Hewritt Dixon 5 121 24.262t 1 W, 49-39 23. 11/1/64 Denver Al Denson 3 113 37.782t 1 24. 11/15/64 San Diego Lance Alworth 5 169 33.8 59 1 L, 14-28 25. 11/22/64 Houston Charley Hennigan 8 111 13.9 30 2 W, 28-19 26. 11/14/65 San Diego Lance Alworth 6 181 30.2 52 1 W, 31-7 27. 12/12/65 @ Buffalo Bo Roberson 6 127 21.266t 2 L, 25-34 28. 10/16/66 Oakland Hewritt Dixon 5 129 25.876t 2 L, 13-34 29. 11/6/66 San Diego Lance Alworth 6 101 16.846t 2 W, 24-14 30. 11/20/66 Boston Art Graham 11 134 12.238t 2 T, 27-27 31. 10/8/67 Miami Jack Clancy 6 102 17.0 28 0 W, 41-0 32. 10/15/67 San Diego Gary Garrison 4 108 27.0 50 0 L, 31-45 33. 10/29/67 Denver Al Denson 4 107 26.848t 1 W, 52-9 34. 11/5/67 N.Y. Jets Bill Mathis 9 135 15.0 30 1 W, 42-18 35. 11/23/67 Oakland Fred Biletnikoff 6 158 26.3 56 1 L, 22-44 36. 12/17/67 @ Denver Eric Crabtree 6 129 21.5 76 1 W, 38-24 37. 9/9/68 @ Houston Alvin Reed 4 107 26.8 46 0 W, 26-21 38. 9/15/68 N.Y. Jets Don Maynard 8 203 25.457t 2 L, 19-20 39. 9/22/68 Denver Eric Crabtree 7 113 16.1 46 0 W, 34-2 40. 10/5/68 @ Buffalo Haven Moses 5 108 21.6 41 1 W, 18-7 41. 11/3/68 @ Oakland Fred Biletnikoff 6 129 21.5 82 0 L, 21-38 42. 11/28/68 Houston Jim Beirne 4 103 25.866t 1 W, 24-10 43. 12/14/68 @ Denver Mike Haffner 4 122 30.5 52 1 W, 30-7 44. 11/16/69 @ N.Y. jets Don Maynard 9 137 15.2 29 1 W, 34-16 45. 10/25/70 Dallas Bob Hayes 2 100 50.089t 1 L, 16-27 46. 11/8/70 Houston Roy Hopkins 6 101 16.8 43 0 W, 24-9 47. 12/20/70 @ San Diego Gary Garrison 5 149 29.8 67 0 L, 13-31 48. 10/24/71 Washington Charley Taylor 7 125 17.9 49 2 W, 27-20 49. 10/31/71 Oakland Fred Biletnikoff 7 128 18.3 29 1 T, 20-20 50. 11/21/71 Denver Jerry Simmons 6 153 25.5 47 0 W, 28-10 51. 11/5/72 Oakland Fred Biletnikoff 10 114 11.4 21 0 W, 27-14 52. 10/21/73 @ Cincinnati Isaac Curtis 8 106 13.3 21 0 L, 6-14 53. 11/25/73 @ Denver Haven Moses 5 108 21.640t 2 L, 10-14 54. 9/21/75 @ Denver Rick Upchurch 3 151 51.090t 1 L, 33-37 55. 11/2/75 Houston Ken Burrough 7 177 25.377t 2 L, 13-17 56. 12/14/75 @ Cleveland Reggie Rucker 6 130 21.740t 1 L, 14-20 57. 10/10/76 @ Washington Frank Grant 8 138 17.3 37 1 W, 33-30 58. 10/17/76 @ Miami Nat Moore 5 106 21.2 39 0 W, 20-17 OT 59. 10/17/76 @ Miami Howard Twilley 8 104 13.0 20 1 60. 10/3/77 Oakland Dave Casper 7 101 14.4 26 0 L, 28-37 61. 10/1/78 @ Buffalo Bob Chandler 7 116 16.6 44 2 L, 13-28 62. 11/5/78 Oakland Dave Casper 7 112 16.0 34 0 L, 10-20 63. 11/12/78 @ San Diego John Jefferson 7 130 18.646t 2 L, 23-29 OT 64. 12/3/78 Buffalo Frank Lewis 7 126 18.040t 1 W, 14-10 65. 12/10/78 @ Denver Riley Odoms 7 165 23.634t 2 L, 3-24 66. 9/2/79 Baltimore Joe Washington 13 130 10.0 31 0 W, 14-10 67. 10/14/79 Denver Haven Moses 4 107 26.8 56 1 L, 10-24 68. 10/21/79 N.Y. Giants Earnest Gray 4 107 26.853t 1 L, 17-21 69. 10/28/79 @ Denver Riley Odoms 7 114 16.3 26 0 L, 3-20 70. 11/25/79 @ San Diego Charlie Joiner 9 123 13.724t 1 L, 7-28 71. 12/2/79 Seattle Steve Largent 9 120 13.3 28 0 W, 37-21 72. 9/21/80 @ Cleveland Charles White 7 100 14.331t 1 L, 13-20 73. 9/6/81 @ Pittsburgh John Stallworth 6 107 17.8 28 0 W, 37-33 74. 9/27/81 Seattle David Hughes 12 103 8.6 22 0 W, 20-14 75. 10/4/81 @ New England Stanely Morgan 4 118 29.566t 1 L, 17-33 76. 10/18/81 Denver Rick Upchurch 5 138 27.6 63 0 W, 28-14 77. 12/6/81 @ Denver Steve Watson 2 103 51.5 86 0 L, 13-16 78. 12/5/82 @ Pittsburgh John Stallworth 4 107 26.874t 2 L, 14-35 79. 12/12/82 L.A. Raiders Cliff Branch 5 111 22.2 42 0 L, 16-21 80. 12/26/82 San Francisco Dwight Clark 4 104 26.0 51 0 L, 13-26 81. 10/16/83 N.Y. Giants Earnest Gray 8 111 13.9 31 0 W, 38-17 82. 10/30/83 @ Denver Rick Upchurch 6 143 23.8 36 0 L, 24-27 83. 10/30/83 @ Denver Steve Watson 6 121 20.246t 1 84. 11/13/83 Cincinnati Cris Collinsworth 7 118 16.9 32 1 W, 20-15 85. 12/11/83 @ San Diego Kellen Winslow 14 162 11.637t 3 L, 38-41 86. 9/2/84 @ Pittsburgh Louis Lipps 6 183 30.580t 2 W, 37-27 87. 9/2/84 @ Pittsburgh John Stallworth 8 167 20.9 51 1 88. 9/16/84 L.A. Raiders Malcolm Barnwell 8 129 16.1 42 0 L, 20-22 89. 10/28/84 Tampa Bay Kevin House 10 100 10.0 18 1 W, 24-20 90. 11/11/84 Houston Tim Smith 8 107 13.4 25 0 L, 16-17 91. 9/12/85 L.A. Raiders Todd Christensen 11 116 10.5 30 1 W, 36-20 92. 10/13/85 @ San Diego Charlie Joiner 6 118 19.739t 1 L, 20-31 93. 11/10/85 Pittsburgh John Stallworth 7 126 18.0 41 1 L, 28-36 94. 12/1/85 @ Seattle Steve Largent 7 101 14.4 31 1 L, 6-24 95. 12/14/85 @ Denver Vance Johnson 6 116 19.3 48 1 L, 13-14 96. 9/13/87 San Diego Lionel James 6 100 16.7 26 0 W, 20-13 97. 10/18/87 Denver* Bobby Micho 9 105 11.726t 2 L, 17-26 98. 12/13/87 L.A. Raiders James Lofton 5 112 22.4 42 0 W, 16-10 99. 10/2/88 @ N.Y. Jets Mickey Shuler 12 152 12.7 24 0 T, 17-17 100. 12/4/88 N.Y. Jets Al Toon 5 102 20.4 42 1 W, 38-24 101. 10/29/89 @ Pittsburgh Louis Lipps 7 130 18.664t 2 L, 17-23 102. 12/3/89 Miami Mark Clayton 9 128 14.2 47 1 W, 26-21 103. 12/24/89 @ Miami Mark Clayton 6 102 17.0 35 1 W, 27-24 104. 9/17/90 @ Denver Vance Johnson 6 150 25.0 49 0 L, 23-24 105. 10/14/90 Detroit Barry Sanders 5 135 27.047t 1 W, 43-24 106. 12/16/90 Houston Haywood Jeffires 9 245 27.287t 1 L, 10-27 107. 10/13/91 Miami Tony Martin 4 104 26.0 54 0 W, 42-7 108. 10/28/91 L.A. Raiders Mervyn Fernandez 3 107 35.7 59 0 W, 24-21 109. 11/10/91 @ L.A. Rams Henry Ellard 8 160 20.0 27 1 W, 27-20 110. 10/4/92 @ Denver Shannon Sharpe 9 118 13.1 48 0 L, 19-20 111. 9/20/93 Denver Derek Russell 6 104 17.3 36 0 W, 15-7 112. 10/17/93 @ San Diego Anthony Miller 6 105 17.5 43 1 W, 17-14 113. 10/31/93 @ Miami Michael Ingram 4 103 25.877t 1 L, 10-30 114. 9/4/94 @ New Orleans Quinn Early 8 101 12.6 30 0 W, 30-17
OPPONENT SUPERLATIVES
Pass Receivers (2007-Present)
49 @CHIEFS 115. 9/18/94 @ Atlanta Terrance Mathis 13 123 9.5 21 0 W, 30-10 116. 10/30/94 @ Buffalo Andre Reed 5 106 21.2 57 2 L, 10-44 117. 11/27/94 @ Seattle Brian Blades 7 141 20.1 34 0 L, 9-10 118. 9/3/95 @ Seattle Brian Blades 8 107 13.4 23 1 W, 34-10 119. 9/10/95 N.Y. Giants Chris Calloway 5 100 20.0 37 1 W, 20-17 OT 120. 11/23/95 @ Dallas Michael Irvin 11 121 11.033t 1 L, 12-24 121. 12/3/95 @ Oakland Tim Brown 10 150 15.0 30 1 W, 29-23 122. 9/22/96 Denver Shannon Sharpe 9 131 14.6 29 0 W, 17-14 123. 10/7/96 Pittsburgh Charles Johnson 6 125 20.8 45 0 L, 7-17 124. 11/24/96 San Diego Tony Martin 5 148 29.6 55 2 L, 14-28 125. 11/28/96 @ Detroit Brett Perriman 8 131 16.4 44 0 W, 28-24 126. 12/15/96 Indianapolis Marvin Harrison 6 103 17.237t 3 L, 19-24 127. 8/31/97 @ Denver Rod Smith 5 122 24.4 78 0 L, 3-19 128. 9/8/97 @ Oakland Tim Brown 11 155 14.1 26 0 W, 28-27 129. 9/14/97 Buffalo Andre Reed 4 113 28.377t 1 W, 22-16 130. 9/21/97 @ Carolina Rae Carruth 8 110 13.8 36 0 W, 35-14 131. 11/9/97 @ Jacksonville Jimmy Smith 4 112 28.0 75 0 L, 10-24 132. 11/16/97 Denver Rod Smith 7 114 16.3 43 0 W, 24-22 133. 11/1/98 N.Y. Jets Wayne Chrebet 6 101 16.8 56 0 L, 17-20 134. 11/29/98 Arizona Frank Sanders 6 100 16.7 40 0 W, 34-24 135. 12/6/98 @ Denver Rod Smith 8 165 20.6 58 0 L, 31-35 136. 12/6/98 @ Denver Ed McCaffrey 6 103 17.2 48 1 137. 12/26/98 @ Oakland Tim Brown 10 140 14.0 27 1 W, 31-24 138. 10/10/99 New England Tony Simmons 7 107 15.3 39 0 W, 16-14 139. 11/14/99 @ Tampa Bay Jacquez Green 7 164 23.4 54 1 L, 10-17 140. 11/21/99 Seattle Sean Dawkins 5 114 22.845t 1 L, 19-30 141. 12/5/99 @ Denver Rod Smith 8 106 13.3 34 0 W, 16-10 142. 1/2/00 Oakland Tim Brown 6 122 20.3 42 0 L, 38-41 OT 143. 9/3/00 Indianapolis Marvin Harrison 9 115 12.8 31 0 L, 14-27 144. 9/10/00 @ Tennessee Kevin Dyson 6 104 17.330t 1 L, 14-17 OT 145. 9/24/00 @ Denver Rod Smith 8 134 16.8 25 0 W, 23-22 146. 10/22/00 St. Louis Isaac Bruce 8 129 16.1 42 2 W, 54-34 147. 12/4/00 @ New England Troy Brown 12 119 9.9 23 1 L, 24-30 148. 12/10/00 Carolina Mushin Muhammad 8 102 12.8 23 0 W, 15-14 149. 12/17/00 @ Denver Rod Smith 6 101 16.8 34 0 W, 20-17 150. 9/9/01 Oakland Tim Brown 8 133 16.633t 1 L, 24-27 151. 10/7/01 @ Denver Rod Smith 8 110 13.8 32 1 L, 6-20 152. 10/21/01 @ Arizona David Boston 7 131 18.7 49 1 L, 16-24 153. 12/16/01 Denver Rod Smith 8 100 12.5 21 1 W, 26-23 OT 154. 12/30/01 @ Jacksonville Keenan McCardell 7 132 18.9 44 1 W, 30-26 155. 9/8/02 @ Cleveland Quincy Morgan 9 151 16.844t 2 W, 40-39 156. 9/22/02 @ New England Troy Brown 16 176 11.0 38 1 L, 38-41 OT 157. 9/22/02 @ New England David Patten 7 108 15.438t 1 158. 9/29/02 Miami Chris Chambers 6 102 17.0 38 0 W, 48-30 159. 10/6/02 @ N.Y. Jets Laveranues Coles 8 116 14.5 21 0 W, 29-25 160. 10/13/02 @ San Diego Curtis Conway 8 129 16.1 25 0 L, 34-35 161. 10/20/02 Denver Shannon Sharpe 12 214 17.882t 2 L, 34-37 OT 162. 10/27/02 Oakland Tim Brown 13 144 11.1 25 0 W, 20-10 163. 11/24/02 @ Seattle Koren Robinson 8 168 21.0 44 1 L, 32-39 164. 9/14/03 Pittsburgh Hines Ward 9 146 16.2 50 0 W, 41-20 165. 9/14/03 Pittsburgh Plaxico Burress 7 115 16.433t 1 166. 9/21/03 @ Houston Andre Johnson 7 102 14.643t 2 W. 42-14 167. 10/5/03 Denver Rod Smith 8 131 16.4 21 0 W, 24-23 168. 11/16/03 @ Cincinnati Peter Warrick 7 114 19.077t 1 L, 19-24 169. 12/20/03 @ Minnesota Randy Moss 7 111 15.930t 2 L, 20-45 170. 10/31/04 Indianapolis Reggie Wayne 6 119 19.841t 2 W, 45-35 171. 10/31/04 Indianapolis Marvin Harrison 5 119 23.852t 2 172. 11/14/04 @ New Orleans Joe Horn 5 167 33.4 57 1 L, 20-27 173. 11/22/04 New England Deion Branch 6 105 17.526t 1 L, 19-27 174. 12/5/04 @ Oakland Ronald Curry 9 141 15.734t 2 W, 34-27 175. 12/13/04 @ Tennessee Drew Bennett 12 233 19.442t 3 W, 49-38 176. 9/11/05 N.Y. Jets Chris Baker 7 124 17.7 33 1 W, 27-7 177. 9/18/05 @ Oakland Randy Moss 5 127 25.464t 1 W, 23-17 178. 10/2/05 Philadelphia Terrell Owens 11 171 15.5 30 1 L, 31-37 179. 10/16/05 Washington Santana Moss 10 173 17.378t 2 W, 28-21 180. 10/30/05 @ San Diego Antonio Gates 10 145 14.545t 3 L, 20-28 181. 12/11/05 @ Dallas Terry Glenn 6 138 23.071t 1 L, 28-31 182. 11/5/06 @ St. Louis Steven Jackson 13 133 10.2 20 0 W, 31-17 183. 12/10/06 Baltimore Mark Clayton 5 112 22.487t 1 L, 10-20 184. 12/23/06 @ Oakland Ronald Curry 11 106 9.6 24 0 W, 20-9 185. 12/31/06 Jacksonville Matt Jones 5 104 20.8 39 0 W, 35-30 100-Yard
Date Opponent Player Rec. Yds. Avg. LG TD Result 186. 9/9/07 @ Houston Andre Johnson 7 142 20.3 77t 1 L, 3-20 187. 10/14/07 Cincinnati T.J. Houshmandzadeh 8 145 18.1 42t 2 W, 27-20 188. 12/9/07 @ Denver Brandon Marshall 10 115 11.5 22 2 L, 7-41 189. 9/7/08 @ New England Randy Moss 6 116 19.3 51 1 L, 10-17 190. 9/21/08 @ Atlanta Roddy White 5 119 23.8 70t 1 L, 14-38 191. 9/28/08 Denver Eddie Royal 9 104 11.6 28 0 W, 33-19 192. 10/26/08 @ N.Y. Jets Jerricho Cotchery 9 102 11.3 24 0 L, 24-28 193. 11/2/08 Tampa Bay Antonio Bryant 8 115 14.4 24t 1 L, 27-30 OT 194. 11/16/08 New Orleans Lance Moore 8 102 12.8 47t 1 L, 20-30 195. 11/23/08 Buffalo Lee Evans 5 110 22.0 51 0 L, 31-54 196. 9/27/09 @ Philadelphia DeSean Jackson 6 149 24.8 64 1 L, 14-34 197. 9/27/09 @ Philadelphia Brent Celek 8 104 13.0 35 1 198. 10/4/09 N.Y. Giants Steve Smith 11 134 12.2 25 2 L, 16-27 199. 10/11/09 Dallas Miles Austin 10 250 25.0 60 2 L, 20-26 OT 200. 10/25/09 San Diego Vincent Jackson 5 142 28.4 51 1 L, 7-37 201. 11/8/09 @ Jacksonville Mike Sims-Walker 6 147 24.5 61 1 L, 21-24 202. 11/22/09 Pittsburgh Hines Ward 10 128 12.8 33 1 W, 27-24 OT 203. 11/29/09 @ San Diego Antonio Gates 7 118 16.9 22 2 L, 14-43 204. 1/3/10 @ Denver Jabar Gaffney 14 213 15.2 29 0 W, 44-24 205. 9/13/10 San Diego Legedu Naanee 5 110 22.0 59t 1 W, 21-14 206. 9/26/10 San Francisco Fank Gore 9 102 11.3 41 0 W, 31-10 207. 10/17/10 @ Houston Andre Johnson 8 138 17.3 44 1 L, 31-35 208. 11/7/10 @ Oakland Jacoby Ford 6 148 24.7 47 0 L, 20-23 OT 209. 11/28/10 @ Seattle Ben Obomanu 5 159 31.8 87t 1 W, 42-24 210. 10/9/11 @ Indianapolis Pierre Garcon 5 125 25.0 67t 2 W, 28-24 211. 10/31/11 San Diego Malcolm Floyd 5 107 21.4 39 0 W, 23-20 OT 212. 11/6/11 Miami Brandon Marshall 8 106 13.3 30 1 L, 3-31 213. 9/9/12 Atlanta Julio Jones 6 108 18.0 31 2 L, 24-40 214. 10/14/12 @ Tampa Bay Mike Williams 4 113 28.3 62t 1 L, 10-38 215. 12/2/12 Carolina Steve Smith 5 120 24.0 53 1 W, 27-21 216. 12/30/12 @ Denver Demaryius Thomas 7 122 17.4 36 1 L, 3-38 217. 9/15/13 Dallas Dez Bryant 9 141 15.7 53 1 W, 17-16 218. 9/29/13 N.Y. Giants Victor Cruz 10 164 16.4 69 1 W, 31-7 219. 10/27/13 Cleveland Josh Gordon 5 132 26.4 47 1 W, 23-17 220. 11/17/13 @ Denver Demaryius Thomas 5 121 24.2 70 0 L, 17-27 221. 11/24/13 San Diego Keenan Allen 9 124 13.8 29 0 L, 38-41 222. 12/1/13 Denver Demaryius Thomas 3 106 35.3 77 0 L, 28-35 223. 12/1/13 Denver Eric Decker 8 174 21.8 41 4 224. 9/14/14 @ Denver Emmanuel Sanders 8 108 13.5 21 1 L, 17-24 225. 9/29/14 New England Brandon LaFell 6 119 19.8 44 1 W, 41-14 226. 11/9/14 N.Y. Jets Percy Harvin 11 129 11.7 42 0 W, 24-10 227. 9/13/15 @ Houston Nate Washington 6 105 17.5 32 0 W, 27-20 228. 9/17/15 Denver Demaryius Thomas 8 116 14.5 22 0 L, 24-31 229. 9/28/15 @ Green Bay James Jones 7 139 19.9 52 1 L, 28-38 230. 10/18/15 @ Minnesota Stefon Diggs 7 129 18.4 31 0 L, 10-16 231. 10/25/15 Pittsburgh Antonio Brown 6 124 20.7 41 0 W, 23-13 232. 11/29/15 Buffalo Sammy Watkins 6 158 26.3 48 2 W, 30-22 233. 12/20/15 @ Baltimore Kamar Aiken 8 128 16.0 48 1 W, 34-14 234. 1/16/16 @ New England Julian Edelman 10 100 10.0 14 0 L, 20-27 235. 9/18/16 @ Houston Will Fuller 4 104 26.0 53 0 L, 12-19 236. 9/18/16 @ Houston DeAndre Hopkins 7 113 16.1 35 1 237. 10/16/16 @ Oakland Amari Cooper 10 129 12.9 24 0 W, 26-10 238. 10/23/16 New Orleans Michael Thomas 10 130 13.0 23 0 W, 27-21 239. 11/20/16 Tampa Bay Mike Evans 6 105 17.5 31 0 L, 17-19 240. 11/27/16 @ Denver Emmanuel Sanders 7 162 23.1 64 1 W, 30-27 OT 241. 12/4/16 @ Atlanta Julio Jones 7 113 16.1 21 0 W, 29-27 242. 12/18/16 Tennessee Rishard Matthews 4 105 26.3 46 0 L, 17-19 243. 1/15/17 Pittsburgh Antonio Brown 6 108 18.0 52 0 L, 16-18 244. 9/7/17 @ New England Danny Amendola 6 100 16.7 27 0 W, 42-27 245. 9/24/17 @ LA Chargers Travis Benjamin 5 105 21.0 44 0 W, 24-10 246. 10/15/17 Pittsburgh Antonio Brown 8 155 19.4 51 1 L, 13-19 247. 10/19/17 @ Oakland Amari Cooper 11 210 19.1 45 2 L, 30-31 248. 10/19/17 @ Oakland Jared Cook 6 107 17.8 28 0 249. 11/5/17 @ Dallas Terrance Williams 9 141 15.7 56 0 L, 17-28 250. 12/3/17 @ N.Y. Jets Jermaine Kearse 9 157 17.4 51 0 L, 31-38 251. 12/3/17 @ N.Y. Jets Robby Anderson 8 107 13.4 26 0
Note: The Chiefs are 128-131-5 (.494) in 264 games when allowing at least one 100yard receiver. The Chiefs are 8-10-1 (.447) in games when allowing two or more 100-yard receivers. Career
RUSHING
100-Yard Rushers (1960-2006)
50 @CHIEFS 252. 12/24/17 Miami Jakeem Grant 4 107 26.8 65 1 W, 29-13 253. 9/9/18 @ LA Chargers Keenan Allen 8 108 13.5 23 1 W, 38-28 254. 9/9/18 @ LA Chargers Melvin Gordon 9 102 11.3 25 0 255. 9/16/18 @ Pittsburgh Jesse James 5 138 27.6 46 1 W, 42-37 256. 9/16/18 @ Pittsburgh JuJu Smith-Schuster 13 121 9.3 21 1 257. 10/21/18 Cincinnati A.J. Green 7 117 16.7 31 0 W, 45-10 258. 11/19/18 @ LA Rams Brandin Cooks 8 107 13.4 30 0 L, 54-51 259. 12/2/18 @ Oakland Jared Cook 7 100 14.3 29 1 W, 40-33 260. 12/23/18 @ Seattle Doug Baldwin 7 126 18.0 29 1 L, 31-38 261. 9/8/19 @ Jacksonville D.J. Chark 4 146 36.5 69 1 W, 40-26 262. 10/27/19 Green Bay Aaron Jones 7 159 22.7 67 2 L, 24-31 263. 11/18/19 @ LA Chargers Austin Ekeler 8 108 13.5 37 0 W, 24-17 264. 12/1/19 Oakland Darren Waller 7 100 14.3 24 0 W, 40-9 265. 9/10/20 Houston Willer Fuller V 8 112 14.0 31 0 W, 34-20 266. 10/11/20 Las Vegas Henry Ruggs III 2 118 59.0 72t 1 L, 32-40 267. 11/8/20 Carolina Curtis Samuel 9 105 11.7 28 1 W, 33-31 268. 11/29/20 @ Tampa Bay Rob Gronkowski 6 106 17.7 48 0 W, 27-24 269. 12/27/20 Atlanta Calvin Ridley 5 130 26.0 54 0 W, 17-14 270. 1/3/21 LA Chargers Mike Williams 6 108 18.0 48t 1 L, 21-38 271. 9/19/21 @ Baltimore Marquise Brown 6 113 18.8 42t 1 L, 35-36 272. 9/26/21 LA Chargers Mike Williams 7 122 17.4 43 2 L, 24-30 273. 10/3/21 @ Philadelphia DeVonta Smith 7 122 17.4 37 0 W, 42-30 274. 10/10/21 Buffalo Dawson Knox 3 117 39.0 53t 1 L, 20-38 275. 10/24/21 @ Tennessee A.J. Brown 8 133 16.6 46 1 L, 3-27 276. 12/12/21 Las Vegas Hunter Renfrow 13 177 9.0 19 1 W, 48-9 277. 1/2/22 @ Cincinnati Ja'Marr Chase 11 266 24.2 72t 3 L, 31-34 278. 9/15/22 LA Chargers Mike Williams 8 113 14.1 39 1 W, 27-24 279. 10/2/22 @ Tampa Bay Mike Evans 8 103 12.9 30 2 W, 41-31 280. 10/10/22 Las Vegas Davante Adams 3 124 41.3 58t 2 W, 30-29 281. 10/16/22 Buffalo Stefon Diggs 10 148 14.8 31 1 L, 20-24 282. 11/13/22 Jacksonville Christian Kirk 9 105 11.7 24 2 W, 27-17 283. 11/20/22 @ LA Chargers Joshua Palmer 8 106 13.3 50t 2 W, 30-27
Player 100-Yard Games 1. Rod Smith 9 2. Tim Brown 6 3. Fred Biletnikoff 4 Don Maynard 4 John Stallworth 4 Demaryius Thomas 4 7. Lance Alworth 3 Elbert Dubenion 3 Marvin Harrison 3 Antonio Brown 3 Charley Hennigan 3 Andre Johnson 3 Haven Moses 3 Randy Moss 3 Shannon Sharpe 3 Rick Upchurch 3 Mike Williams 3
100-Yard Receiving Games
Date Opponent Player Att.Yds.Avg.LGTD Result 1. 9/10/61 San Diego Paul Lowe 13 108 8.3 87t 1 L, 10-26 2. 11/4/62 Houston Charles Tolar 24 110 4.6 23 0 L, 6-14 3. 10/20/63 San Diego Keith Lincoln 10 127 12.776t 1 L, 17-38 4. 11/3/63 Oakland Clem Daniels 31 122 3.9 25 0 L, 7-10 5. 12/20/64 N.Y. Jets Matt Snell 16 103 6.4 23 1 W, 24-7 6. 11/28/65 Houston Ode Burrell 14 121 8.6 48t 2 W, 52-21 7. 11/20/66 Boston Jim Nance 22 107 4.9 13 0 T, 27-27 8. 9/9/67 @ Houston Hoyle Granger 13 101 7.7 18 1 W, 25-20 9 10/15/67 @ San Diego Dick Post 15 124 8.3 67t 1 L, 31-45 10. 11/19/67 San Diego Dick Post 18 108 6.0 22 1 L, 16-17 11. 11/10/68 @ Cincinnati Paul Robinson 24 115 4.8 36 0 W, 16-9 12. 10/25/70 Dallas Duane Thomas 20 134 6.7 47t 2 L, 16-27 13. 9/17/72 Miami Larry Csonka 21 118 5.6 17 1 L, 10-20 14. 11/12/72 @ Pittsburgh Franco Harris 17 134 7.9 45 1 L, 7-16 15. 9/16/73 L.A. Rams Jim Bertelsen 28 143 5.1 49 0 L, 13-23 16. 9/16/73 L.A. Rams Lawrence McCuthcheon 21 120 5.7 19 0 17. 10/14/73 @ Green Bay John Brockington 15 106 7.1 33 0 T, 10-10 18. 10/21/73 @ Cincinnati Boobie Clark 26 104 4.0 11 1 L, 6-14 19. 11/29/73 @ Buffalo O.J. Simpson 39 157 4.0 22 2 L, 14-23 20. 12/2/73 Cleveland Greg Pruitt 15 110 7.3 65t 1 T, 20-20 21. 12/8/73 @ Oakland Marv Hubbard 25 115 4.6 31t 1 L, 7-37 22. 9/15/74 N.Y. Jets John Riggins 22 116 5.3 29 0 W, 24-16 23. 10/27/74 @ San Diego Don Woods 22 154 7.0 53 1 W, 24-14 24. 9/28/75 N.Y. Jets John Riggins 27 145 5.4 20 2 L, 24-30 25. 9/28/75 N.Y. Jets Carl Garrett 16 135 8.4 40 1 26. 11/16/75 @ Pittsburgh Franco Harris 17 119 7.0 29 0 L, 3-28 27. 11/30/75 @ Baltimore Lydell Mitchell 26 178 6.8 70t 1 L, 14-28 28. 12/7/75 San Diego Rickey Young 25 124 4.9 14 2 L, 20-28 29. 12/14/75 @ Cleveland Greg Pruitt 26 214 8.2 50 3 L, 14-20 30. 9/26/76 New Orleans Tony Galbreath 14 146 10.574t 2 L, 17-27 31. 9/26/76 New Orleans Chuck Muncie 25 126 5.0 33t 0 32. 10/3/76 @ Buffalo O.J. Simpson 24 130 5.4 49 2 L, 17-50 33. 10/3/76 @ Buffalo Jeff Kinney 17 114 6.7 18 1 34. 10/24/76 Denver Otis Armstrong 16 101 6.3 22 1 L, 26-35 35. 11/7/76 Pittsburgh Franco Harris 23 117 5.1 25t 2 L, 0-45 36. 11/7/76 Pittsburgh Rocky Bleier 15 102 6.8 23 0 37. 11/21/76 Cincinnati Archie Griffin 13 139 10.177t 1 L, 24-27 38. 9/18/77 @ New England Sam Cunningham 23 105 4.6 11 0 L, 17-21 39. 10/3/77 Oakland Mark van Eeghen 24 116 4.8 26 0 L, 28-37 40. 10/3/77 Oakland Clarence Davis 15 102 6.8 37t 2 41. 10/30/77 @ Cleveland Greg Pruitt 18 153 8.5 78t 1 L, 7-44 42. 11/13/77 @ Chicago Walter Payton 33 192 5.8 32 3 L, 27-28 43. 11/20/77 Denver Otis Armstrong 21 120 5.7 17 0 L, 7-14 44. 11/27/77 @ Houston Rob Carpenter 14 149 10.6 77 0 L, 20-34 45. 11/27/77 @ Houston Ronnie Coleman 15 101 6.6 22 0 46. 9/10/78 Houston Earl Campbell 22 111 5.0 22 2 L, 17-20 47. 11/5/78 Oakland Arthur Whittington 26 134 5.1 25t 1 L, 10-20 48. 11/12/78 @ San Diego Lydell Mitchell 29 144 5.0 25 0 L, 23-29 OT 49. 12/17/78 @ Seattle Al Hunter 27 133 4.9 55t 2 L, 19-23 50. 9/16/79 @ Houston Earl Campbell 32 131 4.1 22 1 L, 6-20 51. 12/6/79 @ Tampa Bay Ricky Bell 39 137 3.5 14 0 L, 0-3 52. 10/12/80 Houston Earl Campbell 38 178 4.7 22 1 W, 21-20 53. 10/26/80 Detroit Billy Sims 28 155 5.5 45t 2 W, 20-17 54. 11/16/80 @ San Diego Mike Thomas 27 109 4.0 13 2 L, 7-20 55. 11/23/80 @ St. Louis Ottis Anderson 16 107 6.7 44 1 W, 21-13 56. 11/30/80 Cincinnati Pete Johnson 17 112 6.6 57t 1 L, 6-20 57. 11/21/82 @ New Orleans George Rogers 33 123 3.7 18 1 L, 17-27 58. 11/28/82 @ L.A. Rams Wendell Tyler 25 138 5.5 24 2 L, 14-20 59. 9/12/83 San Diego Chuck Muncie 27 110 4.1 16 1 L, 14-17 60. 10/2/83 St. Louis Ottis Anderson 21 106 5.0 39t 1 W, 38-14 61. 11/20/83 @ Dallas Tony Dorsett 18 108 6.0 32t 2 L, 21-41 62. 11/28/83 @ Seattle Curt Warner 32 207 6.5 28t 3 L, 48-51 OT 63. 12/4/83 Buffalo Joe Cribbs 36 185 5.1 24 0 L, 9-14 64. 9/23/84 @ Denver Sammy Winder 31 139 4.4 13 1 L, 0-21 65. 10/7/84 N.Y. Jets Freeman McNeil 19 107 5.6 16 0 L, 16-17 66. 11/11/84 Houston Larry Moriarty 29 117 4.0 9 0 L, 16-17 67. 10/6/85 @ L.A. Raiders Marcus Allen 29 126 4.3 20 0 L, 10-19 68. 11/3/85 @ Houston Butch Woolfolk 14 101 7.2 43 1 L, 20-23 69. 11/17/85 @ San Francisco Wendell Tyler 16 111 6.9 21 0 L, 3-31 70. 12/8/85 Atlanta Gerald Riggs 26 197 7.6 50 1 W, 38-10 71. 10/26/86 Tampa Bay James Wilder 25 110 4.4 24 1 W, 27-20 72. 11/2/86 @ San Diego Gary Anderson 25 100 4.0 13 0 W, 24-23 73. 11/30/86 Buffalo Robb Riddick 27 118 4.4 13 0 L, 14-17 74. 9/20/87 @ Seattle John L. Williams 15 112 7.5 48 1 L, 14-43 75. 11/8/87 Pittsburgh Earnest Jackson 23 125 5.4 28 0 L, 16-17 76. 11/15/87 N.Y. Jets Freeman McNeil 26 184 7.1 30 0 L, 9-16 77. 9/25/88 San Diego Gary Anderson 23 131 5.7 30t 1 L, 23-24 78. 10/2/88 @ N.Y. Jets Freeman McNeil 22 154 7.0 28 0 T, 17-17 79. 10/9/88 @ Houston Mike Rozier 27 141 5.2 13 0 L, 6-7 80. 12/11/88 @ N.Y. Giants Joe Morris 31 140 4.5 16 0 L, 12-28 81. 12/18/88 @ San Diego Gary Anderson 34 217 6.4 36 1 L, 13-24 82. 12/17/89 San Diego Marion Butts 39 176 4.5 17 0 L, 13-20 83. 9/17/90 @ Denver Bobby Humphrey 19 132 6.9 37t 2 L, 23-24 84. 9/29/91 @ San Diego Rod Bernstine 26 112 4.3 15 1 W, 14-13 85. 11/17/91 Denver Gaston Green 24 133 5.5 60t 1 L, 20-24 86. 10/25/92 Pittsburgh Barry Foster 24 105 4.4 12 1 L, 3-27 87. 11/22/92 @ Seattle Chris Warren 20 154 7.7 35 1 W, 24-14 88. 12/26/93 @ Minnesota Scottie Graham 33 166 5.0 31 1 L, 10-30 89. 1/2/94 Seattle John L. Williams 16 102 6.4 38 1 W, 34-24 90. 9/25/94 L.A. Rams Jerome Bettis 35 132 3.8 14 0 L, 0-16 91. 10/9/94 @ San Diego Natrone Means 19 125 6.6 25 0 L, 6-20
100-Yard Rushers (2007-Present)
Note: The Chiefs are 58-138-4 (.300) in games when allowing at least one 100-yard rusher. The Chiefs are 0-8-0 (.000) in games when allowing two or more 100yard rushers.
Career 100-Yard Rushing Games
51 @CHIEFS 92. 10/23/94 Seattle Chris Warren 19 117 6.2 41 0 W, 38-23 93. 12/12/94 @ Miami Bernie Parmalee 19 127 6.7 47t 1 L, 28-45 94. 9/22/96 Denver Terrell Davis 19 141 7.4 65t 2 W, 17-14 95. 10/7/96 Pittsburgh Jerome Bettis 27 103 3.8 15 1 L, 7-17 96. 12/9/96 @ Oakland Napoleon Kaufman 8 109 13.6 45 0 L, 7-26 97. 8/31/97 @ Denver Terrell Davis 26 101 3.9 16 1 L, 3-19 98. 11/3/97 Pittsburgh Jerome Bettis 17 103 6.1 30 0 W, 13-10 99. 11/16/97 Denver Terrell Davis 34 127 3.7 18 0 W, 24-22 100. 9/13/98 @ Jacksonville James Stewart 26 103 4.0 17 1 L, 16-21 101. 9/20/98 San Diego Natrone Means 22 165 7.5 72t 1 W, 23-7 102. 10/11/98 @ New England Robert Edwards 23 104 4.5 33 1 L, 10-40 103. 10/26/98 Pittsburgh Jerome Bettis 33 119 3.6 13 0 L, 13-20 104. 11/8/98 @ Seattle Ricky Watters 24 105 4.4 13 2 L, 12-24 105. 11/16/98 Denver Terrell Davis 18 111 6.2 41t 1 L, 7-30 106. 12/20/98 @ N.Y. Giants Gary Brown 25 103 4.1 13 1 L, 7-28 107. 11/7/99 @ Indianapolis Edgerrin James 20 109 5.5 27 0 L, 17-25 108. 11/21/99 Seattle Ricky Watters 24 107 4.5 45 2 L, 19-30 109. 12/12/99 Minnesota Robert Smith 21 118 5.6 22 0 W, 31-28 110. 9/3/00 Indianapolis Edgerrin James 28 124 4.4 30 1 L, 14-27 111. 11/5/00 @ Oakland Tyrone Wheatley 20 112 5.6 38 1 L, 31-49 112. 11/12/00 @ San Francisco Charlie Garner 25 102 4.1 19 1 L, 7-21 113. 12/24/00 @ Atlanta Jamal Anderson 28 107 3.8 23 0 L, 13-29 114. 10/7/01 @ Denver Mike Anderson 22 155 7.0 62t 0 L, 6-20 115. 10/14/01 Pittsburgh Jerome Bettis 19 112 5.9 30 0 L, 17-20 116. 10/25/01 Indianapolis Edgerrin James 27 102 3.8 20 0 L, 28-35 117. 11/11/01 @ N.Y. Jets Curtis Martin 20 113 5.7 25t 3 L, 7-27 118. 12/23/01 San Diego LaDainian Tomlinson 27 145 5.4 34 0 W, 20-17 119. 12/30/01 @ Jacksonville Stacey Mack 16 125 7.8 54 1 W, 30-26 120. 1/6/02 @ Seattle Shaun Alexander 20 127 6.4 44t 1 L, 18-21 121. 9/15/02 Jacksonville Fred Taylor 20 114 5.7 63t 1 L, 16-23 122. 10/6/02 @ N.Y. Jets Curtis Martin 21 119 5.7 35 1 W, 29-25 123. 11/17/02 Buffalo Travis Henry 24 126 5.3 22 0 W, 17-16 124. 11/24/02 @ Seattle Shaun Alexander 23 145 6.3 46t 2 L, 32-39 125. 12/15/02 @ Denver Clinton Portis 21 130 6.2 51t 3 L, 24-31 126. 12/22/02 San Diego LaDainian Tomlinson 24 131 5.5 34 0 W, 24-22 127. 12/28/02 @ Oakland Charlie Garner 29 135 4.7 14 1 L, 0-24 128. 9/28/03 @ Baltimore Jamal Lewis 26 115 4.4 17 1 W, 17-10 129. 10/5/03 Denver Clinton Portis 23 141 6.1 65t 1 W, 24-23 130. 10/12/03 @ Green Bay Ahman Green 26 139 5.3 26 1 W, 40-34 OT 131. 10/26/03 Buffalo Travis Henry 22 124 5.6 23 0 W, 38-5 132. 11/16/03 @ Cincinnati Rudi Johnson 22 165 7.5 54 0 L, 19-24 133. 11/30/03 @ San Diego LaDainian Tomlinson 19 106 5.6 55 1 W, 28-24 134. 12/7/03 @ Denver Clinton Portis 22 218 9.9 59t 5 L, 27-45 135. 12/14/03 Detroit Shawn Bryson 18 105 5.8 39 1 W, 45-17 136. 12/20/03 @ Minnesota Onterrio Smith 21 146 7.0 47 3 L, 20-45 137. 9/12/04 @ Denver Quentin Griffin 23 156 6.8 47t 2 L, 24-34 138. 9/19/04 Carolina DeShaun Foster 32 174 5.4 71 1 L, 17-28 139. 11/7/04 @ Tampa Bay Michael Pittman 15 128 8.5 78t 3 L, 31-34 140. 11/14/04 @ New Orleans Deuce McAllister 16 127 7.9 28 1 L, 20-27 141. 12/17/05 @ N.Y. Giants Tiki Barber 29 220 7.6 55 2 L, 17-27 142. 10/15/06 @ Pittsburgh Willie Parker 21 109 5.2 25 2 L, 7-45 143. 12/17/06 @ San Diego LaDainian Tomlinson 25 199 8.0 85t 2 L, 9-20
Date Opponent Player Att. Yds. Avg. LG TD Result 144. 12/16/07 @ Chicago Cedric Benson 24 101 4.2 13 0 L, 10-20 145. 9/23/07 Minnesota Adrian Peterson 25 102 4.1 16 1 W, 13-10 146. 9/30/07 @ San Diego LaDainian Tomlinson 20 132 6.6 37 1 W, 30-16 147. 11/11/07 Denver Selvin Young 20 109 5.5 34 1 L, 11-27 148. 11/25/07 Oakland Justin Fargas 22 139 6.3 21 1 L, 17-20 149. 12/2/07 San Diego LaDainian Tomlinson 23 177 7.7 34 2 L, 10-24 150. 12/9/07 @ Denver Selvin Young 17 156 9.2 50 0 L, 7-41 151. 12/23/07 @ Detroit T.J. Duckett 15 102 6.8 53 1 L, 20-25 152. 9/14/08 Oakland Darren McFadden 21 164 7.8 50 1 L, 8-23 153. 9/21/08 @ Atlanta Michael Turner 23 104 4.5 38 3 L, 14-38 154. 10/5/08 @ Carolina DeAngelo Williams 20 123 6.2 32t 2 L, 0-34 155. 10/19/08 Tennessee Chris Johnson 18 168 9.3 66t 1 L, 10-34 156. 10/19/08 Tennessee LenDale White 17 149 8.8 80t 3 157. 12/28/08 @ Cincinnati Cedric Benson 25 111 4.4 14 1 L, 6-16 158. 9/13/09 @ Baltimore Ray Rice 19 108 5.7 22 0 L, 24-38 159. 10/18/09 @ Washington Clinton Portis 15 109 7.3 78 0 W, 14-6 160. 11/15/09 @ Oakland Michael Bush 14 119 8.5 60 0 W, 16-10 161. 12/6/09 Denver Correll Buckhalter 12 113 9.4 26 0 L, 13-44 162. 12/20/09 Cleveland Jerome Harrison 34 286 8.4 71 3 L, 34-41 163. 12/27/09 @ Cincinnati Cedric Benson 29 133 4.6 32 0 L, 10-17 164. 11/14/10 @ Denver Knowshon Moreno 22 106 4.8 14 0 L, 29-49 165. 12/5/10 Denver Knowshon Moreno 23 161 7.0 24 0 W, 10-6 166. 1/2/11 Oakland Michael Bush 25 137 5.5 26t 1 L, 10-31 167. 9/11/11 Buffalo Fred Jackson 20 112 5.6 24 0 L, 7-41 168. 12/11/11 @ N.Y. Jets Shonn Greene 24 129 5.4 31 1 L, 10-37 169. 1/1/12 @ Denver Willis McGahee 28 145 5.2 15 0 W, 10-3 170. 9/16/12 @ Buffalo C.J. Spiller 15 123 8.2 38 2 L, 17-35 171. 10/7/12 Baltimore Ray Rice 17 102 6.0 37 0 L, 6-9 172. 10/28/12 Oakland Darren McFadden 29 114 3.9 28 0 L, 16-26 173. 11/18/12 Cincinnati BenJarvus Green-Ellis 25 101 4.0 21 1 L, 6-28 174. 12/16/12 @ Oakland Darren McFadden 30 110 3.7 19 0 L, 0-15 175. 9/19/13 @ Philadelphia LeSean McCoy 20 158 7.9 41t 1 W, 26-16 176. 11/3/13 Buffalo C.J. Spiller 12 116 9.7 61 0 W, 23-13 177. 12/1/13 Denver Monte Ball 13 117 9.0 45 0 L, 28-35 178. 12/29/13 @ San Diego Ryan Matthews 24 144 6.0 44 0 L, 24-27 179. 9/21/14 @ Miami Lamar Miller 15 108 7.2 24 0 W, 34-15 180. 10/5/14 @ San Francisco Frank Gore 18 107 5.9 14 0 L, 17-22 181. 11/16/14 Seattle Marshawn Lynch 24 124 5.2 17 0 W, 24-20 182. 11/20/14 @ Oakland Latavius Murray 4 112 28.0 90 2 L, 20-24 183. 11/30/14 Denver C.J. Anderson 32 168 5.3 20 0 L, 16-29 184. 12/7/14 @ Arizona Ryan Williams 19 100 5.3 16 0 L, 14-17 185. 10/25/15 Pittsburgh Le'Veon Bell 17 121 7.1 42 0 W, 23-13 186. 12/27/15 Cleveland Johnny Manziel 11 108 9.8 34 0 W, 17-13 187. 10/2/16 @ Pittsburgh Le'Veon Bell 18 144 8.0 44 0 L, 14-43 188. 11/6/16 Jacksonville Chris Ivory 18 107 5.9 42 0 W, 19-14 189. 12/8/16 Oakland Latavius Murray 22 103 4.7 12 1 W, 21-13 190. 1/15/17 Pittsburgh Le'Veon Bell 30 170 5.7 38 0 L, 16-18 191. 10/14/18 New England Sony Michel 24 106 4.4 15 2 L, 40-43 192. 12/23/18 @ Seattle Chris Carson 27 116 4.3 17 2 L, 31-38 193. 12/30/18 Oakland Doug Martin 21 100 4.8 15 0 W, 35-3 194. 9/22/19 Baltimore Mark Ingram 16 103 6.4 21 3 W, 33-28 195. 9/29/19 @ Detroit Kerryon Johnson 26 125 4.8 14 0 W, 34-30 196. 10/6/19 Indianapolis Marlon Mack 29 132 4.6 30 0 L, 13-19 197. 10/13/19 Houston Carlos Hyde 26 116 4.5 26 1 L, 24-31 198. 11/10/19 @ Tennessee Derrick Henry 23 188 8.2 68 2 L, 32-35 199. 12/1/19 Oakland Josh Jacobs 17 104 6.1 35 0 W, 40-9 200. 10/5/20 New England Damien Harris 17 100 5.9 41 0 W, 26-10 201. 12/6/20 Denver Mevlin Gordon III 15 131 8.7 65 0 W, 22-16 202. 9/19/21 @ Baltimore Lamar Jackson 16 107 6.7 21 2 L, 35-36 203. 12/5/21 Denver Javonte Williams 23 102 4.4 14 0 W, 22-9 204. 1/8/22 @ Denver Melvin Gordon III 12 110 9.2 47t 1 W, 28-24 205. 10/10/22 Las Vegas Josh Jacobs 21 154 7.3 37 1 W, 30-29 206. 11/6/22 Tennessee Derrick Henry 17 115 6.8 56 2 W, 20-17 OT 207. 12/4/22 @ Cincinnati Samaje Perine 21 106 5.0 10 0 L, 24-27 208. 12/24/22 Seattle Kenneth Walker 26 107 4.1 20 0 W, 24-10
Player 100-Yard Games 1. LaDainian Tomlinson 6 2. Jerome Bettis 5 3t. Terrell Davis 4 Clinton Portis 4 5t. Gary Anderson 3 Cedric Benson 3 Le'Veon Bell 3 Earl Campbell 3 Franco Harris 3 Edgerrin James 3 Freeman McNeil 3 Greg Pruitt 3 Darren McFadden 3 PASSING 300-Yard Passers (115) Date Opponent Player Att.Comp.Yds.LGTDINT Result 1. 11/24/60 @ N.Y. Titans Al Dorow 33 21 301 45t 2 1 L, 35-41 2. 11/19/61 @ San Diego Jack Kemp 27 15 357 61t 2 1 L, 14-24
ALL-TIME MISCELLANEOUS SCORES
52 @CHIEFS 3. 10/13/63 Buffalo Jack Kemp 24 12 300 89t 2 2 L, 26-35 4. 11/17/63 @ Boston Babe Parilli 47 25 354 39 1 1 T, 24-24 5. 12/6/64 Boston Babe Parilli 41 20 300 58t 3 1 L, 24-31 6. 10/24/65 @ Houston George Blanda 33 19 304 64t 4 0 L, 36-38 7. 10/16/66 Oakland Tom Flores 24 14 301 76t 3 0 L, 13-34 8. 10/15/67 San Diego John Hadl 32 17 307 60t 2 1 L, 31-45 9. 9/9/68 @ Houston Pete Beathard 48 23 413 59t 2 3 W, 26-21 10. 9/15/68 N.Y. Jets Joe Namath 29 17 302 57t 2 1 L, 19-20 11. 11/16/69 @ N.Y. Jets Joe Namath 40 24 327 40t 2 3 W, 34-16 12. 9/21/75 @ Denver Charley Johnson 20 12 329 90t 3 2 L, 33-37 13. 10/17/76 @ Miami Bob Griese 35 25 306 39 1 2 W, 21-17 OT 14. 11/25/79 @ San Diego Dan Fouts 43 27 350 42t 3 1 L, 7-28 15. 9/7/80 Oakland Dan Pastorini 37 19 317 55 2 0 L, 14-27 16. 9/6/81 @ Pittsburgh Terry Bradshaw 36 21 319 41t 2 2 W, 37-33 17. 9/27/81 Seattle Jim Zorn 47 31 308 23 1 0 W, 20-14 18. 10/18/81 Denver Craig Morton 38 25 342 63 2 1 W, 28-14 19. 12/12/82 L.A. Raiders Jim Plunkett 33 18 303 43 3 1 L, 16-21 20. 10/30/83 @ Denver Steve DeBerg 41 21 350 46t 1 0 L, 24-27 21. 9/9/84 @ Cincinnati Ken Anderson 37 24 310 35 0 0 W, 27-22 22. 9/16/84 L.A. Raiders Jim Plunkett 47 28 313 42 1 4 L, 20-22 23. 11/25/84 @ N.Y. Giants Phil Simms 41 24 343 31 2 3 L, 27-28 24. 12/16/84 @ San Diego Ed Luther 44 24 333 43 1 0 W, 42-21 25. 9/12/85 L.A. Raiders Jim Plunkett 48 34 303 30 2 2 W, 36-20 26. 10/13/85 @ San Diego Mark Hermann 36 26 320 39t 2 0 L, 20-31 27. 12/14/85 @ Denver John Elway 37 22 301 48 1 5 L, 13-14 28. 12/21/86 @ Pittsburgh Mark Malone 43 22 351 38 0 1 W, 24-19 29. 12/6/87 @ Cincinnati Boomer Esiason 44 28 368 26 2 0 L, 27-30 OT 30. 12/13/87 L.A. Raiders Marc Wilson 38 22 339 42 0 3 W, 16-10 31. 12/24/89 @ Miami Dan Marino 47 28 339 35 3 1 W, 27-24 32. 11/11/90 Seattle Dave Krieg 23 16 306 54t 2 0 L, 16-17 33. 12/9/90 Denver John Elway 36 24 328 27 2 1 W, 37-7 34. 12/16/90 Houston Warren Moon 45 27 527 87t 3 0 L, 10-27 35. 11/10/91 @ L.A. Rams Jim Everett 37 26 329 27 3 1 W, 27-20 36. 10/4/92 @ Denver John Elway 38 23 311 48 2 0 L, 19-20 37. 9/20/93 Denver John Elway 45 28 300 36 1 1 W, 15-7 38. 10/31/93 @ Miami Scott Mitchell 33 22 344 77t 3 0 L, 10-30 39. 9/4/94 @ New Orleans Jim Everett 37 26 326 30 2 2 W, 30-17 40. 10/1/95 @ Arizona Dave Krieg 41 25 308 35 0 1 W, 24-3 41. 10/9/95 San Diego Stan Humphries 34 24 315 45 1 0 W, 29-23 OT 42. 10/7/96 Pittsburgh Mike Tomczak 32 20 338 45 0 1 L, 7-17 43. 9/21/97 @ Carolina Kerry Collins 47 24 328 36 1 4 W, 35-14 44. 10/6/98 @ Denver John Elway 32 22 400 58 2 1 L, 31-35 45. 10/10/99 New England Drew Bledsoe 45 23 334 49t 2 2 W, 16-14 46. 1/2/00 Oakland Rich Gannon 47 25 324 42 3 2 L, 38-41 OT 47. 9/9/01 Oakland Rich Gannon 46 31 341 33t 2 1 L, 24-27 48. 9/8/02 @ Cleveland Kelly Holcomb 39 27 326 44t 3 0 W, 40-39 49. 915/02 Jacksonville Mark Brunell 36 25 320 79t 2 0 L, 16-23 50. 9/22/02 @ New England Tom Brady 54 39 410 38t 4 1 L, 38-41 OT 51. 9/29/02 Miami Jay Fiedler 45 29 310 38 1 4 W, 48-30 52. 10/13/02 @ San Diego Drew Brees 41 28 319 29 2 2 L, 34-35 53. 10/20/02 Denver Brian Griese 50 30 376 82t 2 0 L, 34-37 OT 54. 10/27/02 Oakland Rich Gannon 55 35 334 25 1 1 W, 20-10 55. 11/24/02 @ Seattle Matt Hasselbeck 36 25 362 44 3 0 L, 32-39 56. 9/14/03 Pittsburgh Tommy Maddox 47 28 336 50 1 3 W, 41-20 57. 10/31/04 Indianapolis Peyton Manning 44 25 472 56t 5 1 W, 45-35 58. 11/22/04 New England Tom Brady 26 17 315 48 1 0 L, 19-27 59. 11/28/04 San Diego Drew Brees 37 28 378 65 2 0 L, 31-34 60. 12/5/04 @ Oakland Kerry Collins 41 27 343 51t 3 0 W, 34-27 61. 12/13/04 @ Tennessee Billy Volek 43 29 426 42t 4 0 W, 49-38 62. 10/2/05 Philadelphia Donovan McNabb 48 33 369 34 3 1 L, 31-37 63. 10/16/05 Washington Mark Brunell 41 25 331 78t 3 0 W, 28-21 64. 10/30/05 @ San Diego Drew Brees 43 25 324 35t 3 1 L, 20-28 65. 12/11/05 @ Dallas Drew Bledsoe 34 22 332 71t 3 0 L, 28-31 66. 11/5/06 @ St. Louis Marc Bulger 42 31 354 33 1 0 W, 31-17 67. 10/14/07 Cincinnati Carson Palmer 43 26 320 42t 2 2 W, 27-20 68. 11/4/07 Green Bay Brett Favre 34 24 360 60t 2 2 L, 22-33 69. 9/28/08 Denver Jay Cutler 49 29 361 40 1 2 W, 33-19 70. 11/2/08 Tampa Bay Jeff Garcia 43 31 339 29 1 1 L, 27-30 OT 71. 11/9/08 @ San Diego Philip Rivers 36 27 316 31 2 2 L, 19-20 72. 12/14/08 San Diego Philip Rivers 48 34 346 42 2 1 L, 21-22 73. 9/13/09 @ Baltimore Joe Flacco 43 26 307 31 3 1 L, 24-38 74. 9/27/09 @ Philadelphia Kevin Kolb 34 24 327 64 2 0 L, 14-34 75. 10/11/09 Dallas Tony Romo 34 20 351 60 2 0 L, 20-26 OT 76. 11/22/09 Pittsburgh Ben Roethlisberger 42 32 398 41 2 2 W, 27-24 OT 77. 11/29/09 @ San Diego Philip Rivers 28 21 317 53 2 0 L, 14-43 78. 1/3/10 @ Denver Kyle Orton 56 32 431 44 1 3 W, 44-24 79. 10/17/10 @ Houston Matt Shaub 33 25 305 44 2 0 L, 31-35 80. 10/31/11 San Diego Philip Rivers 41 26 369 39 0 2 W, 23-20 OT 81. 10/14/12 @ Tampa Bay Josh Freeman 26 15 328 62t 3 1 L, 10-28 82. 12/30/12 @ Denver Peyton Manning 29 23 304 36t 3 0 L, 3-38 83. 11/17/13 @ Denver Peyton Manning 40 24 323 70 1 0 L, 17-27 84. 11/24/13 San Diego Philip Rivers 39 27 392 60 3 0 L, 38-41 85. 12/1/13 Denver Peyton Manning 35 22 403 77 5 2 L, 28-35 86. 9/28/15 @ Green Bay Aaron Rodgers 35 24 333 52 5 0 L, 28-38 87. 10/4/15 @ Cincinnati Andy Dalton 24 17 321 55 1 0 L, 21-36 88. 1/16/16 @ New England Tom Brady 42 28 302 42 2 0 L, 20-27 89. 10/2/16 @ Pittsburgh Ben Roethlisberger 27 22 300 47 5 0 L, 14-43 90. 10/23/16 New Orleans Drew Brees 48 37 367 30 3 1 W, 27-21 91. 11/20/16 Tampa Bay Jameis Winston 39 24 331 21 1 0 L, 17-19 92. 11/27/16 @ Denver Trevor Semian 34 20 368 20 3 0 W, 30-27 OT 93. 9/9/18 @ LA Chargers Philip Rivers 51 31 424 30 3 1 W, 38-28 94. 9/16/18 @ Pittsburgh Ben Roethlisberger 60 39 452 46 3 0 W, 42-37 95. 10/7/18 Jacksonville Blake Bortles 61 33 430 38 1 4 W, 30-14 96. 10/14/18 @ New England Tom Brady 35 24 340 42 1 0 L, 40-43 97. 11/19/18 @ LA Rams Jared Goff 49 31 413 40 4 0 L, 54-51 98. 12/13/18 LA Chargers Philip Rivers 38 26 313 38 2 2 L, 28-29 99. 10/27/19 Green Bay Aaron Rodgers 33 23 305 67 4 0 L, 24-31 100. 11/18/19 @ LA Chargers Philip Rivers 52 28 353 50 1 4 W, 24-17 101. 9/20/20 @ LA Chargers Justin Herbert 33 22 311 35 1 1 W, 23-20 OT 102. 10/11/20 Las Vegas Derek Carr 31 22 347 72t 3 1 L, 32-40 103. 11/8/20 Carolina Teddy Bridgewater 49 36 310 28 2 0 W 33-31 104. 11/29/20 @ Tampa Bay Tom Brady 41 27 345 48 3 2 W, 27-24 105. 12/13/20 @ Miami Tua Tagovailoa 48 28 316 29t 2 1 W, 33-27 106. 12/27/20 Atlanta Matt Ryan 35 27 300 54 2 0 W, 17-14 107. 1/3/21 LA Chargers Justin Herbert 31 22 302 48t 3 0 L, 21-38 108. 9/12/21 Cleveland Baker Mayfield 28 21 321 45 0 1 W, 33-29 109. 10/3/21 @ Philadelphia Jalen Hurts 48 32 387 37 2 0 W, 42-30 110. 10/10/21 Buffalo Josh Allen 26 15 315 61 3 0 L, 20-38 111. 1/22/22 @ Cincinnati Joe Burrow 39 30 446 72t 4 0 L, 31-34 112. 9/15/22 LA Chargers Justin Herbert 48 33 334 39 3 1 W, 27-24 113. 10/2/22 @ Tampa Bay Tom Brady 52 39 385 30 3 0 W, 41-31 114. 10/16/22 Buffalo Josh Allen 40 27 329 34t 3 0 L, 20-24 115. 10/23/22 @ San Francisco Jimmy Garoppolo 37 25 303 34 2 1 W, 44-23 Note: The Chiefs are 50-64-1 (.439) in games when allowing a 300-yard passer. Career 300-Yard Passing Games Player 300-Yard Games 1. Philip Rivers 7 2. Tom Brady 6 3. John Elway 5 4t. Drew Brees 4 Peyton Manning 4 6t. Rich Gannon 3 Jim Plunkett 3 Justin Herberg 3 9t. Drew Bledsoe 2 Mark Brunell 2 Kerry Collins 2 Brett Favre 2 Jack Kemp 2 Joe Namath 2 Babe Parilli 2 Ben Roethlisberger 2 Aaron Rodgers 2 Josh Allen 2
All-Time Defensive Scores Date Opponent Defensive Score Result 10/9/60 Oakland David Webster, 80-yard INT return L, 19-20 11/6/60 @ Buffalo David Webster, 14-yard fumble return W, 45-28 Don Flynn, 25-yard INT return 11/30/60 Denver David Webster, 39-yard INT return W, 34-7 12/11/60 Boston Duane Wood, 66-yard INT return W, 34-0 12/10/61 Denver Sherrill Headrick, 31-yard INT return W, 49-21 12/17/61 New York Titans Sherrill Headrick, 56-yard INT return* W, 35-24 *(20 yards by Doyle Nix who lateralled to Headrick for 56 yards)
53 @CHIEFS 9/7/63 @ Denver Sherrill Headrick, 38-yard INT return W, 59-7 9/22/63 @ Buffalo Safety, Willie West tackled in end zone T, 27-27 12/22/63 New York Jets Jerry Mays, 58-yard fumble return W, 48-0 10/4/64 Houston Bobby Hunt, 29-yard INT return W, 28-7 10/18/64 Buffalo Bobby Bell, 20-yard fumble return L, 22-35 11/15/64 San Diego Abner Haynes, fumble recovery in end zone L, 14-28 10/3/65 Boston Bobby Bell, 38-yard INT return W, 27-17 Willie Mitchell, 37-yard INT return 9/25/66 @ Boston Johnny Robinson, 28-yard INT return W, 43-24 10/16/66 Oakland Bobby Bell, 7-yard fumble return L, 13-34 10/30/66 Houston Willie Mitchell, 60-yard INT return* W, 48-23 *(18 yards by Johnny Robinson who lateralled to Mitchell for 60 yards) 9/9/67 @ Houston Bobby Bell, 32-yard INT return W, 25-20 11/5/67 New York Jets Willie Mitchell, 27-yard INT return W, 42-18 11/12/67 @ Boston Emmitt Thomas, 57-yard INT return W, 23-10 11/23/67 Oakland Safety, Holding in end zone L, 22-44 12/10/67 @ New York Jets Fred Williamson, 77-yard INT return W, 21-7 9/28/68 @ Miami Jim Lynch, 22-yard INT return W, 48-3 12/8/68 @ San Diego Willie Lanier, 75-yard INT return W, 40-3 Safety, Buck Buchanan tackled Jon Brittenum 10/5/69 @ Denver Jim Kearney, 60-yard INT return W, 26-13 10/26/69 Cincinnati Goldie Sellers, 19-yard fumble return W, 42-22 11/27/69 Denver Emmitt Thomas, 45-yard INT return W, 31-17 9/28/70 @ Baltimore Johnny Robinson, 46-yard fumble return W, 44-24 11/8/70 Houston Bobby Bell, 45-yard INT return W, 24-9 10/3/71 @ Denver Aaron Brown, 68-yard INT return W, 16-3 10/18/71 Pittsburgh Emmitt Thomas, 32-yard INT return W, 38-16 12/19/71 Buffalo Bobby Bell, 26-yard INT return W, 22-9 10/1/72 @ Denver Jim Kearney, 43-yard INT return W, 45-24 Jim Kearney, 32-yard INT return 11/12/72 @ Pittsburgh Jim Kearney, 65-yard INT return L, 7-16 12/3/72 Denver Jim Kearney, 29-yard INT return W, 24-21 Bobby Bell, 61-yard INT return 9/30/73 Oakland Willie Lanier, 17-yard INT return W, 16-3 11/18/73 Houston John Lohmeyer, 19-yard fumble return W, 38-14 9/15/74 New York Jets Emmitt Thomas, 38-yard INT return W, 24-16 Marvin Upshaw, 52-yard INT return 9/22/74 @ Oakland Wilbur Young, 52-yard INT return L, 7-27 10/6/74 Denver Bobby Bell, 28-yard INT return L, 14-17 11/18/74 @ Denver Safety, Willie Lanier tackled Otis Armstrong W, 42-34 12/4/74 Minnesota Emmitt Thomas, 73-yard INT return L, 15-35 11/10/75 @ Dallas John Matuszak, fumble recovery in end zone W, 35-31 10/31/76 @ Tampa Bay Safety, John Lohmeyer tackled Steve Spurrier W, 28-19 10/23/77 @ San Diego Tim Gray, 15-yard fumble return W, 21-16 11/27/77 @ Houston Willie Lee, 10-yard fumble return L, 20-34 12/11/77 Seattle Gary Barbaro, 102-yard INT return L, 31-34 12/18/77 @ Oakland Tim Gray, 14-yard fumble return L, 20-21 Tim Collier, 100-yard INT return 9/23/79 Oakland Gary Barbaro, 70-yard INT return W, 35-7 10/5/80 @ Oakland Gary Spani, 16-yard fumble return W, 31-17 Whitney Paul, 32-yard fumble return 10/12/80 Houston Gary Spani, 47-yard INT return W, 21-20 11/9/80 @ Seattle Frank Manumaleuga, 22-yard INT return W, 31-20 12/7/80 Denver Thomas Howard, 3-yard fumble return W, 31-14 9/6/81 @ Pittsburgh Thomas Howard, 65-yard fumble return W, 37-33 10/18/81 Denver Whitney Paul, 47-yard fumble return W, 28-14 10/25/81 @ Oakland Gary Spani, 91-yard fumble return W, 28-17 11/22/81 Seattle Lloyd Burruss, 46-yard INT return W, 40-13 12/19/82 @ Denver Eric Harris, 56-yard INT return W, 37-16 Gary Barbaro, 43-yard INT return 1/2/83 New York Jets Gary Green, 42-yard INT return* W, 37-13 *(5 yards by Thomas Howard who lateralled to Green for 42 yards) 10/2/83 St. Louis Charles Jackson, 37-yard fumble recovery W, 38-14 10/16/83 New York Giants Durwood Roquemore, 42-yard INT return W, 38-17 12/18/83 Denver Lucious Smith, 58-yard INT return W, 48-17 9/16/84 Los Angeles Raiders Kevin Ross, 71-yard INT return L, 20-22 12/9/84 Seattle Scott Radecic, 19-yard INT return W, 34-7 9/12/85 Los Angeles Raiders Albert Lewis, fumble recovery in end zone W, 36-20 11/10/85 Pittsburgh Deron Cherry, 47-yard INT return L, 28-36 9/21/86 Houston Greg Hill, 26-yard INT return W, 27-13 10/19/86 San Diego Lloyd Burruss, 56-yard INT return W, 42-41 Lloyd Burruss, 47-yard INT return 12/7/86 Denver Lloyd Burruss, 72-yard INT return W, 37-10 11/8/87 Pittsburgh Bill Maas, 6-yard fumble return L, 16-17 11/6/88 @ Denver Safety, Dino Hackett tackled Tony Dorsett L, 11-17 10/29/89 @ Pittsburgh Bill Maas, 4-yard fumble return L, 17-23 11/19/89 @ Cleveland Neil Smith, 3-yard fumble return T, 10-10 9/23/90 @ Green Bay Stan Petry, 33-yard INT return W, 17-3 10/14/90 Detroit Safety, Bill Maas tackled Bob Gagliano W, 43-24 11/11/90 Seattle Dan Saleaumua fumble recovery in end zone L, 17-16 10/31/91 Miami Chris Martin, 100-yard fumble return W, 42-7 11/10/91 @ Los Angeles Rams Derrick Thomas, 23-yard fumble return W, 27-20 11/24/91 @ Cleveland Safety, Dan Saleaumua tackled Bernie Kozar L, 15-20 9/6/92 @ San Diego Kevin Ross, 99-yard INT return W, 24-10 9/13/92 Seattle Lonnie Marts, 36-yard INT return W, 26-7 9/28/92 Los Angeles Raiders Charles Mincy, 25-yard INT return W, 27-7 11/22/92 @ Seattle Neil Smith, 22-yard INT return W, 24-14 12/13/92 New England Charles Mincy, 30-yard fumble return W, 27-20 12/27/92 Denver Charles Mincy, 32-yard INT return* W, 42-20 *(0 yards by Bennie Thompson who lateralled to Mincy for 32 yards) Dale Carter, 36-yard INT return Derrick Thomas, fumble recovery in end zone 11/8/93 Green Bay Dan Saleaumua, 16-yard fumble return W, 23-16 12/5/93 @ Seattle Derrick Thomas, 86-yard fumble return W, 31-16 9/11/94 San Francisco Safety, Derrick Thomas tackled Steve Young W, 24-17 12/24/94 @ Los Angeles Raiders Mark Collins, 78-yard INT return W, 19-9 Safety, team (penalty in end zone) 9/17/95 Oakland James Hasty, 64-yard INT return W, 23-17 OT 11/19/95 Houston Mark Collins, 34-yard fumble return W, 20-13 12/3/95 @ Oakland Brian Washington, 74-yard INT return W, 29-23 12/17/95 Denver Vaughn Booker, 14-yard fumble return W, 20-17 9/8/96 Oakland James Hasty, 80-yard fumble return W, 19-3 Safety, Dan Saleaumua tackled Barrett Robbins 9/8/97 @ Oakland Darren Anderson, 55-yard INT return W, 28-27 9/21/97 @ Carolina Mark McMillian, 62-yard INT return W, 35-14 11/30/97 San Francisco Mark McMillian, 12-yard INT return W, 44-9 Safety, Joe Phillips tackled Terry Kirby 12/14/97 @ San Diego Mark McMillian, 87-yard INT return W, 29-7 Safety, Derrick Thomas sacked Todd Philcox 9/6/98 Oakland Safety, Derrick Thomas sacked Jeff George W, 28-8 12/26/98 @ Oakland Derrick Thomas, 44-yard fumble return W, 31-24 9/12/99 @ Chicago Donnie Edwards, 79-yard fumble return L, 17-20 10/21/99 @ Baltimore Reggie Tongue, 46-yard INT return W, 35-8 James Hasty, 56-yard INT return 10/31/99 San Diego Reggie Tongue, 7-yard fumble return W, 34-0 11/28/99 @ Oakland Cris Dishman, 47-yard INT return W, 37-34 Cris Dishman, 40-yard fumble return 12/12/99 Minnesota Eric Hicks, 44-yard fumble return W, 31-28 12/18/99 Pittsburgh Donnie Edwards, 28-yard INT return W, 35-19 1/2/00 Oakland James Hasty, 34-yard INT return L, 38-41 OT 9/10/00 @ Tennessee Donnie Edwards, 42-yard INT return L, 14-17 OT 11/26/00 @ San Diego Marcus Patton, 24-yard INT return L, 16-17 9/9/01 Oakland Eric Warfield, 51-yard INT return L, 24-27 12/8/02 St. Louis Duane Clemons, 42-yard fumble return W, 49-10 9/14/03 Pittsburgh Jerome Woods, 46-yard INT return W, 41-20 9/21/03 @ Houston Shaunard Harts, 39-yard INT return W, 42-14 10/12/03 @ Green Bay Jerome Woods, 79-yard INT return W, 40-34 OT 9/19/04 Carolina Eric Warfield, 43-yard INT return L, 17-28 12/13/04 @ Tennessee Kawika Mitchell, 39-yard fumble return W, 49-38 10/16/05 Washington Sammy Knight, 80-yard fumble return W, 28-21 11/20/05 @ Houston Eric Warfield, 57-yard INT return W, 45-17 9/30/07 @ San Diego Tyron Brackenridge, 50-yard fumble return W, 30-16 10/26/08 @ New York Jets Brandon Flowers, 91-yard INT return L, 24-28 12/7/08 @ Denver Maurice Leggett, 27-yard INT return L, 17-24 10/18/09 @ Washington Safety, Tamba Hali sacked Todd Collins W, 14-6 1/3/10 @ Denver Derrick Johnson, 45-yard INT return W, 44-24 Derrick Johnson, 60-yard INT return 9/19/10 @ Cleveland Brandon Flowers, 33-yard INT return W, 16-14 10/24/10 Jacksonville Derrick Johnson, 15-yard INT return W, 42-20 12/26/10 Tennessee Eric Berry, 54-yard INT return W, 34-14 10/23/11 @ Oakland Kendrick Lewis, 59-yard INT return W, 28-0 Brandon Flowers, 58-yard INT return 9/23/12 @ New Orleans Safety, Justin Houston sacked Drew Brees W, 27-24 OT 9/8/13 @ Jacksonville Tamba Hali, 10-yard INT return W, 28-2 9/19/13 @ Philadelphia Eric Berry, 38-yard INT return W, 26-16 10/13/13 Oakland Husain Abdullah, 44-yard INT return W, 24-7 11/3/13 @ Buffalo Tamba Hali, 11-yard fumble return W, 23-13 Sean Smith, 100-yard INT return
Notes: The Chiefs are 130-31-2 (.804) in games when producing a defensive score (TD or safety).
The Chiefs are 119-28-1 (.807) in games with a def. TD and 16-3-1 (.825) in games with a def. safety.
All-Time Special Teams Scores
54 @CHIEFS 12/15/13 @ Oakland Eric Berry, 47-yard INT return W, 56-31 9/29/14 New England Husain Abdullah, 30-yard INT return W, 41-14 9/17/15 Broncos Marcus Peters, 55-yard INT return L, 31-24 10/11/15 Chicago Ramik Wilson, 0-yard opponent fumble return L, 18-17 11/22/15 @ San Diego Justin Houston, 17-yard INT return W, 33-3 12/6/15 @ Oakland Tyvon Branch, 38-yard INT return W, 34-20 12/20/15 @ Baltimore Tyvon Branch, 73-yard fumble return W, 34-14 Marcus Peters, 90-yard INT return 1/3/16 Oakland D.J. Alexander, safety W, 23-17 9/25/16 New York Jets Derrick Johnson, 55-yard INT return W, 24-3 10/23/16 New Orleans Daniel Sorensen, 48-yard INT return W, 27-21 11/13/16 @ Carolina Eric Berry, 42-yard INT return W, 20-17 11/27/16 @ Denver Safety, R.Okung recovered fumble, gave himself up in endzone W, 30-27 OT 12/4/16 @ Atlanta Eric Berry, 37-yard INT return W, 29-27 10/2/17 Washington Justin Houston, 13-yard fumble return W, 29-20 10/30/17 Denver Marcus Peters, 45-yard fumble return W, 29-19 10/7/18 Jacksonville Chris Jones, 20-yard INT return W, 30-14 10/21/18 Cincinnati Ron Parker, 33-yard INT return W, 45-10 11/19/18 @ LA Rams Allen Bailey, 2-yard fumble return L, 54-51 12/30/18 Oakland Daniel Sorensen, 54-yard INT return W, 35-3 9/29/19 @ Detroit Bashaud Breeland, 100-yard fumble return W, 34-30 10/17/19 @ Denver Reggie Ragland, 5-yard fumble return W, 30-6 12/1/19 Oakland Juan Thornhill, 46-yard INT return W, 40-9 10/5/20 New England Tyrann Mathieu, 25-yard INT return W, 26-10 10/25/20 @ Denver Daniel Sorensen, 50-yard INT return W, 43-16 12/13/20@ Miami Safety, Chris Jones sacked Tua Tagovailoa W, 33-27 9/19/21 @ Baltimore Tyrann Mathieu, 34-yard INT return L, 35-36 12/5/21 Denver Daniel Sorensen, 75-yard INT return W, 22-9 12/12/21 Las Vegas Mike Hughes, 23-yard fumble return W, 48-9 1/8/22 @ Denver Nick Bolton, 86-yard fumble return W, 28-24 9/15/22 LA Chargers Jaylen Watson, 99-yard INT return W, 27-24 10/23/22 @ San Francisco Safety, Frank Clark sacked Jimmy Garoppolo W, 44-23 12/11/22@ Denver Willie Gay, 47-yard
return W, 34-28
INT
Date Opponent Special Teams Score Result 12/11/60 Boston Johnny Robinson, 62-yard punt return W, 34-0 10/15/61 @ Buffalo Abner Haynes, 88-yard kickoff return L, 24-27 9/7/63 @ Denver Dave Grayson, 99-yard kickoff return W, 59-7 12/8/63 Denver Duane Wood, 18-yard blocked punt return W, 52-21 12/19/65 Denver Willie Mitchell, 71-yard punt return W, 45-35 9/11/66 @ Buffalo Mike Garrett, 79-yard punt return W, 42-20 11/20/66 Boston Frank Pitts, 21-yard blocked punt return T, 27-27 12/17/67 @ Denver Noland Smith, 106-yard kickoff return W, 38-24 9/15/68 New York Jets Noland Smith, 80-yard punt return L, 19-20 11/17/68 Boston Goldie Sellers, 76-yard punt return W, 31-17 9/28/69 @ Cincinnati Goldie Sellers, 20-yard return on fumbled kickoff L, 19-24 10/12/69 Houston George Daney, 5-yard return on fumbled punt attempt W, 24-0 11/27/69 Denver Bobby Bell, 53-yard kickoff return W, 31-17 12/17/78 @ Seattle Safety, Ed Beckman forces Herman Weaver out of EZ L, 19-23 9/16/79 @ Houston J.T. Smith, 55-yard punt return L, 6-20 9/23/79 Oakland J.T. Smith, 88-yard punt return W, 35-7 11/23/80 @ St. Louis J.T. Smith, 75-yard punt return W, 21-13 12/21/80 @ Baltimore J.T. Smith, 53-yard punt return W, 38-28 9/19/82 San Diego Dave Klug, blocked punt recovery in end zone W, 19-12 9/7/86 Cincinnati Deron Cherry, blocked punt recovery in end zone W, 24-14 10/19/86 San Diego Kevin Ross, 21-yard return on fumbled kickoff W, 42-41 12/21/86 @ Pittsburgh Deron Cherry, blocked punt recovery in end zone W, 24-19 Boyce Green, 97-yard kickoff return Lloyd Burruss, 78-yard blocked field goal return 9/13/87 San Diego Paul Palmer, 95-yard kickoff return W, 20-13 *10/4/87 @ Los Angeles Raiders Bob Harris, 23-yard blocked punt retun L, 17-35 *10/18/87 Denver Jitter Fields, 85-yard punt return L, 17-26 12/6/87 @ Cincinnati Kevin Ross, 65-yard blocked field goal return L, 27-30 OT 12/27/87 Seattle Paul Palmer, 92-yard kickoff return W, 41-20 11/13/88 Cincinnati Safety, Albert Lewis, blocked punt out of end zone W, 31-28 10/22/89 Dallas Safety, Rob McGovern, blocked punt out of end zone W, 36-28 11/26/89 Houston Jayice Pearson, 1-yard blocked punt return W, 34-0 9/30/90 Cleveland Chris Martin, 19-yard blocked punt return W, 34-0 Kevin Ross, 13-yard blocked punt return 9/6/92 @ San Diego Dale Carter, 46-yard punt return W, 24-10 11/22/92 @ Seattle Dale Carter, 86-yard punt return W, 24-14 12/19/92 @ New York Giants Tracy Rogers, blocked punt recovery in end zone L, 21-35 1/2/94 Seattle Albert Lewis, blocked punt recovery in end zone W, 34-24 12/12/94 @ Miami Jon Vaughn, 91-yard kickoff return L, 28-45 9/3/95 @ Seattle Tamarick Vanover, 99-yard kickoff return W, 34-10 10/9/95 San Diego Tamarick Vanover, 86-yard punt return W, 29-23 OT 12/24/95 Seattle Tamarick Vanover, 89-yard kickoff return W, 26-3 10/27/96 @ Denver Tamarick Vanover 97-yard kickoff return L, 7-34 9/14/97 Buffalo Tamarick Vanover, 94-yard kickoff return W, 22-16 11/23/97 @ Seattle Safety, Team blocked punt out of end zone W, 19-14 12/21/97 New Orleans Tamarick Vanover, 82-yard punt return W, 25-13 12/5/99 @ Denver Tamarick Vanover, 80-yard punt return W, 16-10 1/2/00 Oakland Tamarick Vanover, 84-yard punt return L, 38-41 OT 10/22/00 St. Louis Michael Cloud, 6-yard blocked punt return W, 54-34 10/14/01 Pittsburgh Safety, Mikhael Ricks blocked punt out of end zone L, 17-20 12/1/02 Arizona Dante Hall, 90-yard punt return W, 49-0 12/8/02 St. Louis Dante Hall, 88-yard kickoff return W, 49-10 Dante Hall, 86-yard punt return 9/14/03 Pittsburgh Dante Hall, 100-yard kickoff return W, 41-20 9/21/03 @ Houston Dante Hall, 73-yard punt return W, 42-14 9/28/03 @ Baltimore Dante Hall, 97-yard kickoff return W, 17-10 10/5/03 Denver Dante Hall, 93-yard punt return W, 24-23 11/28/04 San Diego Dante Hall, 96-yard kickoff return L, 31-34 12/19/04 Denver Dante Hall, 97-yard kickoff return W, 45-17 10/2/05 Philadelphia Dante Hall, 96-yard kickoff return L, 31-37 10/1/06 San Francisco Dante Hall, 60-yard punt return W, 41-0 12/31/06 Jacksonville Bernard Pollard, blocked punt recovery in end zone W, 35-30 11/11/07 Denver Safety, Bernard Pollard, blocked punt out of end zone L, 11-27 11/30/08 @ Oakland Maurice Leggett, 67-yard fumble return on fake field goal W, 20-13 9/13/09 @ Baltimore Jon McGraw, blocked punt recovery in end zone L, 24-38 11/22/09 Pittsburgh Jamaal Charles, 97-yard kickoff return W, 27-24 OT 12/20/09 Cleveland Andy Studebaker, fumbled punt snap recovery in end zone L, 34-41 9/13/10 San Diego Dexter McCluster, 84-yard punt return W, 21-14 10/14/12 @ Tampa Bay Edgar Jones, 11-yard fumble return after blocked punt L, 10-38 9/29/13 N.Y. Giants Dexter McCluster, 94-yard punt return W, 21-14 10/6/13 @ Tennessee Marcus Cooper, fumble recovery in end zone after punt W, 45-10 12/1/13 Denver Knile Davis, 108-yard kickoff return L, 28-35 12/8/13 @ Washington Dexter McCluster, 74-yard punt return W, 45-10 Quintin Demps, 95-yard kickoff return 10/26/14 St. Louis Knile Davis, 99-yard kickoff return W, 34-7 12/14/14 Oakland De Anthony Thomas, 81-yard punt return W 31-13 1/9/16 @ Houston Knile Davis, 106-yard kick return W, 30-0 9/25/16 New York Jets Demetrius Harris, 27-yard fumble recovery W, 24-3
*Replacement Game
Notes: The Chiefs are 60-20-1 (.747) in games when producing a special teams score (TD or safety), 57-17-1 (.767) with a special teams touchdown and 3-3-0 (.500) with a special teams safety.
Notes: The Chiefs have produced 20 all-time shutouts, including 16 at home and nine at Arrowhead Stadium. Kansas City has been shutout at home only twice.
55 @CHIEFS 11/27/16 Denver Tyreek Hill, 86-yard kickoff return W, 30-27 OT 12/8/16 Oakland Tyreek Hill, 78-yard punt return W, 21-13 1/1/17 @ San Diego Tyreek Hill, 95-yard punt return W, 37-27 10/8/17 @ Houston Tyreek Hill, 82-yard punt return W, 42-34 9/9/18 @ LA Chargers Tyreek Hill, 91-yard punt return W, 38-28 12/29/19 LA Chargers Mecole Hardman, 104-yard kickoff return W, 31-21 10/25/20 @ Denver Byron Pringle, 102-yard kickoff return W, 43-16 12/13/20 @ Miami Mecole Hardman, 67-yard punt return W, 33-27
All-Time Shutouts Date Opponent Score 9/25/60 Los Angeles Chargers 17-0 12/4/60 Houston 24-0 12/11/60 Boston 34-0 12/22/63 New York Jets 48-0 9/24/67 @ Miami 24-0 10/8/67 Miami 41-0 9/21/69 @ Boston 31-0 10/12/69 Houston 24-0 12/6/70 Denver 16-0 11/4/73 @ San Diego 19-0 11/26/78 San Diego 23-0 9/2/79 Baltimore 14-0 10/11/81 Oakland 27-0 11/26/89 Houston 34-0 9/30/90 Cleveland 34-0 12/7/97 Oakland 30-0 10/31/99 San Diego 34-0 12/1/02 Arizona 49-0 10/1/06 San Francisco 41-0 10/23/11 @ Oakland 28-0 All-Time Opponent Shutouts Date Opponent Score 12/1/63 @ New York Jets 0-17 11/17/76 Pittsburgh 0-45 12/16/79 @ Tampa Bay 0-3 9/23/84 @ Denver 0-21 11/4/84 @ Seattle 0-45 9/22/85 @ Miami 0-31 10/20/85 @ Los Angeles Rams 0-16 *10/11/87 @ Miami 0-42 9/12/93 @ Houston 0-30 9/25/94 Los Angeles Rams 0-16 12/28/02 @ Oakland 0-24 10/5/08 @ Carolina 0-34 12/12/10 @ San Diego 0-31 12/16/12 @ Oakland 0-15
Replacement Game All-Time Two-Point Conversions Date Opponent Two-Point Play Result 11/24/60 @ New York Titans Curley Johnson pass from Hunter Enis L, 35-41 9/24/61 @ Oakland Jack Spikes run W, 42-35 10/1/61 Houston Bo Dickinson pass from Randy Duncan W, 26-21 11/26/61 Oakland Bo Dickinson pass from Randy Duncan W, 43-11 9/22/63 @ Buffalo Chris Burford pass from Len Dawson T, 27-27 12/13/64 @ San Diego Curtis McClinton pass from Len Dawson W, 49-6 10/24/65 @ Houston Jerrel Wilson pass from Len Dawson L, 36-38 Pete Beathard run 12/12/65 @ Buffalo Reg Carolan pass from Len Dawson L, 25-34 9/18/66 @ Oakland Fred Arbanas pass from Len Dawson W, 32-10 11/13/66 Miami Jerrel Wilson pass from Len Dawson W, 34-16 9/9/67 @ Houston Reg Carolan pass from Len Dawson W, 25-20 11/5/67 New York Jets Curtis McClinton pass from Len Dawson W, 42-18 9/11/94 San Francisco J.J. Birden pass from Joe Montana W, 24-17 10/23/94 Seattle Marcus Allen run W, 38-23 12/4/94 Denver Willie Davis pass from Steve Bono L, 17-20 OT 10/26/97 @ St. Louis Tamarick Vanover pass from Elvis Grbac W, 28-20 Tony Gonzalez pass from Elvis Grbac 10/14/01 Pittsburgh Tony Gonzalez pass from Trent Green L, 17-20 10/25/01 Indianapolis Trent Green run L, 28-35 1/6/02 @ Seattle Eddie Kennison pass from Trent Green L, 18-21 11/24/02 @ Seattle Trent Green run L, 32-39 11/28/04 San Diego Eddie Kennison pass from Trent Green L, 31-34 10/16/05 Washington Marc Boerigter pass from Trent Greeen W, 28-21 10/29/06 Seattle Tony Gonzalez pass from Damon Huard W, 35-28 11/4/07 Green Bay Priest Holmes run L, 22-33 9/14/08 Oakland Mike Cox pass from Tyler Thigpen L, 8-23 11/8/09 @ Jacksonville Jamaal Charles pass from Matt Cassel L, 21-24 9/28/15 @ Green Bay Travis Kelce pass from Alex Smith L, 38-28 12/6/15 @ Oakland Travis Kelce pass from Alex Smith W, 34-20 11/13/16 @ Carolina Travis Kelce pass from Alex Smith W, 20-17 11/27/16 @ Denver Demetrius Harris from Alex Smith W, 30-27 12/23/18 @ Seattle Patrick Mahomes run L, 31-38 12/15/19 Denver Sammy Watkins pass from Patrick Mahomes W, 23-3 9/20/20 @ Los Angeles Chargers Mecole Hardman pass from Patrick Mahomes W, 23-20 OT 10/11/20 Las Vegas Darrel Williams pass from Patrick Mahomes L, 32-40 12/20/20 @ New Orleans Travis Kelce pass from Patrick Mahomes W, 32-29 12/16/21 @ Los Angeles Chargers Clyde Edwards-Helaire pass from Patrick Mahomes W, 34-28 OT 1/8/22 @ Denver Patrick Mahomes run W, 28-24 9/25/22 @ Indianapolis Travis Kelce pass from Patrick Mahomes L, 17-20 11/6/22 Tennessee Patrick Mahomes run W, 20-17 OT Year-By-Year Two Point Conversions/Attempts 1960 1/2 1961 3/4 1962 0/1 1963 1/2 1964 1/3 1965 3/3 1966 2/3 1967 2/3 1968 0/0 1969 0/2 1994 3/4 1995 0/3 1996 0/1 1997 2/6 1998 0/1 1999 0/2 2000 0/4 2001 3/6 2002 1/3 2003 0/3 2004 1/2 2005 1/1 2006 1/1 2007 1/3 2008 1/4 2009 1/2 2010 0/2 2011 0/0 2012 0/1 2013 0/0 2014 0/1 2015 2/4 2016 2/2 2017 0/2 2018 1/1 2019 1/2
*
*Kansas City QB Len Dawson s pass was intercepted by San Diego CB Dick Westmoreland. Westmoreland subsequently fumbled and Haynes recovered the ball in the end zone for a TD.
**Kansas City QB Rich Gannon s pass was intercepted by Jacksonville S Chris Hudson. WR Andre Rison subsequently stripped the ball from Hudson and Hughes returned the ball for a seven-yard TD.
All-Time
YEAR-BY-YEAR LEADERS
56 @CHIEFS 2020 3/3 2021 2/3 2022 3/5 TOTAL CONVERSIONS 42 TOTAL ATTEMPTS 95 CONVERSION PERCENTAGE .442 Triple Threat Chiefs 12 players in Chiefs history have
ways Player 5 Different Touchdown Plays Total TDs Johnny Robinson 9 receiving, 6 rushing, 1 FR, 1 PR, 1 INT 18 4 Different Touchdown Plays Tyreek Hill 56 receiving, 6 rushing, 4 PRs, 1 KOR 67 Abner Haynes 39 rushing, 17 receiving, 1 KOR, 1 fumble recovery 58 Mecole Hardman 16 receiving, 2 rushing, 1 KOR, 1 PR 20 Kevin Ross 2 INTs, 1 blocked FG return, 1 FR, 1 blocked punt 5 3 Different Touchdown Plays Travis Kelce 69 receiving, 2 rushing, 1 FR 72 Jamaal Charles 43 rushing, 20 receiving, 1 KOR 64 Dante Hall 9 receiving, 5 PRs, 6 KORs 20 Tamarick Vanover 4 PRs, 4 KORs, 3 receiving 11 Bobby Bell 6 INTs, 2 FRs, 1 KOR 9 Dexter McCluster 5 receiving, 1 rushing, 3 PRs 9 Paul Palmer 4 receiving, 2 rushing, 2 KORs 8 Dale Carter 2 PRs, 1 INT, 1 receiving 4 Key:
Fumble
Interception
Six players in Chiefs history
TD pass Player Rushing Receiving Passing Total TDs Responsible For Marcus Allen 44 21 2 67 Larry Johnson 55 6 1 62 Curtis McClinton 18 14 1 33 Mike Garrett 24 7 1 32 Tyler Thigpen 3 1 18 22 Bert Coan 15 4 1 20 All-Time Offensive Return Scores Date Opponent Offensive Score Result 11/15/64 San Diego Abner Haynes, fumble recovery in end zone* L, 14-28 10/29/72 @ San Diego Robert West, fumble recovery in end zone W, 26-14 10/12/75 Oakland Mike Livingston, 1-yard fumble return W, 42-10 11/18/79 @ Oakland Tony Samuels, fumble recovery in end zone W, 24-21 9/7/86 Cincinnati Walt Arnold, fumble recovery in end zone W, 24-14 11/9/97 @ Jacksonville Danan Hughes, 7-yard fumble return** L, 10-24 12/28/14 San Diego Travis Kelce, fumble recovery in end zone W, 19-7
scored a touchdown at least three different
FR -
return; INT -
return; KOR - Kickoff return; PR - Punt return
have a rushing and a receving TD and have also thrown a
Return Scores Date Opponent Offensive Score Result 9/21/75 @ Denver Jack Dolbin, 2-yard fumble return L, 33-37 10/9/83 L.A. Raiders Marcus Allen, fumble recovery in end zone L, 20-21 All-Time Defensive Two-Point Return Scores (NonSafety) Date Opponent Offensive Score Result 12/4/16 @ Atlanta Eric Berry, INT on two-point conversion attempt W, 29-28 12/1/19 Oakland Charvarius Ward, Tanoh Kpassagnon blocked PAT attempt W, 40-9
Rushing Year Player No. Yds. Avg. LG TD 1960* Abner Haynes 156 875 5.6 67 9 1961 Abner Haynes 179 841 4.7 59 9 1962 Abner Haynes 221 1049 4.8 71 13 1963 Curtis McClinton 142 568 4.0 36 3 1964 Abner Haynes 137 713 5.2 80 4 1965 Curtis McClinton 175 661 3.8 48 6 1966 Mike Garrett 147 801 5.4 77 6 1967 Mike Garrett 236 1087 4.6 58 9 1968 Robert Holmes 174 866 5.0 76 7 1969 Mike Garrett 168 732 4.4 34 6 1970 Ed Podolak 168 749 4.5 65 3 1971 Ed Podolak 184 708 3.8 25 9 1972 Ed Podolak 171 615 3.6 28 4 1973 Ed Podolak 210 721 3.4 25 3 1974 Woody Green 135 509 3.8 43 3 1975 Woody Green 167 611 3.7 42 5 1976 MacArthur Lane 162 542 3.3 20 5 1977 Ed Podolak 133 550 4.1 41 5 1978 Tony Reed 206 1053 5.1 62 6 1979 Ted McKnight 153 755 4.9 84 8 1980 Ted McKnight 206 693 3.4 25 3 1981 Joe Delaney 234 1121 4.8 82 3 1982 Joe Delaney 95 380 4.0 36 0 1883 Billy Jackson 152 499 3.3 19 2 1984 Herman Heard 165 684 4.1 69 4 1985 Herman Heard 164 595 3.6 33 4 1986 Mike Pruitt 139 448 3.2 16 2 1987 Christian Okoye 157 660 4.2 43 3 1988 Christian Okoye 105 473 4.5 48 3 1989* Christian Okoye 370 1480 4.0 59 12 1990 Barry Word 204 1015 5.0 53 4 1991 Christian Okoye 225 1031 4.6 48 9 1992 Barry Word 163 607 3.7 44 4 1993 Marcus Allen 206 764 3.7 39 12 1994 Marcus Allen 189 709 3.8 36 7 1995 Marcus Allen 207 890 4.3 38 5 1996 Marcus Allen 206 830 4.0 35 9 1997 Greg Hill 157 550 3.5 38 0 1998 Donnell Bennett 148 527 3.6 26 5 1999 Donnell Bennett 161 627 3.9 44 8 2000 Tony Richardson 147 697 4.7 33 3 2001 Priest Holmes 327 1555 4.8 41 8 2002 Priest Holmes 313 1615 5.2 56 21 2003 Priest Holmes 320 1420 4.4 31 27 2004 Priest Holmes 196 892 4.6 33 14 2005 Larry Johnson 336 1750 5.2 49 20 2006 Larry Johnson 416 1789 4.3 47 17 2007 Larry Johnson 158 559 3.5 54 3 2008 Larry Johnson 193 874 4.5 65 5 2009 Jamaal Charles 190 1120 5.9 76 7 2010 Jamaal Charles 230 1467 6.4 80 5 2011 Jackie Battle 149 597 4.0 34 2 2012 Jamaal Charles 285 1509 5.3 91 5 2013 Jamaal Charles 259 1287 5.0 46 12 2014 Jamaal Charles 206 1033 5.0 63t 9 2015 Charcandrick West 185 721 3.9 38t 5 2016 Spencer Ware 214 921 4.3 46 3 2017 Kareem Hunt 272 1327 4.9 69t 8 2018 Kareem Hunt 181 824 4.6 45 7 2019 Damien Williams 111 497 4.5 91t 5 2020 Clyde Edwards-Helaire 181 803 4.4 31 4 2021 Darrel Williams 144 558 3.9 21 6 2022 Isiah Pacheco 170 830 4.9 31 5 Passing Year Player Att.-Comp. Yds. Pct. TD Int Rate 1960 Cotton Davidson 379-179 2474 .472 15 16 64.5 1961 Cotton Davidson 330-151 2445 .458 17 23 59.3 1962* Len Dawson 310-189 2759 .610 29 17 98.4 1963 Len Dawson 352-190 1389 .540 26 19 77.6 1964* Len Dawson 354-199 2879 .562 30 18 89.9 1965 Len Dawson 305-163 2262 .534 21 14 81.3 1966* Len Dawson 284-159 2527 .560 26 10 101.9 1967 Len Dawson 357-206 2651 .577 24 17 83.5 1968* Len Dawson 224-131 2109 .585 17 9 98.8 1969 Len Dawson 166-98 1323 .590 9 13 70.0 1970 Len Dawson 262-141 1876 .538 13 14 71.3 1971 Len Dawson 301-167 2504 .552 15 13 81.8 1972 Len Dawson 305-175 1835 .574 13 12 73.1 1973 Mike Livingston 145-75 916 .517 6 7 65.2 1974 Len Dawson 235-138 1573 .587 7 13 66.0 1975 Len Dawson 140-93 1095 664 5 4 89.9 1976 Mike Livingston 338-189 2682 .559 12 13 77.9 1977 Mike Livingston 282-143 1823 .507 15 9 59.8 1978 Mike Livingston 290-159 1573 .548 5 13 57.3 1979 Steve Fuller 270-146 1484 .541 6 14 55.8
Opponent Offensive
57 @CHIEFS 1980 Steve Fuller 320-193 2250 .603 10 12 76.1 1981 Bill Kenney 274-147 1983 .536 9 16 63.8 1982 Bill Kenney 169- 95 1192 .562 7 6 77.0 1983 Bill Kenney 603-346 4348 .574 24 18 80.8 1984 Bill Kenney 282-151 2098 .535 15 10 80.7 1985 Bill Kenney 338-181 2536 .536 17 9 83.6 1986 Bill Kenney 308-161 1922 .523 13 11 70.8 1987 Bill Kenney 273-154 2107 .564 15 9 85.8 1988 Steve DeBerg 414-224 2935 .541 16 16 73.5 1989 Steve DeBerg 324-196 2529 .605 11 16 75.8 1990 Steve DeBerg 444-258 3444 .581 23 4 96.3 1991 Steve DeBerg 434-256 2965 .590 17 14 79.3 1992 Dave Krieg 413-230 3115 .557 15 12 79.9 1993 Joe Montana 298-181 2144 .607 13 7 87.4 1994 Joe Montana 493-299 3283 .606 16 9 83.6 1995 Steve Bono 520-293 3121 .563 21 10 79.5 1996 Steve Bono 438-235 2572 .537 12 13 68.0 1997 Elvis Grbac 314-179 1943 .570 11 6 79.1 1998 Rich Gannon 352-206 2305 .582 10 6 80.1 1999 Elvis Grbac 499-294 3389 .589 22 15 81.7 2000 Elvis Grbac 547-342 4169 .596 28 14 89.9 2001 Trent Green 523-296 3783 .566 17 24 71.1 2002 Trent Green 470-287 3690 .611 26 13 92.6 2003 Trent Green 523-330 4039 .631 24 12 92.6 2004 Trent Green 556-369 4591 .664 27 17 95.2 2005 Trent Green 507-317 4014 .625 17 10 90.1 2006 Damon Huard 244-148 1878 .607 11 1 98.0 2007 Damon Huard 332-206 2257 .620 11 13 76.8 2008 Tyler Thigpen 420-230 2608 .548 18 12 76.0 2009 Matt Cassel 493-271 2924 .550 16 16 69.9 2010 Matt Cassel 450-262 3116 .582 27 7 93.0 2011 Matt Cassel 269-160 1713 .595 10 9 76.6 2012 Matt Cassel 277-161 1796 .581 6 12 66.7 2013 Alex Smith 508-308 3313 .606 23 7 89.1 2014 Alex Smith 464-303 3265 .653 18 6 93.4 2015 Alex Smith 542-353 3922 .653 20 7 95.4 2016 Alex Smith 489-328 3502 .671 15 8 91.2 2017 Alex Smith 505-341 4042 .675 26 3 104.7 2018 P. Mahomes 580-383 5097 .660 52 12 113.8 2019 P. Mahomes 484-319 4031 .659 26 5 105.3 2020 P. Mahomes 588-390 4740 .663 38 6 108.2 2021 P. Mahomes 658-436 4839 .663 37 13 98.5 2022 P. Mahomes 648-435 5250 .671 41 12 105.1 Pass Receiving Year Player No. Yds. Avg. LG TD 1960 Abner Haynes 55 576 10.5 34 3 1961 Chris Burford 51 850 16.7 54 5 1962 Chris Burford 45 645 14.4 49 12 1963 Chris Burford 68 824 12.1 69 9 1964 Frank Jackson 62 943 15.2 72 9 1965 Chris Burford 47 575 12.2 57 6 1966 Otis Taylor 58 1297 22.4 89 8 1967 Otis Taylor 59 958 16.2 71 11 1968 MIke Garrett 33 359 10.9 43 3 1969 Mike Garrett 43 432 10.0 41 2 1970 Otis Taylor 34 618 18.2 59 3 1971 Otis Taylor 57 1110 19.5 82 7 1972 Otis Taylor 57 821 14.4 44 6 1973 Ed Podolak 55 445 8.1 25 0 1974 Ed Podolak 43 306 7.1 26 1 1975 Ed Podolak 37 332 9.0 21 2 1976* MacArthur Lane 66 686 10.4 44 1 1977 Walter White 48 674 14.0 48 5 1978 Tony Reed 48 483 10.1 44 1 1979 Ted McKnight 38 226 6.0 24 0 1980 Henry Marshall 47 799 17.0 75 6 1981 J.T. Smith 63 852 13.5 42 2 1982 Henry Marshall 40 549 13.7 44 3 1983 Carlos Carson 80 1351 16.9 50 7 1984 Henry Marshall 62 912 14.7 37 4 1985 Carlos Carson 47 843 17.9 34 4 1986 Stephone Paige 52 829 15.9 51 11 1987 Carlos Carson 55 1044 19.0 81 7 1988 Stephone Paige 61 902 14.8 49 7 1989 Stephone Paige 44 759 17.3 50 2 1990 Stephone Paige 65 1021 15.7 86 5 1991 Robb Thomas 43 495 11.5 39 1 1992 Todd McNair 44 380 8.6 36 1 1993 Willie Davis 52 909 17.5 66 7 1994 Kimble Anders 67 525 7.8 30 1 1995 Kimble Anders 55 349 6.3 28 1 1996 Kimble Anders 60 529 8.8 45 2 1997 Andre Rison 72 1092 15.2 45 7 1998 Kimble Anders 64 462 7.2 29 2 1999 Tony Gonzalez 76 849 11.2 73 11 2000 Tony Gonzalez 93 1203 12.9 39 9 2001 Tony Gonzalez 73 917 12.6 36 6 2002 Priest Holmes 70 672 9.6 64 3 2003 Priest Holmes 74 690 9.3 36 0 2004* Tony Gonzalez 102 1258 12.3 32 7 2005 Tony Gonzalez 78 905 11.6 39 2 2006 Tony Gonzalez 73 900 12.3 57 5 2007 Tony Gonzalez 99 1172 11.8 31 5 2008 Tony Gonzalez 96 1058 11.0 35 10 2009 Dwayne Bowe 47 589 12.5 41 4 2010 Dwayne Bowe 72 1162 16.1 75 15 2011 Dwayne Bowe 81 1159 14.3 52 5 2012 Dwayne Bowe 59 801 13.6 47 3 2013 Jamaal Charles 70 693 9.9 71t 7 2014 Travis Kelce 67 862 12.9 34 5 2015 Jeremy Maclin 92 1140 12.4 61 8 2016 Travis Kelce 85 1125 13.2 80t 4 2017 Tyreek Hill 75 1183 15.3 79t 7 2018 Tyreek Hill 87 1479 17.0 75t 12 2019 Travis Kelce 97 1229 12.7 47 5 2020 Travis Kelce 105 1416 13.5 45 11 2021 Tyreek Hill 111 1239 11.2 75t 9 2022 Travis Kelce 110 1338 12.2 52 12 Interceptions Year Player No. Yds. Avg. TD 1960 David Webster 6 156 26.0 2 1961 David Webster 5 50 10.0 0 1962 Bobby Hunt 8 101 12.7 0 1963 Bobby Hunt 6 228 38.0 0 1964 Bobby Hunt 7 133 19.0 1 1965 Fred Williamson 7 89 12.7 0 1966* Johnny Robinson 10 136 13.6 1 Bobby Hunt 10 113 11.3 0 1967 Fletcher Smith 6 150 25.0 0 1968 Johnny Robinson 6 40 6.7 0 1969* Emmitt Thomas 9 147 18.4 1 1970* Johnny Robinson 10 155 15.5 0 1971 Emmitt Thomas 8 145 18.1 1 1972* Mike Sensibaugh 8 65 8.1 0 1973 Emmitt Thomas 3 65 21.6 0 Mike Sensibaugh 3 58 19.3 0 Willie Lanier 3 47 16.6 1 Jim Kearney 3 30 10.0 0 1974* Emmitt Thomas 12 214 18.8 2 1975 Emmitt Thomas 6 119 19.8 0 1976 Kerry Reardon 5 26 5.2 0 1977 Gary Barbaro 8 165 20.6 1 1978 Tim Gray 6 118 19.7 0 1979 Gary Barbaro 7 142 20.3 1 1980 Gary Barbaro 10 163 16.3 0 1981 Eric Harris 7 109 15.6 0 1982 Eric Harris 3 66 22.0 1 Gary Barbaro 3 48 16.0 1 1983 Deron Cherry 7 100 14.3 0 1984 Deron Cherry 7 140 20.0 0 1985 Albert Lewis 8 59 7.4 0 1986* Deron Cherry 9 150 16.7 0 1987 Deron Cherry 3 58 19.3 0 1988 Deron Cherry 7 51 7.3 0 1989 Albert Lewis 4 37 9.3 0 Kevin Ross 4 29 7.3 0 1990 Kevin Ross 5 97 19.4 0 1991 Deron Cherry 4 31 7.8 0 1992 Dale Carter 7 65 9.3 1 1993 Albert Lewis 6 61 10.2 0 1994 Charles Mincy 3 49 16.3 0 1995 Dale Carter 4 45 11.3 0 1996 Mark Collins 6 45 7.5 0 1997* Mark McMillian 8 274 34.3 3 1998 James Hasty 4 42 10.5 0 1999 James Hasty 7 98 14.0 2 2000 James Hasty 4 53 13.3 0 2001 Eric Warfield 4 61 15.3 1 2002 Greg Wesley 6 170 28.3 0 2003 Greg Wesley 6 63 10.5 0 Dexter McCleon 6 -3 -0.5 0 2004 Greg Wesley 4 92 23.0 0
Note: Sacks became recognized as an official NFL statistic in 1982. The Chiefs began recording sacks in 1974.
Note: The Chiefs began recording tackle totals in 1977.
Special Teams Tackles
58 @CHIEFS Eric Warfield 4 49 12.3 1 2005 Greg Wesley 6 106 17.7 0 2006 Ty Law 4 11 2.8 0 2007 Jarrad Page 3 37 12.3 0 2008 Jarrad Page 4 2 0.5 0 2009 Brandon Flowers 5 38 7.6 0 2010 Eric Berry 4 102 25.5 1 2011 Brandon Flowers 4 95 23.8 1 Brandon Carr 4 17 4.3 0 2012 Brandon Flowers 3 28 9.3 0 2013 Quintin Demps 4 61 15.3 0 2014 Kurt Coleman 3 12 4.0 0 2015 Marcus Peters 9 280 31.1 2 2016 Marcus Peters 6 63 10.5 0 2017 Marcus Peters 5 137 27.4 0 2018 Steven Nelson 4 53 13.3 0 2019 Tyrann Mathieu 4 70 17.5 0 2020 Tyrann Mathieu 6 70 11.7 1 2021 Tyrann Mathieu 3 56 18.7 1 2022 L'Jarius Sneed 3 57 19.0 0 Juan Thornhill 3 0 0.0 0 Sacks Year Player Sacks/Yds 1974 Marvin Upshaw 9.5/49.0 1975 Wilbur Young 9.5/73.0 1976 Lawrence Estes 5.0/52.0 1977 Wilbur Young 5.5/51.5 1978 Art Still 8.5/59.0 1979 Art Still 8.5/63.5 1980 Art Still 4.5/115.0 1981 Ken Kremer 8.0/57.5 1982 Art Still 4.0/34.0 1983 Mike Bell 10.0/62.0 1984 Art Still 14.5/86.0 1985 Bill Maas 7.0/51.0 1986 Art Still 10.5/77.0 1987 Mike Bell 6.5/44.0 1988 Bill Maas 4.0/34.0 1989 Derrick Thomas 10.0/95.5 1990 *Derrick Thomas 20.0/150.0 1991 Derrick Thomas 13.5/112.0 1992 Neil Smith 14.5/114.5 Derrick Thomas 14.5/113.0 1993* Neil Smith 15.0/127.0 1994 Neil Smith 11.5/89.0 1995 Neil Smith 12.0/82.0 1996 Derrick Thomas 13.0/109.0 1997 Dan Williams 10.5/57.5 1998 Derrick Thomas 12.0/79.0 1999 Derrick Thomas 7.0/65.0 2000 Eric Hicks 14.0/73.0 2001 Duane Clemons 7.0/68.5 2002 Eric Hicks 9.0/69.5 2003 Vonnie Holliday 5.5/50.0 2004 Jared Allen 9.0/47.0 2005 Jared Allen 11.0/65.0 2006 Tamba Hali 8.0/48.0 2007* Jared Allen 15.5/111.0 2008 Tamba Hali 3.0/23.0 2009 Tamba Hali 8.5/45.5 2010 Tamba Hali 14.5/91.5 2011 Tamba Hali 12.0/80.0 2012 Justin Houston 10.0/69.0 2013 Justin Houson 11.0/75.0 2013 Tamba Hali 11.0/78.5 2014 Justin Houston 22.0/60.0 2015 Justin Houston 7.5/54 2016 Dee Ford 10.0/53.0 2017 Justin Houston 9.5/54.0 2018 Chris Jones 15.5/122.0 2019 Chris Jones 9.0/75.0 2020 Chris Jones 7.5/28.0 2021 Chris Jones 9.0/65.5 2022 Chris Jones 15.5/105.5
Tackles Year Player Tackles 1977 Willie Lanier 132 (88 solo) 1978 Gary Spani 144 (102 solo) 1979 Gary Spani 157 (115 solo) 1980 Gary Spani 149 (96 solo) 1981 Gary Spani 153 (104 solo) 1982 Art Still 68 (44 solo) 1983 Jerry Blanton 136 (83 solo) 1984 Art Still 131 (107 solo) 1985 Deron Cherry 134 (85 solo) 1986 Dino Hackett 140 (78 solo) 1987 Dino Hackett 103 (74 solo) 1988 Deron Cherry 151 (90 solo) 1989 Deron Cherry 87 (45 solo) 1990 Dino Hackett 95 (53 solo) 1991 Deron Cherry 116 (59 solo) 1992 Tracy Simien 97 (56 solo) 1993 Tracy Simien 105 (68 solo) 1994 Tracy Simien 99 (65 solo) 1995 Tracy Simien 106 (75 solo) 1996 Mark Collins 119 (94 solo) 1997 Reggie Tongue 142 (91 solo) 1998 Donnie Edwards 151 (97 solo) 1999 Donnie Edwards 143 (105 solo) 2000 Donnie Edwards 151 (119 solo) 2001 Donnie Edwards 147 (112 solo) 2002 Mike Maslowski 162 (109 solo) 2003 Scott Fujita 151 (110 solo) 2004 Scott Fujita 112 (71 solo) 2005 Kawika Mitchell 135 (100 solo) 2006 Kawika Mitchell 118 (88 solo) 2007 Napoleon Harris 123 (97 solo) 2008 Bernard Pollard 98 (78 solo) 2009 Demorrio Williams 142 (90 solo) 2010 Derrick Johnson 147 (107 solo) 2011 Derrick Johnson 179 (131 solo) 2012 Derrick Johnson 125 (110 solo) 2013 Derrick Johnson 107 (95 solo) 2014 Josh Mauga 103 (82 solo) 2015 Derrick Johnson 126 (100 solo) 2016 Derrick Johnson 90 (70 solo) 2017 Daniel Sorensen 88 (66 solo) 2018 Anthony Hitchens 135 (81 solo) 2019 Anthony Hitchens 88 (51 solo) 2020 Daniel Sorensen 91 (68 solo) 2021 Nick Bolton 112 (70 solo) 2022 Nick Bolton 180 (108 solo)
Year Player Tackles 1982 Al Steinfeld 18 (13 solo) 1983 Albert Lewis 27 (23 solo) 1984 Ken Jolly 28 (19 solo) 1985 Walt Arnold 20 (12 solo) 1986 Sherman Cocroft 22 (21 solo) 1987 Tim Cofield 19 (10 solo) 1988 Angelo Snipes 26 (17 solo) 1989 Rob McGovern 24 (18 solo) 1990 Todd McNair 27 (22 solo) 1991 Tim Barnett 15 (12 solo) 1992 Bennie Thompson 27 (20 solo) 1993 Fred Jones 14 (14 solo) Todd McNair 14 (11 solo) Bennie Thompson 14 (11 solo) 1994 Greg Manusky 23 (22 solo) 1995 Greg Manusky 23 (18 solo) Tracy Rogers 23 (15 solo) 1996 Greg Manusky 26 (20 solo) 1997 Greg Manusky 25 (20 solo) 1998 Greg Manusky 23 (14 solo) 1999 Greg Manusky 27 (19 solo) 2000 Mike Maslowski 25 (20 solo) 2001 Gary Stills 18 (14 solo) 2002 Gary Stills 34 (25 solo) 2003 Gary Stills 29 (24 solo) 2004 Gary Stills 25 (19 solo) 2005 Rich Scanlon 29 (20 solo) 2006 Kris Griffin 22 (14 solo) 2007 Nate Harris 20 (10 solo) 2008 Jon McGraw 23 (19 solo) 2009 Jovan Belcher 17 (16 solo) 2010 Terrance Copper 19 (14 solo) 2011 Cory Greenwood 15 (10 solo) 2012 Edgar Jones 7 (7 solo) 2013 Anthony Sherman 11 (10 solo)
59 @CHIEFS 2014 Anthony Sherman 13 (13 solo) 2015 Frank Zombo 9 (8 solo) 2016 D.J. Alexander 12 (9 solo) 2017 Eric Murray 6 (5 solo) Kevin Pierre-Louis 6 (6 solo) Frank Zombo 6 (6 solo) 2018 Charvarius Ward 12 (9 solo) 2019 Armani Watts 10 (8 solo) 2020 Dorian O'Daniel 7 (5 solo) 2021 Marcus Kemp 10 (8 solo) 2022 Jack Cochrane 9 (5 solo) Punting Year Player No. Yds. Avg. I20 LG 1960 C. Davidson 58 2287 39.4 1961 C. Davidson 61 2479 40.6 62 1962 Eddie Wilson 47 1691 36.0 52 1963 Jerrel Wilson 61 2628 43.1 72 1964 Jerrel Wilson 78 3326 42.6 70 1965* Jerrel Wilson 69 3132 45.4 64 1966 Jerrel Wilson 62 2715 43.8 69 1967 Jerrel Wilson 41 1739 42.4 59 1968* Jerrel Wilson 63 2841 45.1 70 1969 Jerrel Wilson 68 3022 44.4 62 1970 Jerrel Wilson 76 3415 44.9 68 1971 Jerrel Wilson 64 2864 44.8 68 1972* Jerrel Wilson 66 2960 44.8 69 1973* Jerrel Wilson 80 3642 45.5 68 1974 Jerrel Wilson 83 3462 41.7 64 1975 Jerrel Wilson 54 2233 41.4 64 1976 Jerrel Wilson 65 2729 42.0 15 62 1977 Jerrel Wilson 88 3510 39.4 11 59 1978 Z. Andrusyshyn 79 3247 41.1 18 61 1979* Bob Grupp 89 3883 43.6 23 74 1980 Bob Grupp 84 3317 39.5 23 57 1981 Bob Grupp 41 1556 38.0 5 57 1982 Jeff Gossett 33 1366 41.4 6 56 1983 Jim Arnold 93 3710 39.9 21 64 1984 Jim Arnold 98 4397 44.9 22 63 1985 Jim Arnold 93 3827 41.2 15 62 1986 Lewis Colbert 99 4033 40.7 23 56 1987 K. Goodburn 59 2412 40.9 13 55 1988 K. Goodburn 76 3059 40.3 10 59 1989 K. Goodburn 67 2688 40.1 25 54 1990 Bryan Barker 64 2479 38.7 16 56 1991 Bryan Barker 57 2303 40.4 11 57 1992 Bryan Barker 75 3245 43.3 16 65 1993 Bryan Barker 76 3240 42.6 19 59 1994 Louie Aguiar 85 3582 42.1 15 61 1995 Louie Aguiar 91 3990 43.8 29 65 1996 Louie Aguiar 88 3667 41.7 25 68 1997 Louie Aguiar 82 3465 42.3 28 65 1998 Louie Aguiar 75 3226 43.0 20 59 1999 Daniel Pope 101 4218 41.8 20 64 2000 Todd Sauerbrun 82 3656 44.6 28 68 2001 Dan Stryzinski 73 2976 40.8 27 76 2002 Dan Stryzinski 64 2422 37.8 15 56 2003 Jason Baker 80 3156 39.5 21 68 2004 Steve Cheek 42 1643 39.1 8 55 2005 Dustin Colquitt 65 2564 39.4 27 62 2006 Dustin Colquitt 71 3145 44.3 23 72 2007 Dustin Colquitt 95 4322 45.5 27 81 2008 Dustin Colquitt 70 3110 44.4 27 73 2009 Dustin Colquitt 96 4361 45.4 41 70 2010 Dustin Colquitt 88 3908 44.4 33 72 2011 Dustin Colquitt 89 4084 45.9 27 68 2012 Dustin Colquitt 83 3887 46.8 45 71 2013 Dustin Colquitt 87 4005 46.0 35 65 2014 Dustin Colquitt 71 3164 44.6 31 69 2015 Dustin Colquitt 82 3621 44.2 42 62 2016 Dustin Colquitt 76 3427 45.1 38 64 2017 Dustin Colquitt 65 2936 45.2 29 77 2018 Dustin Colquitt 45 2021 44.9 21 67 2019 Dustin Colquitt 48 2126 44.3 21 68 2020 Tommy Townsend 52 2339 45.0 20 67 2021 Tommy Townsend 37 1746 47.2 20 68 2022 Tommy Townsend 53 2672 50.4 22 76 Punt Returns Year Player No. Yds. Avg. LG TD 1960 Abner Haynes 14 215 15.4 46 0 1961 Abner Haynes 19 196 10.3 44 0 1962 Frank Jackson 11 117 10.6 29 0 1963 Frank Jackson 11 95 8.6 17 0 1964 Willie Mitchell 18 167 9.3 36 0 1965 Willie Mitchell 19 242 12.7 71 1 1966 Mike Garrett 17 139 8.2 79 1 1967 Noland Smith 26 212 8.2 59 0 1968* Noland Smith 18 270 15.0 80 1 1969 Noland Smith 9 107 11.9 80 0 1970* Ed Podolak 23 311 13.5 60 0 1971 Ed Podolak 13 84 6.5 23 0 1972 Larry Marshall 18 103 5.7 29 0 1973 Larry Marshall 29 180 6.2 31 0 1974 Ed Podolak 15 134 8.9 54 0 1975 Charlie Thomas 12 112 9.3 34 0 1976 Larry Brunson 31 387 12.5 48 0 1977 Gary Green 14 115 8.2 18 0 1978 Eddie Payton 32 364 11.4 39 0 1979 J.T. Smith 58 612 10.6 88 2 1980* J.T. Smith 40 581 14.5 75 2 1981 J.T. Smith 50 528 10.6 62 0 1982 Anthony Hancock 12 103 8.6 30 0 1983 J.T. Smith 26 210 8.1 19 0 1984 J.T. Smith 39 332 8.5 27 0 1985 Garcia Lane 43 381 8.9 57 0 1986 Jeff Smith 29 245 8.4 48 0 1987 Michael Clemons 19 162 8.5 44 0 1988 Kitrick Taylor 29 187 6.4 16 0 1989 Pete Mandley 19 151 7.9 19 0 1990 Naz Worthen 25 180 7.2 37 0 1991 Troy Stradford 22 150 6.8 18 0 1992 Dale Carter 38 398 10.5 86 2 1993 Dale Carter 27 247 9.1 30 0 1994 Danan Hughes 27 192 7.1 43 0 1995 Tamarick Vanover 51 540 10.6 86 1 1996 Tamarick Vanover 17 116 6.8 24 0 1997 Tamarick Vanover 35 383 10.9 82 1 1998 Tamarick Vanover 27 264 9.8 37 0 1999 Tamarick Vanover 51 627 12.3 80 2 2000 Kevin Lockett 26 208 8.0 26 0 2001 Dante Hall 32 235 7.3 26 0 2002 Dante Hall 29 390 13.4 90 2 2003 Dante Hall 29 472 16.3 93 2 2004 Dante Hall 23 232 10.1 46 0 2005 Dante Hall 42 276 6.6 52 0 2006 Dante Hall 27 240 8.9 60t 1 2007 Eddie Drummond 32 222 6.9 22 0 2008 Kevin Robinson 11 94 8.5 32 0 2009 Bobby Wade 21 160 7.6 18 0 2010 Javier Arenas 39 322 8.3 36 0 2011 Javier Arenas 32 410 12.8 37 0 2012 Javier Arenas 34 297 8.7 27 0 2013 Dexter McCluster 58 686 11.8 89t 2 2014 De'Anthony Thomas 34 405 11.9 81t 1 2015 Jeremy Maclin 51 416 8.2 37 0 2016 Tyreek Hill 39 592 15.2 95t 2 2017 Tyreek Hill 25 204 8.2 82t 1 2018 Tyreek Hill 20 213 10.7 91t 1 2019 Mecole Hardman 18 167 9.3 36 0 2020 Mecole Hardman 25 176 7.0 67t 1 2021 Mecole Hardman 13 157 12.1 31 0 2022 Skyy Moore 14 86 6.1 15 0 Kadarius Toney 10 61 6.1 9 0 Kickoff Returns Year Player No. Yds. Avg. LG TD 1960 Abner Haynes 19 434 22.8 82 0 1961* Dave Grayson 16 453 28.3 73 0 1962 Dave Grayson 18 535 29.7 59 0 1963 Dave Grayson 20 564 28.2 99 1 1964 Dave Grayson 30 679 22.6 80 0 1965 Bert Coan 19 479 25.2 52 0 1966 Emmitt Thomas 29 673 23.2 63 0 1967 Noland Smith 41 1148 28.0 106 1 1968 Noland Smith 23 549 23.9 37 0 1969 Warren McVea 13 318 24.5 40 0 1970 Robert Holmes 19 535 28.2 48 0 1971 Kerry Reardon 12 308 25.7 41 0 1972 Larry Marshall 23 651 28.3 48 0 1973 Larry Marshall 14 391 27.9 38 0 1974 Bill Thomas 25 571 22.8 33 0 1975 Reggie Craig 10 247 24.7 63 0 1976 Lawrence Williams 25 688 27.6 64 0 1977 Ted McKnight 12 305 25.4 70 0
60 @CHIEFS 1978 Eddie Payton 30 775 25.8 66 0 1979 Horace Belton 22 463 21.0 52 0 1980 Carlos Carson 40 917 22.9 47 0 1981 James Murphy 20 457 22.9 46 0 1982 Anthony Hancock 27 609 22.6 68 0 1983 Theotis Brown 15 301 20.1 46 0 1984 J.T. Smith 19 391 20.6 39 0 1985 Jeff Smith 33 654 19.8 39 0 1986 Jeff Smith 29 557 19.2 29 0 1987* Paul Palmer 38 923 24.3 95 2 1988 Kenny Gamble 15 291 19.4 31 0 1989 Danny Copeland 26 466 17.9 36 0 1990 Todd McNair 14 227 16.2 23 0 1991 Harvey Williams 24 524 21.8 76 0 1992 Harvey Williams 21 405 19.3 37 0 1993 Danan Hughes 14 266 19.0 30 0 1994 Ron Dickerson 21 472 22.5 62 0 1995 Tamarick Vanover 43 1095 25.5 99 2 1996* Tamarick Vanover 33 854 25.9 97 1 1997 Tamarick Vanover 51 1308 25.6 94 1 1998 Tamarick Vanover 41 956 23.3 62 0 1999 Tamarick Vanover 44 886 20.1 29 0 2000 Michael Cloud 36 779 21.6 38 0 2001 Dante Hall 43 969 22.5 71 0 2002 Dante Hall 57 1354 23.8 88 1 2003* Dante Hall 57 1478 25.9 100 2 2004 Dante Hall 68 1718 25.3 97 2 2005 Dante Hall 65 1560 24.0 96 1 2006 Dante Hall 53 1207 22.8 60 0 2007 Eddie Drummond 37 785 21.2 39 0 2008 Dantrell Savage 26 633 24.3 59 0 2009 Jamaal Charles 36 925 25.7 97 1 2010 Dexter McCluster 26 527 20.3 36 0 2011 Dexter McCluster 25 557 22.3 35 0 2012 Shaun Draughn 23 537 23.3 41 0 2013 Quintin Demps 33 992 30.1 95t 1 2014 Knile Davis 29 829 28.6 99t 1 2015 Knile Davis 28 799 28.5 106t 1 2016 Tyreek Hill 14 384 27.4 86t 1 2017 Akeem Hunt 25 611 24.4 42 0 2018 Tremon Smith 33 886 26.8 97 0 2019 Mecole Hardman 27 704 26.1 104t 1 2020 Byron Pringle 10 324 32.4 102t 1 2021 ByronPringle 25 621 24.8 39 0 2022 Isiah Pacheco 29 597 20.6 48 0 Leading Scorer Year Player TD PAT FG Points 1960 Jack Spikes 5 34 13 103 1961 Jack Spikes 5 10 4 54 1962 Abner Haynes 19 0 0 114 1963 Chris Burford 9 1# 0 56 1964 Tommy Brooker 0 46 8 70 1965 Tommy Brooker 0 37 13 76 1966 Mike Mercer 0 35 20 93 1967 Jan Stenerud 0 45 21 108 1968 Jan Stenerud 0 39 30 129 1969 Jan Stenerud 0 38 27 119 1970 Jan Stenerud 0 26 30 116 1971 Jan Stenerud 0 32 26 110 1972 Jan Stenerud 0 32 21 95 1973 Jan Stenerud 0 21 24 93 1974 Jan Stenerud 0 24 17 75 1975 Jan Stenerud 0 30 22 96 1976 Jan Stenerud 0 27 21 90 1977 Jan Stenerud 0 27 8 51 1978 Jan Stenerud 0 25 20 85 1979 Jan Stenerud 0 23 12 64 1980 Nick Lowery 0 37 20 97 1981 Nick Lowery 0 37 26 115 1982 Nick Lowery 0 17 19 74 1983 Nick Lowery 0 44 24 116 1984 Nick Lowery 0 35 23 104 1985 Nick Lowery 0 35 24 107 1986 Nick Lowery 0 43 19 100 1987 Nick Lowery 0 26 19 83 1988 Nick Lowery 0 23 27 104 1989 Nick Lowery 0 34 24 106 1990* Nick Lowery 0 37 34 139 1991 Nick Lowery 0 35 25 110 1992 Nick Lowery 0 39 22 105 1993 Nick Lowery 0 37 23 106 1994 Lin Elliott 0 30 25 105 1995 Lin Elliott 0 34 24 106 1996 Pete Stoyanovich 0 34 17 85 1997 Pete Stoyanovich 0 35 26 113 1998 Pete Stoyanovich 0 34 27 115 1999 Pete Stoyanovich 0 45 21 108 2000 Todd Peterson 0 25 15 70 2001 Todd Peterson 0 27 27 108 2002* Priest Holmes 24 0 0 144 2003 Priest Holmes 27 0 0 162 2004 Lawrence Tynes 0 58 17 109 2005 Larry Johnson 21 0 0 126 2006 Larry Johnson 19 0 0 114 2007 Dave Rayner 0 14 15 59 2008 Tony Gonzalez 10 0 0 60 2009 Ryan Succop 0 29 25 104 2010 Ryan Succop 0 42 20 102 2011 Ryan Succop 0 20 24 92 2012 Ryan Succop 0 17 28 101 2013 Ryan Succop 0 52 22 118 2014 Cairo Santos 0 38 25 113 2015 Cairo Santos 0 44 35 149 2016 Cairo Santos 0 36 31 129 2017 Harrison Butker 0 28 38 142 2018 Harrison Butker 0 65 24 137 2019 Harrison Butker 0 45 34 147 2020 Harrison Butker 0 48 25 123 2021 Harrison Butker 0 47 25 122 2022 Harrison Butker 0 38 18 92 Leading Non-Kicking Scorer Year Player Rush TD Rec TD Ret TD Points 1960 Abner Haynes 9 3 0 72 1961 Abner Haynes 9 3 1 78 1962 Abner Haynes 13 6 0 114 1963 Chris Burford 0 9 0 56# 1964 Frank Jackson 0 9 0 54 1965 Curtis McClinton 6 3 0 54 1966 Bert Coan 7 2 0 54 Curtis McClinton 4 5 0 54 1967 Otis Taylor 1 11 0 72 1968 Robert Holmes 7 0 0 42 1969 Mike Garrett 6 2 0 48 1970 Wendell Hayes 5 0 0 30 1971 Ed Podolak 9 0 0 54 1972 Otis Taylor 0 6 0 36 Ed Podolak 4 2 0 36 1973 Otis Taylor 0 4 0 24 1974 Woody Green 3 1 0 24 1975 Woody Green 5 1 0 36 1976 Walter White 0 7 0 42 1977 Ed Podolak 5 0 0 30 Walter White 0 5 0 30 1978 Arnold Morgado 7 0 0 42 Tony Reed 6 1 0 42 1979 Ted McKnight 8 0 0 48 1980 Henry Marshall 0 6 0 36 1981 Billy Jackson 10 1 0 66 1982 Billy Jackson 3 0 0 18 Henry Marshall 0 3 0 18 1983 Theotis Brown 8 2 0 60 1984 6 Players Tied 24 1985 Stephone Paige 0 10 0 60 1986 Stephone Paige 0 11 0 66 1987 Carlos Carson 0 7 0 42 1988 Stephone Paige 0 7 0 42 1989 Christian Okoye 12 0 0 72 1990 Christian Okoye 7 0 0 42 1991 Christian Okoye 9 0 0 54 1992 Christian Okoye 6 0 0 36 1993* Marcus Allen 12 3 0 90 1994 Marcus Allen 7 0 0 44# 1995 Marcus Allen 5 0 0 30 Steve Bono 5 0 0 30 Willie Davis 0 5 0 30 Tamarick Vanover 0 2 3 30 1996 Marcus Allen 9 0 0 54 1997 Marcus Allen 11 0 0 66 1998 Bam Morris 8 0 0 48 1999 Tony Gonzalez 0 11 0 66 2000 Derrick Alexander 0 10 0 60 2001 Priest Holmes 8 2 0 60
t-Tied for position
Offense Year-By-Year
Bold Denotes Club Record
Italics Denotes NFL Record
Yardages Net *Nine Games #15 Games
61 @CHIEFS 2002* Priest Holmes 21 3 0 144 2003* Priest Holmes 27 0 0 162 2004 Priest Holmes 15 0 0 90 2005 Larry Johnson 21 1 0 126 2006 Larry Johnson 17 2 0 114 2007 Dwayne Bowe 0 5 0 30 Tony Gonzalez 0 5 0 30 2008 Tony Gonzalez 0 10 0 60 2009 Jamaal Charles 7 1 1 56# 2010 Dwayne Bowe 0 15 0 90 2011 Dwayne Bowe 0 5 0 30 2012 Jamaal Charles 5 1 0 36 2013 Jamaal Charles 12 7 0 114 2014 Jamaal Charles 9 5 0 84 2015 Jeremy Maclin 0 8 0 48 2016 Tyreek Hill 3 6 0 54 2017 Kareem Hunt 8 3 0 66 2018 Kareem Hunt 7 7 0 84 Tyreek Hill 1 12 1 84 2019 Tyreek Hill 0 7 0 42 Mecole Hardman 0 6 1 42 Damien Williams 5 2 0 42 2020 Tyreek Hill 2 15 0 102 2021 Travis Kelce 1 9 0 60 2022 Travis Kelce 0 12 0 74# # Includes two-point conversion NFL Ranking by Yardage (Compiled Since 1971) OFFENSE DEFENSE Year Total Rushing Passing Total Rushing Passing 1971 9 12 7 7 3 24 1972 17 16 18t 15 11 18 1973 20 19 19 7 9 4 1974 16 17 15 25 12 25 1975 15 15 12 25 25 20 1976 7 22 1 27 27 24 1977 16 20 12 28 28 14 1978 15 2 27 20 18 17 1979 27 13 28 12 6 22 1980 28 18 27 18 21 10 1981 17 3 25 17 3 23 1982 25 21 21 10 19 10 1983 9 28 3 14 20 10 1984 17 27 7 24 16 23 1985 22 28 11 21 20 20 1986 28 27 21 8 11 12 1987 24 19 26 27 27 22 1988 22 22 16 10 28 1 1989 13 4 21 2 12 2 1990 7 10 9 16 12 17 1991 5 3 14 13 18 16 1992 25 23 20 5 15 2 1993 16 20 15 11 9 14 1994 5 11 7 12 16 10 1995 14 1 25 2 3 5 1996 22 4 26 18 13 22 1997 14 5 24 11 7 16 1998 19 23 16 9 18 7 1999 12 4 22 14 11 16 2000 8 25 5 18 17 20 2001 5 6 5 23 27 14 2002 4 3 11 32 24 31 2003 2 15 2 29 30 20 2004 1 5 4 31 12 32 2005 1 4 6 25 7 30 2006 16 9 22 16 18 18 2007 31 32 20 13 28 5 2008 24 16 20 31 30 28 2009 25 11 25 30 31 22 2010 12 1 30 14 14 17 2011 27 15 25 11 26 6 2012 24 5 32 20 27 12 2013 21 10 24t 24 22 25 2014 25 10 29 7 28 2 2015 27 6 30 7 8 9 2016 20 15 19 24 26 18 2017 5 9 7 28 25 29 2018 1 16 3 31 27 31 2019 6 23 5 17 26 8 2020 1 16 1 16 21 14 2021 3 16 4 27 21 27 2022 1 20 1 11 8 18
Total First Rush Pass Total Total Year Plays Downs Yards Yards Yards Points 1960 918 255 1814 2831 4645 362 1961 838 234 2183 2576 4759 334 1962 840 259 2407 2455 4862 389 1963 872 250 1697 2651 4348 347 1964 871 244 1839 2871 4710 366 1965 833 228 1736 2554 4290 322 1966 846 266 2274 2840 5114 448 1967 872 251 2018 2472 4490 408 1968 831 223 2227 2276 4503 371 1969 899 258 2220 2387 4607 359 1970 770 183 1858 1719 3577 272 1971 836 240 1843 2347 4190 302 1972 894 245 1915 2041 3956 287 1973 863 208 1793 1743 3536 231 1974 901 224 1720 2108 3828 233 1975 933 261 1847 2360 4207 282 1976 959 275 1873 2929 4804 290 1977 878 228 1843 2093 3936 225 1978 1054 287 2986 1834 4820 243 1979 972 241 2316 1660 3976 238 1980 1009 270 1873 2448 4321 319 1981 1057 315 2633 2640 5273 343 1982* 573 163 943 1555 2498 176 1983 1074 314 1254 4341 5595 386 1984 1034 295 1527 3568 5095 314 1985 982 258 1486 3391 4877 317 1986 1003 264 1468 2750 4218 358 1987# 899 265 1799 2619 4418 273 1988 1019 289 1713 3131 4844 254 1989 1017 304 2227 3038 5265 318 1990 975 280 1948 3267 5215 369 1991 1021 322 2217 3104 5321 322 1992 907 246 1532 2792 4324 348 1993 970 300 1655 3180 4835 328 1994 1098 322 1732 3960 5692 319 1995 1059 295 2222 3020 5242 358 1996 1045 312 2009 2890 4899 297 1997 1054 315 2171 2893 5064 375 1998 1012 289 1548 3260 4808 327 1999 1049 282 2082 3239 5321 390 2000 999 321 1465 4149 5614 355 2001 1015 324 2008 3665 5673 320 2002 965 343 2378 3622 6000 467 2003 1003 348 1929 3981 5910 484 2004 1089 398 2289 4406 6695 483 2005 1059 347 2382 3810 6192 403 2006 1004 310 2143 3000 5143 331 2007 1001 255 1248 3181 4429 226 2008 957 273 1810 3129 4939 291 2009 1019 256 1929 2922 4851 294 2010 1063 319 2627 2968 5595 366 2011 1021 277 1893 3080 4973 212 2012 1015 286 2395 2713 5108 211 2013 1029 323 2056 3340 5396 430 2014 962 309 1918 3182 5100 353 2015 955 303 2044 3255 5299 405 2016 990 305 1748 3740 5488 328 2017 935 322 1905 4104 6007 415 2018 996 384 1855 4955 6801 565 2019 976 350 1569 4498 6067 451 2020 1057 397 1799 4854 6653 473 2021 1134 419 1955 4937 6746 480 2022 1094 408 1970 5062 7032 496
Defense Year-By-Year Total First Rush Pass Total Total Year Plays Downs Yards Yards Yards Points 1960 924 253 980 3002 3982 253 1961 844 248 1525 3077 4602 343 1962 848 239 1250 2701 3951 233 1963 856 228 1558 2629 4187 263 1964 856 204 1315 2620 3935 306 1965 847 200 1366 2457 3749 285 1966 873 222 1356 2614 3970 276
CAREER LEADERS
62 @CHIEFS 1967 843 221 1408 2536 3944 254 1968 900 215 1266 2823 4089 170 1969 808 181 1091 2072 3163 177 1970 851 226 1657 2010 3667 244 1971 813 223 1337 2506 3770 208 1972 853 227 1805 2222 4027 254 1973 856 209 1956 1619 3575 192 1974 936 267 1801 2663 4464 293 1975 915 289 2712 2512 5224 341 1976 899 309 2861 2496 5359 376 1977 992 304 2971 2022 4993 349 1978 995 284 2389 2582 4971 327 1979 1088 297 1847 3124 4971 262 1980 1096 328 2206 3109 5315 336 1981 1102 316 1747 3626 5373 290 1982* 556 170 1066 1667 2733 184 1983 1089 319 2275 3111 5386 367 1984 1159 335 1982 3645 5625 324 1985 1126 336 2169 3489 5658 360 1986 1098 310 1739 3195 4934 326 1987# 1045 344 2333 3306 5639 388 1988 1042 318 2592 2434 5026 320 1989 952 253 1766 2527 4293 253 1990 945 268 1640 3241 4881 257 1991 927 275 1770 3228 4998 252 1992 949 256 1767 2537 4324 282 1993 1013 300 1620 3151 4771 291 1994 989 289 1734 3266 5000 298 1995 1047 289 1327 3222 4549 241 1996 1008 296 1666 3538 5204 300 1997 974 278 1621 3259 4880 232 1998 1010 321 1869 2985 4854 363 1999 1033 281 1557 3482 5039 322 2000 1041 330 1809 3417 5280 354 2001 1003 296 2140 3164 5304 344 2002 1081 367 2067 4181 6248 399 2003 1054 322 2344 3363 5707 332 2004 960 327 1834 4203 6037 435 2005 971 292 1570 3679 5249 325 2006 999 298 1928 3334 5262 315 2007 980 278 2089 3022 5111 335 2008 1041 344 2543 3748 6291 440 2009 1062 318 2504 3707 6211 424 2010 1028 293 1764 3519 5283 326 2011 991 291 2112 3221 5333 338 2012 973 301 2171 3533 5704 425 2013 1067 303 1923 3962 5885 305 2014 1024 310 2036 3252 5288 281 2015 1037 313 1571 3698 5269 287 2016 1063 342 1938 3958 5896 304 2017 1044 352 1890 3952 5842 339 2018 1109 419 2114 4374 6488 421 2019 1043 344 2051 3543 5594 308 2020 1022 353 1954 3779 5733 362 2021 1060 363 1999 4273 6272 364 2022 1093 337 1823 3756 5579 369 Bold Denotes Club Record Italics Denotes NFL Record Yardages Net *Nine Games #15 Games Turnovers Year-By-Year TAKEAWAYS GIVEAWAYS Year INTs FUMBLES TOTAL INTs FUMBLES TOTAL RATIO 1960 27 16 43 19 18 37 +6 1961 20 18 38 18 18 37 +2 1962 32 17 49 17 14 31 +18 1963 26 19 45 22 16 38 +7 1964 28 19 47 21 19 40 +7 1965 20 13 33 20 21 41 -8 1966 33 8 41 15 16 31 +10 1967 31 11 42 19 8 27 +15 1968 37 12 49 11 16 27 +22 1969 32 15 47 20 19 39 +8 1970 31 12 43 16 15 31 +12 1971 27 7 34 13 13 26 +8 1972 24 19 43 20 12 32 +11 1973 21 18 39 13 18 31 +8 1974 28 16 44 25 13 38 +6 1975 20 22 42 15 18 33 +9 1976 23 20 43 17 16 33 +10 1977 21 23 44 26 21 47 -3 1978 21 14 35 16 18 34 +1 1979 23 14 37 18 18 36 +1 1980 28 15 43 14 16 30 +13 1981 26 21 47 22 24 46 +1 1982* 12 10 22 8 4 12 +10 1983 30 21 51 19 19 38 +13 1984 30 11 41 22 15 37 +5 1985 27 14 41 23 11 34 +7 1986 31 18 49 18 17 35 +14 1987# 11 17 28 17 24 41 -13 1988 18 13 31 21 12 33 -2 1989 15 18 33 23 18 41 -8 1990 20 25 45 5 14 19 +26 1991 15 18 33 14 8 22 +11 1992 24 15 39 12 9 21 +18 1993 21 17 38 10 18 28 +10 1994 12 26 38 14 12 26 +12 1995 16 17 33 10 11 21 +12 1996 17 10 27 14 10 24 +3 1997 21 13 34 10 10 20 +14 1998 13 20 33 18 14 32 +1 1999 25 20 45 15 9 24 +21 2000 15 14 29 15 11 26 +3 2001 13 13 26 24 9 33 -7 2002 18 13 31 13 2 15 +16 2003 25 12 37 12 6 19 +19 2004 13 8 21 17 10 27 -6 2005 16 15 31 10 13 23 +8 2006 15 15 30 12 14 26 +4 2007 14 8 22 20 13 33 -11 2008 13 16 29 16 8 24 +5 2009 15 13 28 17 10 27 +1 2010 14 9 23 8 6 14 +9 2011 20 6 26 28 18 10 -2 2012 7 6 13 20 17 37 -24 2013 21 15 36 8 10 18 +18 2014 6 8 14 6 11 17 -3 2015 26 8 34 8 9 17 +17 2016 18 15 33 8 8 17 +16 2017 16 10 26 8 3 11 +15 2018 15 12 27 12 6 18 +9 2019 16 7 23 5 10 15 +8 2020 16 6 22 7 9 16 +6 2021 15 14 29 13 12 25 +4 2022 11 9 20 12 11 23 -3 Bold Denotes Club Record Denotes NFL Season Leader * Nine Games #15 Games Note: Chiefs six straight years (1990-95) with a +10 turnover ratio is an NFL record.
Games Played Includes all players with 100 games played Player Games Played 1. Dustin Colquitt (2005-19) 238 2. Will Shields (1993-06) 224 3. Nick Lowery (1980-93) 212 4. Jerrel Wilson (1963-77) 203 5. Tony Gonzalez (1997-08) 190 6. Jan Stenerud (1967-79) 186 7. Len Dawson (1962-75) 183 8. Buck Buchanan (1963-75) 182 Derrick Johnson (2005-17) 182 10. Emmitt Thomas (1966-78) 181 11. Jim Tyrer (1961-73) 180 12. John Alt (1984-96) 179 13. Jack Rudnay (1970-82) 178 14. Ed Budde (1963-76) 177 Tamba Hali (2006-17) 177 16. Derrick Thomas (1989-99) 169 Tim Grunhard (1990-00) 169 18. Bobby Bell (1963-74) 169 19. Henry Marshall (1976-87) 165 20. Johnny Robinson (1960-71) 164 21. Tony Richardson (1995-05) 163 Brian Waters (2000-10) 163 23. Kevin Ross (1984-93, 97) 156 24. Jim Lynch (1967-77) 151 25. Dave Hill (1963-74) 150 Albert Lewis (1983-93) 150 27. Willie Lanier (1967-77) 149 28. Deron Cherry (1981-91) 148
Includes all players with 100 games started, compiled since 1968
63 @CHIEFS 29. Tom Condon (1974-84) 147 30. Lloyd Burruss (1981-91) 145 31. Travis Kelce (2013-22) 144 32. Casey Wiegmann (2001-07, 2010-11) 143 33. Dave Szott (1990-00) 142 34. Jerry Mays (1961-70) 140 35. Rich Baldinger (1983-92) 139 Dave Lutz (1983-92) 139 37. Neil Smith (1988-96) 138 38. Art Still (1978-87) 136 Jonathan Hayes (1985-93) 136 40. Mike Bell (1979-85, 87-91) 135 41. Otis Taylor (1965-75) 130 James Winchester (2015-22) 130 43. Jerome Woods (1996-05) 128 Eric Hicks (1998-06) 128 45. E.J. Holub (1961-70) 127 46. Matt Herkenhoff (1976-85) 125 Stephone Paige (1983-91) 125 Kimble Anders (1991-00) 125 Dan Saleaumua (1989-96) 125 Anthony Sherman (2013-20) 125 51. Gary Spani (1978-86) 124 52. John Browning (1996-05) 121 53. Carlos Carson (1980-89) 120 54. Charlie Getty (1974-82) 119 Jason Dunn (2000-07) 119 56. Fred Arbanas (1962-70) 118 Dave Lindstrom (1978-85) 118 Greg Wesley (2000-07) 118 Dwayne Bowe (2007-14) 118 60. Donnie Edwards (1996-01, 2007-08) 117 Eric Fisher (2013-20) 117 62. Bill Maas (1984-92) 116 63. Jim Kearney (1967-75) 115 Eric Warfield (1998-05) 115 65. Daniel Sorensen (2014-21) 111 66. Tracy Simien (1991-97) 109 67. Sherrill Headrick (1960-67) 108 68. Curtis McClinton (1962-69) 107 Ed Beckman (1977-84) 107 Chris Jones (2016-22) 107 71. Bill Kenney (1980-88) 106 Kendall Gammon (2000-06) 106 73. Thomas Gafford (2008-14) 105 74. Ed Podolak (1969-77) 104 Dale Carter (1992-98) 104 76. Chris Burford (1960-67) 103 Leonard Griffin (1986-93) 103 Jamaal Charles (2008-16) 103 79. Justin Houston (2011-18) 102 Allen Bailey (2011-18) 102 81. Gary Barbaro (1976-82) 101 82. Whitney Paul (1976-81, 86) 100 Gary Green (1977-83) 100
Games Started
Will Shields (1993-06) 223
Tony Gonzalez
174
Jack Rudnay (1970-82) 171 4. Derrick Johnson (2005-17) 169 5. Tim Grunhard (1990-00) 164 6. Len Dawson (1962-75) 158*
Derrick Thomas (1989-99) 157 Tamba Hali (2006-17) 157
John Alt (1984-96) 149 Brian Waters (2000-10) 149
Emmitt Thomas (1966-78) 148** 12. Kevin Ross (1984-93, 97) 144 13. Casey Wiegmann (2001-07, 2010-11) 143 14. Willie Lanier (1967-77) 137** Jim Lynch (1967-77) 137** Travis Kelce (2013-22) 137 17. Dave Szott (1990-00) 136 18. Henry Marshall (1976-87) 135 19. Art Still (1978-81) 133 20. Albert Lewis (1983-93) 128 21. Neil Smith (1988-96) 127 22. Deron Cherry (1981-91) 124 23. Dave Lutz (1983-92) 123 24. Willie Lanier (1967-77) 122 Matt Herkenhoff (1976-85) 122 26. Tom Condon (1974-84) 119 27. Dan Saleaumua (1989-96) 117 28. Eric Fisher (2013-20) 113 29. Jim Kearney (1967-75) 112** 30. Bill Maas (1984-91) 111 Dwayne Bowe (2007-14) 111 32. Buck Buchanan (1963-75) 109** 33. Gary Spani (1978-86) 108 34. Jerome Woods (1996-05) 105 35. Charlie Getty (1974-82) 104 Eric Hicks (1998-06) 104 37. Lloyd Burruss (1981-91) 103 Rich Baldinger (1983-92) 103 Greg Wesley (2000-07) 103 40. Gary Barbaro (1976-82) 101 41. Donnie Edwards (1996-01, 2007-08) 100 Mike Bell (1979-85, 87-91) 100 * Includes all of Dawson s starts dating back to 62. ** Does not include starts prior to 68. Rushing Includes all players with 1,000 rushing yards No. Yds. Avg. TD 1. Jamaal Charles (2008-15) 1320 7,220 5.5 42 2. Priest Holmes (2001-07) 1321 6,070 4.6 76 3. Larry Johnson (2003-09) 1375 6,015 4.4 55 4. Christian Okoye (1987-92) 1246 4,857 3.9 40 5. Ed Podolak (1969-77) 1157 4,451 3.8 34 6. Abner Haynes (1960-64) 792 3,837 4.8 39 7. Marcus Allen (1993-97) 932 3,698 4.0 44 8. Mike Garrett (1966-70) 736 3,246 4.4 23 9. Curtis McClinton (1962-69) 762 3,124 4.1 18 10. Herman Heard (1984-89) 651 2,694 4.1 13 11. Wendell Hayes (1968-74) 668 2,560 3.8 18 12. Greg Hill (1994-97) 588 2,436 4.1 6 13. Ted McKnight (1977-81) 528 2,344 4.4 22 14. Barry Word (1990-92) 527 2,306 4.4 12 15. Kimble Anders (1991-00) 490 2,261 4.6 9 16. Tony Reed (1977-80) 513 2,184 4.3 8 17. Kareem Hunt (2017-18) 453 2,151 4.7 15 18. Donnell Bennett (1994-00) 519 1,902 3.7 17 19. Robert Holmes (1968-71) 390 1,689 4.3 12 20. Alex Smith (2013-17) 317 1,672 5.3 10 21. C.Edwards-Helaire(2020-22) 371 1,622 4.4 11 22. Spencer Ware (2015-19) 337 1,621 4.6 11 23. Tony Richardson (1995-05) 395 1,576 4.0 15 24. Patrick Mahomes (2017-22) 299 1,547 5.2 12 25. Joe Delaney (1981-82) 321 1,501 4.6 3 26. Woody Green (1974-76) 375 1,442 3.8 11 27. Jack Spikes(1960-64) 329 1,392 4.2 12 28. Thomas Jones (2010-11) 398 1,374 3.5 6 Billy Jackson (1981-84) 399 1,365 3.4 16 30. Len Dawson (1962-75) 283 1,253 4.4 9 31. Bert Coan (1963-68) 273 1,249 4.6 15 32. MacArthur Lane (1975-78) 318 1,209 3.8 8 33. Mack Lee Hill (1964-65) 230 1,203 5.2 6 34. Warren McVea (1969-73) 239 1,053 4.4 10 35. James Hadnot (1980-83) 266 1,029 3.9 5 Receptions Includes all players with 100 receptions Player No. Yds. Avg. TD 1. Tony Gonzalez (1997-08) 916 10,940 11.9 76 2. Travis Kelce (2013-22) 814 10,344 12.7 69 3. Dwayne Bowe (2007-14) 532 7,155 13.4 44 4. Tyreek Hill (2016-21) 479 6,630 13.8 56 5. Henry Marshall (1976-87) 416 6,545 15.7 33 6. Otis Taylor (1965-75) 410 7,306 17.8 57 7. Chris Burford (1960-67) 391 5,525 14.1 55 8. Stephone Paige (1983-91) 377 6,341 16.8 49 9. Kimble Anders (1991-00) 369 2,829 7.7 9 10. Carlos Carson (1980-89) 352 6,360 18.1 33 11. Eddie Kennison (2001-07) 321 5,230 16.3 25 12. Ed Podolak (1969-77) 288 2,456 8.5 6 13. Jamaal Charles (2008-15) 283 2,443 8.6 20 14. Priest Holmes (2001-07) 251 2,377 9.5 7 15. Derrick Alexander (1998-01) 213 3,685 17.3 19 16. Abner Haynes (1960-65) 199 2,739 13.8 17 17. Fred Arbanas (1962-70) 198 3,101 15.7 34 18. Todd McNair (1989-93, 96) 186 1,856 10.0 6 19. J.J. Birden (1990-94) 183 2,819 15.4 7
Player Games Started 1.
2.
(1997-08)
3.
7.
9.
11.
64 @CHIEFS 20. Tony Richardson (1995-05) 177 1,298 7.3 9 21. Willie Davis (1991-95) 172 3,014 17.5 20 Dexter McCluster (2010-13) 172 1,500 8.7 5 23. J.T. Smith (1978-84) 167 2,273 13.6 8 24. Walter White (1975-79) 163 2,396 14.7 16 Frank Jackson (1961-65) 163 2,516 15.4 21 26. Curtis McClinton (1960-69) 154 1,945 12.6 14 27. Larry Johnson (2003-09) 151 1,369 9.1 6 Mecole Hardman (2019-22) 151 2,088 13.8 16 29. Emile Harry (1986-92) 149 1,999 13.4 9 Dante Hall (2000-06) 145 1,615 11.1 9 Demarcus Robinson(2016-21) 145 1,679 11.6 14 32. Marcus Allen (1993-97) 141 1,153 8.2 3 Mike Garrett (1966-70) 141 1,231 8.7 7 34. Tony Reed (1977-80) 138 1,382 10.0 2 35. Jonathan Hayes (1985-93) 135 1,541 11.4 12 36. Johnnie Morton (2002-04) 134 1,932 14.4 8 37. Andre Rison (1997-99) 133 1,852 13.9 12 38. Herman Heard (1984-89) 132 1,125 8.5 3 39. Jeremy Maclin (2015-16) 131 1,624 12.4 10 40. MacArthur Lane (1975-78) 130 1,207 9.3 1 Sammy Watkins (2018-20) 129 1,613 12.5 8 42. Albert Wilson (2014-17) 124 1,544 12.5 7 43. Wendell Hayes (1968-74) 116 993 8.6 5 44. Keith Cash (1992-96) 111 1,046 9.4 9 45. Samie Parker (2004-07) 110 1,529 13.9 7 46. Chris Conley (2016-18) 104 1,238 11.9 6 47. Lake Dawson (1994-97) 103 1,406 13.7 10 Receiving Yards Includes all players with 1,000 receiving yards Player Yds. No. Avg. TD 1. Tony Gonzalez (1997-08) 10,940 916 11.9 76 2. Travis Kelce (2013-22) 10,344 814 12.7 69 3. Otis Taylor (1965-75) 7,306 410 17.8 57 4. Dwayne Bowe (2007-14) 7,155 532 13.4 44 5. Tyreek Hill (2016-21) 6,630 479 13.8 56 6. Henry Marshall (1976-87) 6,545 416 15.7 33 7. Carlos Carson (1980-89) 6,360 351 18.1 33 8. Stephone Paige (1983-91) 6,341 377 16.8 49 9. Chris Burford (1960-67) 5,505 391 14.1 55 10. Eddie Kennison (2001-07) 5,230 321 16.3 25 11. Derrick Alexander (1998-01) 3,685 213 17.3 19 12. Fred Arbanas (1962-70) 3,101 198 15.7 34 13. Willie Davis (1991-95) 3,014 172 17.5 20 14. Kimble Anders (1991-00) 2,829 369 7.7 9 15. J.J. Birden (1990-94) 2,819 183 15.4 14 16. Abner Haynes (1960-65) 2,709 197 13.8 17 17. Frank Jackson (1961-65) 2,516 163 15.4 21 18. Ed Podolak (1969-77) 2,456 288 8.5 6 19. Jamaal Charles (2008-15) 2,443 283 8.6 20 20. Walter White (1975-79) 2,396 163 14.7 16 21. Priest Holmes (2000-07) 2,377 251 9.5 7 22. J.T. Smith (1978-84) 2,273 167 3.6 8 23. Mecole Hardman (2019-22) 2,088 151 13.8 16 24. Emile Harry (1986-92) 1,999 149 13.4 9 25. Curtis McClinton (1962-69) 1,945 154 12.6 14 26. Johnnie Morton (2002-04) 1,932 134 14.4 8 27. Todd McNair (1989-93, 96) 1,856 186 10.0 6 28. Andre Rison (1997-99) 1,852 133 13.4 12 29. Larry Brunson (1974-77) 1,723 98 17.6 5 30. Demarcus Robinson (2016-21) 1,679 145 11.6 14 31. Jeremy Maclin (2015-16) 1,624 131 12.4 10 32. Dante Hall (2000-06) 1,615 145 11.1 9 33. Sammy Watkins (2018-20) 1,613 129 12.5 8 34. Albert Wilson (2016-17) 1,544 124 12.5 7 35. Jonathan Hayes (1985-93) 1,541 135 11.4 12 36. Samie Parker (2004-07) 1,529 110 13.9 7 37. Dexter McCluster (2010-13) 1,500 172 8.7 5 38. Frank Pitts (1965-70) 1,450 78 18.6 11 39. Lake Dawson (1994-97) 1,406 103 13.7 10 40. Tony Reed (1977-80) 1,382 138 10.0 2 41. Larry Johnson (2003-09) 1,369 151 9.1 6 42. Gloster Richardson (1967-70) 1,358 62 21.9 12 43. Tony Richardson (1995-05) 1,298 177 7.3 9 44. Anthony Hancock (1982-86) 1,266 73 17.3 5 45. Chris Conley (2016-18) 1,238 104 11.9 6 46. Mike Garrett (1966-70) 1,231 141 8.7 7 47. Johnny Robinson (1960-71) 1,228 77 159 9 48. MacArthur Lane (1975-78) 1,207 130 9.3 1 49. Tim Barnett (1991-93) 1,188 82 14.5 10 50. Kevin Lockett (1997-00) 1,164 87 13.4 4 51. Marcus Allen (1993-97) 1,153 141 8.2 3 52. Herman Heard (1984-89) 1,125 132 8.5 3 53. Robb Thomas (1989-91) 1,098 92 11.9 7 54. Elmo Wright (1971-74) 1,070 66 16.2 6 55. Keith Cash (1992-96) 1,046 111 9.4 9 56. Tony Moeaki (2010-13) 1,009 80 12.6 4 Passing Includes all players with 4,000 passing yards Player Att.Comp. Yds. Pct. TD INT 1. Len Dawson (1962-75) 3,696 2,115 28,507 .572 237178 2. Patrick Mahomes (2017-22) 2,993 1,98524,241.663192 49 3. Trent Green (2001-06) 2,777 1,720 21,459 .619 118 85 4. Alex Smith (2013-17) 2,436 1,587 17,608 .651 102 33 5. Bill Kenney (1979-88) 2,430 1,330 17,277 .547 105 86 6. Steve DeBerg (1988-91) 1,616 934 11,873 .578 67 50 7. Mike Livingston (1968-79) 1,751 912 11,295 .521 56 83 8. Elvis Grbac (1997-00) 1,548 897 10,643 .579 66 47 9. Matt Cassel (2009-12) 1,489 854 9,549 .574 59 44 10. Steve Bono (1994-96) 1,075 594 6,489 .553 37 27 11. Joe Montana (1993-94) 737 480 5,427 .651 29 16 12. Steve Fuller (1979-82) 817 465 5,333 .569 22 32 13. Cotton Davidson (1960-61) 709 330 4,919 .465 32 39 14. Damon Huard (2004-08) 657 404 4,612 .615 24 18 15. Todd Blackledge (1983-87) 742 364 4,510 .491 26 32 16. Dave Krieg (1992-93) 602 335 4,353 .556 22 15 Scoring Includes all players with 100 total points Player TD FG PAT 2Pt. Tot. 1. Nick Lowery (1980-93) 0 329 479 0 1,466 2. Jan Stenerud (1967-79) 0 279 394 0 1,231 3. Harrison Butker (2017-22) 0 164 271 0 763 4. Ryan Succop (2009-13) 0 119 160 0 517 5. Priest Holmes (2001-07) 83 0 0 1 500 6. Tony Gonzalez (1997-08) 76 0 0 3 462 7. Pete Stoyanovich (1996-00) 0 93 163 0 442 Travis Kelce (2013-22) 72 0 0 5 442 9. Tyreek Hill (2016-21) 67 0 0 0 402 10. Cairo Santos (2014-17) 0 89 130 0 392 11. Jamaal Charles (2008-15) 64 0 0 1 386 12. Larry Johnson (2003-09) 61 0 0 0 366 13. Otis Taylor (1965-75) 60 0 0 0 360 14. Abner Haynes (1960-64) 58 0 0 0 348 15. Lawrence Tynes (2004-06) 0 68 137 0 341 16. Chris Burford (1960-67) 55 0 0 1 332 17. Stephone Paige (1983-91) 49 0 0 0 294 18. Tommy Brooker (1962-66) 3 41 149 0 290 19. Marcus Allen (1993-97) 47 0 0 1 284 20. Dwayne Bowe (2007-14) 44 0 0 0 264 21. Ed Podolak (1969-77) 40 0 0 0 240 Christian Okoye (1987-92) 40 0 0 0 240 23. Morten Andersen (2002-03) 0 38 109 0 223 24. Jack Spikes (1960-64) 14 19 69 1 212 25. Lin Elliott (1994-95) 0 49 64 0 211 26. Henry Marshall (1976-86) 35 0 0 0 210 27. Fred Arbanas (1962-70) 34 0 0 1 206 28. Carlos Carson (1980-89) 33 0 0 0 198 29. Curtis McClinton (1962-69) 32 0 0 2 196 30. Mike Garrett (1966-70) 32 0 0 0 192 31. Todd Peterson (2000-01) 0 42 52 0 178 32. Frank Jackson (1961-65) 28 0 0 0 168 33. Eddie Kennison (2001-07) 25 0 0 2 154 34. Kareem Hunt (2017-18) 25 0 0 0 150 35. Tony Richardson (1995-05) 24 0 0 0 144 36. Wendell Hayes (1968-74) 23 0 0 0 138 Ted McKnight (1977-81) 23 0 0 0 138 38. Willie Davis (1991-95) 20 0 0 1 122 Mecole Hardman (2019-22) 20 0 0 1 122 40. Derrick Alexander (1998-01) 20 0 0 0 120 Dante Hall (2000-06) 20 0 0 0 120 42. Bert Coan (1963-68) 19 0 0 0 114 43. Kimble Anders (1991-00) 18 0 0 0 108 Donnell Bennett (1994-00) 18 0 0 0 108 Billy Jackson (1981-84) 18 0 0 0 108 Johnny Robinson (1960-71) 18 0 0 0 108 47. C.Edwards-Helaire(2020-22) 17 0 0 1 104 Touchdowns Includes all players with 20 total touchdowns Player Rec. Rush. Return Total 1. Priest Holmes (2001-07) 7 76 0 83 2. Tony Gonzalez (1997-08) 76 0 0 76 3. Travis Kelce (2013-22) 69 2 1* 72
5. Chris Jones (2016-22)
6. Mike Bell (1979-85, 87-91)
7. Art Still (1978-87)
8. Eric Hicks (1998-06)
9. Jared Allen (2004-07)
10. Bill Maas (1984-92)
11. Wilbur Young (1973-77)
12. Dee Ford (2014-18)
13. Dan Saleaumua (1989-96)
14. John Browning (1996-05)
Johnson (2005-17)
16. Whitney Paul (1976-81, 86)
17. Joe Phillips (1992-97)
Clark (2019-22)
Note: Sacks became recognized as an official statistic in 1982. The Chiefs began recording sacks in 1973.
Tackles Includes all players with 500 tackles 1. Derrick Johnson (2005-17)
LONGEST PLAYS
65 @CHIEFS 4. Tyreek Hill (2016-21) 56 6 5 67 5. Jamaal Charles (2008-14) 20 43 1 64 6. Larry Johnson (2003-09) 6 55 0 61 7. Otis Taylor (1965-75) 57 3 0 60 8. Abner Haynes (1960-64) 17 39 2 58 9. Chris Burford (1960-67) 55 0 0 55 10. Stephone Paige (1983-91) 49 0 0 49 11. Marcus Allen (1993-97) 3 44 0 47 12. Dwayne Bowe (2007-14) 44 0 0 44 13. Ed Podolak (1969-77) 6 34 0 40 Christian Okoye (1987-92) 0 40 0 40 15. Henry Marshall (1976-86) 33 2 0 35 16. Fred Arbanas (1962-70) 34 0 0 34 17. Carlos Carson (1980-89) 33 0 0 33 18. Curtis McClinton (1962-69) 14 18 0 32 Mike Garrett (1966-70) 7 24 1 32 20. Frank Jackson (1961-65) 21 7 0 28 21. Eddie Kennison (2001-07) 25 0 0 25 Kareem Hunt (2017-18) 10 15 0 25 23. Tony Richardson (1995-05) 9 15 0 24 24. Wendell Hayes (1968-74) 5 18 0 23 Ted McKnight (1977-81) 1 22 0 23 26. Willie Davis (1991-95) 20 0 0 20 Derrick Alexander (1998-01) 19 1 0 20 Dante Hall (2000-06) 9 0 11 20 26. Mecole Hardman (2019-22) 16 2 2 20 *Offensive Return Interceptions Includes all players with 15 interceptions Player No. Yds. Avg. TD 1. Emmitt Thomas (1966-78) 58 938 16.2 5 2. Johnny Robinson (1960-71) 57 741 13.0 1 3. Deron Cherry (1981-91) 50 688 13.8 1 4. Gary Barbaro (1976-82) 39 771 19.8 3 5. Albert Lewis (1983-93) 38 329 8.7 0 6. Bobby Hunt (1962-67) 37 674 18.2 2 7. Kevin Ross (1984-93, 97) 30 561 18.7 2 8. Greg Wesley (2000-07) 29 542 18.7 0 9. Willie Lanier (1967-77) 27 440 16.3 2 10. Bobby Bell (1963-74) 26 479 18.4 6 11. Gary Green (1977-83) 24 330 13.8 1 12. Jim Kearney (1967-75) 23 462 20.0 5 13. Lloyd Burruss (1981-91) 22 509 23.1 4 14. Dale Carter (1992-98) 21 183 18.7 1 James Hasty (1995-00) 21 304 14.5 1 16. Duane Wood (1960-64) 20 247 13.4 1 Mike Sensibaugh (1971-75) 20 331 16.6 0 Eric Warfield (1998-05) 20 236 11.8 3 19. Dave Grayson (1961-64) 19 309 16.3 1 Marcus Peters (2015-17) 19 480 25.3 2 21. Jim Lynch (1967-77) 17 191 11.2 1 Eric Harris (1980-82) 17 229 13.5 1 Brandon Flowers (2008-13) 17 344 20.2 3 24. Willie Mitchell (1964-70) 16 302 18.9 3 25. Jerome Woods (1996-05) 15 282 18.8 2 Sacks Includes all players with 20.0 sacks 1. Derrick Thomas (1989-99) 126.5 2. Tamba Hali (2006-17) 89.5 3. Neil Smith (1988-96) 86.5 4. Justin Houston (2011-18) 78.5
65.0
51.0
48.5
44.5
43.0
40.0
35.0
30.5
29.0
27.5 Derrick
27.5
24.0
23.5 Frank
23.5
1,262
1,992
Gary Spani
999 4. Derrick Johnson (2005-18) 934 5. Deron Cherry (1981-91) 927 6. Donnie Edwards (1996-2001, 07-08) 883 7. Kevin Ross (1984-93, 97) 827 8. Derrick Thomas (1989-99) 728 9. Jerome Woods (1996-05) 720 10. Greg Wesley (2000-07) 701 11. Lloyd Burruss (1981-91) 628 12. Dino Hackett (1986-92) 625 13. Tracy Simien (1991-97) 595 14. Eric Hicks (1998-06) 574 15. Marvcus Patton (1999-02) 573 16. Albert Lewis (1983-93) 555 17. Neil Smith (1988-96) 546 Punting Based on Avg.; minimum 200 punts Player No. Yds. Avg. 1. Dustin Colquitt (2005-19) 1,124 50,393 44.83 2. Jerrel Wilson (1963-77) 1,018 44,218 43.44 3. Louie Aguiar (1994-98) 421 17,930 42.59 4. Jim Arnold (1983-85) 284 11,934 42.02 5. Bryan Barker (1990-93) 272 11,267 41.42 6. Bob Grupp (1979-81) 214 8,756 40.92 Punt Returning Player No. Yds. Avg. TD 1. Tyreek Hill (2016-21) 86 1,009 11.7 4 2. Noland Smith (1967-69) 53 589 11.1 1 3. Abner Haynes (1960-64) 54 587 10.9 0 4. Tamarick Vanover (1995-99) 181 1,930 10.7 4 5. J.T. Smith (1979-84) 220 2,322 10.6 4 6. Dante Hall (2000-06) 188 1,882 10.0 5 7. Javier Arenas (2010-12) 105 1,029 9.8 0 Kickoff Returning Based on Avg,; minimum 50 returns Player No. Yds. Avg. TD 1. Noland Smith (1967-69) 68 1,822 26.8 0 2. Dave Grayson (1961-64) 84 2,231 26.6 1 3. Abner Haynes (1960-64) 52 1,309 25.2 1 4. De'Anthony Thomas (2014-19) 58 1,422 24.5 0 5. Jamaal Charles (2008-15) 51 1,246 24.4 1 6. Tamarick Vanover (1995-99) 212 5,099 24.1 4 7. Dante Hall (2000-06) 360 8,644 24.0 6
2. Art Still (1978-89)
3.
(1978-86)
Rushing Player (Opponent, Date) Yards 1. Jamaal Charles (at New Orleans, 9/23/12) 91 (TD) Damien Williams (vs. Minnesota, 11/3/19) 91 (TD) 3. Jamaal Charles (vs. Indianapolis, 12/23/12) 86 (TD) 4. Ted McKnight (at Seattle, 9/30/79) 84 (TD) Damien Williams (vs. LA Chargers, 12/29/19) 84(TD) 6. Joe Delaney (vs. Denver, 10/18/81) 82 (TD) Derrick Alexander (vs. San Diego, 10/31/99) 82 (TD) 8. Abner Hayes (at New York Jets, 11/29/64) 80 (TD) Warren McVea (vs. Cincinnati, 10/26/69) 80 (TD) Jamaal Charles (at St. Louis, 12/19/10) 80 (TD) Jamaal Charles (at Cleveland, 12/9/12) 80 (TD) 12. Tyreek Hill (at NY Jets, 12/3/17) 79 (TD) 13. Mike Garrett (vs. Houston, 10/30/66) 77 (TD) 14. Robert Holmes (at Miami, 9/28/68) 76 (TD) Steve Bono (at Arizona, 10/1/95) 76 (TD) Jamaal Charles (vs. Buffalo, 12/13/09) 76 (TD) 17. Jack Spikes (vs. San Diego, 9/10/61) 74 (TD) 18. Abner Haynes (vs. Buffalo, 9/30/62) 71 (TD) 19. Thomas Jones (vs. Jacksonville, 10/24/10) 70 (TD) Tyreek Hill (vs. Denver, 12/25/16) 70 (TD) Alex Smith (at NY Jets, 12/3/17) 70 (TD) Passing Player (Opponent, Date) Yards 1. *Trent Green - Marc Boerigter (vs. San Diego, 12/22/02) 99 (TD) 2. **Mike Livingston - Otis Taylor (vs. Miami, 10/19/69) 93 (TD) 3. Len Dawson - Tommy Brooker (at Denver, 11/18/62) 92 (TD) 4. Len Dawson - Gloster Richardson (at Oakland, 11/3/68) 90 (TD) Len Dawson - Frank Pitts (vs. Boston, 11/17/68) 90 (TD) Steve DeBerg - J.J. Birden (vs. San Diego, 11/18/90) 90 (TD) 7. Patrick Mahomes - Demarcus Robinson (vs. Oakland, 12/30/18) 89 (TD) 8. Len Dawson - Otis Taylor (vs. Miami, 11/13/66) 89 (TD) 9. Steve DeBerg - Stephone Paige (at New England, 12/2/90) 86 (TD) Elvis Grbac - Derrick Alexander (at Chicago, 9/12/99) 86 (TD)
66 @CHIEFS 11. Len Dawson - Larry Brunson (vs. San Diego, 11/10/74) 84 (TD) Bill Kenney - Stephone Paige (vs. San Diego, 12/22/85) 84 (TD) 13. Steve DeBerg - Stephone Paige (at Denver, 9/17/90) 83 (TD) Patrick Mahomes - Mecole Hardman (vs. Baltimore, 9/22/19) 83 (TD) 15. Len Dawson - Frank Jackson (vs. N.Y. Jets, 12/22/63) 82 (TD) Len Dawson - Otis Taylor (vs. Pittsburgh, 10/18/71) 82 (TD) 17. Len Dawson - Frank Jackson (at Denver, 9/7/63) 81 (TD) Bill Kenney - Carlos Carson (vs. Seattle, 12/27/87) 81 (TD) Elvis Grbac - Derrick Alexander (vs. San Diego, 10/31/99) 81 (TD) Elvis Grbac - Derrick Alexander (at New England, 12/4/00) 81 (TD) 21. Steve DeBerg - Carlos Carson (at N.Y. Jets, 10/2/88) 80 (TD) Rich Gannon - Andre Rison (vs. Seattle, 10/4/98) 80 (TD) Alex Smith - Travis Kelce (vs. Denver, 12/25/16) 80 (TD) Alex Smith- Charcandrick West (vs. Broncos, 11/15/15) 80 (TD) *Tied NFL record **Taylor accounted for 79 yards, then lateralled to Robert Holmes for 14 yards. Interception Returns Player (Opponent, Date) Yards 1. Gary Barbaro (vs. Seattle, 12/11/77) 102 (TD) 2. Tim Collier (at Oakland, 12/18/77) 100 (TD) Sean Smith (at Buffalo, 11/3/13) 100 (TD) 4. Dave Grayson (vs. New York Titans, 12/17/61) 99 (TD) Kevin Ross (at San Diego, 9/6/92) 99 (TD) Jaylen Watson (vs. Los Angeles Chargers, 9/15/22) 99 (TD) 7. Andy Studebaker (vs. Pittsburgh, 11/22/09) 94 (TD) 8. Brandon Flowers (at New York Jets, 10/26/08) 91 (TD) 9. Mark McMillian (at San Diego, 12/14/97) 87 (TD) 10. Lloyd Burruss (Los Angeles Raiders, 10/28/91) 83 (TD) 11. David Webster (vs. Oakland, 10/9/60) 80 (TD) 12. Jerome Woods (at Green Bay, 10/12/03) 79 (TD) Fumble Returns Player (Opponent, Date) Yards 1. Chris Martin (vs. Miami, 10/31/91) 101 (TD) 2. Bashaud Breeland (at Detroit, 9/29/19) 100 (TD) 3. Gary Spani (at Oakland, 10/25/81) 91 (TD) 4. Derrick Thomas (at Seattle, 12/5/93) 86 (TD) Nick Bolton (at Denver, 1/8/22) 86 (TD) 6. James Hasty (vs. Oakland, 9/8/96) 80 (TD) 7. Sammy Knight (vs. Washington, 10/16/05) 80 (TD) 8. Donnie Edwards (at Chicago, 9/12/99) 79 (TD) 9. Maurice Leggett (at Oakland, 11/30/08) 67 (TD) 10. Thomas Howard (at Pittsburgh, 9/6/81) 65 (TD) 11. Jerry Mays (vs. N.Y. Jets, 12/22/63) 58 (TD) 12. Tyron Brackenridge (at San Diego, 9/30/07) 50 (TD) 13. Whitey Paul (vs. Denver, 10/18/81) 47 (TD) 14. Johnny Robinson (at Baltimore, 9/28/70) 46 (TD) Punt Returns Player (Opponent, Date) Yards 1. Tyreek Hill (vs. San Diego, 1/1/17) 95 (TD) 2. Dexter McCluster (vs. San Diego, 9/13/10) 94 (TD) 3. Dante Hall (vs. Denver, 10/5/03) 93 (TD) 4. Tyreek Hill (at LA Chargers, 9/9/18) 91 (TD) 5. Dante Hall (vs. Arizona, 12/1/02) 90 (TD) 6. J.T. Smith (vs. Oakland, 9/23/79) 88 (TD) 7. Dale Carter (at Seattle, 11/22/92) 86 (TD) Tamarick Vanover (vs. San Diego, 10/9/95) 86 (TD) Dante Hall (vs. St. Louis, 12/8/02) 86 (TD) 10. *Jitter Fields (vs. Denver, 10/18/87) 85 (TD) 11. Tamarick Vanover (vs. Oakland, 1/2/00) 84 (TD) 12. Tamarick Vanover (vs. Buffalo, 9/14/97) 82 (TD) 13. Noland Smith (vs. New York Jets, 9/15/68) 80 (TD) Tamarick Vanover (at Denver, 12/5/99) 80 (TD) * Replacement game Kickoff Returns Player (Opponent, Date) Yards 1. Knile Davis (vs. Denver, (12/1/13) 108 (TD) 2. Noland Smith (at Denver, 12/17/67) 106 (TD) 3. Mecole Hardman (vs. LA Chargers, 12/29/19) 104 (TD) 4. Byron Pringle (at Denver, 10/25/20) 102 (TD) 5. Dante Hall (vs. Pittsburgh, 9/14/03) 100 (TD) 6. Dave Grayson (at Denver, 9/7/63) 99 (TD) Tamarick Vanover (at Seattle, 9/3/95) 99 (TD) Knile Davis (vs. St. Louis, 10/26/14) 99 (TD) 9. Boyce Green (at Pittsburgh, 12/21/86) 97 (TD) Tamarick Vanover (at Denver, 10/27/96) 97 (TD) Dante Hall (at Baltimore, 9/28/03) 97 (TD) Dante Hall (vs. Denver, 12/19/04) 97 (TD) Jamaal Charles (vs. Pittsburgh, 11/22/09) 97 (TD) Tremon Smith (at New England, 10/14/18) 97 (TD) 15. Dante Hall (vs. San Diego, 11/28/04) 96 (TD) Dante Hall (vs. Philadelphia, 10/2/05) 96 (TD) 17. Paul Palmer (vs. San Diego, 9/13/87) 95 (TD) Punts Player (Opponent, Date) Yards 1. Dustin Colquitt (vs. San Diego 12/2/07) 78 2. Dustin Colquitt (at Denver 12/31/17) 77 3. Dan Stryzinski (vs. Oakland, 9/9/01) 76 Tommy Townsend (at Denver, 12/12/22) 76 5. Bob Grupp (vs. San Diego, 11/4/79) 74 Tommy Townsend (Los Angeles Chargers, 9/15/22) 74 6. Dustin Colquitt (vs. Oakland, 9/14/08) 73 7. Jerrel Wilson (at San Diego, 9/29/63) 72 Dustin Colquitt (at Oakland, 12/23/06) 72 Dustin Colquitt (at St. Louis, 12/19/10) 72 10. Dustin Colquitt (at Oakland, 12/23/12) 71 11. Jerrel Wilson (at Denver, 10/11/64) 70 Jerrel Wilson (vs. Buffalo, 10/18/64) 70 Jerrel Wilson (vs. Houston, 11/28/68) 70 Dustin Colquitt (at Jacksonville, 11/8/09) 70 Field Goals Player (Opponent, Date) Yards 1. Harrison Butker (vs. Buffalo, 10/16/22) 62 2. Matthew Wright (vs. Las Vegas, 10/10/22) 59 3. Harrison Butker (at Los Angeles Chargers, 9/20/20) 58 Harrison Butker (at Los Angeles Chargers, 9/20/20) 58 Nick Lowery (at Washington, 9/18/83) 58 Nick Lowery (vs. Los Angeles Raiders, 9/12/85) 58 7. Nick Lowery (vs. Seattle, 9/14/80) 57 8. Harrison Butker (at Chicago, 12/22/19) 56 Harrison Butker (vs. Denver, 12/5/21) 56 10. Harrison Butker (vs. Carolina, 11/8/20) 55 Harrison Butker (vs. Green Bay, 11/7/21) 55 Jan Stenerud (at Denver, 10/4/70) 55 13. Harrison Butker (at Seattle, 12/23/18) 54 Harrison Butker (vs. Minnesota, 11/3/19) 54 Harrison Butker (vs. Buffalo, 10/10/21) 54 Harrison Butker (vs. Las Vegas, 12/12/21) 54 Harrison Butker (at Arizona, 9/11/22) 54 Jan Stenerud (at Houston, 9/9/67) 54 Jan Stenerud (at Denver, 10/5/69) 54 Jan Stenerud (at San Francisco, 12/6/71) 54 Nick Lowery (vs. Los Angeles Raiders, 11/6/83) 54 Nick Lowery (at Detroit, 11/26/87) 54 Pete Stoyanovich (vs. Denver, 11/16/97) 54 Ryan Succop (vs. Minnesota, 10/2/11) 54 Cairo Santos (at Houston, 9/18/16) 54 26. Harrison Butker (at Oakland, 10/19/17) 53 Harrison Butker (vs. Oakland, 12/10/17) 53 Harrison Butker (vs. Atlanta, 12/27/20) 53 Harrison Butker (vs. Dallas, 11/21/21) 53 Pete Stoyanovich (at Seattle, 11/8/98) 53 Lawrence Tynes (vs. San Diego, 10/22/06) 53 Ryan Succop (at Baltimore, 9/13/09) 53 Ryan Succop (at St. Louis, 12/19/10) 53 Ryan Succop (vs. New York Jets, 12/11/11) 53 Cairo Santos (at San Diego, 10/19/14) 53 36. Harrison Butker (at Washington, 10/17/21) 52 Harrison Butker (at Los Angeles Chargers, 11/20/22) 52 Jan Stenerud (at Miami, 9/28/68) 52 Jan Stenerud (vs. Cincinnati, 10/13/68) 52 Jan Stenerud (vs. Buffalo, 12/7/69) 52 Jan Stenerud (at Washington, 10/10/76) 52 Nick Lowery (vs. Detroit, 10/26/80) 52 Nick Lowery (vs. Oakland, 10/11/81) 52 Nick Lowery (at Cincinnati, 9/9/84) 52 Nick Lowery (at New York Giants, 11/25/84) 52 Nick Lowery (at New Orleans, 9/8/85) 52 Nick Lowery (at New Orleans, 9/8/85) 52 Nick Lowery (at Detroit, 11/26/87) 52 Nick Lowery (at Houston, 9/20/92) 52 Eddie Murray (vs. Pittsburgh, 10/25/92) 52 Nick Lowery (vs. Denver, 9/20/93) 52 Pete Stoyanovich (at St. Louis, 10/26/97) 52 Lawrence Tynes (at Miami, 10/21/05) 52 Lawrence Tynes (at San Diego, 12/17/06) 52 Ryan Succop (vs. Oakland, 10/28/12) 52 Ryan Succop (vs. Carolina, 12/2/12) 52 57. Harrison Butker (vs. Denver, 10/30/17) 51 Harrison Butker (vs. Los Angeles Chargers, 12/16/17) 51 Harrison Butker (at Denver, 1/8/22) 51 Ben Agajanian (vs. Buffalo, 11/12/61) 51
BIG YARDAGE DAYS
67 @CHIEFS Jan Stenerud (at Dallas, 11/10/75) 51 Nick Lowery (at Houston, 10/9/88) 51 Nick Lowery (at New York Giants, 12/11/88) 51 Pete Stoyanovich (vs. Detroit, 9/26/99) 51 Todd Peterson (vs. Denver, 12/16/01) 51 Lawrence Tynes (at Miami 10/21/05) 51 Ryan Succop (vs. Minnesota, 10/2/11) 51 Cairo Santos (vs. Jacksonville, 11/6/16) 51 69. Harrison Butker (at Oakland, 12/2/18) 50 Harrison Butker (vs. Oakland, 12/1/19) 50 Mike Mercer (vs. San Diego, 11/6/66) 50 Jan Stenerud (vs. Oakland, 11/23/67) 50 Jan Stenerud (at San Diego, 10/29/72) 50 Jan Stenerud (vs. Oakland, 12/8/74) 50 Nick Lowery (vs. Seattle, 9/14/80) 50 Nick Lowery (at Pittsburgh, 12/14/80) 50 Nick Lowery (vs. Denver, 9/18/88) 50 Nick Lowery (at Pittsburgh, 10/29/89) 50 Pete Stoyanovich (at San Diego, 11/22/98) 50 Morten Andersen (vs. Miami, 9/29/02) 50 Lawrence Tynes (at Denver, 9/12/04) 50 Lawrence Tynes (at San Diego, 1/2/05) 50 Ryan Succop (at Oakland, 11/15/09) 50
Rushing Includes all players with 150 rushing yards Player (Opponent, Date) 1. Jamaal Charles (at Denver, 1/3/10) 259 2. Jamaal Charles (at New Orleans, 9/23/12) 233 3. Jamaal Charles (vs. Indianapolis, 12/23/12) 226 4. Larry Johnson (at Houston, 11/20/05) 211 5. Larry Johnson (vs. Cincinnati, 1/1/06) 201 6. Barry Word (vs. Detroit, 10/14/90) 200 7. Larry Johnson (vs. Denver, 9/28/08) 198 8. Priest Holmes (at Seattle, 11/24/02) 197 9. Joe Delaney (vs. Houston, 11/15/81) 193 10. Mike Garrett (vs. New York Jets, 11/5/67) 192 11. Derrick Blaylock (at New Orleans, 11/14/04) 186 12. Priest Holmes (at San Diego, 11/4/01) 181 13. Priest Holmes (at New England, 9/22/02) 180 14. Jamaal Charles (vs. Buffalo, 10/31/10) 177 15. Jamaal Charles (at Seattle, 11/28/10) 174 16. Larry Johnson (at St. Louis, 11/5/06) 172 Kareem Hunt(at LA Chargers, 9/24/17) 172 18. Christian Okoye (vs. Dallas, 10/22/89) 170 19. Mike Garrett (at Denver, 12/17/67) 169 20. Priest Holmes (at Oakland, 12/9/01) 168 21. Larry Johnson (at New York Giants, 12/17/05) 167 22. Jamaal Charles (at Cleveland, 12/9/12) 165 23. Abner Hayes (vs. Buffalo, 9/30/62) 164 24. Priest Holmes (at San Diego, 11/30/03) 162 25. Mike Garrett (at San Diego, 12/18/66) 161 Priest Holmes (at Denver, 12/15/02) 161 Clyde Edwards-Helaire (at Buffalo 10/19/20) 161 28. Jamaal Charles (vs. Seattle 11/16/14) 159 29. Abner Hayes (vs. Oakland, 11/26/61) 158 Robert Holmes (at Cincinnati, 11/10/68) 158 31. Abner Hayes (at New York Titans, 11/24/60) 157 Larry Johnson (vs. Denver, 11/23/06) 157 33. Abner Hayes (at Houston, 11/22/64) 156 Christian Okoye (at Seattle, 11/1/89) 156 Tony Richardson (vs. Denver, 12/17/00) 156 36. Larry Johnson (vs. Seattle, 10/29/06) 155 Kareem Hunt (vs. LA Chargers, 12/16/17 155 38. Larry Johnson (vs. Oakland, 11/19/06) 154 Jamaal Charles (vs. Cleveland, 12/20/09) 154 40. Priest Holmes (at New York Jets, 10/6/02) 152 Passing Includes all players with 350 passing yards Player (Opponent, Date) 1. Elvis Grbac (at Oakland, 11/5/00) 504 2. Patrick Mahomes (at LA Rams, 11/19/18) 478 3. Matt Cassel (at Denver, 11/14/10) 469 4. Patrick Mahomes (at Tampa Bay, 11/29/20) 462 5. Patrick Mahomes (at Tennessee, 11/10/19) 446 Patrick Mahomes (vs. Tennessee, 11/6/22) 446 7. Patrick Mahomes (at Oakland, 9/15/19) 443 8. Len Dawson (vs. Denver, 11/1/64) 435 9. Patrick Mahomes (at San Francisco, 10/23/22) 423 10. Patrick Mahomes (vs. New York Jets, 11/1/20) 416 11. Bill Kenney (at San Diego, 12/11/83) 411 12. Patrick Mahomes (at Los Angeles, 12/16/21) 410 13. Patrick Mahomes (at Las Vegas, 11/14/21) 406 14. Trent Green (at Green Bay, 10/12/03) 400 15. Bill Kenney (at New Orleans, 9/8/85) 397 Trent Green (at Denver, 12/7/03) 397 Patrick Mahomes (at Washington, 10/17/21) 397 18. Steve DeBerg (at Denver, 9/17/90) 395 19. Joe Montana (at Denver, 10/17/94) 393 Patrick Mahomes (at Miami, 12/13/20) 393 21. Trent Green (vs. Indianapolis, 10/31/04) 389 22. Patrick Mahomes (at Baltimore, 9/28/20) 385 23. Mike Livingston (vs. Miami, 10/19/69) 381 Len Dawson (vs. San Diego, 11/10/74) 381 Trent Green (vs. New England, 11/22/04) 381 26. Patrick Mahomes (at Jacksonville, 9/8/19) 378 27. Patrick Mahomes (vs. Baltimore, 12/9/18) 377 28. Patrick Mahomes (at Cleveland, 11/4/18) 375 29. Patrick Mahomes (vs. Baltimore, 9/22/19) 374 30. Trent Green (at San Diego, 1/2/05) 373 31. Patrick Mahomes (vs. Carolina, 11/8/20) 372 32. Trent Green (at Tampa Bay, 11/7/04) 369 33. Trent Green (vs. Cleveland, 11/9/03) 368 Alex Smith (at New England, 9/7/17) 368 35. Alex Smith (at NY Jets) 12/3/17) 366 36. Bill Kenney (at Denver, 10/30/83) 365 37. Alex Smith (vs. San Diego, 9/11/16) 363 38. Len Dawson (at San Diego, 10/15/67) 364 39. Joe Montana (at Atlanta, 9/18/94) 361 40. Patrick Mahomes (at Arizona, 9/11/22) 360 41. Patrick Mahomes (vs. Cincinnati, 10/21/18) 358 Trent Green (vs. Oakland, 12/25/04) 358 43. Len Dawson (at Buffalo, 12/12/65) 356 44. Patrick Mahomes (at New England, 10/14/18) 352 Patrick Mahomes (at Denver, 12/11/22) 352 Trent Green (at Arizona, 10/21/01) 352 47. Elvis Grbac (at New England, 12/4/00) 350 Receiving Includes all players with 150 receiving yards Player (Opponent, Date) 1. Stephone Paige 8 rec. (vs. San Diego, 12/22/85) 309 2. Tyreek Hill - 13 rec. (at Tampa Bay, 11/29/20) 269 3. Tyreek Hill - 10 rec. (at LA Rams, 11/19/18) 215 4. Curtis McClinton 5 rec. (vs. Denver, 12/19/65) 213 5. Stephone Paige 10 rec. (at Denver, 9/17/90) 206 6. Sammy Watkins 9 rec. (at Jacksonville, 9/8/19) 198 7. Tyreek Hill - 11 rec. (vs. Cleveland, 9/12/21) 197 Carlos Carson 9 rec. (at San Diego, 10/25/87) 197 9. Travis Kelce - 10 rec. (at Los Angeles Chargers, 12/16/21)191 10. Otis Taylor 6 rec. (vs. Pittsburgh, 10/18/71) 190 11. J.J. Birden 8 rec. (at Raiders, 12/22/91) 188 12. Otis Taylor 5 rec. (vs. Houston, 10/30/66) 187 13. Dwayne Bowe 13 rec. (at Denver, 11/14/10) 186 Tyreek Hill - 11 rec. (at Philadelphia, 10/3/21) 186 15. Tyreek Hill - 6 rec. (at NY Jets, 12/3/17) 185 16. Larry Brunson 8 rec. (vs. San Diego, 11/10/74) 184 17. Henry Marshall 9 rec. (at Baltimore, 12/21/80) 176 18. Frank Jackson 10 rec. (at New York Jets, 11/29/64) 175 19. Carlos Carson 8 rec. (at New Orleans, 9/8/85) 173 Derrick Alexander 5 rec. (at San Diego, 11/22/98) 173 21. Demarcus Robinson 6 rec. (at Oakland, 9/15/19) 172 22. Chris Burford 10 rec. (at Boston, 10/12/62) 171 23. Dwayne Bowe 13 rec. (at Seattle, 11/28/10) 170 24. Tyreek Hill - 7 rec (at LA Chargers, 9/9/18) 169 25. Travis Kelce - 12 rec (at Oakland, 12/2/18) 168 26. Willie Davis 5 rec. (vs. Philadelphia, 10/11/92) 167 27. Henry Marshall 8 rec. (vs. Seattle, 12/9/84) 166 28. Carlos Carson 7 rec. (vs. San Diego, 10/14/84) 165 Carlos Carson 7 rec. (at San Diego, 12/11/84) 165 30. Dwayne Bowe 8 rec. (at San Diego, 9/30/07) 164 31. Stephone Paige 7 rec. (at Pittsburgh, 10/9/89) 163 32. Carlos Carson 5 rec. (at New York Jets, 10/2/88) 162 Andre Rison 8 rec. (at Oakland, 9/8/97) 162 34. Jeremy Maclin - 9 rec. (vs. Buffalo, 11/29/15) 160 Travis Kelce - 11 rec (vs. Denver, 12/15/16) 160 36. Emile Harry 11 rec. (at Cleveland, 11/24/91) 159 Travis Kelce - 10 rec (vs. Carolina, 11/8/20) 159 38. Tyreek Hill - 11 rec (at Tennessee, 11/10/19) 157
Game-Winning Field Goals
Of the 47 game-winning field goals in franchise annals, the biggest was a 25-yard kick by K Tommy Brooker that ended the second-longest game in pro football history. Brooker s FG concluded the 1962 AFL Championship Game with an elapsed time of 77:54 as the Dallas Texans claimed a 20-17 win at Houston (12/13/62). Brooker received a celebratory postgame escort off the field from TE Fred Arbanas (#84) and DB Bobby Hunt (#20). Among the nine other kickers to hit a game-winning kick for Kansas City, K Nick Lowery booted a team-record 14 game-winning FGs, while K Harrison Butker owns the longest kick to ever win a game for the Chiefs, a 58-yard effort at the Los Angeles Chargers (9/20/20), which occurred after making a 53-yard FG that was nullified by a false start, and after making a 58-yard FG that was nullified by a Chargers timeout prior to the attempt.
THROUGH 2022, WEEK 18
Chiefs Record When Producing...
*AFL Championship Game
CHIEFS RECORD WHEN...
Chiefs Record When Allowing...
68 @CHIEFS 39. Chris Burford 10 rec. (at Boston, 9/25/66) 155 Willie Davis 6 rec. (at Seattle, 9/3/95) 155 41. Derrick Alexander 6 rec. (at Chicago, 9/12/99) 154 42. Carlos Carson 5 rec. (at New York Giants, 11/25/84) 153 Derrick Alexander 5 rec. (vs. Seattle, 10/2/00) 153 Dwayne Bowe 6 rec. (vs. Tennessee, 12/26/10) 153
Eddie Kennison 7 rec. (vs. Cincinnati 1/1/06) 151
45.
Date Opp. Kicker Length Final Score 10/21/62 NYT Brooker 42 20-17 12/23/62 @ HOU Brooker 25 20-17 2 OT* 12/7/69 BUF Stenerud 25 22-19 12/12/71 OAK Stenerud 10 16-14 9/25/72 @ NO Stenerud 22 20-17 10/7/73 DEN Stenerud 39 16-14 10/19/75 @ SD Stenerud 27 12-10 11/23/75 DET Stenerud 26 24-21 OT 10/17/76 @ MIA Stenerud 34 20-17 OT 12/9/79 @ BALT Stenerud 43 10-7 10/26/80 DET Lowery 40 20-17 10/23/83 @ HOU Lowery 41 13-10 OT 12/2/84 DEN Lowery 42 16-13 9/28/86 @ BUF Lowery 46 20-17 11/2/86 @ SD Lowery 37 24-23 11/13/88 CIN Lowery 39 31-28 11/20/88 SEA Lowery 40 27-24 12/24/89 @ MIA Lowery 41 27-24 12/4/90 RAI Lowery 41 9-7 12/23/90 @ SD Lowery 32 24-21 12/8/91 SD Lowery 18 20-17 OT 11/8/92 SD Lowery 36 16-14 10/10/93 CIN Lowery 37 17-15 1/8/94 PIT Lowery 32 27-24 OT 9/10/95 NYG Elliott 23 20-17 OT 9/28/97 SEA Stoyanovich 41 20-17 OT 11/16/97 DEN Stoyanovich 54 24-22 11/28/99 @ OAK Stoyanovich 44 37-34 12/12/99 MIN Stoyanovich 38 31-28 12/10/00 CAR Peterson 33 15-14 12/16/01 DEN Peterson 32 26-23 OT 9/8/02 @ CLE Andersen 30 40-39 12/22/02 SD Husted 38 24-22 11/23/03 OAK Andersen 35 27-24 12/25/04 OAK Tynes 38 31-30 10/8/06 @ ARZ Tynes 19 23-20 10/22/06 SD Tynes 53 30-27 11/22/09 PIT Succop 22 27-24 OT 10/31/10 BUF Succop 35 13-10 OT 10/23/11 SD Succop 30 23-20 OT 9/23/12 @ NO Succop 31 27-24 OT 10/19/17 @ SD Santos 48 23-20 11/13/16 @ CAR Santos 37 20-17 11/27/16 @ DEN Santos 34 30-27 OT 12/31/17 @ DEN Butker 30 27-24 11/3/19 MIN Butker 44 26-23 9/20/20 @ LAC Butker 58 23-20 OT
Chiefs Record When... Regular Season 521-433-12 (.546 Preseason: 139-120-3 (.536) Postseason: 20-21-0 (.488) Regular Season Only: In overtime: 21-21-2 (.500) In Primetime: 78-45-0 Home: 299-176-4 (.628) Cotton Bowl: 15-6-0 (.714) Municipal Stadium: 44-16-3 (.722) GEHA Field at Arrowhead Stadium: 240-156-1 (.606) Wembley Stadium: 1-0 (1.000) Away: 221-255-8 (.465) vs. AFC: 326-307-5 (.515)* vs. AFC West: 240-181-3 (.570)* vs. NFC: 107-78-2 (.578)* * Since 1970 Chiefs Record When... Regular Season: 206-164 Preseason: 32-52 Postseason: 9-10 (Regular Season Only) Home: 115-70 Away: 91-94 vs. AFC: 150-126 vs. AFC West: 85-57 vs. NFC: 56-38 Outdoors: 190-152 Indoors: 16-12 On grass: 183-131 On artificial turf: 24-34 Playing in season openers: 12-11 Playing in season finales: 13-10 Playing in September: 43-34 Playing in October: 53-38 Playing in November: 44-45 Playing in December: 58-42 Playing in January: 8-5 Scoring fewer than 10 points: 1-32 Scoring 10 points or more: 205-131 Scoring 20 points or more: 179-62 Scoring 30 points or more: 99-22 Allowing 10 points or less: 57-2 Allowing 20 points or less: 136-46 Allowing 30 points or less: 194-101 Allowing more than 30 points: 16-68 Scoring first: 132-60 Scoring on first drive: 100-46 Opponent scores on first drive: 65-65 Outcome three points or less: 40-46 Outcome seven points or less: 96-87 Playing in overtime: 13-13 Leading at half: 149-38 Trailing at half: 46-108 Tied at half: 11-18 Leading after three quarters: 160-29 Trailing after three quarters: 34-118 Tied after three quarters: 12-17 Positive turnover margin: 125-38 Negative turnover margin: 39-87 Even turnover margin: 42-39
1960-22 2013-22 1960-22 Record Record Two or More 100-Yard Receiver 148-106-5 (.581) 47-15-0 (.758) 18-13-0 (.581) 100-Yard Rusher 145-55-3 (.722) 21-5-0 (.808) 5-1-0 (.833) 300-Yard Passer 73-59-2 (.552) 38-11-0 (.776) 0-0-0 (.000)
1960-22 2013-22 1960-22 Record Record Two or More 100-Yard Receiver 128-131-5 (.494) 28-24-0 (.538) 8-10-1 (.447) 100-Yard Rusher 58-138-4 (.300) 19-15-0 (.559) 0-8-0 (.000) 300-Yard Passer 50-64-1 (.439) 16-17-0 (.485) 0-0-0 (.000)
Pass Receivers (14)
POSTSEASON SUPERLATIVES
Note: The Chiefs have registered 17 postseason games in franchise history with at least one 100-yard receiver. In games with at least one 100-yard receiver, the Chiefs are 9-8-0 (.529).
Kansas City has three postseason games with two or more 100-yard receivers in franchise history. They are 2-1-0 (.667) in those games.
Career Postseason 100-Yard Receiving Games
POSTSEASON ALLTIME MISCELLANEOUS SCORES
Note: The Chiefs have registered five postseason games with a 100-yard rusher in franchise history. The team is 3-2 (.600) all-time in postseason games with a 100yard rusher. The club has never had two or more 100-yard rushers in a postseason game in franchise history.
Career 100-Yard Rushing Games
Notes: The Chiefs are 1-1 (.500) in games when producing a defensive score (TD or safety) in the postseason.
All-Time
Note: The Chiefs have recorded six postseason games with an individual 300-yard passer. The club is 4-2 (.667) all-time in postseason games with a 300-yard passer.
Career 300-Yard Passing Games
POSTSEASON OPPONENT SUPERLATIVES
Notes: The Chiefs are 1-2 (.333) in games when producing a special teams score (TD or safety) in the postseason.
THE CHIEFS HAVE PRODUCED ONE POSTSEASON SHUTOUT. KANSAS CITY HAS BEEN SHUTOUT ONLY ONCE IN THE POSTSEASON.
69 @CHIEFS
100-Yard Receivers (20) Date Opponent Player Rec. Yds. Avg. LG TD Result 1. 12/22/68 @ Oakland Otis Taylor 4 117 29.3 55 0 L,6-41 2. 12/25/71 Miami Ed Podolak 8 110 13.8 29 1 L,24-27 (2OT) 3. 12/25/71 Miami Elmo Wright 3 104 34.7 63 0 4. 1/5/91 @ Miami Stephone Paige 8 142 17.8 33 1 L,16-17 5. 12/31/94 @ Miami Kimble Anders 6 103 17.2 57t 1 L,17-27 6. 1/4/98 Denver Andre Rison 8 110 13.8 34 0 L,10-14 7. 1/4/14 @ Indianapolis Dwayne Bowe 8 150 18.8 63 1 L,44-45 8. 1/9/16 @ Houston Travis Kelce 8 128 16.0 48 0 W,30-0 9. 1/12/19 Indianapolis Travis Kelce 7 108 15.4 30 0 W,31-13 10. 1/20/19 New England Sammy Watkins 4 114 28.5 54 0 L,31-37 OT 11. 1/12/20 Houston Travis Kelce 10 134 13.4 28 3 W,51-31 12. 1/19/20 Tennessee Sammy Watkins 7 114 16.3 60t 1 W, 35-24 13. 2/2/20 San Francisco Tyreek Hill 9 105 11.7 44 0 W,31-20 14. 1/17/21 Cleveland Tyreek Hill 8 110 13.8 26 0 W,22-17 15. 1/17/21 Cleveland Travis Kelce 8 109 13.6 24 1 16. 1/24/21 Buffalo Tyreek Hill 9 172 19.1 71 0 W,38-24 17. 1/24/21 Buffalo Travis Kelce 13 118 9.1 17 2 18. 2/7/21 @ Tampa Bay Travis Kelce 10 133 12.3 33 0 L,9-31 19. 1/16/22 Pittsburgh Travis Kelce 5 108 21.6 48t 1 W,42-21 20. 1/29/22 Cincinnati M. ValdesScantling 6 116 19.3 29 1 W,23-20
Player 100-Yard Games 1. Travis Kelce (2013-21) 7 2. Tyreek Hill (2016-21) 3 3. Sammy Watkins (2018-20) 2 100-Yard Rushers (5) Date Opponent Player Att. Yds. Avg. LG TD Result 1. 12/25/71 Miami Wendell Hayes 22 100 4.6 16 0 L,24-27 (2OT) 2. 12/28/91 L.A. Raiders Barry Word 33 130 3.9 23 0 W,10-6 3. 1/11/04 Indianapolis Priest Holmes 24 176 7.3 48 2 L,31-38 4. 1/12/19 Indianapolis Damien Williams 25 129 5.2 24 1 W,31-13 5. 2/2/20 San Francisco Damien Williams 17 104 6.1 38t 1 W,31-20
Player 100-Yard Games 1. Damien Williams (2018-19) 2 2t. Wendell Hayes (1968-74) 1 Barry Word (1990-92) 1 Priest Holmes (2001-07) 1 300-Yard Passers (6) Date Opponent Player Att. Comp. Yds. LG TD INT Result 1. 12/31/94 Miami Joe Montana 37 26 314 57t 2 1 L,17-27 2. 1/4/14 @ Indianapolis Alex Smith 46 30 378 79t 4 0 L,44-45 3. 1/12/20 Houston P.Mahomes 35 23 321 48 5 0 W,51-31 4. 1/24/21 Buffalo P.Mahomes 38 29 325 71 3 0 W,38-24 5. 1/16/22 Pittsburgh P.Mahomes 39 30 404 48t 5 1 W,42-21 6. 1/29/23 Cincinnati P.Mahomes 43 29 326 29 2 0 W,23-20
Player Games Record 1. Patrick Mahomes (2017-22) 4 4-0 (1.000) 2t. Joe Montana (1993-94) 1 0-1 (.000) Alex Smith (2013-17) 1 0-1 (.000)
100-Yard
Date Opponent Player Rec.Yds.Avg.LGTD Result 1. 1/1/67 @ Buffalo Bobby Burnett 6 127 21.2 42 0 W,31-7 2. 1/15/67 @ Green Bay Max McGee 7 138 19.737t 2 L,10-35 3. 1/11/70 Minnesota John Henderson 7 111 15.9 28 0 W,23-7 4. 12/25/71 Miami Paul Warfield 7 140 20.0 35 0 L,24-27 (2OT) 5. 1/5/92 @ Buffalo Andre Reed 4 100 25.053t 2 L,14-37 6. 1/6/07 @ Indianapolis Dallas Clark 9 103 11.4 21 0 L,8-23 7. 1/9/11 Baltimore Todd Heap 10 108 10.8 21 0 L,7-30 8. 1/4/14 @ Indianapolis T.Y. Hilton 13 224 17.264t 2 L,44-45 9. 1/16/16 @ New England Julian Edelman 10 100 10.0 14 0 L,20-27 10. 1/15/17 Pittsburgh Antonio Brown 6 108 18.0 52 0 L,16-18 11. 1/12/20 Houston DeAndre Hopkins 9 118 13.1 38 0 W,51-31 12. 1/23/22 Buffalo Gabriel Davis 8 201 25.175t 4 W,42-36 (OT) 13. 1/30/22 Cincinnati Tee Higgins 6 103 17.2 44 0 L,24-27 (OT) 14. 2/12/23 @ Philadelphia DeVonta Smith 7 100 14.3 45 0 W,38-35 100-Yard Rushers (11) Date Opponent Player Att.Yds.Avg.LGTD Result 1. 12/28/86 @ N.Y. Jets Freeman McNeil 31 135 4.4 24 1 L,15-35 2. 12/28/91 L.A. Raiders Nick Bell 20 107 5.4 19 0 W,10-6 3. 1/5/92 @ Buffalo Thurman Thomas 22 100 4.5 19 0 L,14-37 4. 1/2/93 @ San Diego Marion Butts 15 119 7.9 54t 1 L,0-17 5. 1/23/94 @ Buffalo Thurman Thomas 33 186 5.6 33 3 L,13-30 6. 1/4/98 Denver Terrell Davis 25 101 4.0 41 2 L,10-14 7. 1/11/04 Indianapolis Edgerrin James 26 125 4.8 18 2 L,31-38 8. 1/6/07 @ Indianapolis Joseph Addai 25 122 4.9 14 1 L,8-23 9. 1/15/17 Pittsburgh Le'Veon Bell 30 170 5.7 38 0 L,16-18 10. 1/6/18 Tennessee Derrick Henry 23 156 6.8 35t 1 L,21-22 11. 1/20/19 New England Sony Michel 29 113 3.9 11 2 L,31-37 (OT) 300-Yard Passers Date Opponent Player Att.Comp.Yds.LGTDINT Result 1. 12/22/68 @ Oakland Daryle Lamonica 39 19 347 54t 5 0 L,6-41 2. 1/16/94 @ Houston Warren Moon 43 32 306 30 1 1 W,28-20 3. 1/11/04 Indianapolis Peyton Manning 30 22 304 38 3 0 L,31-38 4. 1/4/14 @ Indianapolis Andrew Luck 45 29 443 64t 4 3 L,44-45 5. 1/16/16 @ New England Tom Brady 42 28 302 42 2 0 L,20-27 6. 1/20/19 New England Tom Brady 46 30 348 30 1 2 L,31-37 (OT) 7. 1/12/20 Houston Deshaun Watson 52 31 388 54t 2 0 W,51-31 8. 1/23/22 Buffalo Josh Allen 37 27 329 75t 4 0 W,42-36 (OT) 9. 2/12/23 @ Philadelphia Jalen Hurts 38 27 304 45t 1 0 W,38-35
All-Time Defensive Scores Date Opponent Defensive Score Result 12/28/86 @ NY Jets Safety, NYJ P Dave Jennings rushes out of end zone L,15-35 2/12/23 Philadelphi a Nick Bolton, 36-yard fumble return W,38-35
Special Teams Scores Date Opponent Special Teams Score Result 12/28/86 @ NY Jets Albert Lewis, blocked punt recovery in end zone L, 15-35 1/11/04 Indianapolis Dante Hall, 92-yard kickoff return L, 31-38 1/9/16 @ Houston Knile Davis, 106-yard kickoff return W, 30-0
Shutouts Date Opponent Score 1/9/16 @ Houston 30-0 All-Time Opponent Shutouts Date Opponent Score 1/2/93 @ San Diego Chargers 0-17 All-Time Two-Point Conversions Date Opponent Two-Point Play Result 1/6/07 @ Ind. Kris Wilson pass from Trent Green L,8-23 Year-By-Year Two-Point Conversions/Attempts 2006 1/1 2016 0/1 Total Conversions 1 Total Attempts 2
All-Time
POSTSEASON CAREER LEADERS
POSTSEASON LONGEST PLAYS
70 @CHIEFS Conversion Pct. .500
Games Played Player Games Played 1t. Travis Kelce (2013-22) 18 James Winchester (2015-22) 18 3t. Daniel Sorensen (2014-21) 15 Harrison Butker (2017-22) 15 Chris Jones (2016-22) 15 6t. Patrick Mahomes (2017-22) 14 Derrick Nnadi (2018-22) 14 8t. Tyreek Hill (2016-21) 13 Demarcus Robinson (2016-21) 13 Anthony Sherman (2013-20) 13 11t. Dustin Colquitt (2005-19) 12 Nick Allegretti (2019-22) 12 Frank Clark (2019-22) 12 14t. Eric Fisher (2013-20) 11 Anthony Hitchens (2018-21) 11 Ben Niemann (2018-21) 11 Charvarius Ward (2018-21) 11 Andrew Wylie (2017-22) 11 19t. John Alt (1984-96) 10 Tim Grunhard (1990-00) 10 Dave Szott (1990-00) 10 Derrick Thomas (1989-99) 10 Mecole Hardman (2019-22) 10 Marcus Kemp (2017-22) 10 Rushing All players with more than 200 postseason rushing yards Player No. Yds. Avg. TD 1. Marcus Allen (1993-97) 100 386 3.9 3 2. Patrick Mahomes (2017-22) 67 384 5.7 5 3. Damien Williams (2018-19) 81 355 4.4 6 4. Wendell Hayes (1968-74) 51 208 4.1 1 Receptions Player No. Yds. Avg. TD 1. Travis Kelce (2013-22) 133 1,548 11.6 16 2. Tyreek Hill (2016-21) 84 1,081 12.9 5 3t. J.J. Birden (1990-94) 27 363 13.4 2 Otis Taylor (1965-75) 27 481 17.8 2 5. Sammy Watkins (2018-20) 25 477 19.1 1 6. Mecole Hardman (2019-22) 22 226 10.3 2 7t. Keith Cash (1992-96) 21 266 12.7 1 Damien Williams (2018-19) 21 185 8.8 4 Receiving Yards All players with more than 200 postseason receptions Player Yds. No. Avg. TD 1. Travis Kelce (2013-22) 1,548 133 11.6 16 2. Tyreek Hill (2016-21) 1,081 84 12.9 5 3. Otis Taylor (1965-75) 481 27 17.8 2 4. Sammy Watkins (2018-20) 477 25 19.1 1 5. J.J. Birden (1990-94) 363 27 13.4 2 6. Keith Cash (1992-96) 266 21 12.7 1 7. Willie Davis (1991-95) 239 16 14.9 1 8. Mecole Hardman (2019-22) 226 22 10.3 2 9. Demarcus Robinson (2016-21) 220 14 15.7 1 Passing Player Att.Comp. Yds. Pct.TDINT 1. Patrick Mahomes (2017-22) 523 352 4,084.67335 7 2. Len Dawson (1962-75) 188 107 1,497 .569 7 8 3. Alex Smith (2013-17) 185 120 1,250 .649 9 2 4. Joe Montana (1993-94) 141 85 1,014 .603 6 4 Scoring All players iwth 20 or more postseason points Player TD FG PAT Total 1. Harrison Butker (2017-22) 0 21 54 117 2. Travis Kelce (2013-22) 16 0 0 96 3. Damien Williams(2018-19) 10 0 0 60 4. Nick Lowery (1980-93) 0 8 13 37 5. Tyreek Hill (2016-21) 6 0 0 36 6. Jan Stenerud (1967-79) 0 9 8 35 7. Patrick Mahomes (2017-22) 5 0 0 30 8. Cairo Santos (2014-17) 0 6 6 24 Touchdowns All players with 3 or more postseason touchdowns Player Rec. Rush. Return Total 1. Travis Kelce (2013-22) 16 0 0 16 2. Damien Williams (2018-19) 4 6 0 10 3. Tyreek Hill (2016-21) 5 1 0 6 4. Patrick Mahomes (2017-22) 0 5 0 5 5t. Marcus Allen (1993-97) 0 3 0 3 Knile Davis (2013-16) 1 1 1 3 Mike Garrett(1966-70) 0 3 0 3 Mecole Hardman (2019-22) 2 1 0 3 Byron Pringle (2018-21) 3 0 0 3 Interceptions Player No. Yds. Avg. TD 1. Emmitt Thomas (1966-78) 5 101 20.2 0 2. Johnny Robinson (1960-71) 4 131 32.8 0 3t. Deron Cherry (1981-91) 3 47 15.7 0 Jim Marsalis (1969-75) 3 65 21.7 0 5t. Husain Abdullah(2013-15) 2 5 2.5 0 Eric Berry (2010-18) 2 0 0.0 0 Eric Everett (1991) 2 38 19.0 0 Willie Lanier (1967-77) 2 26 13.0 0 Ty Law (2006-07) 2 43 21.5 0 Lonnie Marts (1991-93) 2 19 9.5 0 Marcus Peters (2015-17) 2 30 15.0 0 Jaylen Watson (2022) 2 11 5.5 0 Sacks 1. Frank Clark (2019-22) 10.5 2t. Neil Smith (1988-96) 6.5 Derrick Thomas (1989-99) 6.5 4. Justin Houston (2011-18) 4.0 5t. Tanoh Kpassagnon (2017-20) 3.0 Albert Lewis (1983-93) 3.0 7t. Allen Bailey (2011-18) 2.0 Martin Bayless (1992-93, 95-96) 2.0 Tamba Hali (2006-17) 2.0 Melvin Ingram (2021) 2.0 Joe Phillips (1992-97) 2.0 L'Jarius Sneed (2020-22) 2.0 Bennie Thompson (1992-93) 2.0 Chris Jones (2016-22) 2.0 Tackles All players with 40 or more postseason tackles 1. Daniel Sorensen (2014-21) 77 2. Anthony Hitchens (2018-21) 62 3. L'Jarius Sneed (2020-22) 58 4. Charvarius Ward (2018-21) 54 5. Eric Berry (2010-18) 42 6. Nick Bolton (2021-22) 41 7t. Derrick Johnson (2005-17) 40 Tyrann Mathieu (2019-21) 40 Punting All players with 10 or more postseason punts; Sorted by average Player No. Yds. Avg. 1. Dustin Colquitt (2005-19) 43 1,938 45.1 2. Tommy Townsend (2020-22) 24 1,038 43.3 3. Jerrel Wilson (1963-77) 39 1,693 43.4 4. Bryan Barker (1990-93) 38 1,613 42.4 5. Louie Aguiar (1994-98) 11 459 41.7 Punt Returning All players with 10 or more postseason punt returns; Sorted by average Player No. Yds. Avg. TD 1. Mike Garrett (1966-70) 11 73 6.6 0 2. Tyreek Hill (2016-21) 12 40 3.3 0 Kickoff Returning All players with 10 or more postseason kickoff returns;Sorted by average Player No. Yds. Avg. TD 1. Dante Hall (2000-06) 10 266 26.6 1 2. Byron Pringle (2018-21) 10 243 24.3 0 3. Mecole Hardman (2019-22) 14 312 22.3 0 4. John Stephens (1993) 10 199 19.9 0
Rushing Player (Opponent, Date) Yards 1. Mecole Hardman (vs. Buffalo, 1/24/21) 50 2. Priest Holmes (vs. Indianapolis, 1/11/04) 48 3. Jamaal Charles (vs. Baltimore, 1/9/11) 41 (TD) 4. Isiah Pacheco (vs. Jacksonville, 1/21/23) 39 5. Damien Williams (vs. San Francisco, 2/2/20) 38 (TD) 6. Tyreek Hill (vs. Indianapolis, 1/12/19) 36 (TD)
POSTSEASON BIG YARDAGE DAYS
Passing
Includes all players with 350 passing yards Player (Opponent, Date) Yards
Receiving Includes all players with 150 receiving yards Player
CHIEFS POSTSEASON RECORD WHEN...
ALL-TIME, THROUGH SUPER BOWL LVII
Chiefs Postseason Record When Producing...
Chiefs Postseason Record When Allowing...
71 @CHIEFS 7. Patrick Mahomes (vs. Buffalo, 1/23/22) 34 8. Patrick Mahomes (vs. Tennessee, 1/19/20) 27 (TD) 9. Clyde Edwards-Helaire (at Tampa Bay, 2/7/21) 26 Patrick Mahomes (vs. Philadelphia, 2/12/23) 26 Passing Player (Opponent, Date) Yards 1. Alex Smith - Donnie Avery (at Indianapolis, 1/4/14) 79 (TD) 2. Patrick Mahomes - Tyreek Hill (vs. Buffalo, 1/24/21) 71 3. Patrick Mahomes - Tyreek Hill (vs. Buffalo, 1/23/22) 64 (TD) 4. Alex Smith - Dwayne Bowe (at Indianapolis, 1/4/14) 63 5. Patrick Mahomes - Sammy Watkins (vs. Ten., 1/19/20) 60 (TD) 6. Joe Montana - Kimble Anders (at Miami, 12/31/94) 57 (TD) 7. Patrick Mahomes - Sammy Watkins (vs. NE, 1/20/19) 54 8. Elvis Grbac - Joe Horn (vs. Denver, 1/4/98) 50 Interception Return Player (Opponent, Date) Yards 1. Ty Law (at Indianapolis, 1/6/07) 43 2. Rashad Fenton (vs. Buffalo, 1/24/21) 30 3. Deron Cherry (vs. L.A. Raiders, 12/28/91) 29 4. Marcus Peters (vs. Tennessee, 1/6/18) 28 5. Daniel Sorensen (vs. New England, 1/20/19) 24 6. Eric Everett (vs. L.A. Raiders, 12/28/91) 23 7. Josh Mauga (at Houston, 1/9/16) 20 Fumble Return Player (Opponent, Date) Yards 1. Nick Bolton (vs. Philadelphia, 2/12/23) 36 (TD) 2. Darwin Thompson (vs. Houston, 1/23/20) 18 3. Justin Houston (at Indianapolis, 1/4/14) 7 4. Johnny Robinson (vs. Minnesota, 1/11/70) 2 Punt Return Player (Opponent, Date) Yards 1. Kadarius Toney (vs. Philadelphia, 2/12/23) 65 2. Mecole Hardman (vs. Pittsburgh, 1/16/22) 48 3. Tyreek Hill (vs. Buffalo, 1/23/22) 45 Kickoff Return Player (Opponent, Date) Yards 1. Knile Davis (at Houston, 1/9/16) 106 (TD) 2. Dante Hall (vs. Indianapolis, 1/11/04) 92 (TD) 3. Mecole Hardman (vs. Houston, 1/12/20) 58 Punt Player (Opponent, Date) Yards 1. Dustin Colquitt (at Indianapolis, 1/6/07) 66 2. Louie Aguiar (vs. Denver, 1/4/98) 62 3. Jerrel Wilson (at Green Bay, 1/15/67) 61 4. Tommy Townsend (vs. Jacksonville, 1/21/23) 60 5. Dustin Colquitt (vs. New England, 1/20/19) 59 Jerrel Wilson (vs. Minnesoa, 1/11/70) 59 7. Jerrel Wilson (at Oakland, 12/22/68) 58 8. Tommy Townsend (vs. Cincinnati, 1/30/22) 57 9. Dustin Colquitt (at Houston, 1/9/16) 56 Jerrel Wilson (at Oakland, 1/4/70) 56 Field Goal Player (Opponent, Date) Yards 1. Harrison Butker (at Tampa Bay, 2/7/21) 52 2. Harrison Butker (vs, Cleveland, 1/17/21) 50 Harrison Butker (vs, Jacksonville, 1/21/23) 50 Harrison Butker (vs, Jacksonville, 1/21/23) 50 5. Harrison Butker (at Buffalo, 1/23/22) 49 Cairo Santos (at Houston, 1/9/16) 49 7. Cairo Santos (vs. Pittsburgh, 1/15/17) 48 Jan Stenerud (vs. Minnesota, 1/11/70) 48 9. Harrison Butker (vs. Buffalo, 1/24/21) 45 Harrison Butker (vs. Cincinnati, 1/29/23) 45
Rushing Includes all players with 150 rushing yards Player (Opponent, Date) Yards 1. Preist Holmes(vs. Indianapolis, 1/11/04) 176
Patrick Mahomes (vs. Pittsburgh, 1/16/22) 404
Patrick Mahomes (vs. Buffalo, 1/23/22) 378 Alex Smith (at Indianapolis, 1/4/14) 378
(Opponent,
Yards 1. Tyreek Hill- 9 rec. (vs. Buffalo, 1/24/21) 172 2t. Dwayne Bowe - 8 rec. (at Indianapolis, 1/4/14) 150 Tyreek Hill - 11 rec. (vs. Buffalo, 1/23/22) 150
1.
2t.
Date)
Chiefs Postseason Record When... Postseason: 20-21-0 (.488) In Overtime 2-2 (.500) In Wild Card Games*: 4-8 (.333) In Divisional Games*: 6-7 (.462) In Championship Games: 3-3 (.500) In Super Bowls: 3-2 (.600) * Since 1970 Home: 11-9 (.550) Cotton Bowl: 0-0 (.000) Municipal Stadium: 0-1 (.000) GEHA Field at Arrowhead Stadium: 11-8 (.579) Away: 6-10 (.375) Neutral Site 3-2 (.600) Chiefs Postseason Record When... Postseason: 20-21 Home: 11-9 Away: 6-10 Neutral Site 3-2 Outdoors: 19-19 Indoors: 1-2 On grass: 16-15 On artificial turf: 4-6 Scoring fewer than 10 points: 0-6 Scoring 10 points or more: 20-14 Scoring 20 points or more: 17-6 Scoring 30 points or more: 10-3 Allowing 10 points or less: 6-1 Allowing 20 points or less: 12-5 Allowing 30 points or less: 17-13 Allowing more than 30 points: 3-8 Scoring first: 9-9 Scoring on first drive: 8-9 Opponent scores on first drive: 10-8 Outcome three points or less: 4-7 Outcome seven points or less: 9-11 Playing in overtime: 3-3 Leading at half: 13-4 Trailing at half: 3-14 Tied at half: 4-3 Leading after three quarters: 16-4 Trailing after three quarters: 4-15 Tied after three quarters: 0-2 Positive turnover margin: 10-5 Negative turnover margin: 2-14 Even turnover margin: 8-2
1960-22 1960-22 Record Two or More 100-Yard Receiver 9-8 (.529) 2-1 (.667) 100-Yard Rusher 3-2 (.600) 0-0 (.000) 300-Yard Passer 4-2 (.667) 0-0 (.000)
1960-22 1960-22 Record Two or More 100-Yard Receiver 4-10 (.286) 0-0 (.000) 100-Yard Rusher 1-10 (.091) 0-0 (.000) 300-Yard Passer 4-5 (.444) 0-0 (.000)