
Comparative chloroplast genome analyses of diverse Phoebe (Lauraceae) species endemic to China provide insight into their phylogeographical origin
- Published
- Accepted
- Received
- Academic Editor
- Diaa Abd El-Moneim
- Subject Areas
- Bioinformatics, Genomics, Molecular Biology, Plant Science, Forestry
- Keywords
- Phoebe, Chloroplast genome, Comparative analysis, Phylogeny, Phylogeographical origin, Conservation
- Copyright
- © 2023 Shi et al.
- Licence
- This is an open access article distributed under the terms of the Creative Commons Attribution License, which permits unrestricted use, distribution, reproduction and adaptation in any medium and for any purpose provided that it is properly attributed. For attribution, the original author(s), title, publication source (PeerJ) and either DOI or URL of the article must be cited.
- Cite this article
- 2023. Comparative chloroplast genome analyses of diverse Phoebe (Lauraceae) species endemic to China provide insight into their phylogeographical origin. PeerJ 11:e14573 https://doi.org/10.7717/peerj.14573
Abstract
The genus Phoebe (Lauraceae) includes about 90 evergreen tree species that are an ideal source of timber. Habitat destruction and deforestation have resulted in most of them being endemic to China. The accurate identification of endangered Phoebe species in China is necessary for their conservation. Chloroplast genome sequences can play an important role in species identification. In this study, comparative chloroplast genome analyses were conducted on diverse Phoebe species that are primarily distributed in China. Despite the conserved nature of chloroplast genomes, we detected some highly divergent intergenic regions (petA–psbE, ndhF–rpl32, and psbM–trnD-GUC) as well as three highly divergent genes (rbcL, ycf1, and ycf2) that have potential applications in phylogenetics and evolutionary analysis. The phylogenetic analysis indicated that various Phoebe species in China were divided into three clades. The complete chloroplast genome was better suited for phylogenetic analysis of Phoebe species. In addition, based on the phylogeographical analysis of Phoebe species in China, we inferred that the Phoebe species in China first originated in Yunnan and then spread to other southern areas of the Yangtze River. The results of this research will add to existing case studies on the phylogenetic analysis of Phoebe species and have the potential to contribute to the conservation of Phoebe species that are in danger of extinction.
Introduction
The genus Phoebe (Lauraceae) includes nearly 90 species primarily distributed in Asia (Song et al., 2017a), and about 34 species and three varieties are endemic to China and occur in the Yangtze River Valley and its surrounding southern areas (Chen et al., 2020b). In China, Phoebe wood is known for its excellent material for use in fine architecture, furniture, and carvings (Li et al., 2017). Owing to habitat destruction and deforestation, the majority of surviving populations consist of fewer than 70 individuals (Chen et al., 2020a; Xiao et al., 2020). Over the years, cultivating, developing, utilizing, and conserving these valuable tree species have been difficult (Gao et al., 2016). It is now more crucial than ever to protect Phoebe species in China. Before creating conservation and management strategies, the appropriate management authorities must correctly identify the species (Liu et al., 2018; Liu et al., 2021). Traditional taxonomy requires a detailed analysis of the morphological characteristics of the species, which necessitates accurate identification by taxonomists. When identifying large sample sizes or morphologically conservative taxa, traditional taxonomy is vulnerable to human error (Sheth & Thaker, 2017). The complete chloroplast genome could be used in species identification as an adjunct to traditional taxonomy (Wu et al., 2021).
Chloroplast genome sequences can provide important genetic information for conservation studies (Deng et al., 2019). A rising amount of research points to the complete chloroplast genome as a useful tool for learning about the phylogenetic and evolutionary background of plants (Song et al., 2022a; Song et al., 2022c). With the development of high-throughput sequencing technology, a large number of chloroplast genome sequences have been deposited in the National Center for Biotechnology Information (NCBI) databases, which provide important source data for chloroplast genome studies (Chen et al., 2017). Although chloroplast genomes are relatively conserved in structure, they are also subject to gene loss, mutation, and pseudogenization (Henriquez et al., 2020). These divergences can be employed for species identification and phylogenetic analysis to enhance the present understanding of the phylogenetic and evolutionary relationships of plants (Song et al., 2017b). The complete chloroplast genome sequence, in contrast to variable markers, is rich in genetic variation and has a potent ability to distinguish between closely related species (Chen et al., 2018; Krawczyk et al., 2018; Jiao et al., 2019).
Interest in biogeographic study has developed as a result of the current biodiversity problem and the urgent need to manage biodiversity (Schluter & Pennell, 2017; Médail & Baumel, 2018). In the recent years, a number of research have surfaced that analyze and comprehend plant diversity using biogeographic methodologies and then use those methods to conserve related species (Médail & Baumel, 2018; Bobo-Pinilla et al., 2022). In addition, it has been found that phylogeography is a useful tool for obtaining an accurate representation of the history and evolution of a species (Yang et al., 2019; Wang et al., 2021c). Chloroplast genomes have been used in certain research for phylogeography (Zhao, Pan & Zhang, 2019; Wang et al., 2021c). A more effective conservation approach for the species in question can be provided by tracing the origin and dispersal of species, particularly rare, endangered, and endemic plants (Duan et al., 2020; Bobo-Pinilla et al., 2022).
To date, phylogenetic analyses of Phoebe taxa in China are only based on highly variable markers. In the meanwhile, the published studies on Phoebe species have not yet performed phylogenetic analyses based on the complete chloroplast genome, and the comparative analyses of the species were rare. Additionally, the origin of Phoebe species in China has not been identified (Li et al., 2017; Song et al., 2017a). The aims of the present study were: (a) to characterize the chloroplast genomes of various Phoebe species in China; (b) to explore the divergences in the chloroplast genomes of various Phoebe species in China and identify highly variable regions; and (c) to reconstruct the phylogenetic relationships of various Phoebe species in China and to trace their phylogeographical origin. To determine the characteristics and divergence of the genus Phoebe in China, we chose nine Phoebe species for comparative analysis in accordance with the geographical differentiation and economic relevance of Phoebe species. Among these species, P. hunanensis is a representative Phoebe species native to Hunan Province and the Yangtze River Basin (Yang et al., 2022). P. tavoyana and P. puwenensis are valuable tropical timber trees found primarily in Yunnan province (Omar et al., 2020; Zhang, Li & Wang, 2020). Southwestern China is the primary distribution region for P. neurantha, P. omeiensis, and P. zhennan (Song et al., 2017a; Xiao et al., 2020; Wang et al., 2021a). In southeastern China, P. bournei, P. chekiangensis, and P. sheareri are all widely distributed (Li et al., 2017; Song et al., 2017a). Due to their excellent wood material, these Phoebe species all have significant economic significance. To investigate the phylogenetic relationships of the genus Phoebe, we constructed phylogenetic trees using all Phoebe species from the NCBI database.
Materials & Methods
Sample collections, DNA extraction from samples, and sequencing
We collected samples of two Phoebe species from the main area of their distribution. The fresh leaves of P. hunanensis were collected in Xiangxi Prefecture, Hunan Province, China (27°43′N, 110°22′E). Some young leaf blades of P. hunanensis were reddish purple adaxially. The fresh leaves of P. tavoyana were collected in Kunming City, Yunnan Province, China (24°23′N, 102°10′E). The leaf blades of P. tavoyana were lanceolate or elliptic-lanceolate, with a caudate-acuminate apex. The interval distance for proper specimen collection was taken into account when collecting each of the same species. Five representative individuals were selected for each species. All samples were identified by the author, Prof. Chao Shi. All plant materials were collected in accordance with all current laws and regulations, and the collection was approved by the local government. The voucher samples were stored at Qingdao University of Science and Technology (Chao Shi, chsh1111@aliyun.com) under the specimen codes PL202114 and PL202115. A modified high salt method previously reported (Shi et al., 2012) was used to extract chloroplast DNA from about 30 g of fresh mature leaf samples of two Phoebe species. Both the quantity and quality of the extracted DNA were assessed by spectrophotometry, while the integrity was assessed by 1% (w/v) agarose gel electrophoresis (Green & Sambrook, 2019). DNA of high quality was delivered to Novogene (Beijing, China) for genomic library construction and sequencing with the Illumina HiSeq platform (Illumina, San Diego, CA, USA). About 4.8 Gb of high quality, 2 × 150 bp paired-end raw reads were obtained and were used to assemble the complete chloroplast genomes of these two Phoebe species.
Chloroplast genome de novo assembly and annotation
We used Trimmomatic v0.39 software (Bolger, Lohse & Usadel, 2014) to preprocess the acquired raw data, which included removing adapter sequences and additional sequences that were introduced during the sequencing process, eliminating low quality reads and reads with long stretches of N bases, and so on. FASTQC v0.11.9 (Brown, Pirrung & Mccue, 2017) and MULTIQC v1.12 software (Ewels et al., 2016) were used to assess the quality of newly produced clean short reads. The data were screened to retain reads of high quality with mean Phred scores greater than 35. Chloroplast-like (cp) reads were separated from clean reads by BLAST v2.6.0 (Johnson et al., 2008) based on comparison with a reference genome (Phoebe neurantha, NC_039620). Assembled short reads were de novo spliced into long contigs using SOAPdenovo v2.04 (Luo et al., 2012) with k-mer values set to 35, 44, 71, and 101. Geneious v 8.1 (Kearse et al., 2012) was used to complete the long-contigs sequence expansion and for gap filling. Then, tRNAscan-SE v1.21 (Schattner, Brooks & Lowe, 2005) was used to detect tRNA genes with the default settings, and RNAmmer v.1.2 (Lagesen et al., 2007) was used to validate rRNA genes again using the default settings. The chloroplast genome was annotated by GeSeq v1.42 (Tillich et al., 2017), while Sequin v16.0 (Lehwark & Greiner, 2018) was used to manually correct codons and gene boundaries. The circular chloroplast genomic map of Phoebe was drawn using Chloroplot v0.2.4 (Zheng et al., 2020). The two de novo assembled Phoebe chloroplast genomes were deposited in GenBank under accession numbers MZ442606 and MZ442607.
Chloroplast genome structural analysis
The perl script MISA v2.1 (Beier et al., 2017) was applied to detect chloroplast genomic simple sequence repeats (SSRs), and the basic repeat settings for SSRs were determined to be nine for mononucleotides, four for dinucleotides, and three for trinucleotides, tetranucleotides, pentanucleotides, and hexanucleotides. The REPuter v2 (Kurtz et al., 2001) was employed to analyze forward (F), palindromic (P), reverse (R), and complement (C) repeats with a minimum repeat size of 20 bp and a maximum repeat size of 300 bp. Relative synonymous codon usage (RSCU) and codon usage frequency in the sequences of protein-coding genes were calculated by MEGA-X (Kumar et al., 2018). The heat map of the RSCU analysis was created using the R package of the heatmap. MAFFT v725 was applied to the protein-coding genes. The non-synonymous substitution rate (Ka)/ synonymous substitution rate (Ks) values of each Phoebe species were calculated with P. neurantha (NC_039620) as a reference sequence using KaKs_Calculator v2 (Wang et al., 2010).
Genome comparison
The basic features of the chloroplast genomes of Phoebe species were compared and analyzed with Geneious v8.1, including the measurement of sequence length in each region, the proportion of different sequences, and the GC content of various regions. The comparative analysis of the whole sequence identity of the chloroplast genomes was performed using mVISTA v2.4 (Frazer et al., 2004) with the chloroplast genome of P. neurantha (NC_039620) as the reference sequence. The genes of the IR/single copy (SC) boundaries in the chloroplast genomes of the Phoebe species were compared and visually represented using IRscope v1.1 (Amiryousefi, Hyvönen & Poczai, 2018) to reveal contraction and expansion of the IR regions. After sequence alignment using MAFFT v725 (Katoh & Standley, 2013), the single nucleotide polymorphism (SNP) and insertion/deletion (InDel) variants were identified using DnaSP v6 software (Rozas et al., 2017). The sliding window was set to 800 bp, and the step size to 200 bp.
Phylogenetic analysis
A phylogenetic analysis was conducted based on chloroplast genomes from 24 Lauraceae species, including those of the two Phoebe species sequenced and assembled in this study and another 22 downloaded from GenBank (Table S1). We used Litsea pungens and Sinopora hongkongensis as outgroups, together with 22 species of Phoebe to construct the phylogenetic trees. Maximum likelihood (ML) and Bayesian inference (BI) approaches were used for phylogenetic analysis. To create sequence alignments for the construction of phylogenetic trees, MAFFT v725 was applied to the complete cp genome sequence data. While MACSE v2 (Ranwez et al., 2018), which is designed for codons, was applied to a separate dataset of 79 protein-coding genes. Gblocks v0.91b (Talavera & Castresana, 2007) was then used to deal with the aligned sequences. The generalized-time reversible (GTR) with invariants (I) and discrete Gamma (G) (GTR+I+G) model was identified as the best fitting substitution model by applying the Bayesian information criterion (BIC) using jmodeltest v2.1.10 (Darriba et al., 2012). Lastly, phylogenetic trees, with branch support based on 1,000 bootstrap replicates, were inferred using the ML method as implemented in MEGA-X software (Kumar et al., 2018). MrBayes v3.2.7 (Huelsenbeck & Ronquist, 2001) was used for the BI analysis. The Markov chain Monte Carlo (MCMC) method was run for 2,000,000 generations. Each 5,000 generations, samples of trees were taken. The consensus tree was created using the remaining trees after the first 25% of the trees were regarded as “burn-in” and discarded. The GTR+I+G model of evolution was applied to both MEGA-X and MrBayes v3.2.7.
Ancestral geographical area reconstruction
We performed an ancestral geographical area reconstruction to trace the biogeographic history of the Phoebe species in China. Based on the distribution of 22 Phoebe species in China as recorded in the literature and in botanical specimens, we have produced biogeographic data on these species (Table S1). We used the ancestor reconstruction software RASP v4 (Yu, Blair & He, 2020) to forecast the origin and dispersal of Phoebe species in China utilizing S-DIVA (Statistical Dispersal-Vicariance Analysis) and BBM (Bayesian Binary MCMC) methodologies. For the reconstruction of the ancestral geographic area, the ML tree of the complete chloroplast genome from the phylogenetic analysis was employed, with the BI tree of the complete chloroplast genome serving as a supplement. At each node, there were a maximum of four areas. The S-DIVA study employed 1,000 randomly chosen trees out of 4,000 trees, with all parameters set to their default settings. In the BBM analysis, 10 MCMC chains were applied to run using the Jukes-Cantor (JK) model, with all settings left at their default levels.
Results
Chloroplast genome features of Phoebe
The comparative chloroplast genome analysis of nine representative species in the genus Phoebe (P. hunanensis, P. tavoyana, P. bournei, P. chekiangensis, P. neurantha, P. omeiensis, P. puwenensis, P. sheareri, P. zhennan) was used to assess the genome features of Phoebe (Table S1). The chloroplast genome sizes of the Phoebe species ranged from 152,746 bp for P. puwenensis to 152,876 bp for P. sheareri (Table 1). As observed in the majority of other angiosperms, all nine species of Phoebe presented a classical quadripartite structure (Fig. 1) (Wicke et al., 2011). The length of the large single copy (LSC) region ranged from 93,685 bp to 93,966 bp. The small single copy (SSC) region varied from 18,899 bp to 18,967 bp in length, and that of the IR regions ranged from 19,980 bp to 20,076 bp. The protein-coding regions of P. hunanensis accounted for 49.01% of its complete chloroplast genome, while rRNA and tRNA, introns, intergenic sequences, and pseudogenes represented 7.57%, 12.29%, and 30.95%, respectively. The respective proportions of P. tavoyana were quite consistent with those of P. hunanensis. The total GC content of the chloroplast genome was equally high (39.1%) (Table 1), with the IR regions having the highest GC content (44.4%), followed by the LSC (38.0%) and SSC (33.8%) regions. A total of 128 genes were identified, consisting of 84 protein-coding genes, 36 tRNA genes, and 8 rRNA genes (Table 2). Among the protein-coding genes, nine genes (atpF, petB, petD, ndhA, ndhB, rpoC1, rps12, rps16, and rpl2) contained a single intron, two genes (ycf3 and clpP) possessed two introns, and six tRNA genes (trnA-UGC, trnG-UCC, trnI-GAU, trnL-UAA, trnK-UUU, and trnV-UAC) featured a single intron (Table 2).
| Genome features | Phoebe hunanensis | Phoebe tavoyana | Phoebe bournei | Phoebe chekiangensis | Phoebe neurantha | Phoebe omeiensis | Phoebe puwenensis | Phoebe sheareri | Phoebe zhennan |
|---|---|---|---|---|---|---|---|---|---|
| Genome size (bp) | 152,791 | 152,814 | 152,853 | 152,849 | 152,782 | 152,855 | 152,746 | 152,876 | 152,831 |
| LSC size (bp) | 93,713 | 93,769 | 93,777 | 93,772 | 93,731 | 93,966 | 93,685 | 93,893 | 93,753 |
| SSC size (bp) | 18,928 | 18,899 | 18,928 | 18,967 | 18,905 | 18,929 | 18,909 | 18,915 | 18,928 |
| IR size (bp) | 20,075 | 20,073 | 20,074 | 20,055 | 20,074 | 19,980 | 20,076 | 20,034 | 20,075 |
| Total GC content (%) | 39.1% | 39.2% | 39.1% | 39.1% | 39.2% | 39.1% | 39.1% | 39.1% | 39.1% |
| GC content in LSC (%) | 38.0% | 37.9% | 38.0% | 38.0% | 38.0% | 37.9% | 37.9% | 37.9% | 38.0% |
| GC content in SSC (%) | 33.8% | 34.0% | 33.9% | 33.8% | 33.9% | 33.8% | 33.9% | 33.9% | 33.9% |
| GC content in IR (%) | 44.4% | 44.4% | 44.4% | 44.4% | 44.4% | 44.5% | 44.4% | 44.5% | 44.4% |
| Number of genes (unique) | 128(111) | 129(112) | 127(111) | 127(111) | 126(113) | 127(111) | 127(113) | 127(111) | 127(111) |
| Protein genes (unique) | 84(79) | 85(79) | 81(79) | 81(79) | 82(79) | 81(79) | 82(79) | 81(79) | 81(79) |
| tRNA genes (unique) | 36(29) | 36(29) | 36(29) | 36(29) | 36(29) | 36(29) | 36(29) | 36(29) | 36(29) |
| rRNA genes (unique) | 8(4) | 8(4) | 8(4) | 8(4) | 8(4) | 8(4) | 8(4) | 8(4) | 8(4) |
| Protein-coding regions (%) | 49.01% | 49.44% | 46.16% | 46.16% | 46.52% | 46.16% | 46.70% | 46.15% | 46.16% |
| rRNA and tRNA (%) | 7.57% | 7.71% | 7.71% | 7.70% | 7.44% | 7.70% | 7.70% | 7.70% | 7.70% |
| Introns size (% total) | 12.29% | 12.29% | 15.81% | 15.81% | 15.83% | 15.80% | 16.21% | 15.26% | 15.82% |
| Intergenic sequences and pseudogenes (%) | 30.95% | 29.90% | 30.27% | 30.26% | 32.84% | 30.30% | 30.25% | 30.30% | 30.25% |
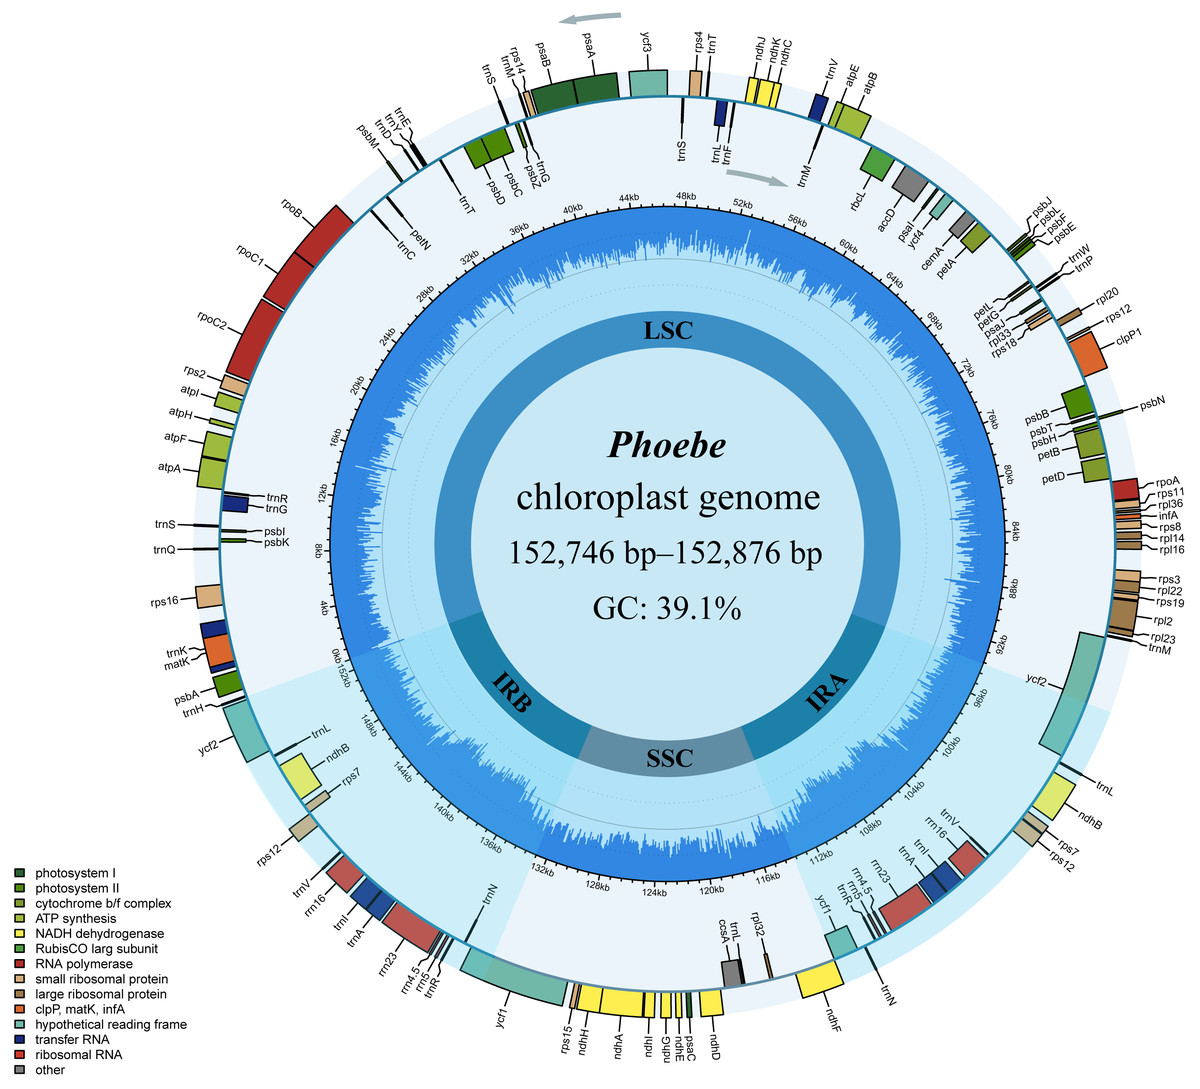
Figure 1: The circular map of Phoebe chloroplast genomes.
The genes are shown along the inner and outer sides of the circle, with those on the outside of the circle transcribed counterclockwise and those on the inside of the circle transcribed clockwise. Genes with different functions are shown in different colors, as shown in the bottom left corner. The inner circles are divided into dark blue and light blue to indicate GC and AT content, respectively. The large single copy (LSC), the small single copy (SSC), and the inverted repeat (IRA and IRB) regions are also represented.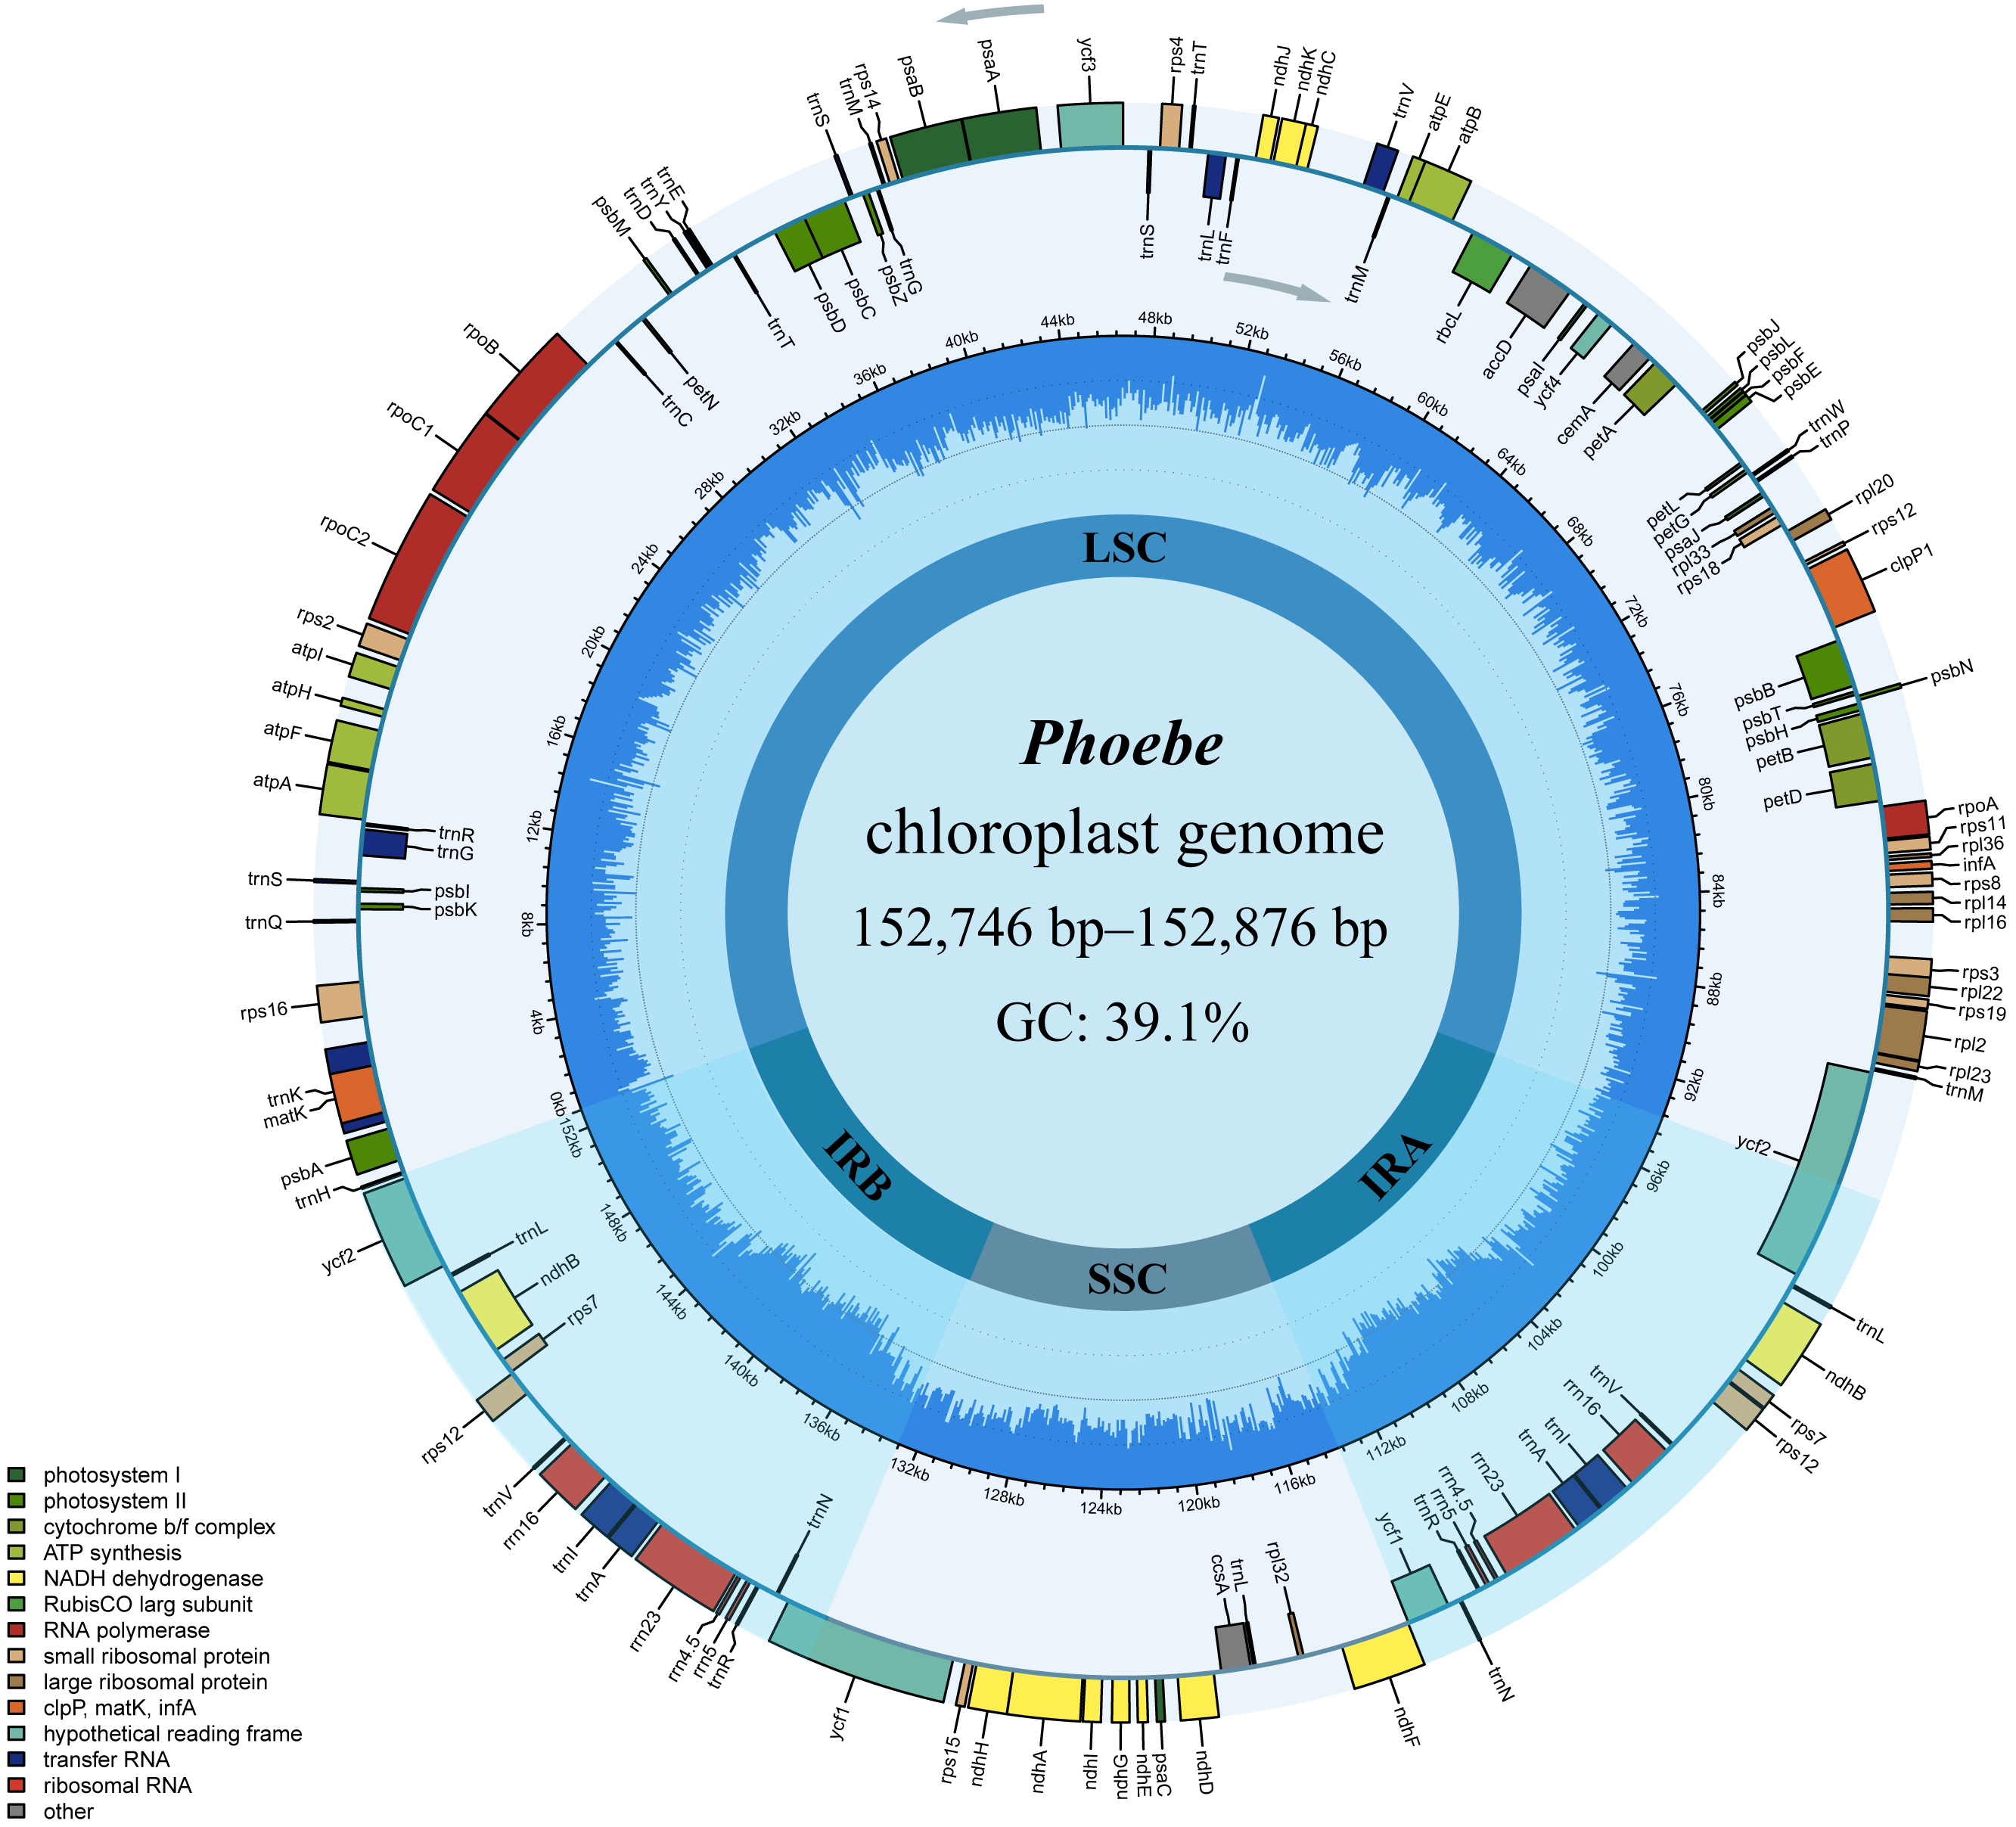
| Photosynthesis related genes | Large subunit of rubisco | rbcL |
| Photosystem I | psaA, psaB, psaC, psaI, psaJ | |
| Assembly/stability of photosystem I | ycf3**, ycf4 | |
| Photosystem II | psbA, psbB, psbC, psbD, psbE, psbF, psbH, psbI, psbJ, psbK, psbL, psbM, psbN, psbT, psbZ | |
| ATP synthase | atpA, atpB, atpE, atpF*, atpH, atpI | |
| Cytochrome b6/f complex | petA, petB*, petD*, petG, petL, petN | |
| Cytochrome c synthesis | ccsA | |
| NADH dehydrogenase | ndhA*, ndhB*, ndhC, ndhD, ndhE, ndhF, ndhG, ndhH, ndhI, ndhJ, ndhK | |
| Transcription and translation related genes | RNA polymerase subunits / transcription | rpoA, rpoB, rpoC1*, rpoC2 |
| Small subunit of ribosomal proteins | rps11, rps12*,a, rps14, rps15, rps16*, rps18, rps19, rps2, rps3, rps4, rps7a, rps8 | |
| Large subunit of ribosomal proteins | rpl14, rpl16, rpl2*, rpl20, rpl22, rpl23a, rpl32, rpl33, rpl36 | |
| translation initiation factor | infA | |
| RNA genes | ribosomal RNA | rrn16a, rrn23a, rrn4.5a, rrn5a |
| transfer RNA | trnA- UGC*,a, trnR- ACGa, trnR- UCU, trnN- GUUa, trnD- GUC, trnC- GCA, trnQ- UUG, trnE- UUC, trnG- GCC, trnG- UCC*, trnH- GUG, trnI- GAU*,a, trnL- CAAa, trnL- UAA*, trnL- UAG, trnK- UUU*, trnfM- CAU, trnM- CAUa, trnF- GAA, trnP- UGG, trnS- GCU, trnS- GGA, trnS- UGA, trnT- GGU, trnT- UGU, trnW- CCA, trnY- GUA, trnV- GACa, trnV- UAC* | |
| Other genes | RNA processing | matK |
| carbon metabolism | cemA | |
| fatty acid synthesis | accD | |
| proteolysis | clpP** | |
| component of TIC complex | ycf1a | |
| hypothetical proteins | ycf2a |
SSR and long repeat identification
The distribution of SSRs in the chloroplast genomes of Phoebe species was analyzed using MISA v2.1. The quantity of SSRs ranged from 209 (P. neurantha) to 215 (P. hunanensis), and all species had similar distributions of SSRs types (Fig. 2A). There were 94 mononucleotides, 37 dinucleotides, 72 trinucleotides, nine tetranucleotides, two pentanucleotides, and one hexanucleotide in P. hunanensis. Mononucleotide repeats were the most abundant, comprising almost 43.41% of the total SSRs, followed by trinucleotide (33.87%), dinucleotide (17.51%), and tetranucleotide (4.12%) repeats. Pentanucleotide repeats (0.78%) and hexanucleotide repeats (0.31%) were extremely rare in these chloroplast genomes. The mononucleotide SSRs were most often comprised of A/T repeats (about 95.74% of all mononucleotide SSRs) (Table S2).
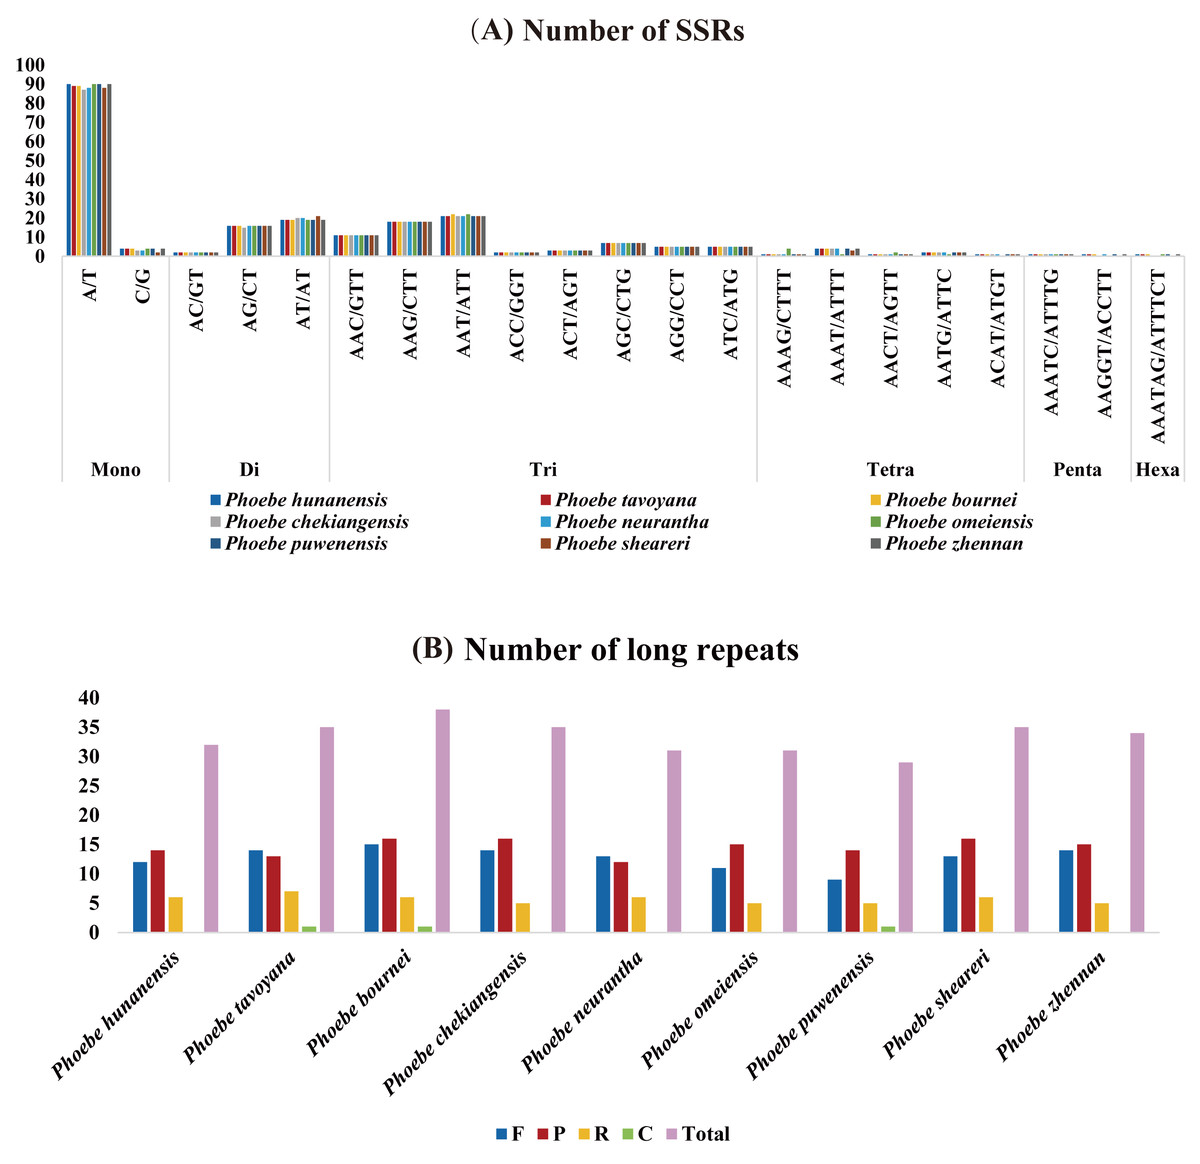
Figure 2: The analysis of short simple repeats (SSRs) and long repeats in Phoebe chloroplast genomes.
(A) Number of SSRs. (B) Number of long repeats.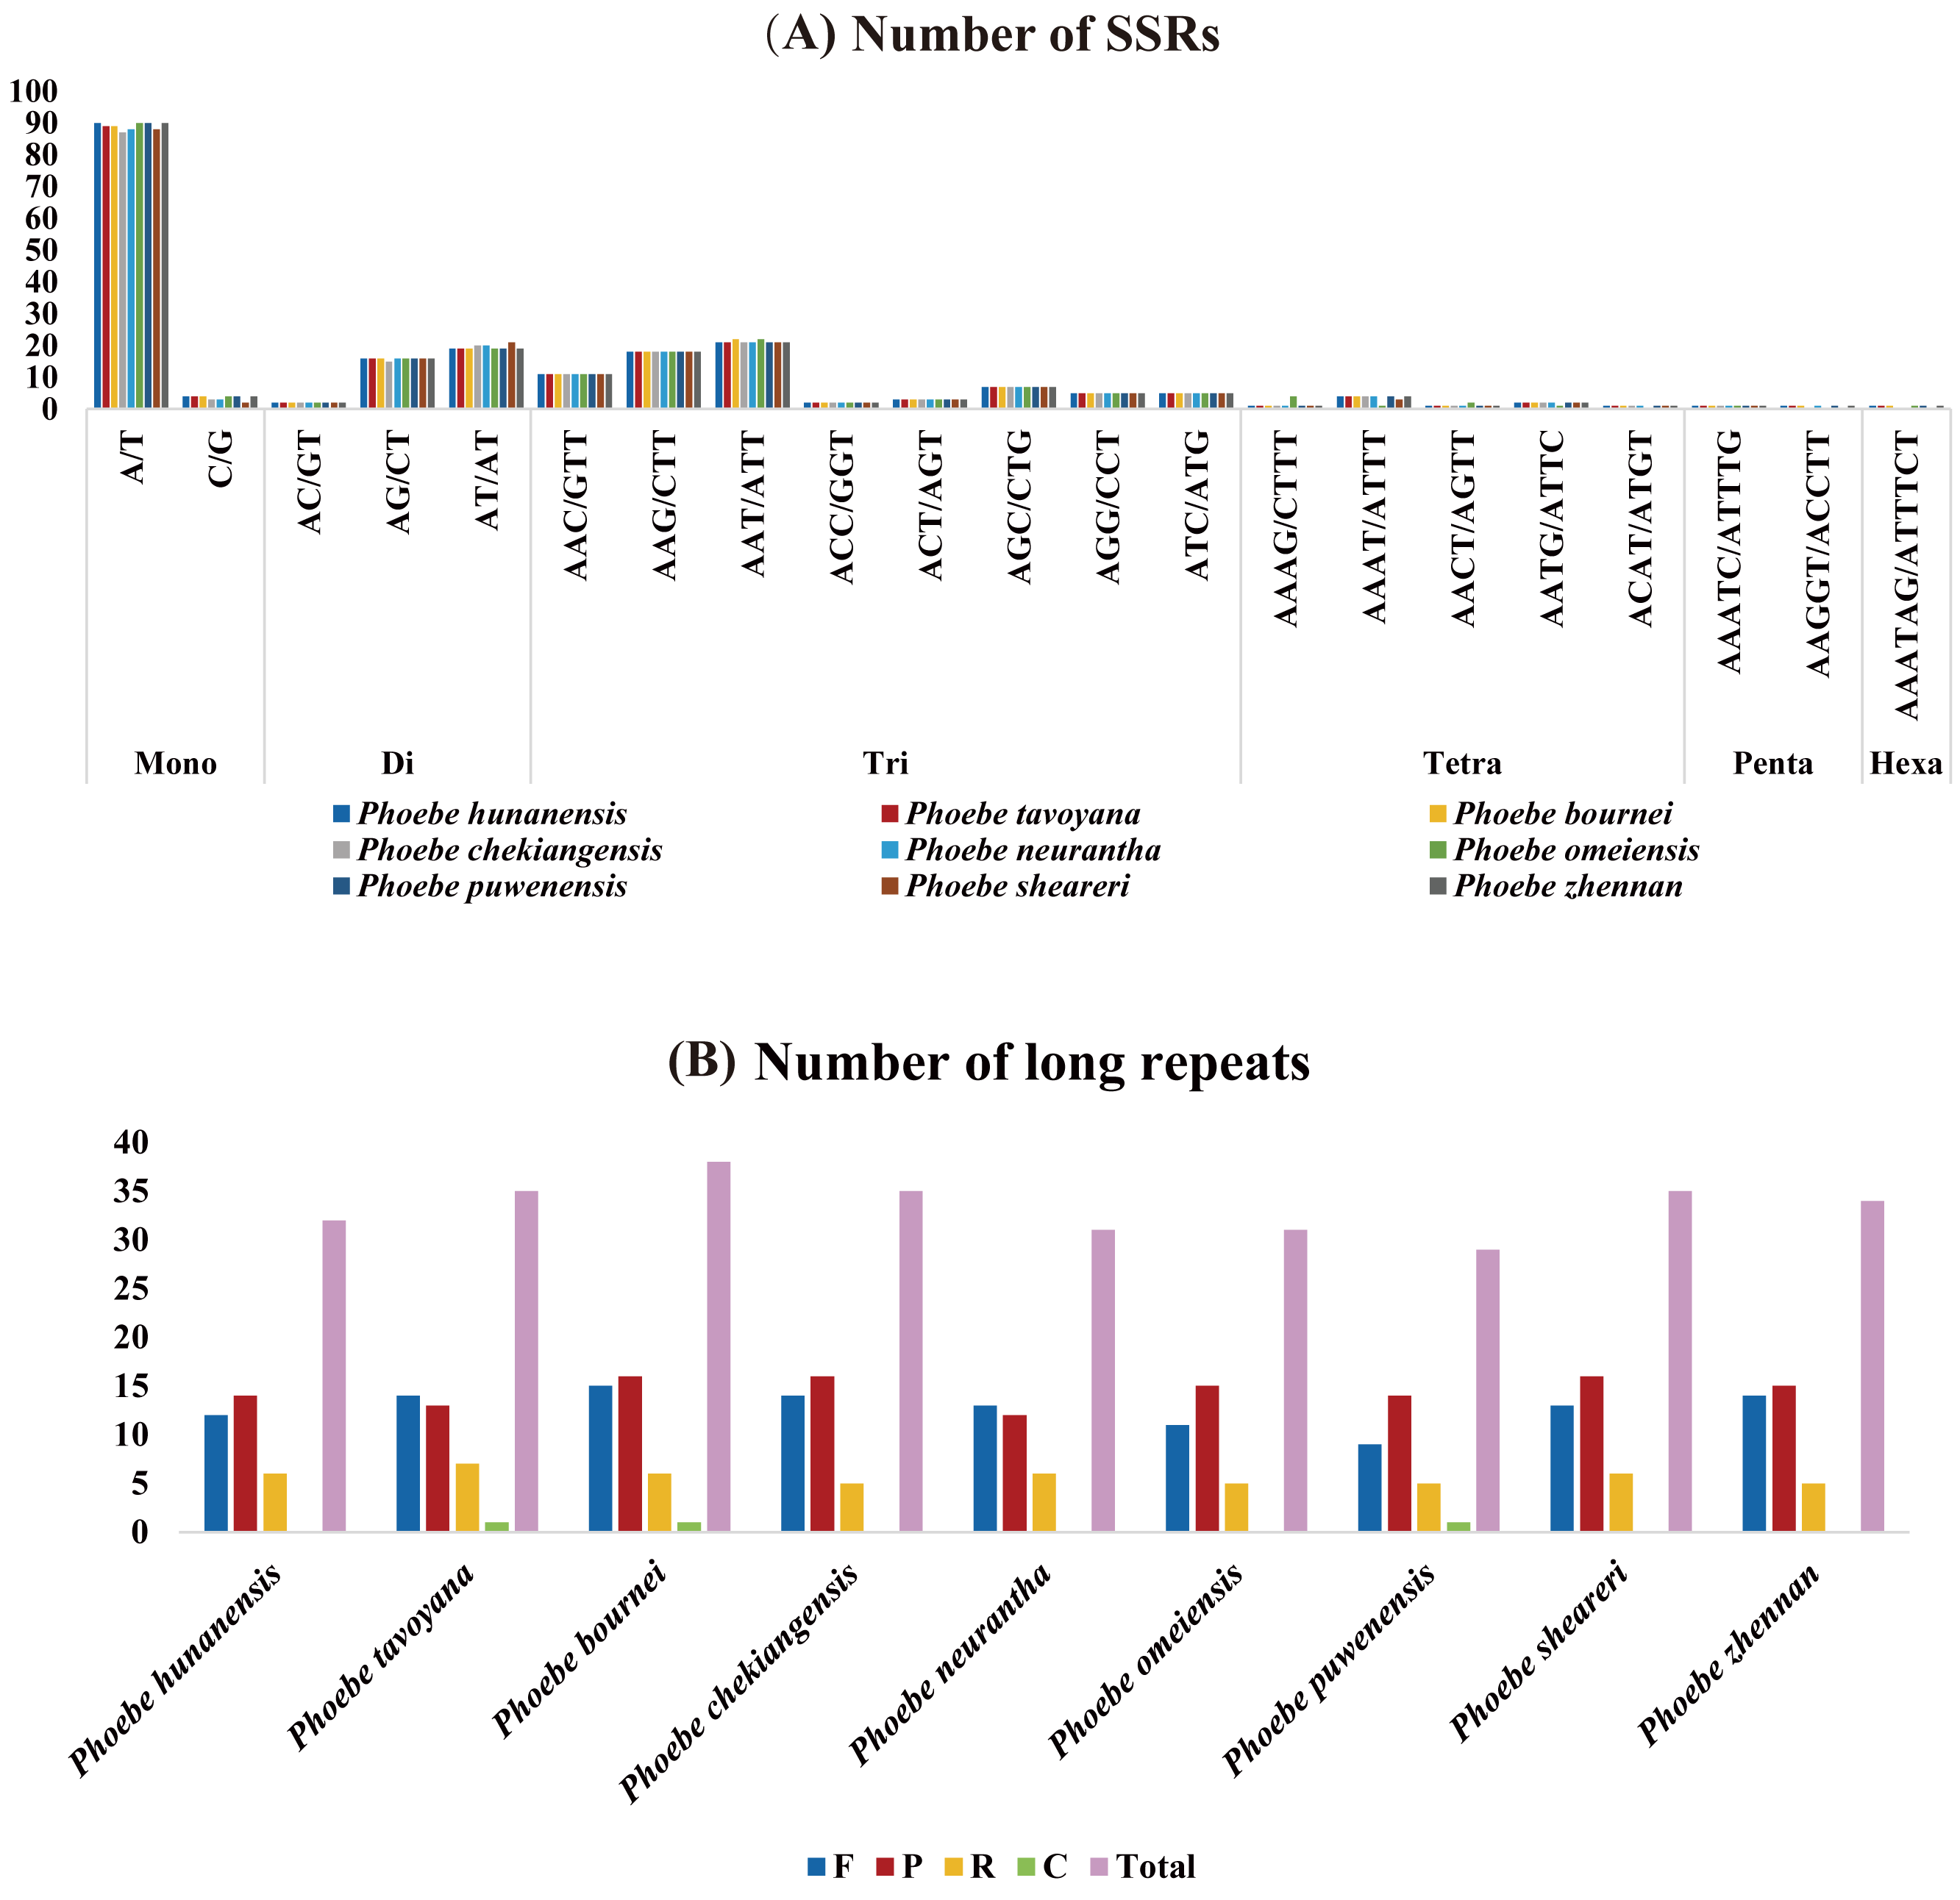
The long repeat sequences in nine Phoebe chloroplast genomes were analyzed. We found forward (F), palindromic (P), reverse (R), and complement (C) repeats of each repeat unit of at least 20 bp (Table S3). There were 29 (P. puwenensis) to 38 (P. bournei) long repeat sequences in each Phoebe chloroplast genome analyzed. Reverse and complement repeats were significantly less common than forward and palindromic repeats. The palindromic repeats were most abundant, except for P. tavoyana and P. neurantha, which had more forward repeats than palindromic repeats. Complement repeats were extraordinarily rare in the chloroplast genomes, occurring only once in P. tavoyana, P. bournei, and P. puwenensis (Fig. 2B). We measured the long repeats of lengths from 20 to 300 bp and found that long repeats of 20–21 bp in length were the most common (Table S3). We analyzed the region of repeats and found that the long repeat sequences were mainly distributed in the LSC region, followed by the IR and then SSC regions (Table S3).
Codon preference analysis and estimation of evolutionary rates
Based on the sequences of 84 protein-coding genes from the chloroplast genome of P. hunanensis, the codon usage frequency and relative synonymous codon usage (RSCU) were calculated and visualized (Fig. 3). There were 50,930 codons found in the protein-coding genes of the P. hunanensis chloroplast genome. Among these codons, the three most abundant ones encode the amino acids leucine (5,242 codons), serine (4,568 codons), and isoleucine (4,170 codons). The three least abundant codons encode tryptophan (740 codons), methionine (971 codons), and cysteine (1,083 codons) (Table S4). Through comparative analysis of codons, we found that AGA had the largest RSCU value of 1.84. Analysis of the 3′-end of codons encoding amino acids revealed that codons with RSCU values >1 usually ended in U or A, and most of those ending in G or C generally had RSCU values <1, such as CGC (arginine), GGC (glycine), and CAC (histidine). In addition, there were four types of codons, GCC, AUG, ACC, and UGG, with RSCU values = 1.
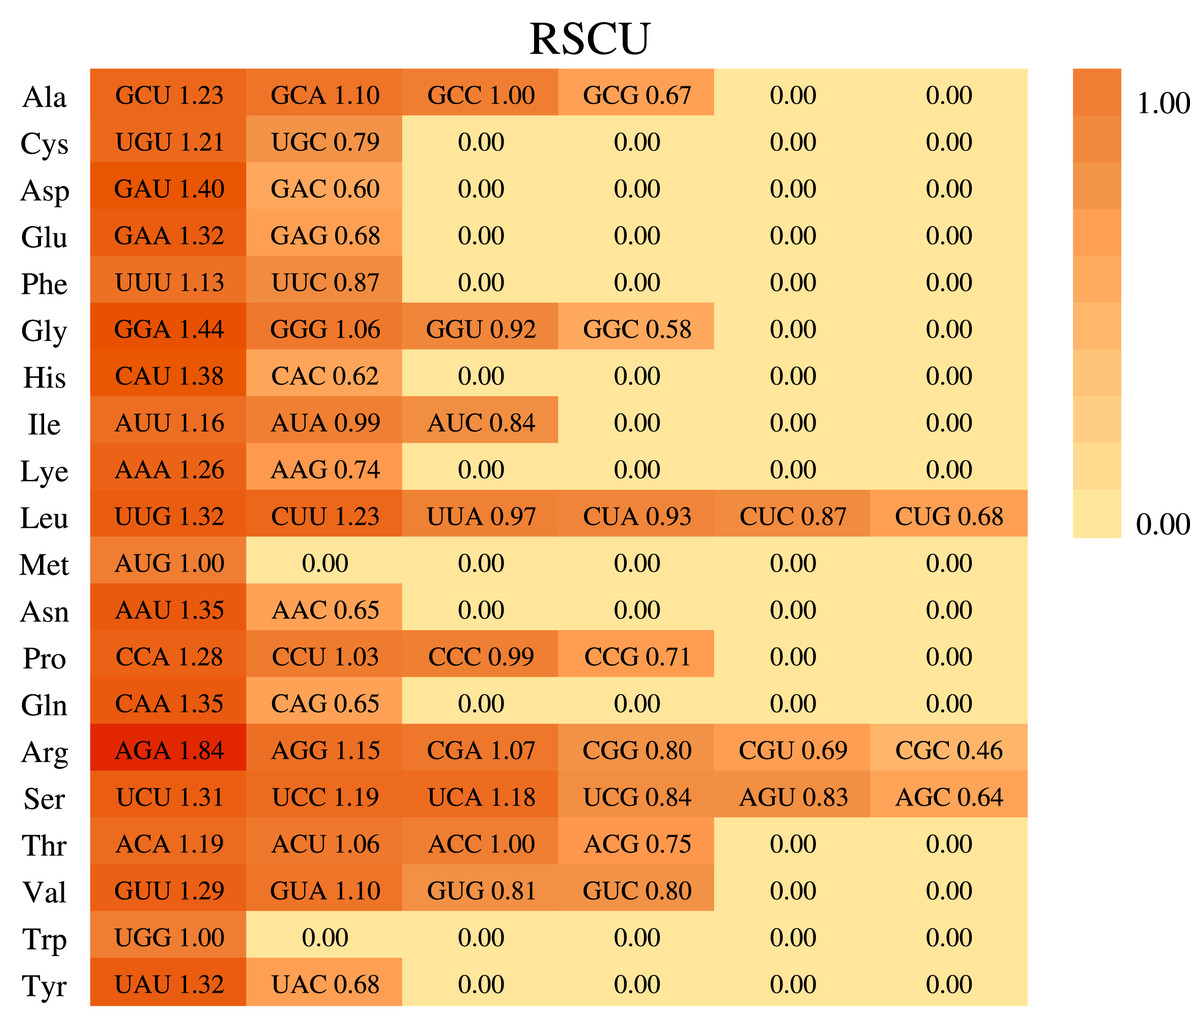
Figure 3: Codon usage in Phoebe hunanensis.
The codon usage for 20 amino acids as well as stop codons of all protein-coding genes identified is shown for the chloroplast genome of Phoebe hunanensis.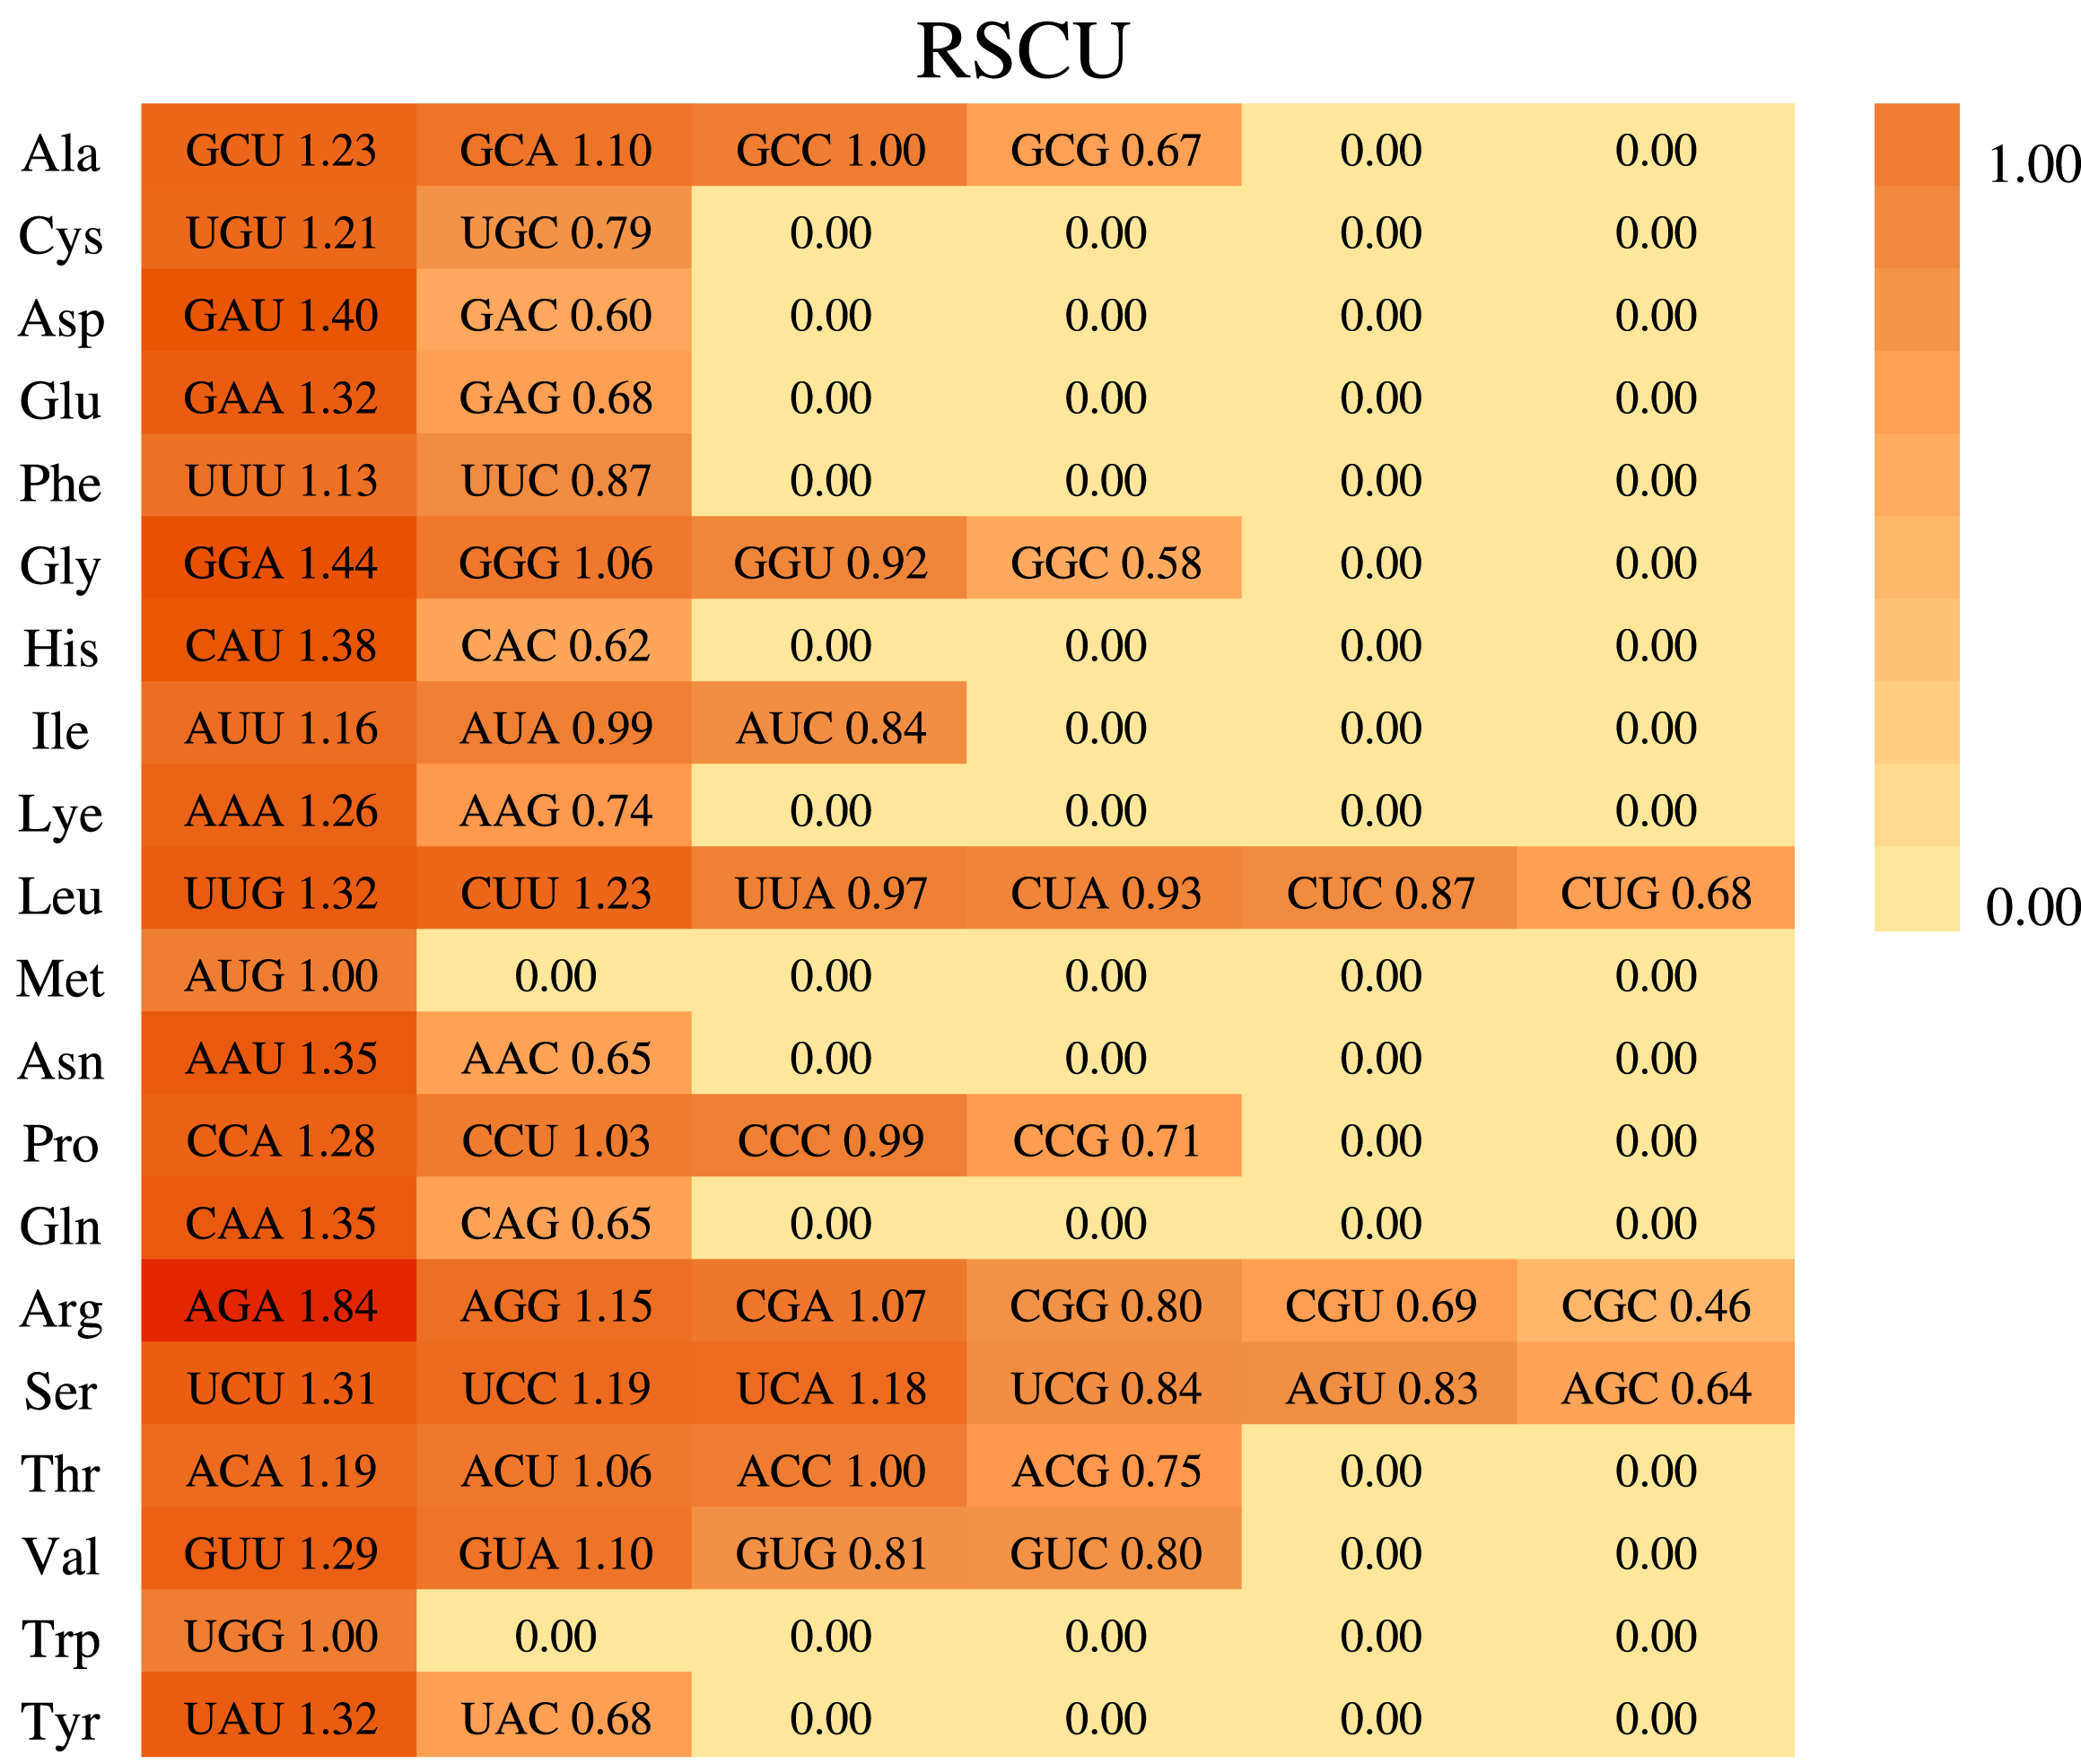
The Ka/Ks values can be used to evaluate whether the coding gene is under selection pressure. We calculated the Ka/Ks values of 79 unique protein-coding genes using P. neurantha (NC_039620) as a reference sequence. Ka/Ks values ranged from 0 to 1.3974 (Table S5). The majority of genes had Ka/Ks values below 1. The highest Ka/Ks value was 1.3974 for the rpl16 gene in P. tavoyana. The Ka/Ks values of the ycf1 and ycf2 genes were higher than those of other genes, but only the Ka/Ks value of the ycf2 gene in P. zhennan was larger than 1.
Genome comparison and sequence divergence
To determine the level of genomic divergence, sequence identity analysis based on an alignment of the whole chloroplast genomes was performed (Fig. 4). A high degree of conservation was observed among the Phoebe chloroplast genomes, and the non-coding regions were more divergent than the coding regions. There were high levels of divergence in the intergenic regions of psbM–trnD-GUC, petA–psbE, and ndhF–rpl32. The coding regions were relatively conserved except for those of psbL and ycf2. The divergence of chloroplast genome sequences was mainly concentrated in the LSC and SSC regions, while the IR regions had relatively few substitutions.
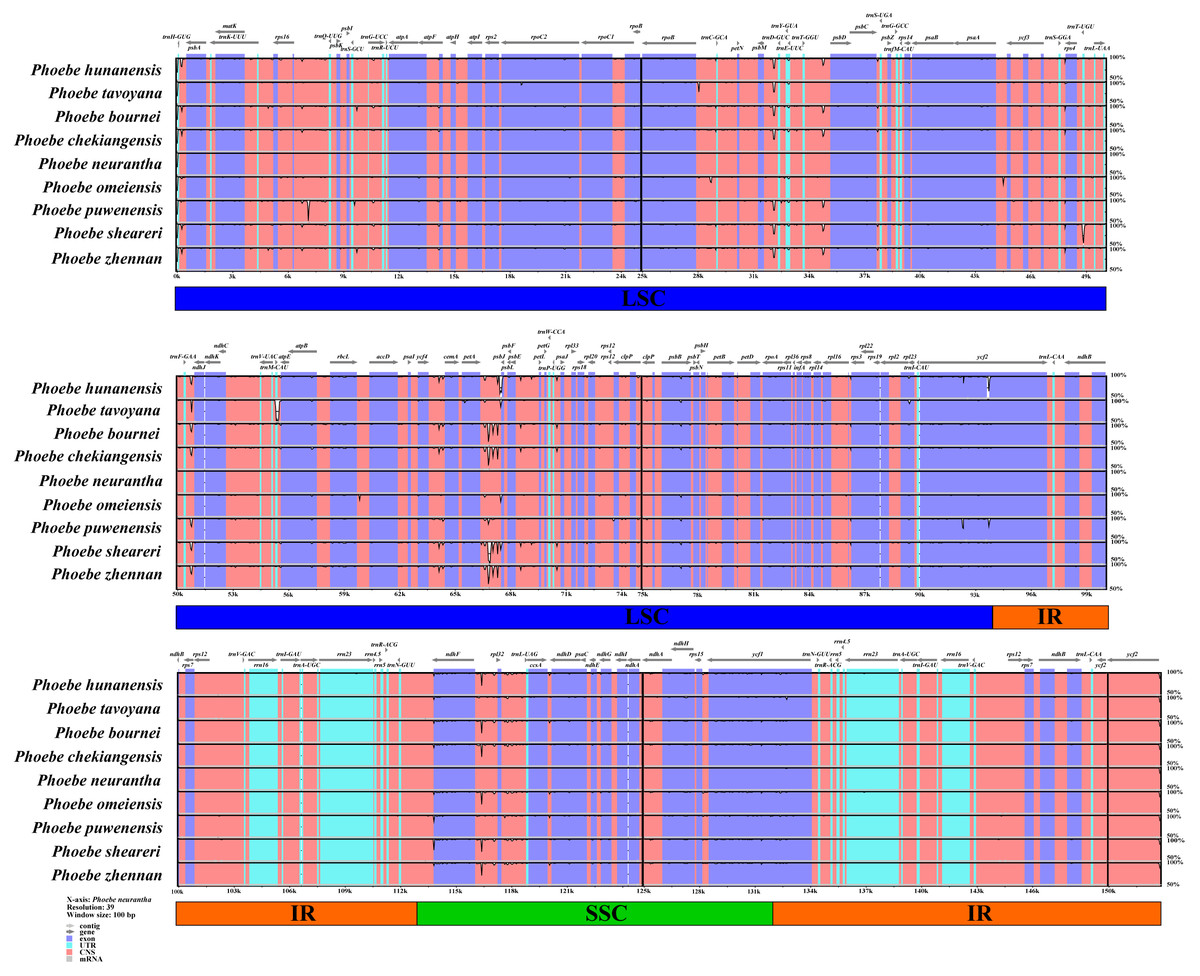
Figure 4: Analysis of the whole chloroplast genomes of Phoebe species.
The sequence analysis of the Phoebe species was performed with mVISTA using Phoebe neurantha as the reference sequence, with dark gray arrows indicating the orientation of individual genes, pink bars indicating non-coding sequences (CNS), purple bars indicating exons, blue bars indicating RNA, gray bars indicating mRNA, and the y-axis indicating percentage identity, ranging from 50% to 100%.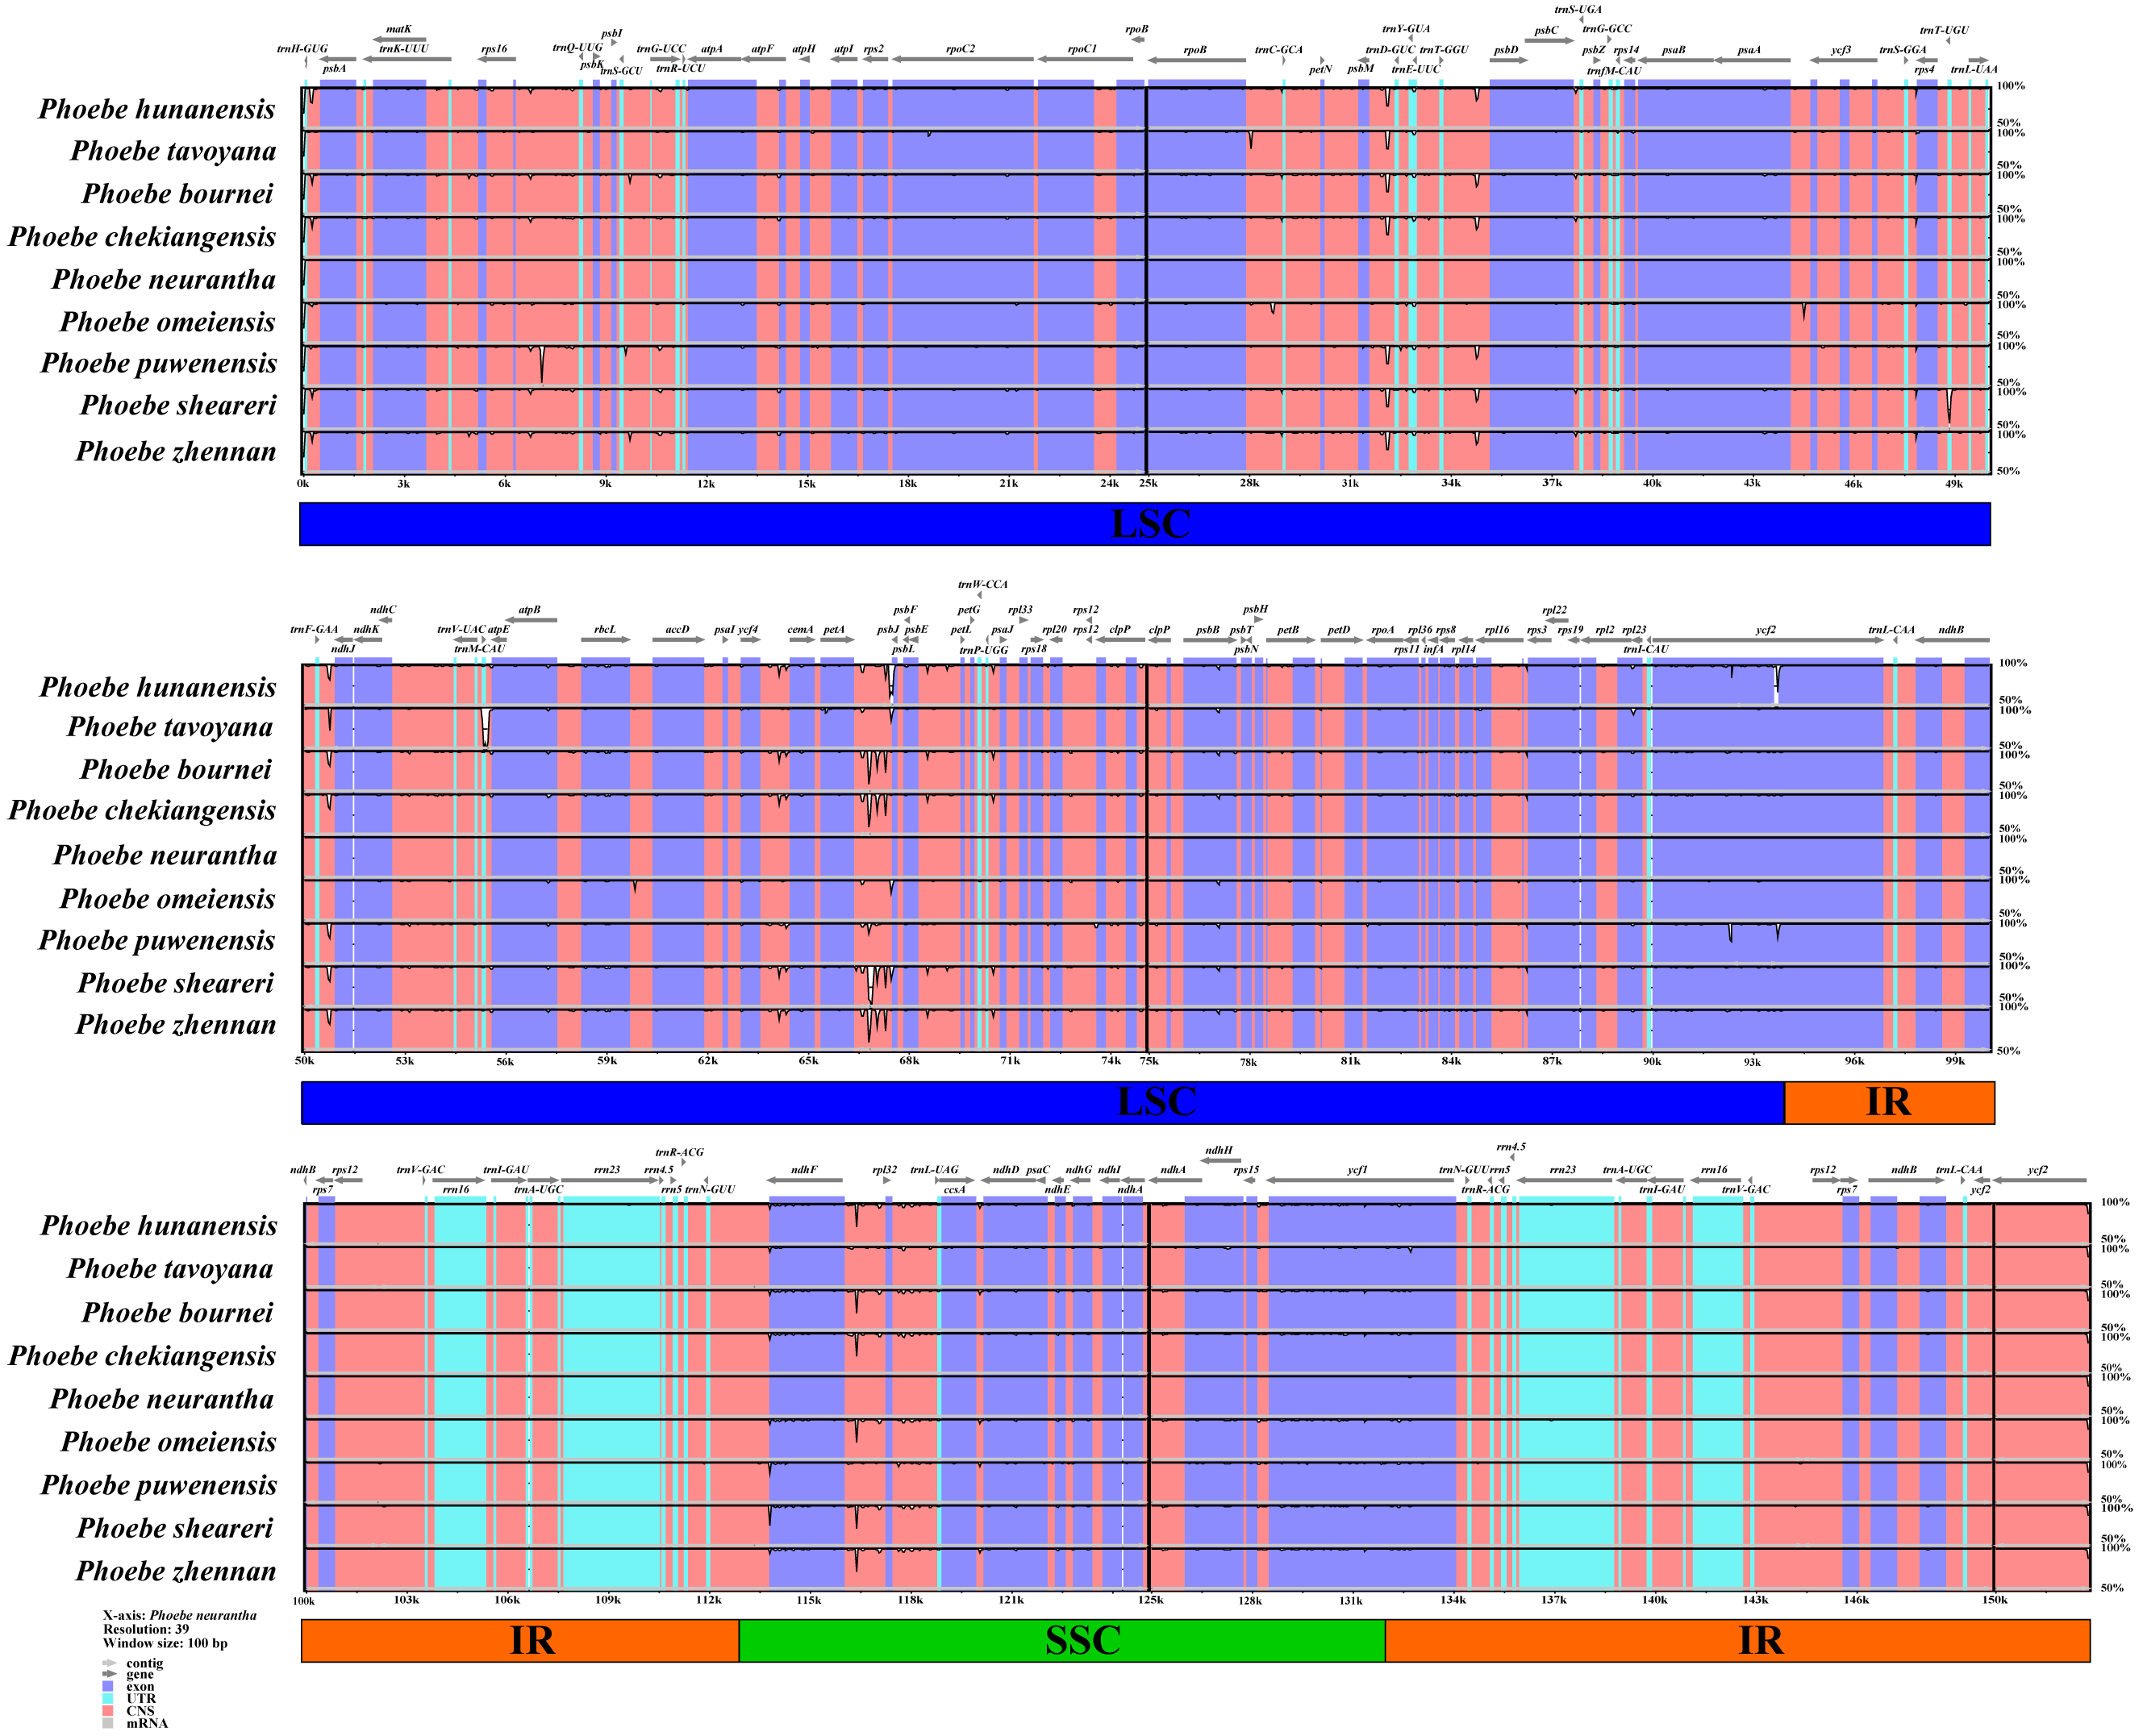
The genes of the IR/SC junctions in the chloroplast genomes of Phoebe species were compared (Fig. 5). JLB, JSB, JSA, and JLA represent the LSC/IRb, IRb/SSC, SSC/IRa, and IRa/LSC junctions, respectively. There were low levels of divergence at each boundary of the genes ycf2, ycf1, ndhF, trnH, and psbA. P. neurantha exhibited one complete ycf2 copy that crossed the JLB junction, while other Phoebe species had two copies, with a truncated pseudogene ycf2ψ copy at the JLA junction. In P. neurantha, the pseudogene ycf2ψ was missing at the JLA junction. The ycf1 gene of nine species of Phoebe was located at JSA, whereas its corresponding pseudogene ycf1ψ copy was found at JSB. Notably, this ycf1ψ pseudogene was missing from P. neurantha and P. puwenensis. In addition, the ndhF gene was located at JSB, contracting by 5 to 28 bp in the SSC region, while the trnH gene was situated at JLA, contracting by 21 to 36 bp in the LSC region. The psbA gene was contained within the LSC region but not at the end of the LSC region.
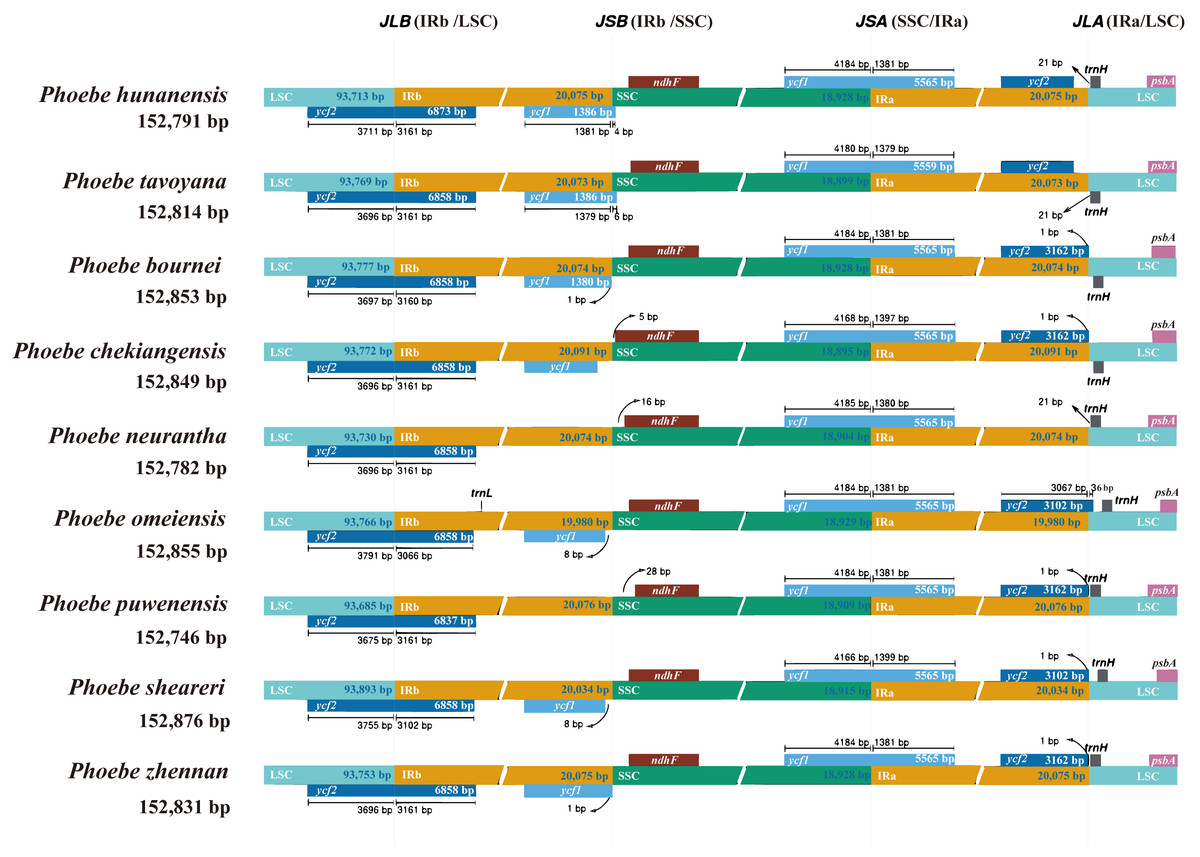
Figure 5: The contraction and expansion of the inverted repeat/single copy (IR/SC) junctions.
The boundaries of the IR, short single copy (SSC), and large single copy (LSC) regions in the chloroplast genomes of Phoebe species were compared. Loci JLB, JSB, JSA, and JLA represent the LSC/IRb, IRb/SSC, SSC/IRa, and IRa/LSC junctions, respectively.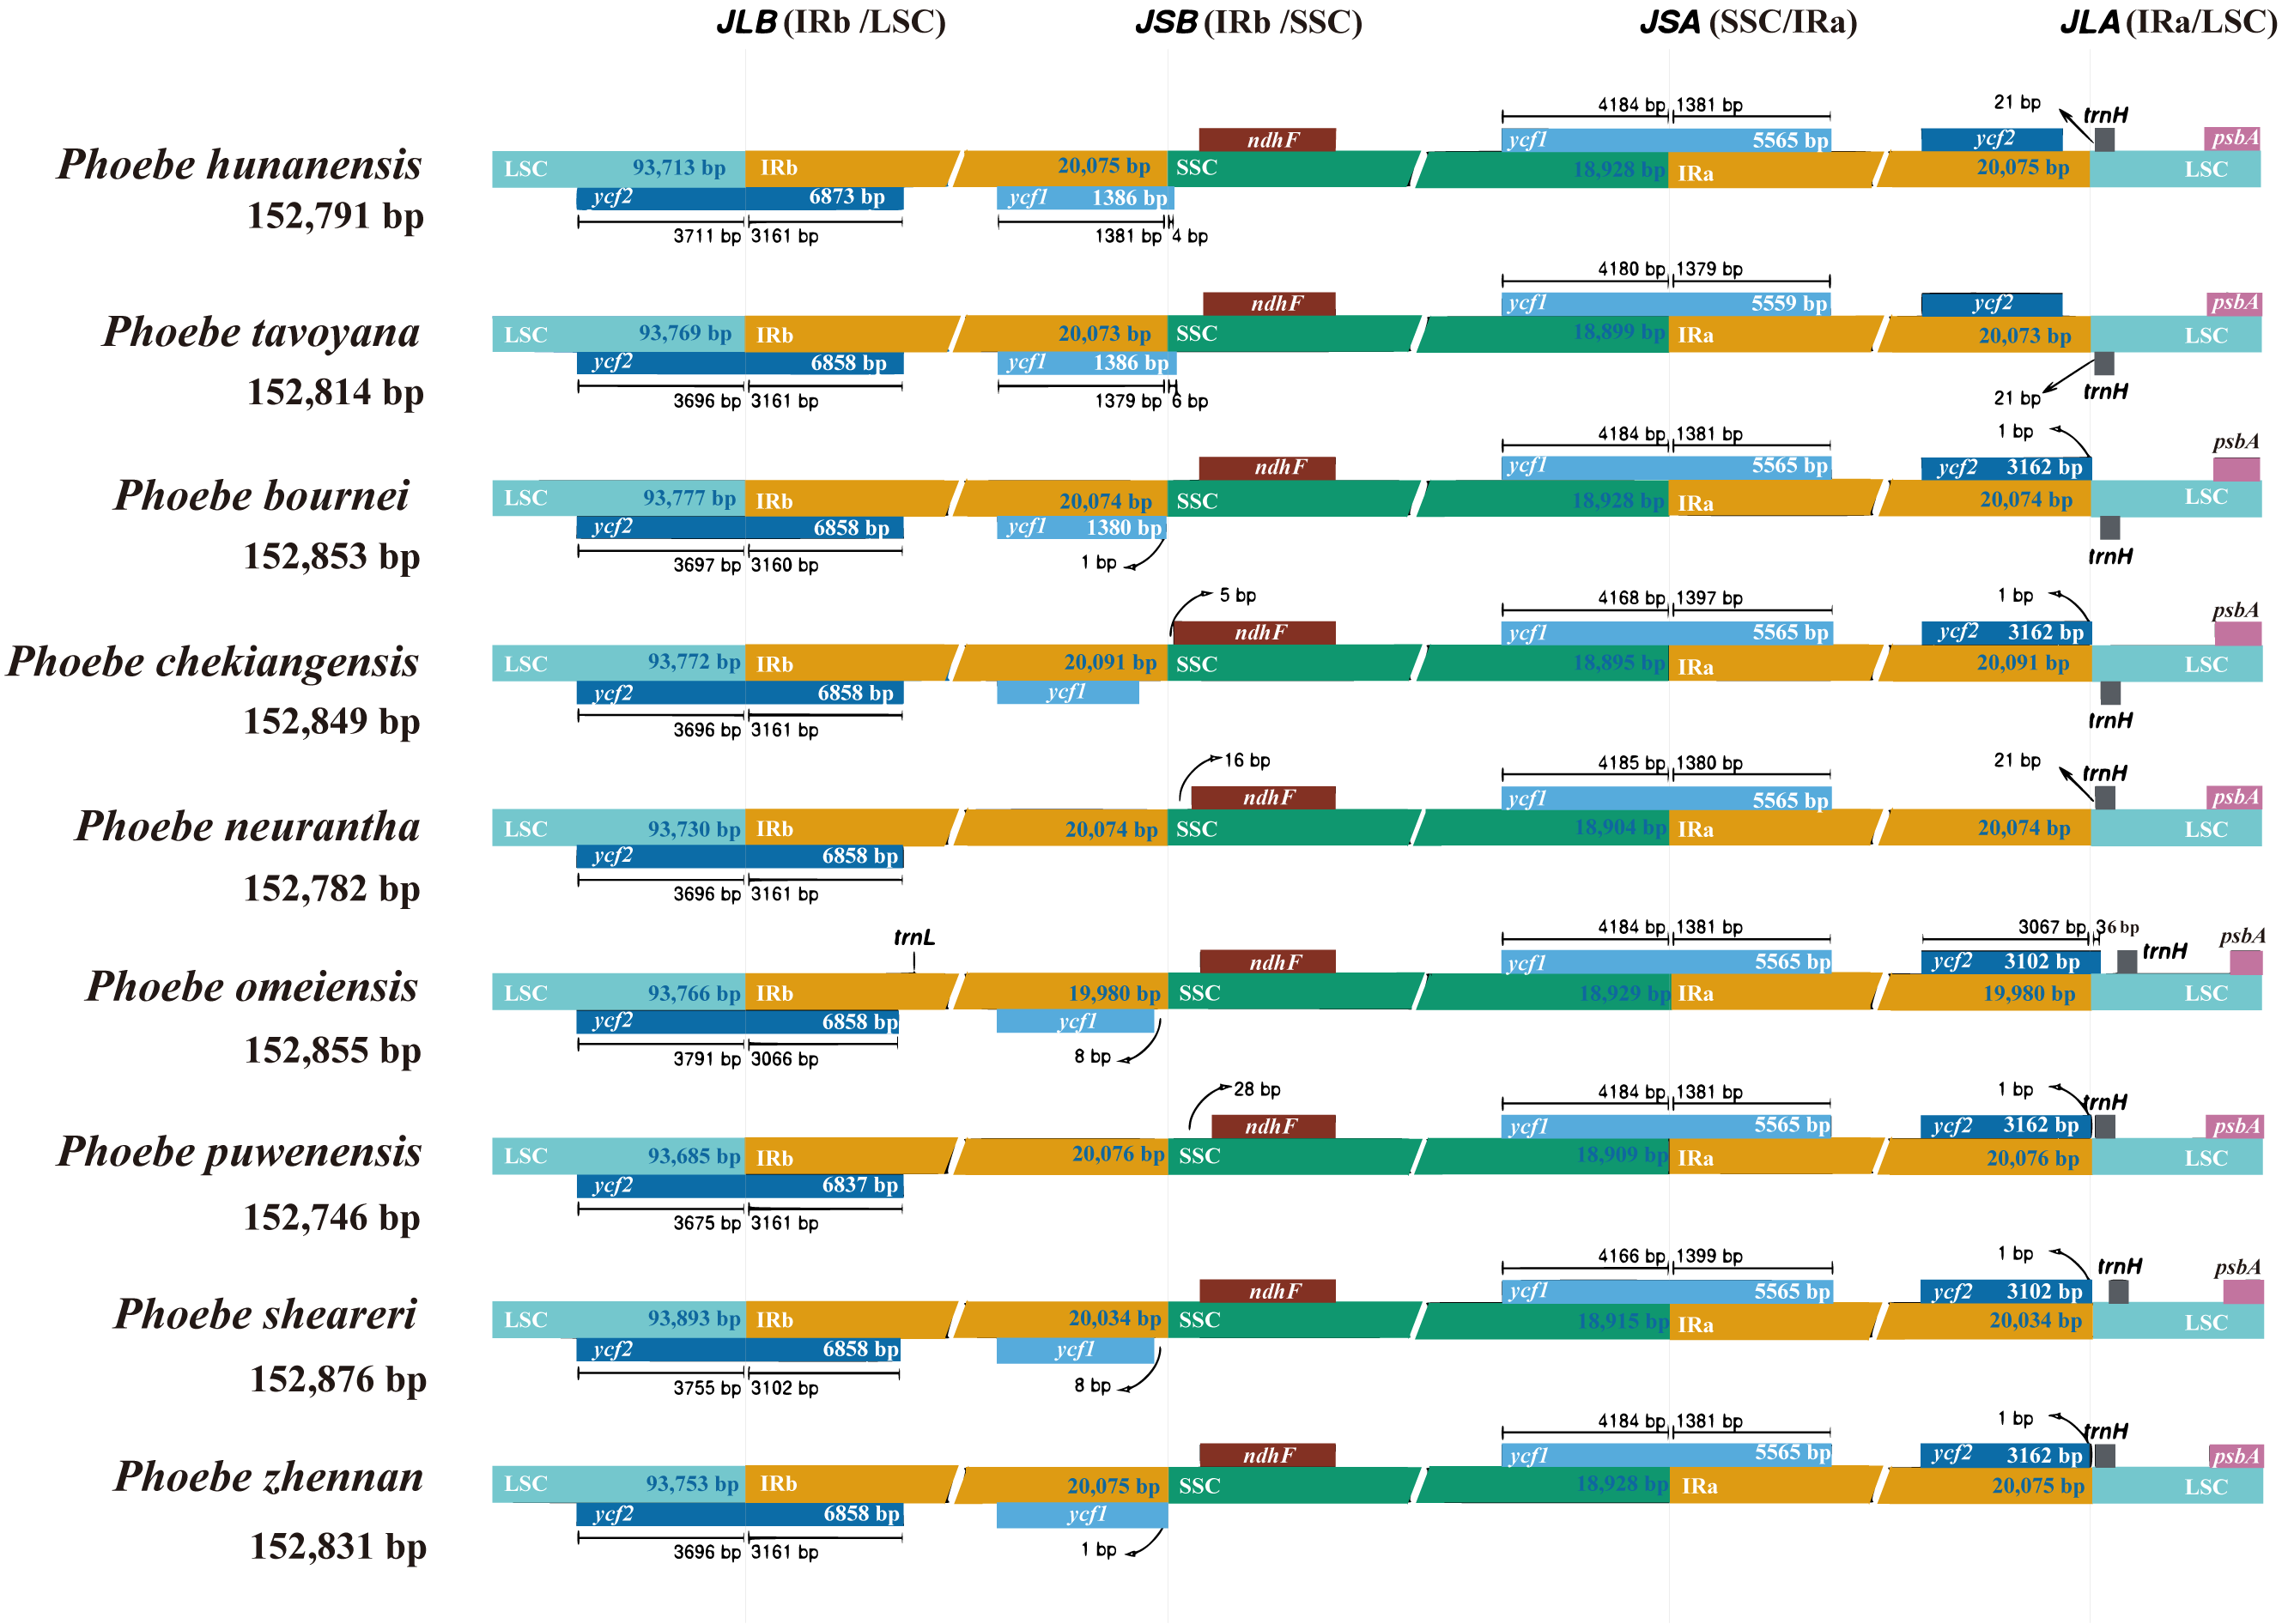
Divergence hotspots in Phoebe chloroplast genomes
With the aim of quantifying divergence among the chloroplast genomes of Phoebe species at the sequence level, the highly variable regions were analyzed using DnaSP v6 sliding window analysis of nucleotide diversity (Pi) (Fig. 6A). The values of Pi ranged from 0 to 0.0125, and its average was 0.00105. The Pi value in the IR region was extremely low. The Pi value of the SSC region (0.00198) was greater than that of the LSC region (0.00124). In the LSC region, psbJ–psbE had the highest Pi value, 0.0125, followed by rbcL. In the SSC region, ycf1 had the highest Pi value. To validate the efficiency of hotspots, we constructed a phylogenetic tree using the genes rbcL and ycf1 as well as the intergenic regions psbJ–psbE and rpl32–trnL-UAG. These genes and intergenic regions were extracted from the chloroplast genomes of nine species of Phoebe. The bootstrap values for this phylogenetic tree are all greater than 50 (Fig. 6B).
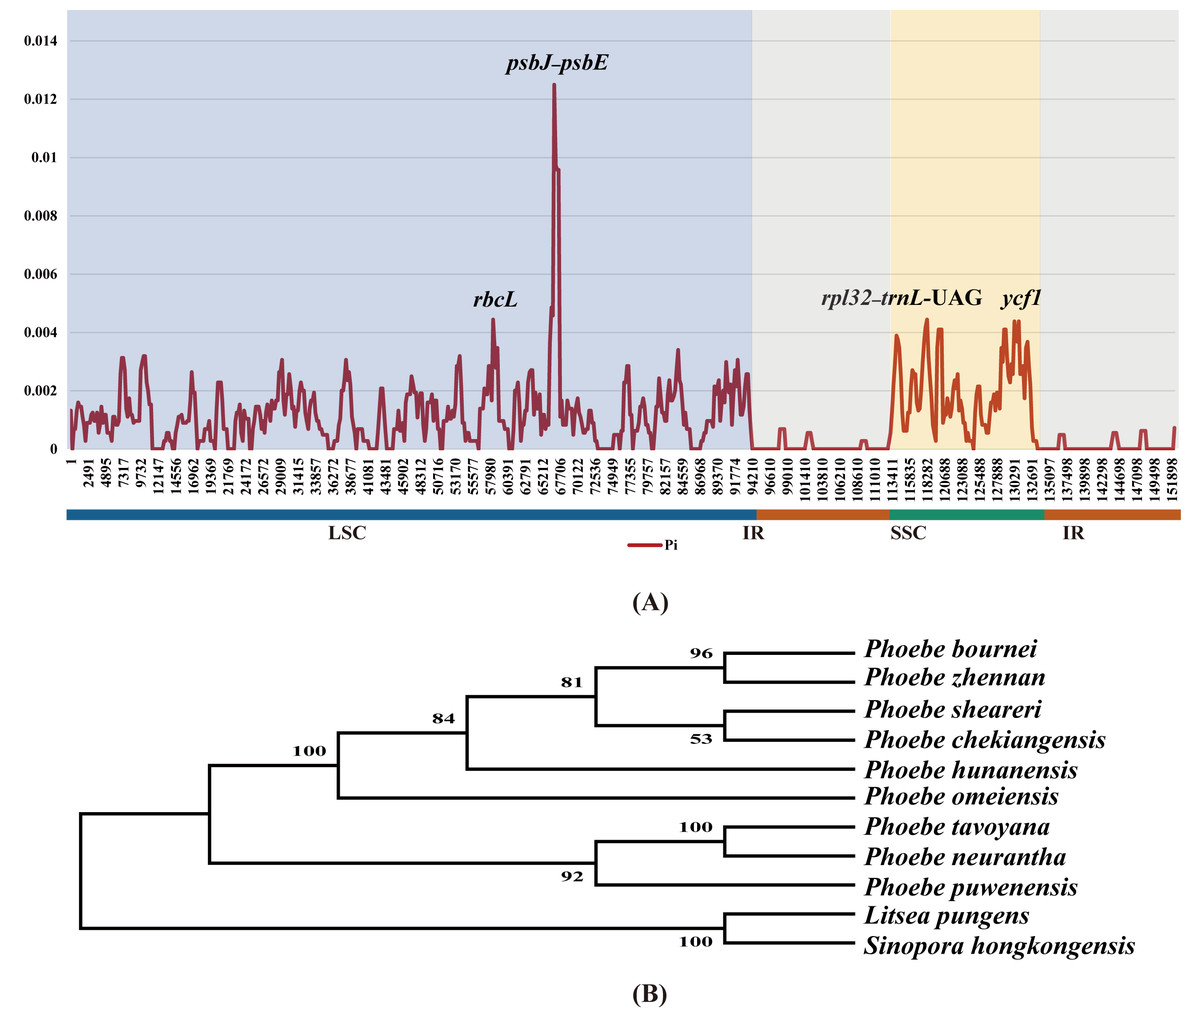
Figure 6: Divergence hotspots.
(A) The sliding window analysis of nucleotide diversity (Pi) among the whole chloroplast genomes of nine Phoebe species. The x-axis represents the base position along the sequences, and the y-axis represents the Pi value. (B) A phylogenetic tree using the genes rbcL and ycf1 as well as the intergenic regions petA–psbE and rpl32–trnL-UAG. These genes and intergenic regions were extracted from the chloroplast genomes of Phoebe species.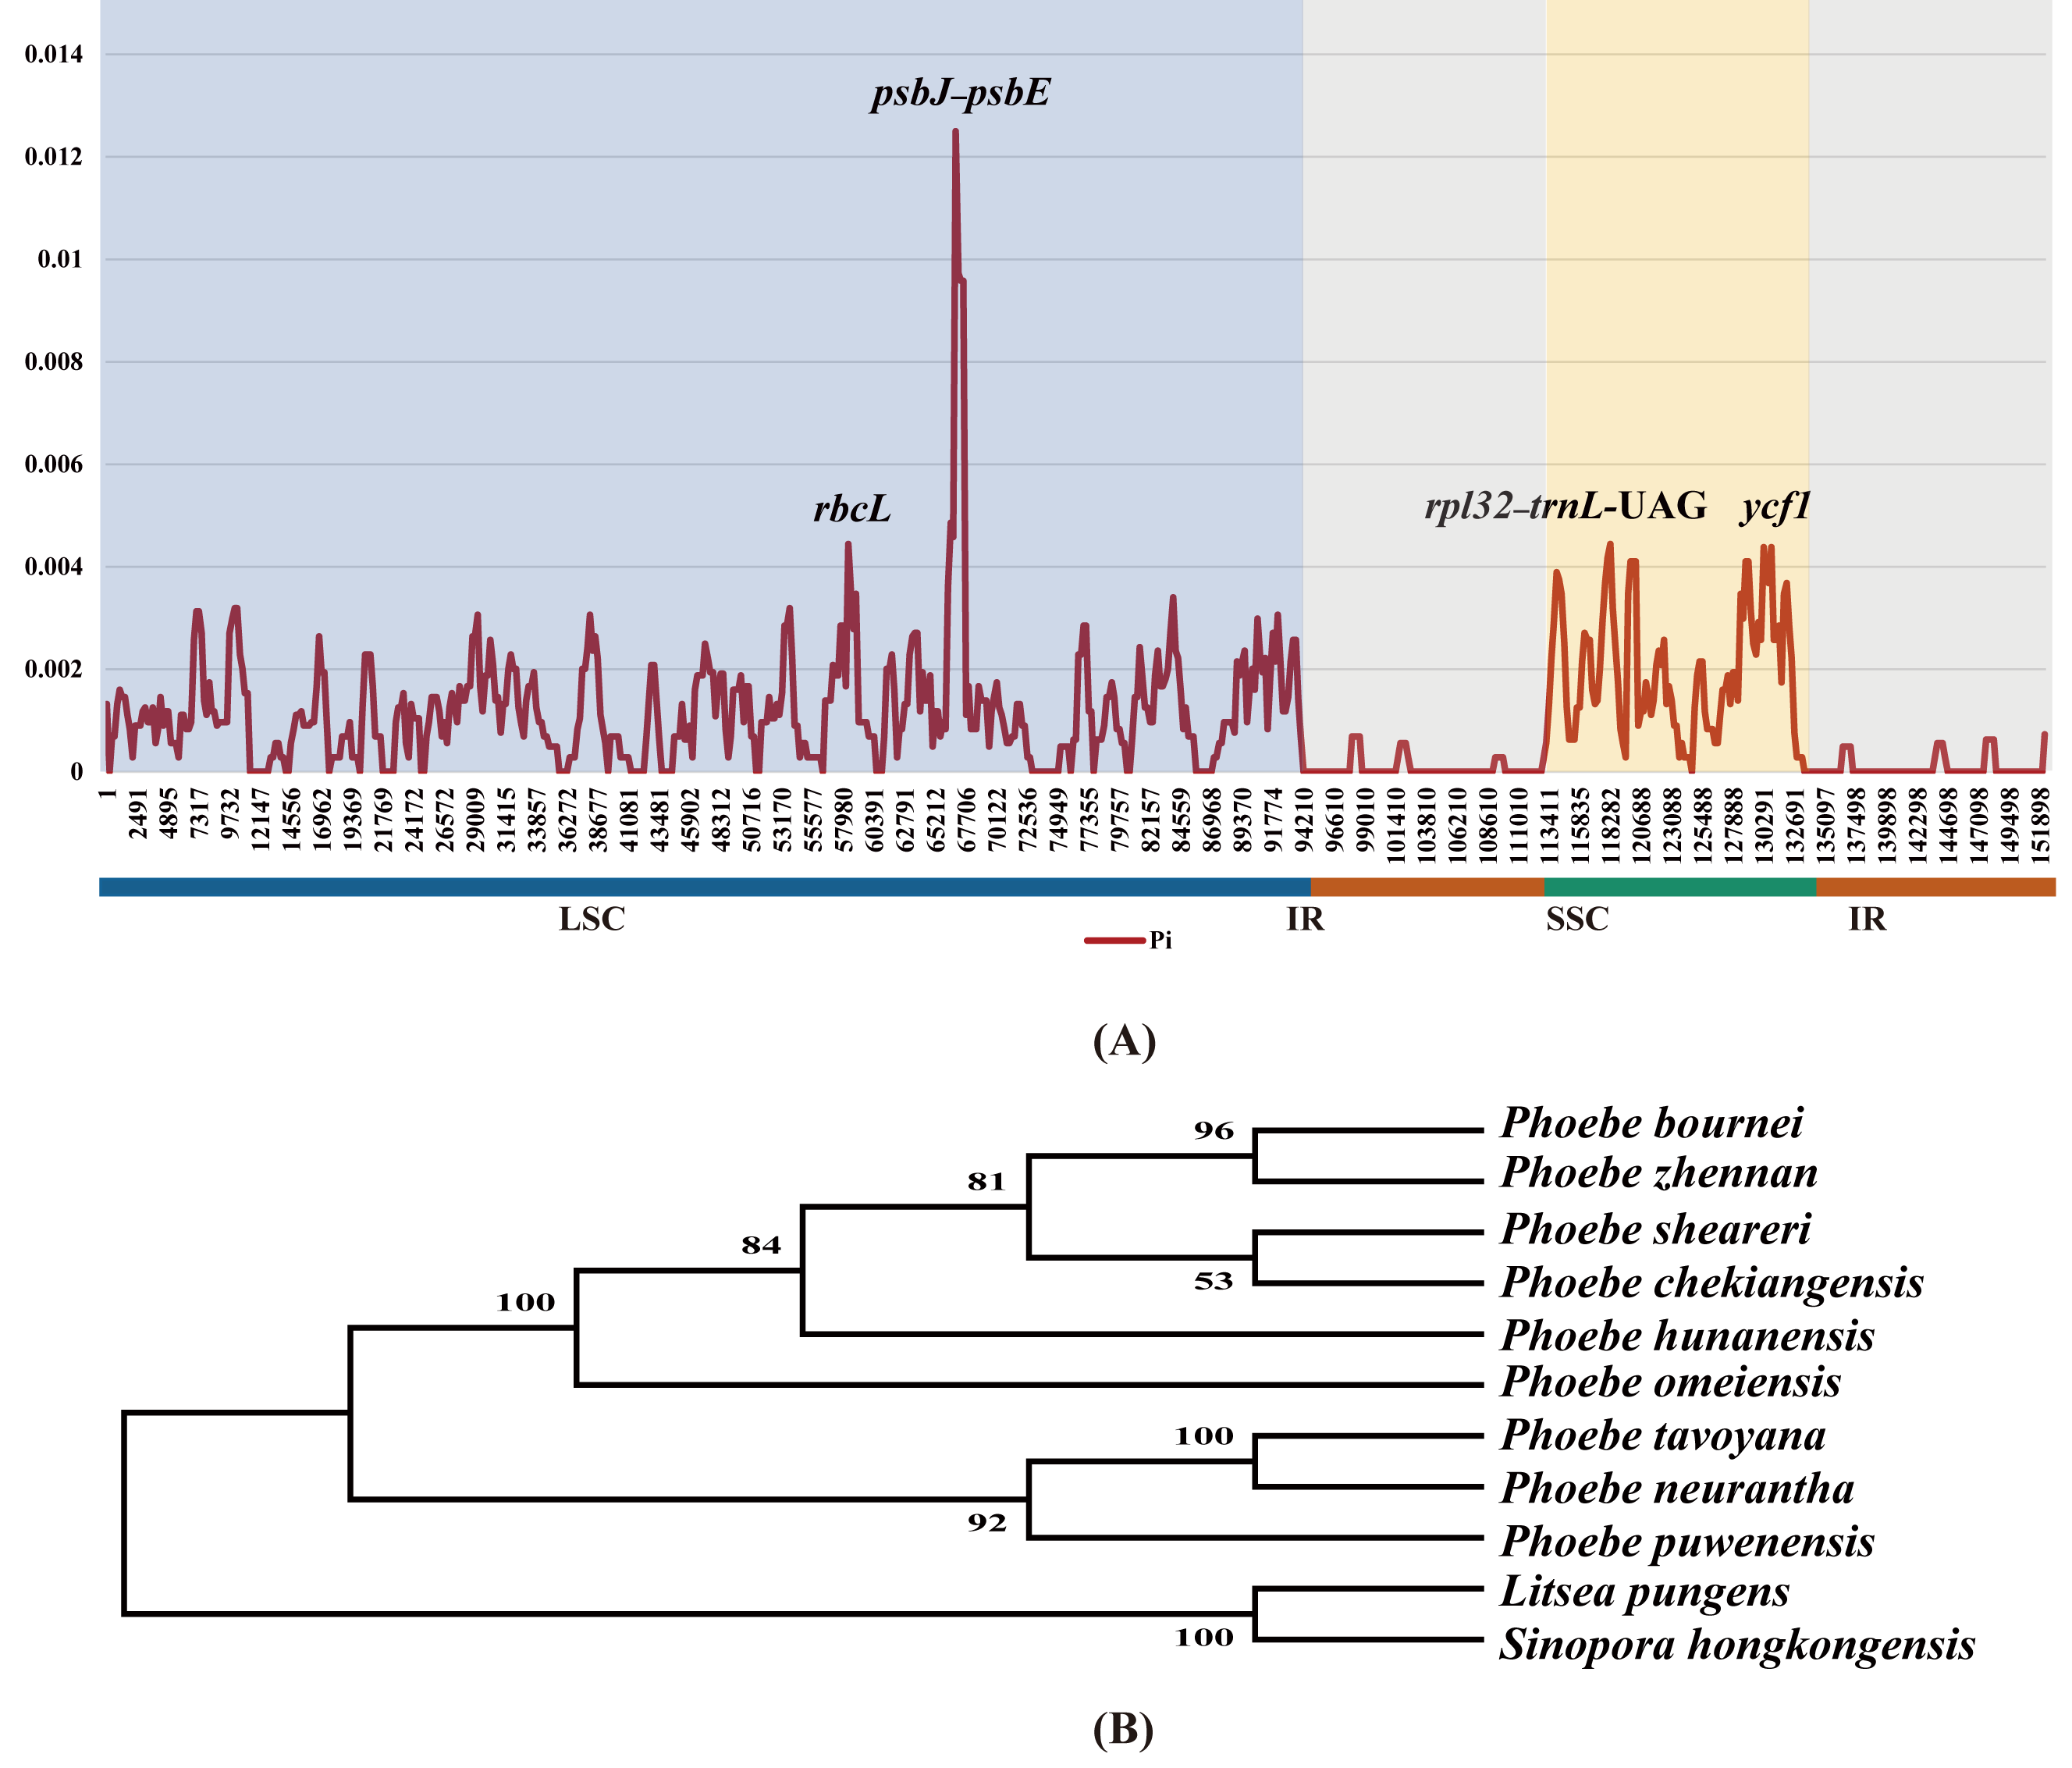
Single nucleotide polymorphisms (SNPs) in the chloroplast genome were not random, but rather clustered into hotspots. The total number of SNPs ranged from 93 to 228, with a mean value of 185.86 (Table 3). The number of transitions was greater than the number of transversions. There were more A/G transitions than C/T transitions, whereas A/C transversions and G/T transversions predominated among transversions. SNPs were more numerous in the LSC region than in the SSC and IR regions. The numbers of InDels varied from 39 to 71, with a mean value of 60.13 (Table S6). There were more InDels in the LSC region than in the SSC region. There were no InDels in the IR regions, except for P. puwenensis. With respect to average InDel lengths, 1.84 bp in the LSC region was also larger than 1.26 bp in the SSC region.
| Species | Region | Transition substitutions | Transversion substitutions | ||||
|---|---|---|---|---|---|---|---|
| A/G | C/T | A/T | A/C | C/G | G/T | ||
| Phoebe hunanensis | Large single copy | 44 | 28 | 5 | 30 | 9 | 25 |
| Phoebe tavoyana | 16 | 11 | 1 | 19 | 2 | 17 | |
| Phoebe bournei | 44 | 25 | 4 | 31 | 7 | 25 | |
| Phoebe chekiangensis | 48 | 27 | 3 | 36 | 7 | 21 | |
| Phoebe omeiensis | 12 | 11 | 2 | 15 | 5 | 10 | |
| Phoebe puwenensis | 27 | 23 | 3 | 24 | 5 | 18 | |
| Phoebe sheareri | 49 | 25 | 4 | 30 | 8 | 27 | |
| Phoebe zhennan | 44 | 25 | 4 | 31 | 7 | 25 | |
| Phoebe hunanensis | Inverted repeat | 2 | 1 | 0 | 0 | 0 | 1 |
| Phoebe tavoyana | 0 | 0 | 0 | 1 | 0 | 0 | |
| Phoebe bournei | 1 | 1 | 0 | 0 | 0 | 1 | |
| Phoebe chekiangensis | 1 | 1 | 0 | 0 | 0 | 1 | |
| Phoebe omeiensis | 1 | 1 | 0 | 0 | 0 | 1 | |
| Phoebe puwenensis | 1 | 1 | 0 | 1 | 0 | 0 | |
| Phoebe sheareri | 1 | 1 | 0 | 1 | 0 | 2 | |
| Phoebe zhennan | 1 | 1 | 0 | 0 | 0 | 1 | |
| Phoebe hunanensis | Small single copy | 20 | 7 | 5 | 6 | 1 | 13 |
| Phoebe tavoyana | 6 | 2 | 3 | 2 | 0 | 5 | |
| Phoebe bournei | 19 | 6 | 4 | 6 | 1 | 11 | |
| Phoebe chekiangensis | 23 | 6 | 4 | 8 | 1 | 13 | |
| Phoebe omeiensis | 20 | 7 | 5 | 6 | 1 | 13 | |
| Phoebe puwenensis | 12 | 5 | 2 | 6 | 1 | 10 | |
| Phoebe sheareri | 19 | 7 | 5 | 7 | 1 | 12 | |
| Phoebe zhennan | 19 | 6 | 4 | 6 | 1 | 11 | |
Phylogenetic analysis
To better understand the phylogenetic relationships among different Phoebe species, phylogenetic trees were constructed based on whole chloroplast genome sequences and a separate dataset of 79 protein-coding genes using maximum likelihood (ML) and Bayesian inference (BI) approaches. ML and BI trees of complete chloroplast genomes and protein-coding genes exhibited similar topologies (Fig. 7). The support values for each branch node in the four phylogenetic trees were also high. In the phylogenetic trees based on both the chloroplast genome (Figs. 7A and 7B) and the protein-coding genes (Figs. 7C and 7D), the Phoebe species were grouped into three branches, with P. minutiflora, P. glaucophylla, and P. macrocarpa forming a monophyletic basal clade. There were some slight differences between the four phylogenetic trees produced from the complete chloroplast genome sequences and protein-coding region sequences, with the most notable one being the relationship of P. omeiensis to other Phoebe species. Furthermore, the position of P. hui varied in different phylogenetic trees. Both trees indicated that P. tavoyana was most closely related to P. lanceolata and that P. hunanensis was most closely related to P. formosana. In these phylogenetic trees, almost all Phoebe species from Yunnan form the basal group. Phoebe species from southwestern China were clustered together into one branch, while Phoebe species from central and southeastern China were clustered together into another branch (Fig. 7).
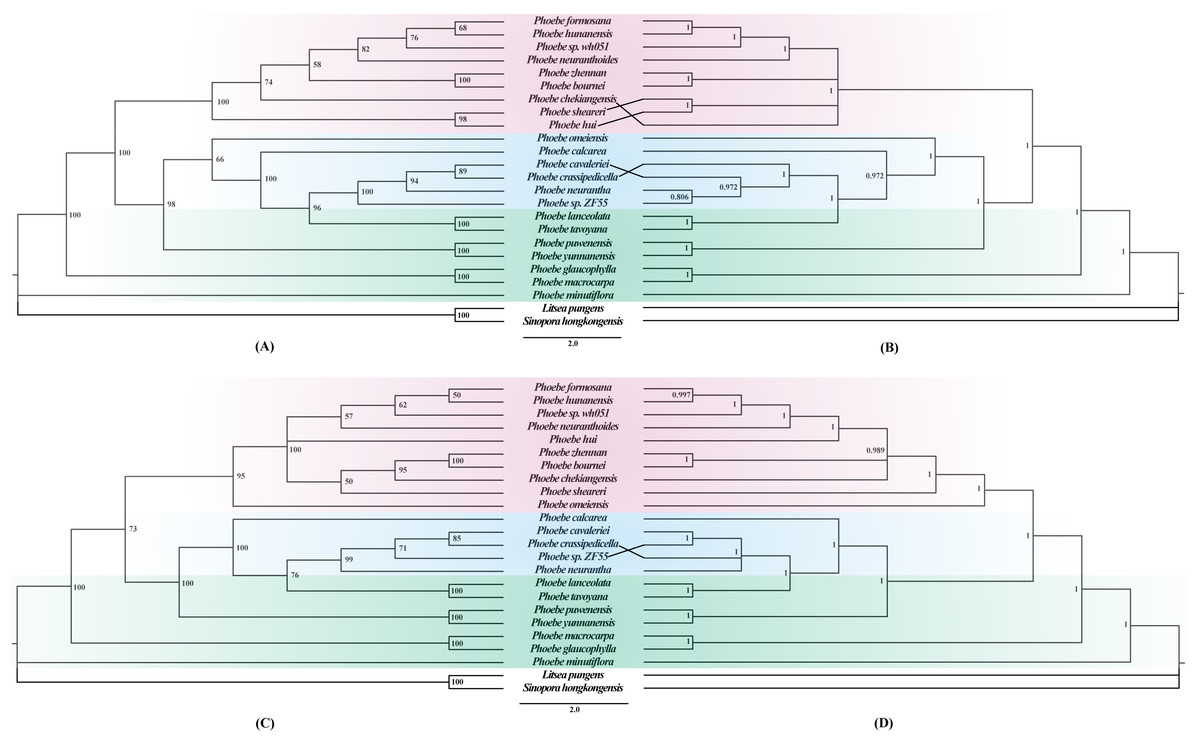
Figure 7: Phylogenetic trees constructed using the maximum likelihood (ML) and Bayesian inference (BI) methods based on the complete chloroplast genomes and protein-coding genes of 22 Phoebe species.
Litsea pungens and Sinopora hongkongensis were used as outgroups. Support values are indicated by the numbers above the nodes, ML bootstrap values are indicated by the numbers in (A) and (C), and Bayesian posterior probability (PP) values are indicated by the numbers in (B) and (D).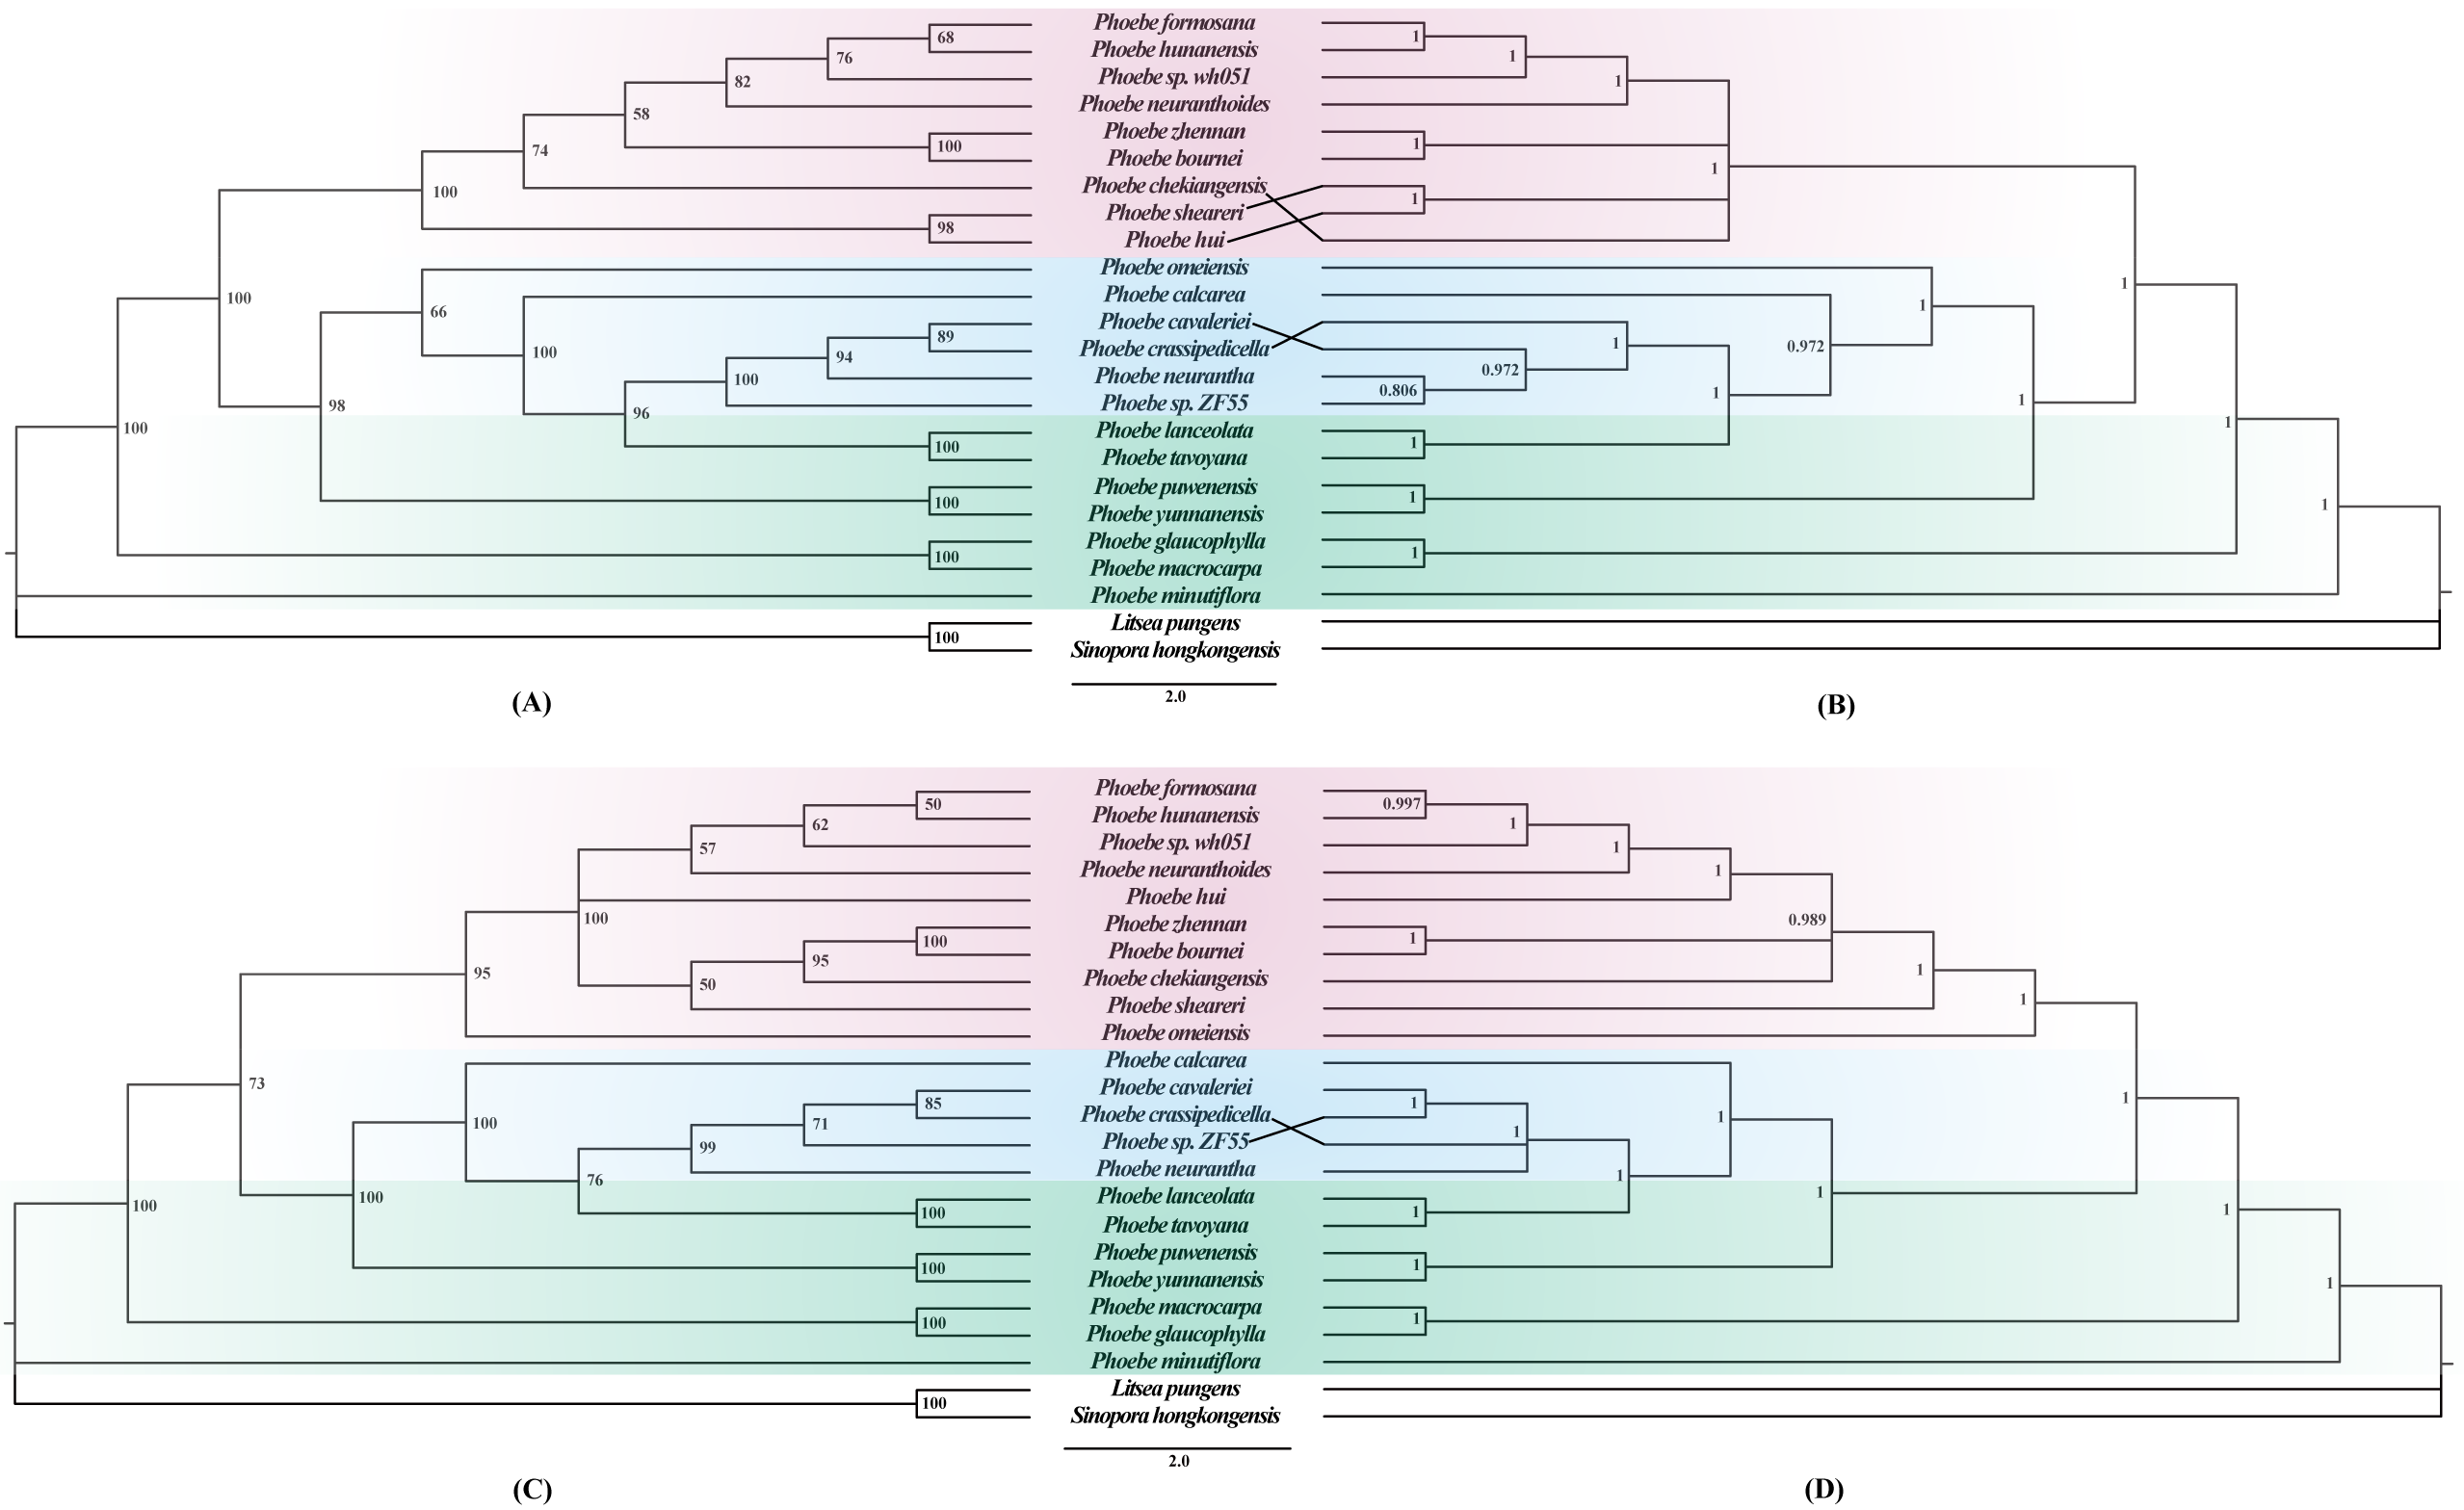
Phylogeographical analysis of Phoebe species in China
The four phylogenetic trees indicated a clear pattern in the origin and dispersal of these Phoebe species. To further validate the pattern, we used the ancestor reconstruction software RASP to forecast the origin and dispersal of Phoebe species in China utilizing S-DIVA and BBM methodologies. The 22 Phoebe species in China were grouped into three geographic regions according to their distributional ranges: (A) Yunnan, China; (B) southwestern China; (C) central and southeastern China. As it was not possible to determine the suitability of the distribution of the outgroup, we set it to D. The results of the S-DIVA and BBM ancestral reconstructions were similar (Figs. 8A and 8B). The results of both analytical methods broadly divide the 22 Phoebe species in China into two clades. Ancestors of one clade were primarily concentrated in Yunnan, whereas those of the other were located in central and southeastern China. Several nodes, including 32, 34, 38, 39, 41, and 42, had multiple ancestral distributions that varied across the two analytic approaches (Table S7). The ancestral components of nodes 32 and 34 were complex. The highest ancestral probability at node 32 of both analysis methods was the C distribution type. In contrast, the A distribution type was highest in the BBM analysis at node 34, while the AC distribution type was highest in the S-DIVA analysis. Based on the complete chloroplast genome of Phoebe species in China, S-DIVA and BBM analyses revealed that Yunnan was the ancestral region of the basal taxa of Phoebe species. Thus, it can be reasonably inferred that Yunnan is the origin of the genus Phoebe, from which species in southwestern China and southeastern China, respectively, diversified (Fig. 8C).
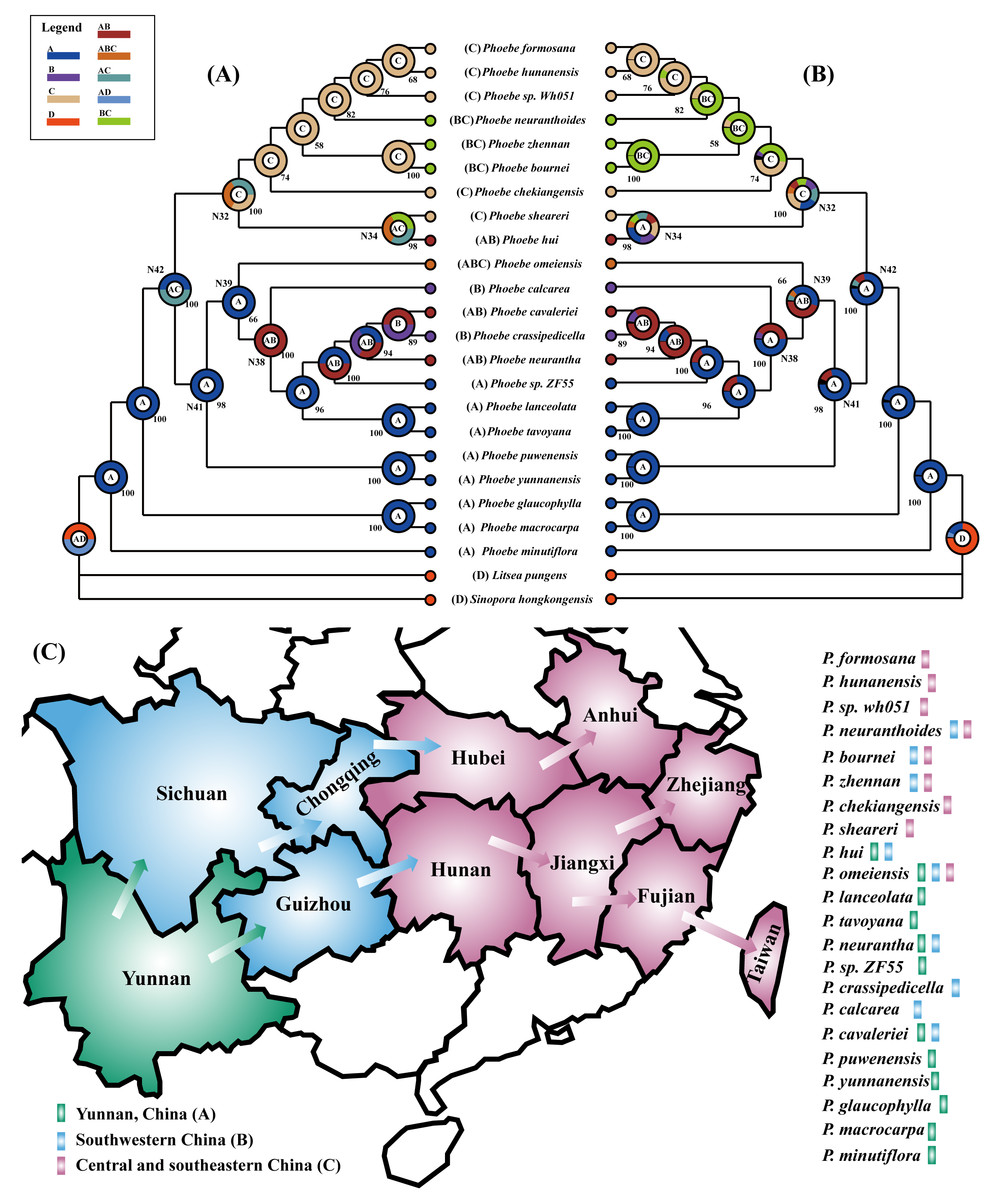
Figure 8: Phylogeographical analysis of Phoebe species in China.
Using the ancestor reconstruction software RASP to forecast the origin and dispersal of Phoebe species in China utilizing S-DIVA (Statistical Dispersal-Vicariance Analysis) and BBM (Bayesian Binary MCMC) methodologies. The letters A, B, C, and D in the legend at the upper left stand for Yunnan, southwestern China, central and southeastern China, and distribution of outgroups, respectively. The combination of these distribution sites is represented by a string of letters. The letter inside the circle represents the ancestral distribution with the highest probability of branching at that node. (A) Results of ancestral distribution area reconstruction using the S-DIVA method. (B) Results of ancestral distribution area reconstruction using the BBM method. (C) Diagram of the origin and dispersal of Phoebe species in China. Green represents Yunnan Province, China, blue represents southwestern China, and pink represents central and southeastern China. The arrows represent the direction of dispersal. The different colors of the rectangle after the species name represent the geographical distribution of each Phoebe species.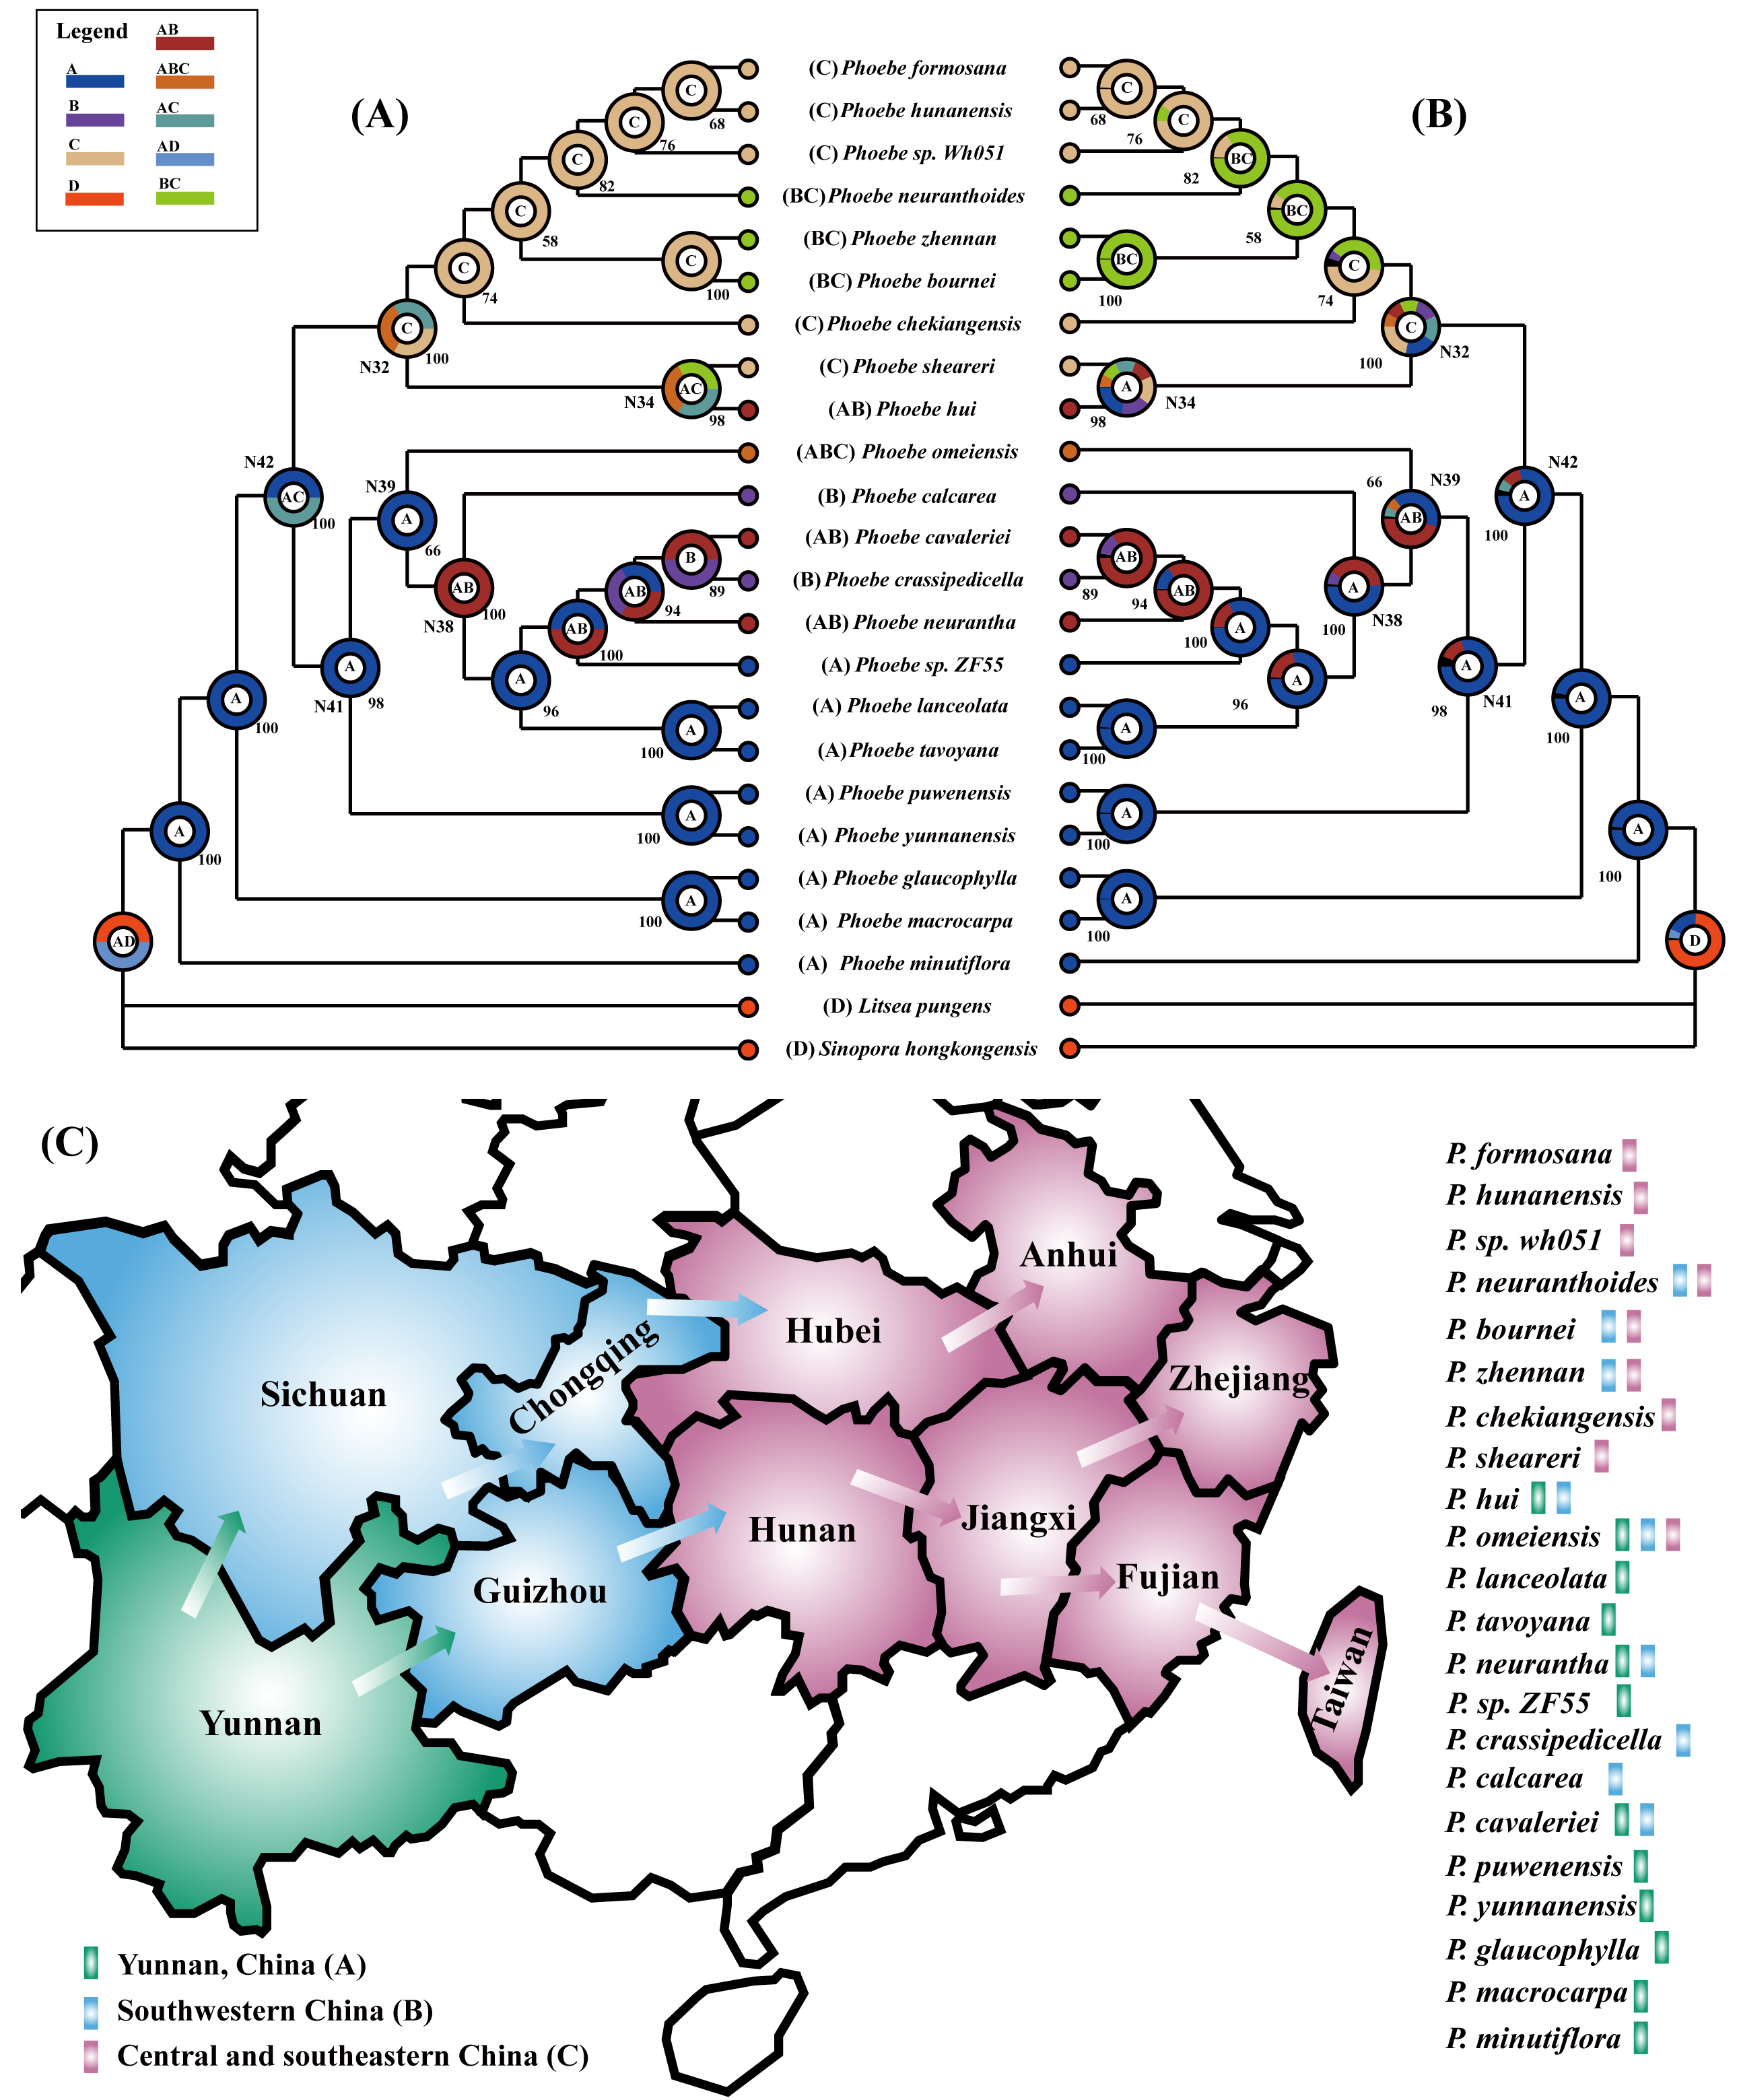
Discussion
Characterization of chloroplast genomes in Phoebe
In this study, we first performed a comparative analysis of Phoebe chloroplast genomes. No obvious differences were found among the structures and sequences of these Phoebe chloroplast genomes. The chloroplast genome size of nine species of Phoebe measured 152,746–152,876 bp, similar to those of other species in the family Lauraceae (Song et al., 2018; Zhao et al., 2018; Ge et al., 2019). The percentage of chloroplast genome content and gene order in Phoebe species were similar to those previously reported in angiosperms (Tian et al., 2018; Zhang et al., 2021). In comparison with AT base pairs, GC base pairs are more thermodynamically stable (Wang et al., 1984), whereby the influence of GC content on chloroplast genome stability is greater (Yang et al., 2022). The chloroplast genomes of Phoebe species had a total GC content of 39.1%, consistent with the genomes of Alseodaphne, Cinnamomum, and Litsea (Chen et al., 2017; Hinsinger & Strijk, 2017; Song et al., 2018). The similar GC content has apparently ensured the stability of the chloroplast genomes in Lauraceae species. SSRs were widely present in the chloroplast genomes, generally in the form of tandem repeats with 1–6 nucleotide motifs (Kim, Lee & Choi, 2021). In the present study, the quantity of SSRs ranged from 209 to 215, with mononucleotide repeats being the most abundant. The mononucleotide SSRs were significantly abundant in A/T repeats. The SSRs of the chloroplast genomes of Phoebe species generally consisted of thymine or adenine repeats, while cytosine and guanine repeats were rare, which was consistent with a previous study of Lauraceae (Chen et al., 2017). Repeat sequences have been mentioned in previous studies as playing a vital role in the rearrangement, stabilization, and phylogenetic analysis of chloroplast genomes (Cavalier-Smith, 2002; Nie et al., 2012). The palindromic and forward repeats were the dominant repeat types in the Phoebe chloroplast genome, suggesting that palindromic and forward repeats were more favorable to the regulation of gene expression during the evolution of Phoebe species (Koller & Delius, 1982). Similar to previous studies, the long repeat sequences were mainly positioned in the intergenic spacer and intron regions (Ge et al., 2019; Abdullah Mehmood et al., 2020). The LSC region has been previously determined to contain a large number of intergenic sequences (Ruang-Areerate et al., 2021), and there were a large number of repetitive sequences in the LSC region compared to the IR and SSC regions in the present study. The amino acids in an organism can be encoded by two or more codons in general owing to codon degeneracy (Zuo et al., 2017). Codon bias and the accumulation of substitutions that optimize codon use have played a significant role in the evolution of the chloroplast genome (Shahzadi et al., 2020). RSCU is the ratio of the frequency a synonymous codon has been used to the frequency that was expected, which can be used as a meaningful indicator of codon bias (Mo et al., 2020). Among all codons, AGA had the highest RSCU value (1.84), and the high RSCU value could be related to the function of the arginine being encoded by AGA, which could be associated with avoiding transcriptional errors (Gao et al., 2019). We performed an estimation of evolutionary rates for 79 unique protein-coding genes. The results indicated that most genes were selected by purification. Only two genes, the ycf2 gene in P. zhennan and the rpl16 gene in P. tavoyana, were under positive selection. Based on earlier evolutionary assessments of Litsea species (Song et al., 2022b) as well as Phoebe species here, the majority of the coding genes in Lauraceae species remained stable during the evolution process, except for ycf2 and rpl16 genes. The comparative analysis revealed that the chloroplast genomes of Phoebe were relatively conserved, which could practically inform future studies on Lauraceae species.
Chloroplast genomic divergence among Phoebe species
Although the chloroplast genomes were relatively conserved, divergence was still observed. The mVISTA results indicated a high degree of sequence similarity among the chloroplast genomes of Phoebe species, which was similar to results in other Lauraceae studies (Ge et al., 2019; Wang et al., 2021b). The divergence among chloroplast genome sequences was mainly concentrated in the LSC and SSC regions, with relatively low diversity in the IR regions. The non-coding regions were more divergent than the coding regions. These phenomena were also identified in angiosperms more broadly (Yao et al., 2015; Zhang et al., 2016). In the intergenic regions, the psbM–trnD-GUC, petA–psbE, and ndhF–rpl32 regions were highly divergent, while the coding regions were relatively conserved except within ycf2, which could thus be used for species identification. Although the genes in the IR regions are highly conserved (Shen et al., 2017), it is very common for the IR/SC boundaries to contract and expand (Terakami et al., 2012; Yang et al., 2016). Contraction and expansion of the IR/SC boundaries can promote the divergence of genes in the chloroplast genome, leading to gene deletion and pseudogene creation, which can be used in phylogenetic analysis (Li et al., 2019). Pseudogenes and gene deletions emerged at JLA and JSB in the Phoebe species, according to analysis of genes surrounding the IR/SC boundaries in the chloroplast genomes. No variation was observed at JLB and JSA. This result suggested that JLA has evolved through expansion and contraction, whereas JLB has been far more conserved (Vaillancourt & Jackson, 2000). At JLB, the pseudogene ycf2ψ of P. neurantha was lost. The ycf1 gene was located at JSA, whereas its corresponding pseudogene ycf1ψ copy was found at JSB. Notably, this pseudogene ycf1ψ copy was missing from P. neurantha and P. puwenensis, which agrees with previous studies showing that the ycf2 and ycf1 genes in the chloroplast genome were associated with the divergence of the IR/SC boundaries and tended to be pseudogenes (Huang, Chen & Li, 2017; Gu et al., 2018; Ge et al., 2019). The detection of highly variable regions and the calculation of nucleotide diversity could quantify divergence in the chloroplast genome at the sequence level (Li et al., 2020). The petA–psbE and rpl32–trnL-UAG regions and rbcL and ycf1 were determined to have high Pi values. These regions could be experiencing accelerated nucleotide substitutions at the species level, which demonstrates their potential as molecular markers with applications in plant identification and phylogenetic analysis (Suo et al., 2016). In addition, to validate the efficiency of hotspots, we extracted the corresponding sequences to construct a phylogenetic tree. The phylogenetic results supported the prior phylogenetic study using complete chloroplast genomes (Zhang, Li & Wang, 2020), indicating that corresponding sequences are available for phylogenetic analysis. The study of structural variation in the chloroplast genome was important for the study of species evolution (Sebbenn et al., 2019). The SNPs and InDels were shown to be more informative than chloroplast DNA fragments in the inference of species delimitation and population studies at different taxonomic levels (Song et al., 2017a; Zhou et al., 2020). The results of analyses of SNPs and InDels suggested that microstructural mutations in the IR regions were very rare, as demonstrated in previous studies (Yang et al., 2016; Li et al., 2017).
Phylogenetic analysis and biogeographic origin of Phoebe species in China
Over the years, the chloroplast genome played an important role in the analysis of phylogenetic relationships among closely related species and in illustrating patterns of evolution among angiosperms (Jansen et al., 2007; Kim et al., 2015). So far, phylogenetic analyses of the genus Phoebe have been based only on highly variable markers (Song et al., 2017a). To obtain a more reliable result, several studies have constructed phylogenetic trees using complete chloroplast genome sequences and protein-coding regions and compared them to analyze the phylogenetic relationships among species (Sheng et al., 2021; Song et al., 2022c). In the present study, Phoebe species were all divided into three branches in the phylogenetic trees based on their chloroplast genomes and protein-coding genes. Phylogenetic analysis revealed that P. tavoyana belonged to the basic clade and P. hunanensis was in the apical clade. The outcomes provided by the ML and BI trees differed little as well. However, there were some slight differences between the phylogenetic tree of complete chloroplast genomes and phylogenetic tree of protein-coding genes. P. omeiensis was distributed among different sub-branches in the trees. P. omeiensis was sister to P. neurantha in a previous study (Zhang et al., 2021) that constructed a phylogenetic tree based on complete chloroplast genomes, while P. omeiensis was sister to P. sheareri in another study (Ge et al., 2019) which constructed a phylogenetic tree using protein-coding genes. Comparatively, we discovered that both the ML tree and the BI tree had greater support values for the phylogenetic tree constructed from the complete chloroplast genome. Such different trees could originate from substitutions in the intergenic spacer regions, which illustrates the importance of non-coding regions in the phylogenetic analysis. The 22 Phoebe species found in China have been divided into three clades for the first time using a phylogenetic tree built utilizing the complete chloroplast genome and protein-coding genes. The study of genetic diversity is essential for biodiversity conservation (Cruz et al., 2012).
We found a pattern regarding the phylogenetic analysis of Phoebe species endemic to China in the three branches. All Phoebe species in the basal branch are distributed in Yunnan Province, China. Phoebe species within another branch are widespread in southwestern China, while Phoebe species in the other branch are spread across central and southeastern China. To further validate the pattern, we used RASP to carry out a phylogeographical analysis of the Phoebe species in China. Based on the complete chloroplast genome of Phoebe species in China, S-DIVA and BBM analyses showed that Yunnan is the center of origin and divergence of Phoebe species in China. We have developed assumptions about the origin and dispersal routes of Phoebe species in China based on the RASP results. We infer that the Phoebe species in China originated in Yunnan, which is known as a cradle of plant diversity (Qian et al., 2020). Subsequently, Phoebe species spread from Yunnan to southwestern China. Finally, Phoebe species spread from southwest China to central and southeastern China. Environmental variation has played a significant role in speciation and species diversity (Schluter & Pennell, 2017). Our results have indicated that geographical isolation has resulted in genetic diversity among Phoebe species. The findings of this study serve as a foundation for further investigation into the origin and evolution of the diversity of Phoebe species in China, which should be taken into account in future biodiversity conservation plans.
Conclusions
In this study, we conducted the first comprehensive comparative analysis of the chloroplast genomes of diverse Phoebe species. We characterized chloroplast genomes of various Phoebe species in China. Despite the conserved nature of chloroplast genomes, we detected some highly divergent intergenic regions (petA–psbE, ndhF–rpl32, and psbM–trnD-GUC) as well as three highly divergent genes (rbcL, ycf1, and ycf2) that have potential applications in phylogenetics and evolutionary analysis. In addition, the ycf1 and ycf2 genes in Phoebe species were associated with the divergence of the IR/SC boundaries and tended to be pseudogenes or missing. The results of phylogenetic analysis indicated that various Phoebe species in China were divided into three clades. The complete chloroplast genome was better suited for phylogenetic analysis of Phoebe species. Based on phylogeographical analysis of Phoebe species in China, we infer that the Phoebe species in China have their evolutionary origin in Yunnan. The results of this study should be utilized in future conservation plans for Phoebe species diversity and studies of the evolution of the genus.