Traducción al español disponible a continuación
Written by Julie Huber and Dave Butterfield
Given bad weather to the north at the Kane Fracture Zone, we decided to test our strategy for finding active hydrothermal vents at the Puy de Folles vent field. Previous work by French and Russian colleagues at this site focused on inactive (extinct) sulfides, and some water column signatures of hydrothermal activity were also detected, yet nobody had observed seafloor hydrothermal venting. Well, we found it! So how did we do it?
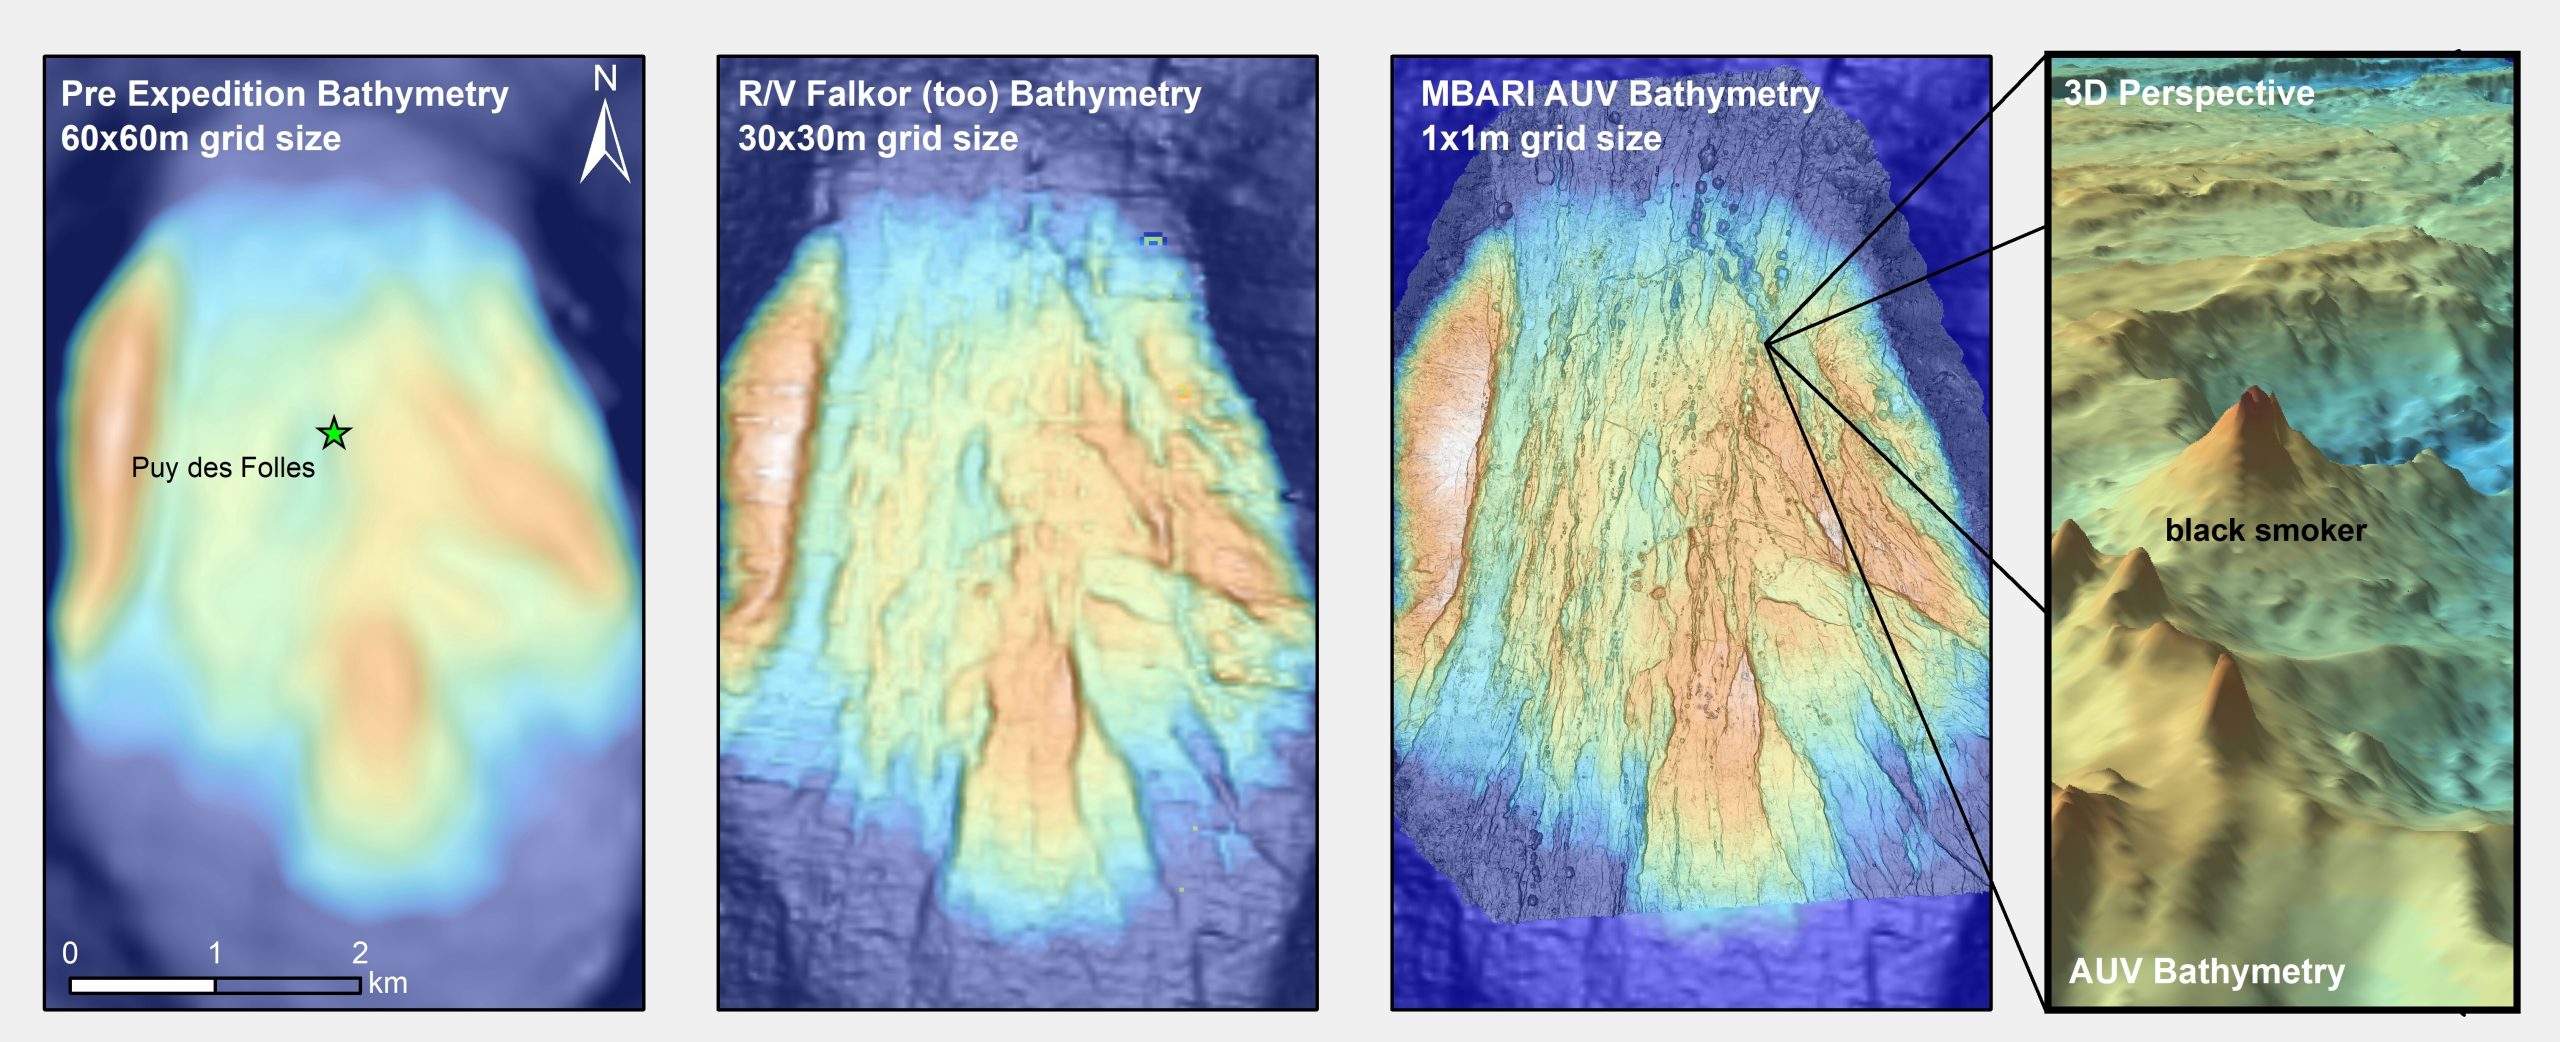
First, we made a map using R/V Falkor (too)’s multibeam sonar. This gave us improved bathymetry to guide the rest of our mission and tasks, just like a seafloor roadmap. As you can see by comparing the first and second panels in this image, the new and improved bathymetry has revealed a complex geologic history of the Puy de Folles seamount. Tectonic extension has severely deformed the top of the edifice through pervasive normal faulting, but we still needed more data to find dive targets.
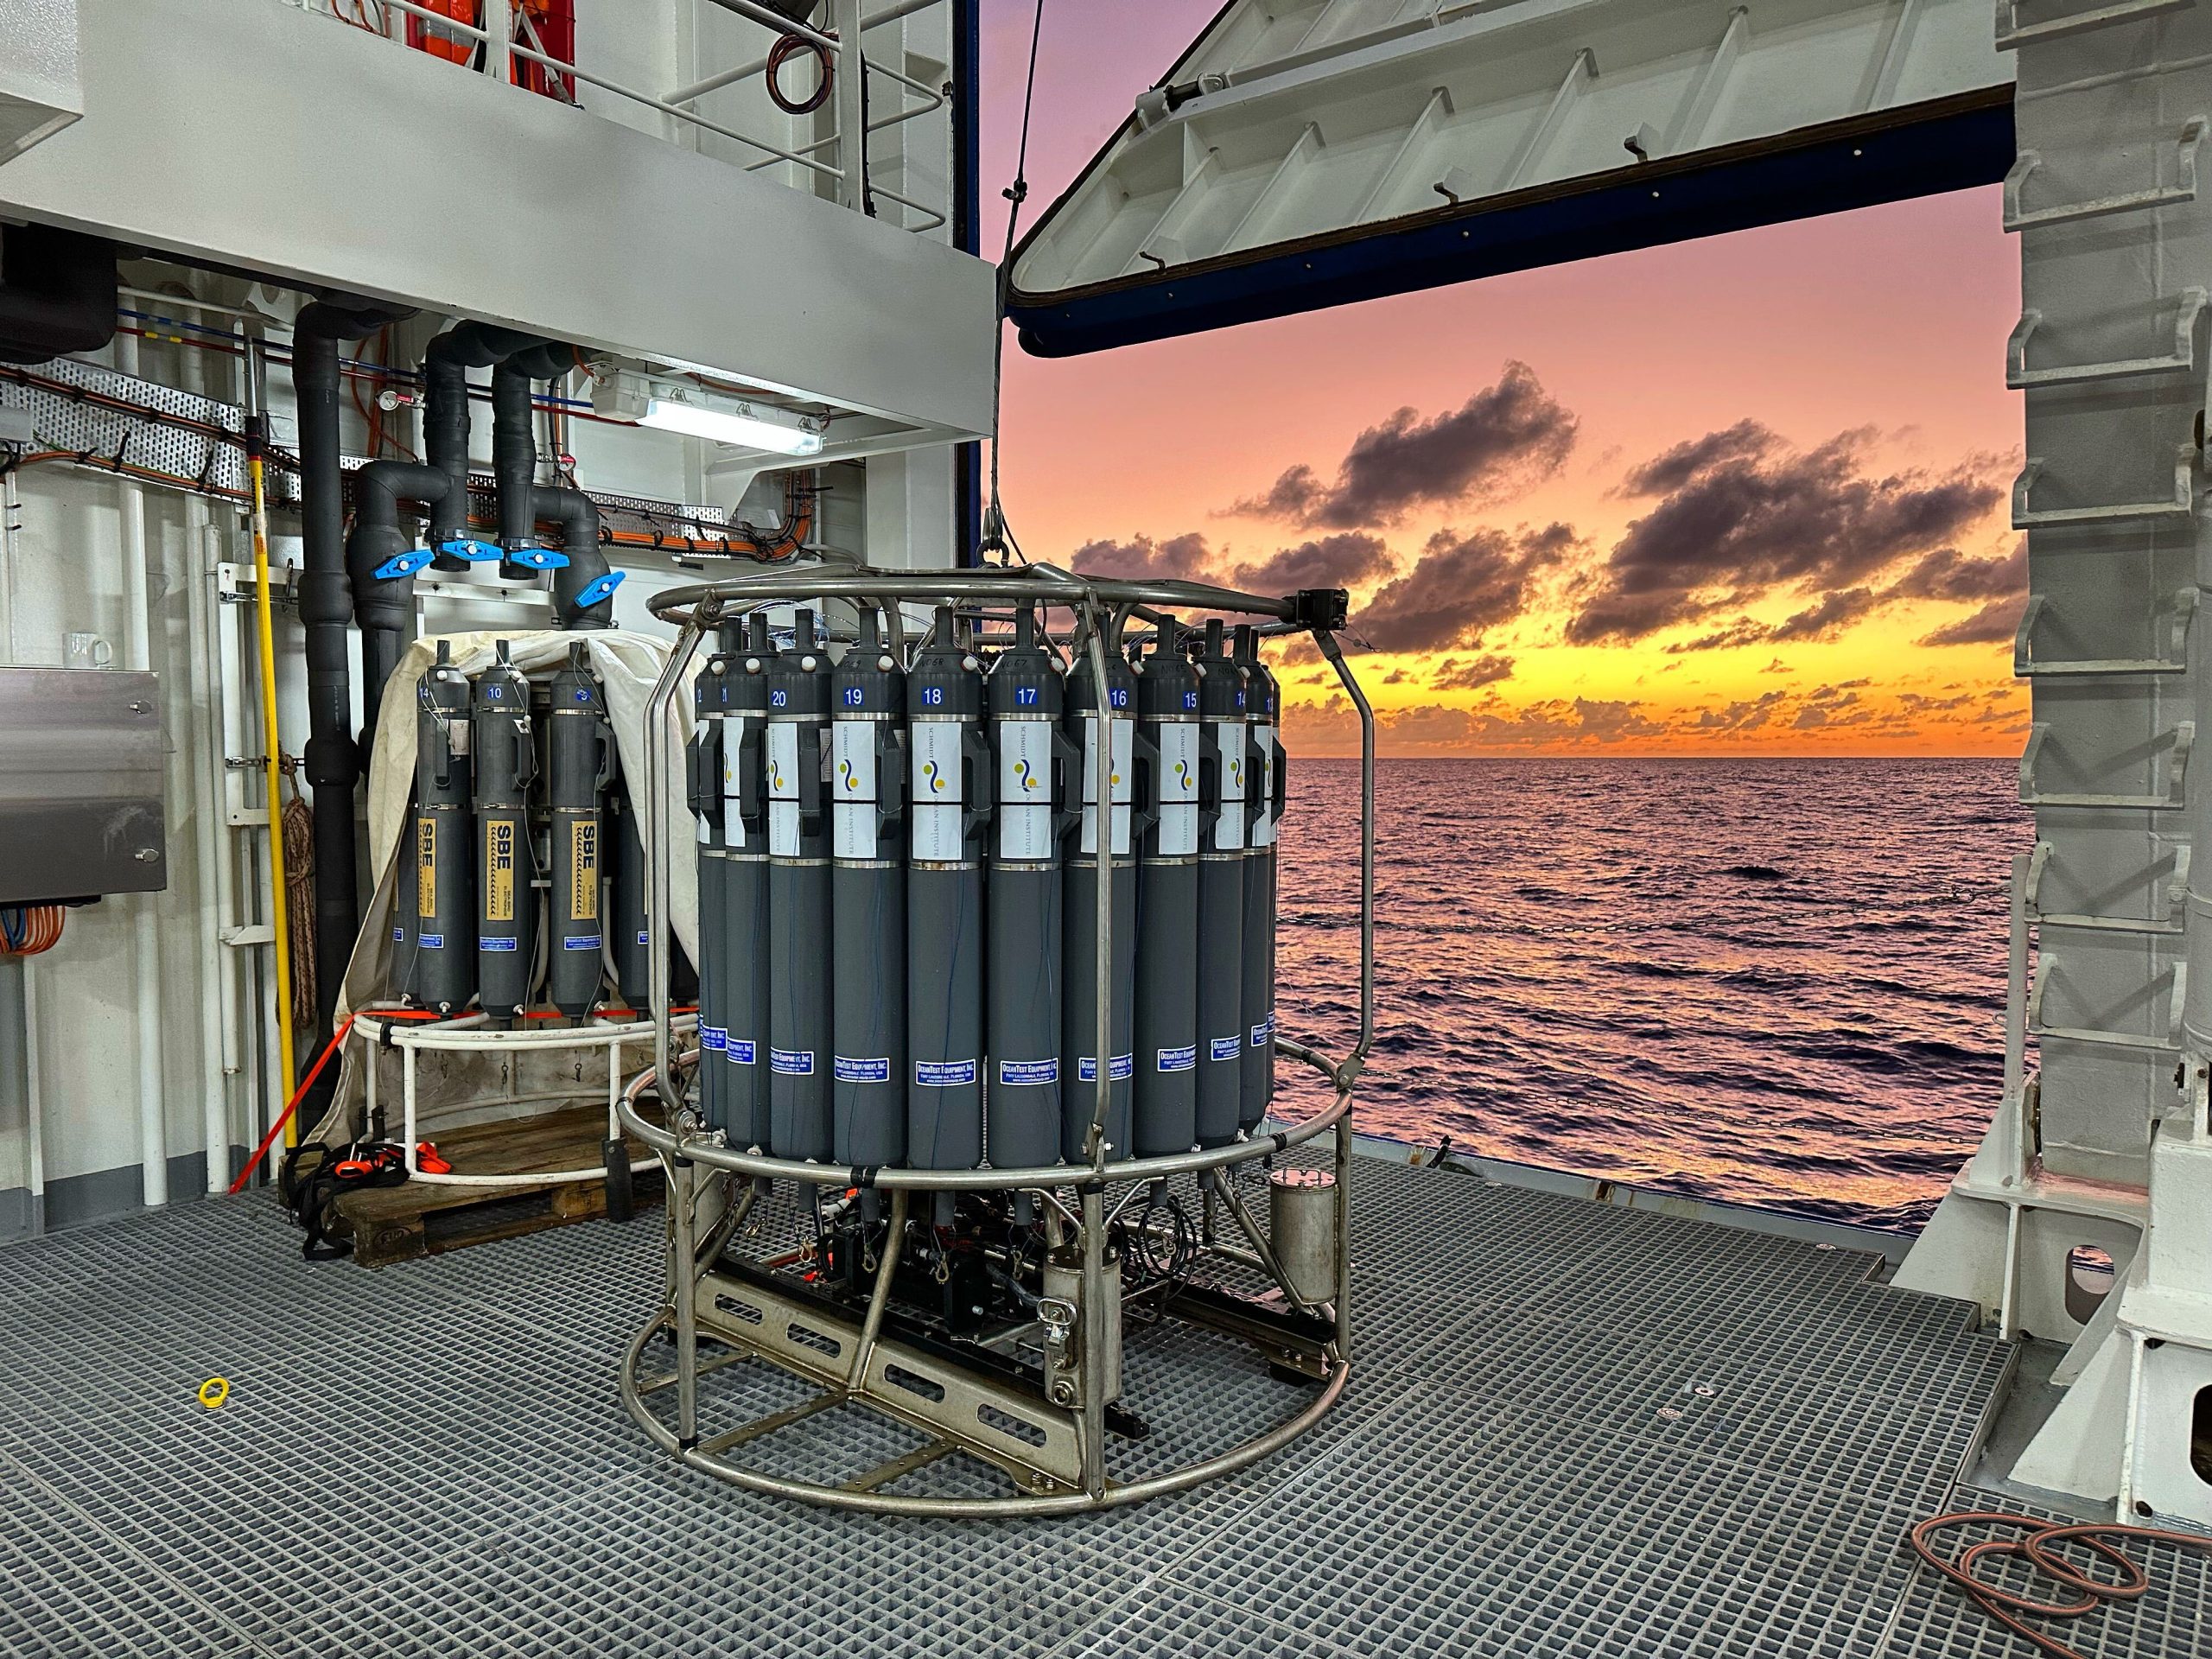
Next, we carried out a CTD (Conductivity-Temperature-Depth) Tow-Yo, which involves using an instrument package on a wire to look for tracers of hydrothermal activity, such as changes in temperature or particle content, as well as collecting water samples for gas and chemical analyses shipboard. We tow the CTD with the ship, moving up and down in the water column, looking for hints of activity. One special tool we brought with us is a chemical sensor called an Oxidation-Reduction Potential sensor, or ORP.
The sensor is very sensitive to changes in chemistry and when the reducing conditions (hydrogen, methane, hydrogen sulfide, etc) of a vent plume are detected, the sensor values go down, meaning we are close to a source. Together with particle content and seafloor features, we can further narrow down the source of the anomaly. Over the last two days, we carried out two tow-yos, one South-North across the summit and another West-East. In both cases, we saw increases in particles, decreases in ORP, and shipboard samples had both hydrogen and methane.
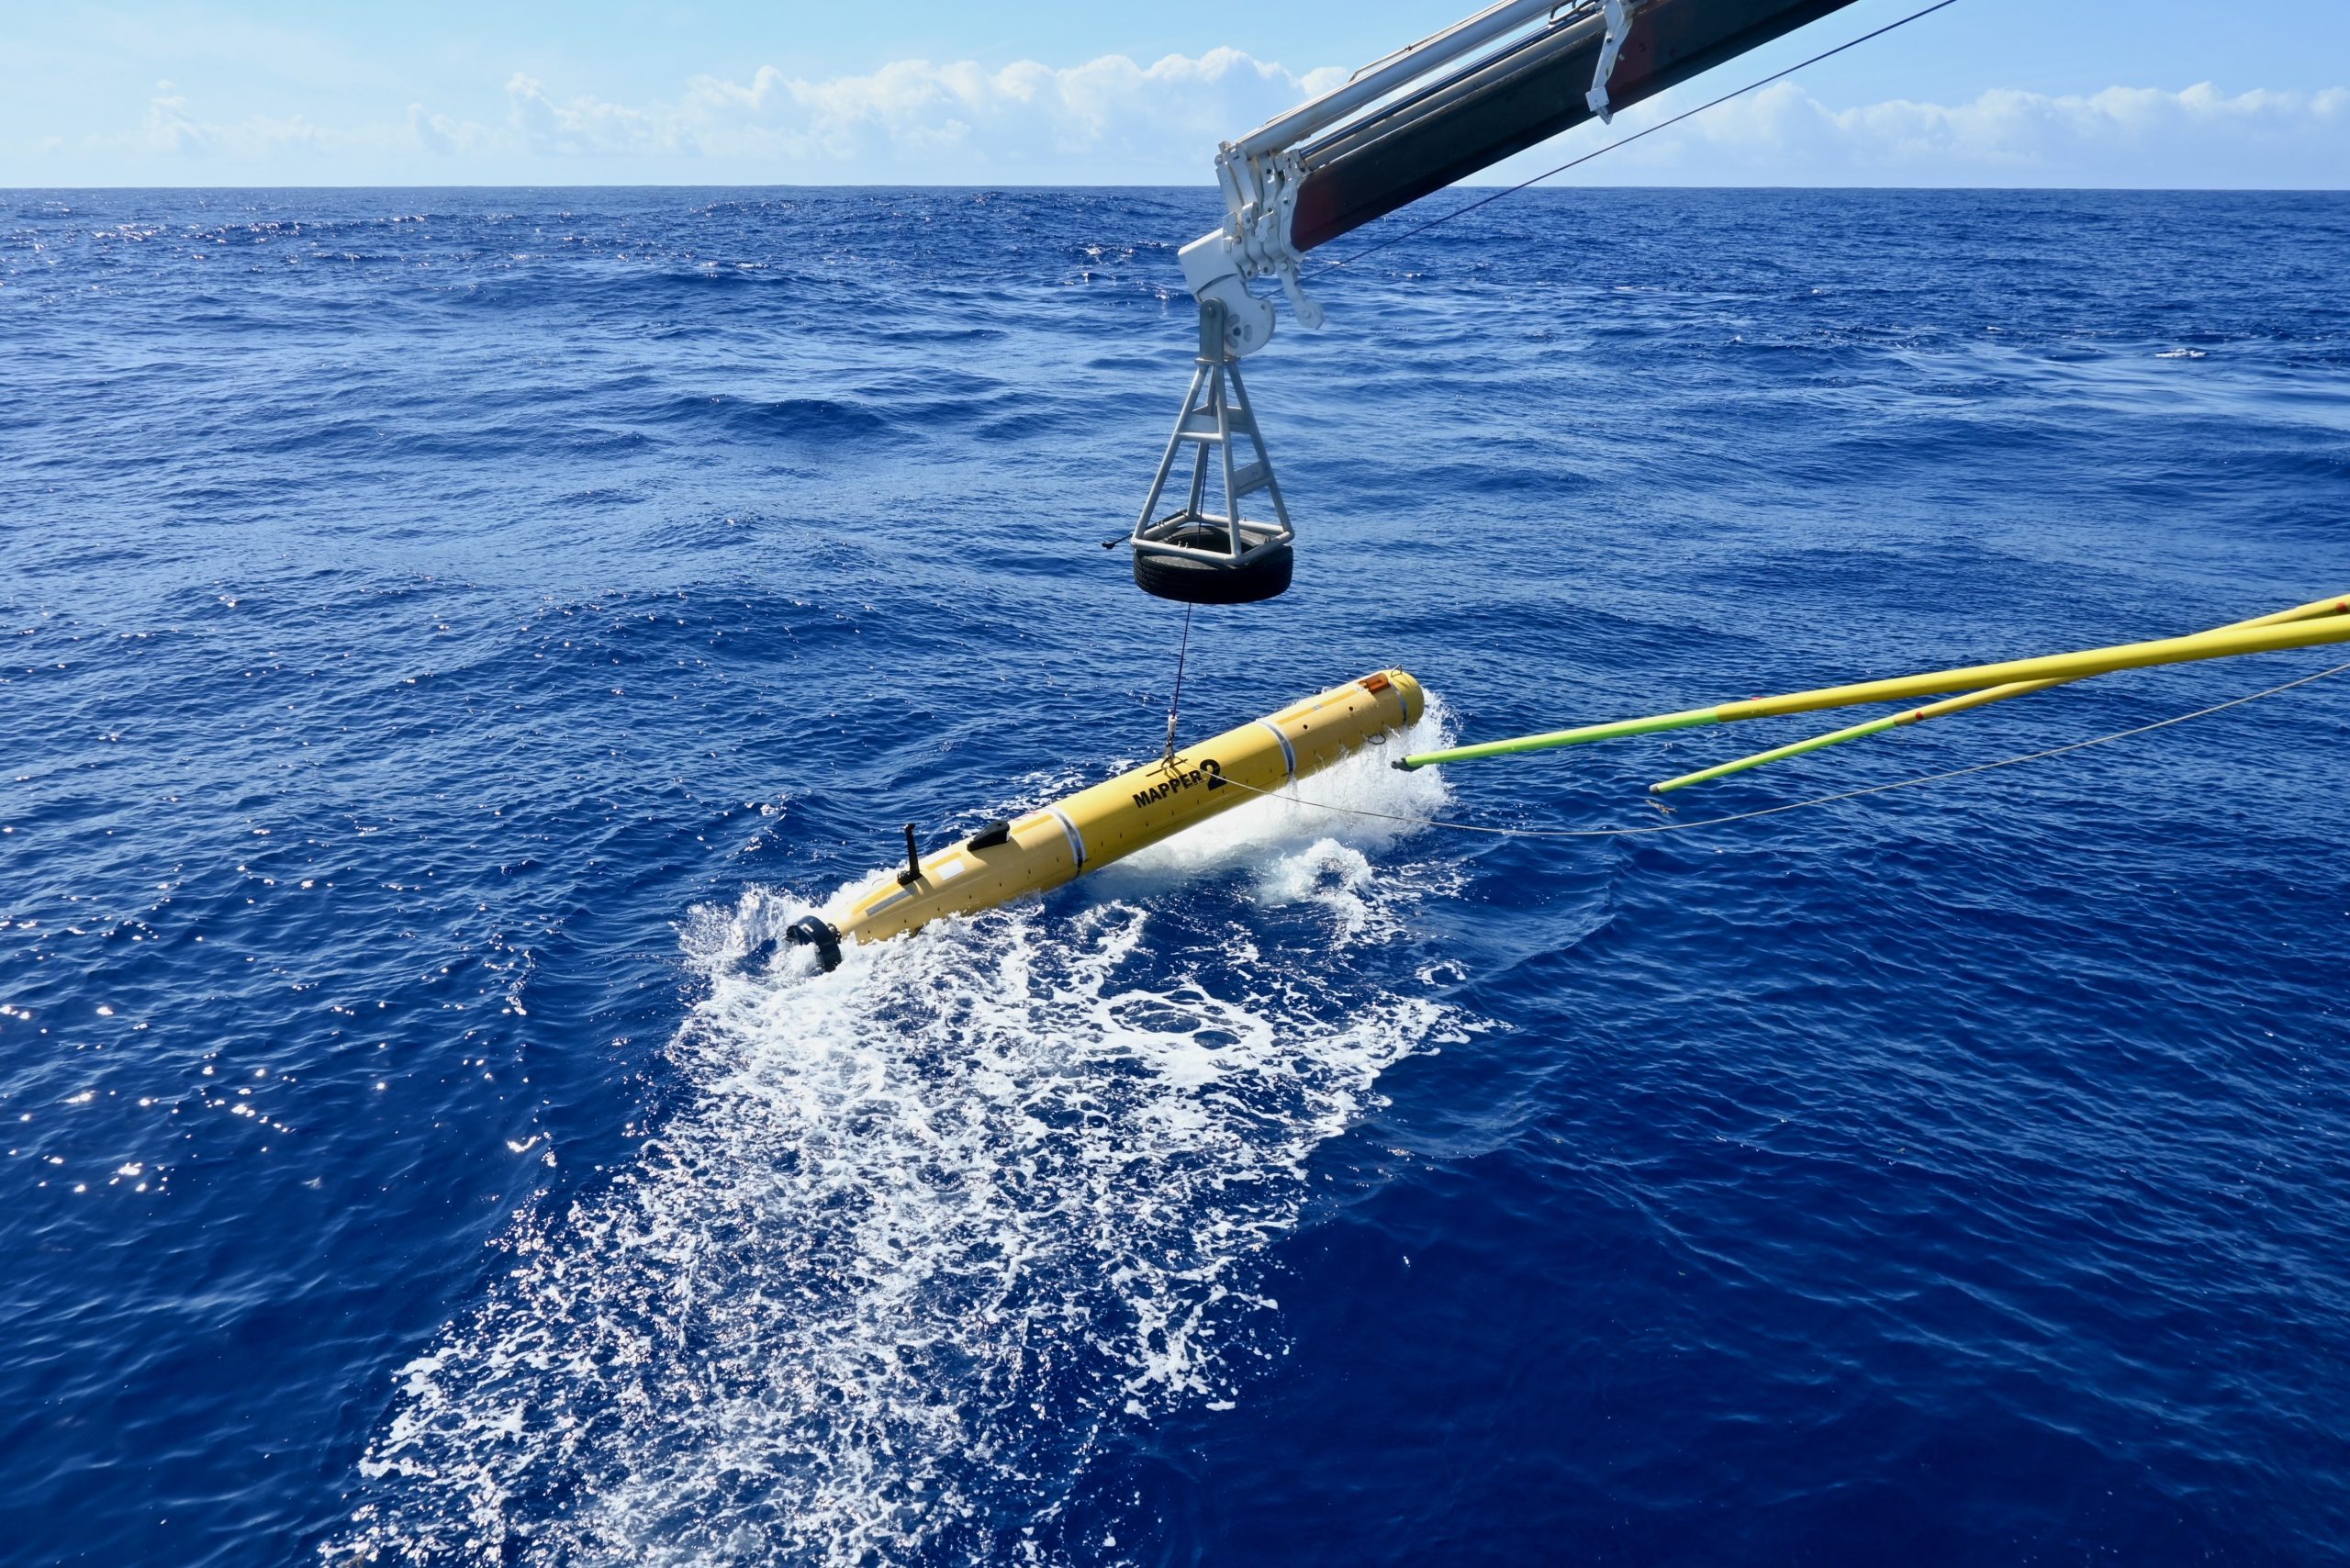
After the first tow-yo, we deployed our two mapping Autonomous Underwater Vehicles (AUVs) from MBARI outfitted with multiple sensors (ORP, temperature, suspended particle concentrations, and pressure) to both produce 1 meter scale seafloor bathymetry maps and detect plume signals that point to source areas. The dual AUV mission ran 21 hours and covered an area 7 km north-south by 3.5 km east-west. Analysis of the data began as soon as the first AUV was recovered. As shown in the 3rd and 4th panel on our map, the 1 meter scale AUV bathymetry indicates seafloor features as small as a coffee table, and hydrothermal vent structures are distinctive enough to be recognized amongst the rugged, highly faulted terrain of this volcano (Image 1, above). Within a few hours, the first look at the bathymetry and the overlaid plume signals gave us an indication of where the Remotely Operated Vehicle (ROV) dive could start, even before the map was finished. Together we developed an ROV dive plan that would visit several sites of interest identified, utilizing all of the available data.
Finally, the ROV SuBastian was launched, fully decked out with a variety of tools for collection of chemical, geological, and biological samples. This includes a newly developed in-situ methane laser absorption spectrometer integrated onto the ROV to help home in on venting sources and map how much methane is in the surrounding waters, as well as numerous fluid samplers, rock and animal boxes, and a slurp sampler. In real time, the AUV and geological team were examining the features in the high resolution AUV map and bringing it together with the CTD data to help guide the scientists in the ROV control room.

Shortly after getting to the seafloor we found low temperature (~15-30 oC) diffuse flow venting, as well as microbial mats supported by the venting. However, we all felt the robust plume signatures must indicate high temperature venting, so we continued on and near the end of the dive, we found spectacular high-temperature sulfide chimneys covered in shrimp, with black smoke of 341oC billowing out. There were audible gasps, hoots and high-fives throughout the control room, as after months of planning and preparation, we were grateful to start this expedition on a high (temperature) note. We should arrive at the Kane Fracture Zone late Monday and will soon find out if we can translate what we were able to do at Puy des Folles to our search for serpentinization on an oceanic core complex.
Blog nº 2: La estrategia para encontrar ventilas hidrotermales
Julie Huber y Dave Butterfield
Dado el mal tiempo al norte de la zona de fractura de Kane, decidimos probar nuestra estrategia para encontrar fumarolas hidrotermales activas en el campo de fumarolas de Puy de Folles. Los trabajos anteriores de colegas franceses y rusos en este lugar se centraron en los sulfuros inactivos (extinguidos), y también se detectaron algunas señales de actividad hidrotermal en la columna de agua, pero nadie había observado fumarolas hidrotermales en el fondo marino. Pues bien, ¡las hemos encontrado! ¿Cómo lo hemos hecho?
En primer lugar, hicimos un mapa con el sonar multihaz de Falkor(too). Esto nos proporcionó una batimetría mejorada para guiar el resto de nuestra misión y nuestras tareas, como una hoja de ruta del fondo marino. Como se puede ver comparando el primer y el segundo panel de esta imagen, la batimetría nueva y mejorada ha revelado una compleja historia geológica del monte submarino Puy de Folles. La extensión tectónica ha deformado gravemente la parte superior de la estructura mediante fallas normales generalizadas, pero seguíamos necesitando más datos para encontrar objetivos de inmersión.
A continuación, realizamos un remolque CTD (Conductividad-Temperatura-Profundidad), que consiste en montar un paquete de instrumentos en un cable para buscar señales de actividad hidrotermal, como cambios en la temperatura o partículas, así como para recoger muestras de agua para realizar análisis químicos y de gases a bordo. Remolcamos el CTD con el barco, moviéndonos arriba y abajo en la columna de agua, buscando indicios de actividad (IMAGE 2 CTD). Una herramienta especial que llevamos con nosotros es un sensor químico llamado sensor de potencial de oxidación-reducción (ORP). El sensor es muy sensible a los cambios químicos y cuando se detectan las condiciones reductoras (hidrógeno, metano, sulfuro de hidrógeno, etc.) de una ventila hidrotermal, los valores del sensor descienden, lo que significa que estamos cerca de una fuente. Junto con el contenido de partículas y las características del fondo marino, podemos acotar aún más la fuente de la anomalía. En los últimos dos días, hemos realizado dos remolques, uno Sur-Norte a través de la cumbre y otro Oeste-Este. En ambos casos, observamos un aumento de las partículas, una disminución del ORP y en las muestras de de agua encontramos hidrógeno y metano.
Tras el primer remolque, desplegamos a nuestros dos AUV cartográficos del MBARI (Imagen 3) equipados con múltiples sensores (ORP, temperatura, concentraciones de partículas en suspensión y presión) para producir mapas batimétricos del fondo marino a escala de 1 metro y detectar señales de plumas que apuntaran a las zonas de origen. La doble misión del AUV duró 21 horas y cubrió un área de 7 km de norte a sur por 3,5 km de este a oeste. El análisis de los datos comenzó en cuanto se recuperó el primer AUV. Como se muestra en los paneles 3 y 4 de nuestro mapa, la batimetría a escala de 1 metro del AUV indica rasgos del fondo marino tan pequeños como una mesa de café, y las estructuras de las chimeneas hidrotermales son lo suficientemente distintivas como para ser reconocidas entre el terreno accidentado y altamente fallado de este volcán (Imagen 1). En pocas horas, el primer vistazo a la batimetría y las señales superpuestas de la pluma nos dieron una indicación de dónde podía comenzar la inmersión con el ROV, incluso antes de que el mapa estuviera terminado. Juntos desarrollamos un plan de inmersión del ROV que visitaría varios lugares de interés identificados, utilizando todos los datos disponibles.
Por último, se lanzó el ROV SuBastian, totalmente equipado con diversas herramientas para la recogida de muestras químicas, geológicas y biológicas. Esto incluye un espectrómetro de absorción láser de metano in situ de reciente desarrollo integrado en el ROV para ayudar a localizar las fuentes de ventilación y cartografiar la cantidad de metano en las aguas circundantes, así como numerosos muestreadores de fluidos, cajas para rocas y animales, y un muestreador con succión. En tiempo real, los equipos del AUV y el equipo geológico examinaban las características del mapa de alta resolución del AUV y las combinaban con los datos del CTD para ayudar a guiar a los científicos en la sala de control del ROV.
Poco después de llegar al lecho marino, descubrimos un respiradero de flujo difuso a baja temperatura (~15-30 oC), así como tapetes microbianos sostenidos por el respiradero. Sin embargo, todos pensamos que las fuertes señales del penacho debían indicar una ventilación a alta temperatura, así que continuamos y cerca del final de la inmersión, encontramos espectaculares chimeneas de sulfuro a alta temperatura cubiertas de camarones, con humo negro a 341oC (IMAGEN 4 HUMO NEGRO). En la sala de control se oyeron expresiones, gritos y aplausos, ya que, tras meses de planificación y preparación, estábamos agradecidos de comenzar esta expedición con una nota (de temperatura) alta. Deberíamos llegar a la zona de fractura de Kane a última hora del lunes y pronto averiguaremos si podemos trasladar lo que pudimos hacer en Puy des Folles a nuestra búsqueda de serpentinización en un complejo de núcleo oceánico.