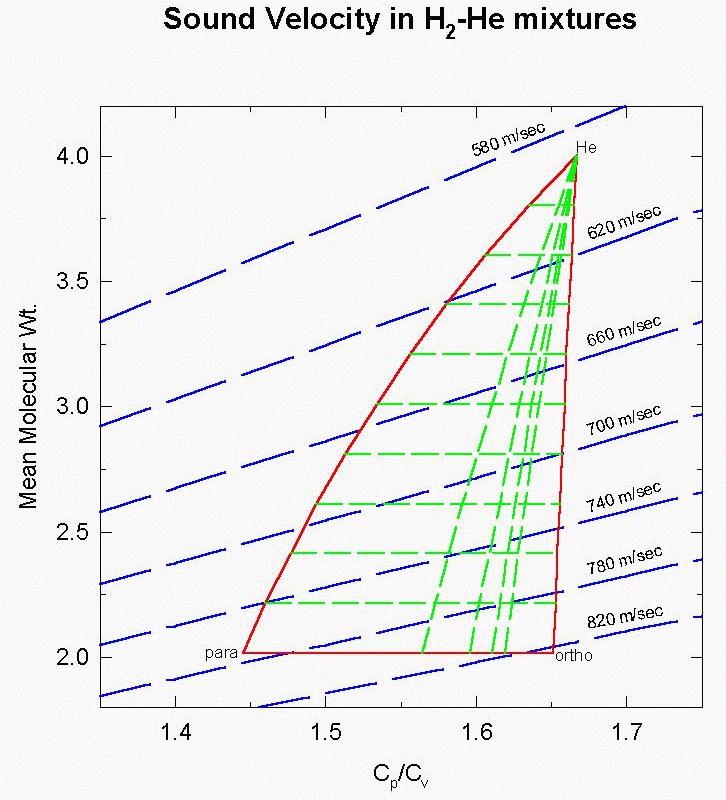
Figure 3. The sound velocity in hydrogen – helium mixtures as a function of the heat capacity ratio and mean molecular weight. Lines of constant helium content (the nearly horizontal lines inside the sound velocity triangle) and lines of constant ortho/para ratio (the nearly vertical lines inside the sound velocity triangle) are shown along with contours of constant sound velocity. From Professor Fegley’s April 1996 presentation to the NASA Outer Planet Science Working Group (OPSWG).