Download presentation
Presentation is loading. Please wait.

1
Stat 112 Notes 8 Today: –Chapters 4.3 (Assessing the Fit of a Regression Model) –Chapter 4.4 (Comparing Two Regression Models) –Chapter 4.5 (Prediction with a Multiple Regression Equation)
 –Chapter 4.4 (Comparing Two Regression Models) –Chapter 4.5 (Prediction with a Multiple Regression Equation)")
2
Gas Mileage Regression

3
R-Squared (Coefficient of Determination) The coefficient of determination for multiple regression is defined as for simple linear regression: Represents percentage of variation in y that is explained by the multiple regression line. is between 0 and 1. The closer to 1, the better the fit of the regression equation to the data. For the gas mileage regression, RSquare0.834148 Summary of Fit

4
Comparing Two Regression Models Multiple Regression Model for automobile data: We use t test to test if one variable, for example, cargo is useful after putting the rest of the three variables into the model. How to test whether cargo and/or seating are useful predictors once weight and hp are taken into account, i.e., test

5
Full vs. Reduced Model General setup for testing whether any of the variables are useful for predicting y after taking into account variables Full model: Reduced model: Is the full model better than the reduced model?

6
Partial F test Test statistic: Under H 0, F has an distribution. Round both degrees of freedom down when using Table B.4. Decision rule for test with significance level –Reject H 0 if –Accept H 0 if p-value = Prob (F (K-L, n-K-1) >F)
 >F).")
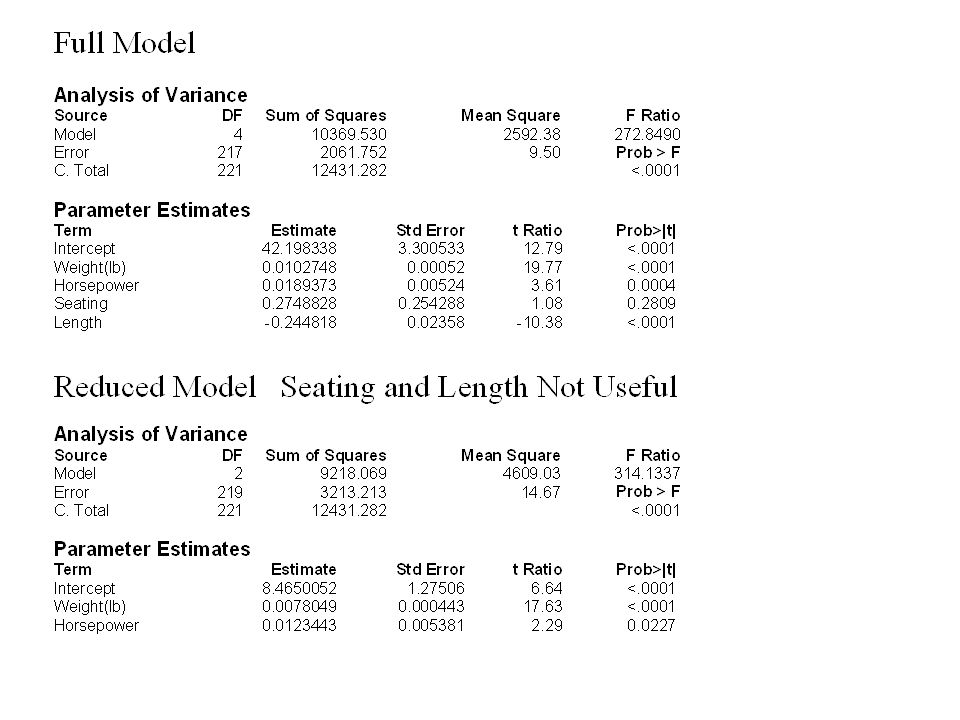
8
Automobile Example Test whether seating and length are useful predictors once weight and hp are taken into account. From Table B.4, F(.05; 2,120)=3.07 [rounding down to nearest denominator degrees of freedom] Because 60.59>3.07, we reject H 0. There is evidence that seating and/or length are useful predictors once weight and hp are taken into account.
=3.07 [rounding down to nearest denominator degrees of freedom] Because 60.59>3.07, we reject H 0. There is evidence that seating and/or length are useful predictors once weight and hp are taken into account..")
9
Test of Usefulness of Model Are any of the variables useful for predicting y? Multiple Linear Regression model:

10
F Test of Usefulness of Model Under, F has F(K,n-K-1) distribution. Decision rule: Reject if [see Appendix B.3-B.5] F test in JMP in Analysis of Variance table. Prob>F is the p-value for the F test.

11
Test of Usefulness of Model for Gas Mileage Data

12
Prediction in Gas Mileage Data The design team is planning a new car with the following characteristics: weight=4000 lbs, horsepower = 200, seating = 5 adults, length=200 inches. What is a 95% prediction interval for the GPM1000 of this car?

13
Prediction with Multiple Regression Equation Prediction interval for individual with x 1,…,x K : For a large number of observations (say n>30+number of explanatory variables *10), the 95% prediction interval is approximately
, the 95% prediction interval is approximately")
14
Finding Prediction Interval in JMP Enter a line with the independent variables x 1,…,x K for the new individual. Do not enter a y for the new individual. Fit the model. Because the new individual does not have a y, JMP will not include the new individual when calculating the least squares fit. Click red triangle next to response, click Save Columns: –To find, click Predicted Values. Creates column with –To find 95% PI, click Indiv Confid Interval. Creates column with lower and upper endpoints of 95% PI.

15
Prediction in Automobile Example The design team is planning a new car with the following characteristics: weight = 4000 lbs, horsepower =200, seating =5, length =200 inches From JMP, – –95% prediction interval: (33.36, 45.63)
")
Similar presentations


 Inferences from multiple regression analysis.>")


.>")


 Inference for multiple regression.>")
 Inferences from.>")
 Comparing Two Regression Models (Chapter 4.4) Prediction.>")
 R-squared statistic (10.4.1) Residual plots (11.2) Influential observations (11.3, 11.4.3.>")


: –Hypothesis Tests and Confidence Intervals for Intercept and Slope –Confidence.>")