Download presentation
Presentation is loading. Please wait.

1
Type Ia supernovae and the ESSENCE supernova survey
Kevin Krisciunas

3
There are two basic kinds of supernovae. Roughly 1 out
of 1000 stars that forms has a mass greater than 8 Msun. Shortly after such a star develops an iron core, it explodes as a Type II SN.

4
Type II SNe show atomic hydrogen lines in emission.

5
Common photometric bands in astronomical photometry:
Filter mean wavelength (m) U B V R I Y J H Ks
 U B V R I Y J H Ks")
6
Optical and near-IR light curves of the Type II-P SN 2003hn.
Krisciunas et al. (2009)
")
7
When a single massive star blows up as a Type II SN:
1) elements heavier than iron (up to uranium) are produced; and 2) a compact remnant is left behind (either a rapidly rotating neutron star or a black hole) 3) 99 percent of the energy of the explosion is radiated away in the form of neutrinos
 elements heavier than iron (up to uranium) are. produced; and. 2) a compact remnant is left behind (either a rapidly. rotating neutron star or a black hole) 3) 99 percent of the energy of the explosion is radiated. away in the form of neutrinos.")
8
The most common end state for a star is a
white dwarf.

9
S. Chandrasekhar ( ) From a consideration of the equation of state of relativistic degenerate matter, Chandrasekhar discovered in 1930 that more massive white dwarf stars were smaller than less massive ones. If a white dwarf star had a mass approaching 1.4 Msun its radius ---> 0.

10
Binary stars are very common in the universe. Some
are close enough that they influence each other's evolution.

11
It is generally believed that a Type Ia SN is a
carbon-oxygen white dwarf that acquires mass from a nearby donor star. When the mass of the WD exceeds 1.4 Msun the WD completely obliterates itself. The spectra of Type Ia supernovae are characterized by having no hydrogen emisssion. The prime signature is a blue-shifted absorption line of singly ionized silicon observed at ~6150 Angstroms.

13
Two Type Ia supernovae at about the same number of days
after explosion. The spectra are almost identical. Krisciunas et al. (2007)
")
14
Light curves of SN 2004S in the optical and
near-IR bands.

15
According to Kasen (2006), the secondary hump in
the near-IR light curves of Type Ia supernovae is due to a transition from doubly ionized atoms to singly ionized ones.

16
The astronomical magnitude system was originated
by Hipparchus in the 2nd century BC. The brightest stars in the sky are said to be “of the first magnitude”. The faintest stars visible to the unaided eye are 6th magnitude. For two stars of intensity I1 and I2 their apparent magnitudes are related as follows: m2 –m1 = log (I2/I1) Thus, if we receive 100 times as many photons per second from star 1 than from star 2, star 1 is 5 magnitudes brighter than star 2.
 Thus, if we receive 100 times as many photons per. second from star 1 than from star 2, star 1 is 5 magnitudes. brighter than star 2.")
17
B-band light curves of two Type Ia supernovae. The “decline rate” is the number of magnitudes it gets fainter in the first 15 days after maximum light.

18
The distance at which the radius of the Earth's orbit
subtends an angle of 1 second of arc = 1 parsec (3.086 X 10¹³ km). Astronomers needed a standard distance at which to compare the apparent magnitudes of stars in order to be able to compare their instrinsic brightness. They chose a standard distance of 10 pc. The apparent magnitude a star would have if it were at a distance of 10 pc is called the absolute magnitude (M). M = m + 5 –5 log (dpc) mM = 5 log (d) – is a measure of distance, and is called the distance modulus.
. Astronomers needed a standard. distance at which to compare the apparent magnitudes. of stars in order to be able to compare their instrinsic. brightness. They chose a standard distance of 10 pc. The apparent magnitude a star would have if it were at. a distance of 10 pc is called the absolute magnitude (M). M = m + 5 –5 log (dpc) mM = 5 log (d) – is a measure of distance, and is. called the distance modulus.")
19
decline rate parameter. These supernovae are standardizable
At optical wave- lengths, the absolute magnitudes of Type Ia supernovae at maximum brightness are related to the decline rate parameter. These supernovae are standardizable candles. The brighter ones are 4 billion times brighter than the Sun! Garnavich et al. (2004)
")
20
Two independent groups
of astronomers announced in 1998 and 1999 that the universe was not just expanding, but it was accelerating as it expanded. Science magazine hailed this as the “breakthrough of the year”. How can we understand this deduction made from observations of Type Ia supernovae?

21
For nearby galaxies the velocity of recession is related to
the distance (in Megaparsecs) according to Hubble's Law: V (km/sec) = H0 DMpc , where H0 ~ 72 km/sec/Mpc is the Hubble constant. The redshift z = (~ v/c for low redshift). Beyond a redshift of ~0.1 we must must also consider the curvature of space-time, which is related to the mass density parameter M = crit . After much grinding away, we can obtain an expression for the effective distance (aka proper motion distance):
 according to Hubble s Law: V (km/sec) = H0 DMpc , where H0 ~ 72 km/sec/Mpc is the Hubble constant. The redshift z = (~ v/c for low redshift). Beyond a redshift of ~0.1 we must must also. consider the curvature of space-time, which is. related to the mass density parameter M = crit . After much grinding away, we can obtain an expression. for the effective distance (aka proper motion distance):")
22
If the density of the universe is very small compared to
the critical density, then The arrival rate of photons from a distant galaxy in an expanding universe is diminished by (1 + z). The frequency of the photons is likewise diminished by (1 + z). The flux is then related to the luminosity by:
. The. frequency of the photons is likewise diminished by. (1 + z). The flux is then related to the luminosity by:")
23
We can then define a luminosity distance to be:
For extragalactic astronomy, where distances are measured in Mpc instead of parsecs, the formula for distance modulus then becomes:

24
The curvature of the universe depends on the
mass density parameter M = crit , where crit = 3 H02 / [ 8 G ] . If we scale Einstein's cosmological constant as follows: c2 / [3 H02 ] , this is the (dimensionless) scaled Dark Energy parameter. The universe has flat geometry if M +
 scaled Dark Energy. parameter. The universe has flat geometry if. M + ")
25
Loci of distance modulus vs. redshift fan out in the Hubble diagram, depending on what the mass density parameter M and the Dark Energy density are.

26
It is common to pick one of the loci in the previous diagram
as a reference and to plot a differential Hubble diagram. The expectation prior to 1998 was that Type Ia supernovae would fall along the “open” line in this diagram.

27
The gravitational attraction of all the matter in the universe
is not enough to show a deceleration of the universe. The SN points fall along a curve that is most easily interpreted as evidence for a positive cosmological constant. Riess et al. (2004)
")
28
Instead of using the strategically chosen bins to provide
the medians shown in the previous diagram, a graph of the individual points (along with some ESSENCE objects) is not nearly as convincing. Krisciunas et al. (2005)
 is. not nearly as convincing. Krisciunas et al. (2005)")
29
Also, how do we know that distant supernovae are
just like nearby ones?

30
Previous SN survey work had relied on photometry
taken with a variety of telescopes, cameras, and filters. Even with knowledge of the effective transmission functions of different filters, it is difficult to unscramble differences in the photometry owing to features of the hardware and the intrinsic differences amongst supernovae. What was needed was a systematic search carried out on the same telescope, with the same camera, and with the same filters.

31
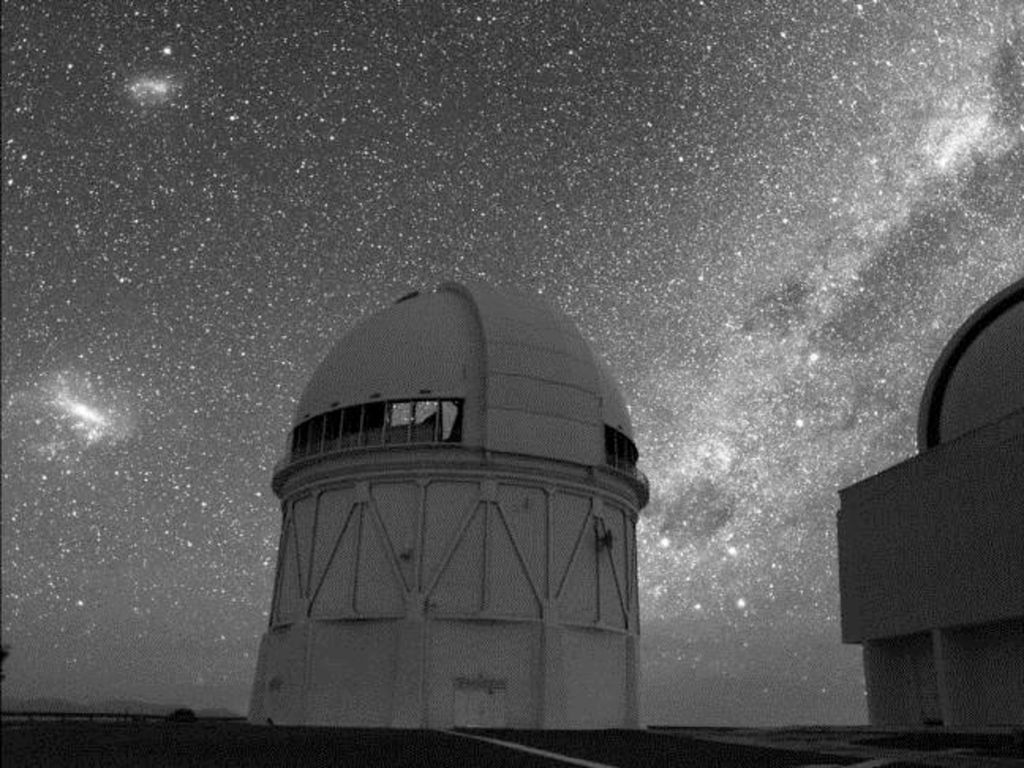
ESSENCE = Equation of State. SupErNovae trace Cosmic Expansion
Objects discovered with CTIO 4-m + prime focus camera Almost all photometry from CTIO 4-m Oct-Nov observing every other moonless night 32 principal fields (each 0.6 deg X 0.6 deg) Imagery obtained in R, I bands (rest frame U, B, V) Spectra from Keck, VLT, Gemini, Magellan Some optical and IR imagery from HST and Spitzer
 Imagery obtained in R, I bands (rest frame U, B, V) Spectra from Keck, VLT, Gemini, Magellan. Some optical and IR imagery from HST and Spitzer.")
32
We observed on 191 nights with the CTIO 4-m.
5458 R- and I-band images 2000 transients detected by pipeline 400 spectra obtained ~220 Type Ia supernovae identified

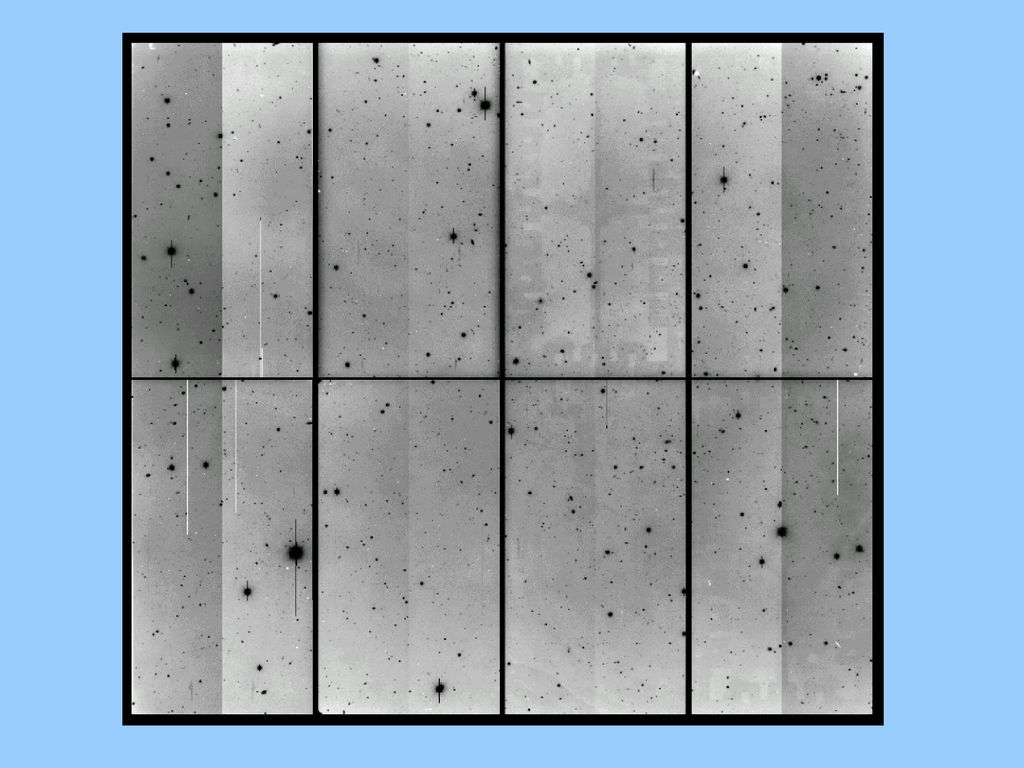
34
Pipeline helped identify flux variable objects and provided preliminary light curves.

35
Histogram of redshifts of ESSENCE Type Ia supernovae
discovered from 2002 (bottom) to 2007 (top).
 to 2007 (top).")
36
9 ESSENCE objects that were also observed with HST. We found a lot of blue slow decliners.

37
The appropriate formula for the luminosity distance
given flat geometry and a non-zero Dark Energy density that is not necessarily the same as Einstein's cosmological constant is: Here w = P / (c2) is the equation of state parameter. If w = -1, then the Dark Energy is equivalent to Einstein's cosmological constant.
 is the equation of state parameter. If w = -1, then the Dark Energy is equivalent to. Einstein s cosmological constant.")
38
Our differential Hubble diagram can provide a value
of w, but we need to control systematics in the photometry to the level of a few hundredths of a magnitude. w = 1 if Dark Energy is the same as Einstein's cosmological constant.

39
The goal of the ESSENCE project was to try to measure
the equation of state parameter to +/- 10 percent. We're still working on the data, but we have a pretty good idea what our final result will be.

40
Differential Hubble diagram of nearby Type Ia supernovae
(red), ESSENCE objects (black) and 1st year of Legacy SN search (blue).
, ESSENCE objects (black) and 1st year of Legacy. SN search (blue).")
41
SN data combined with data from baryon acoustic oscillations
(BAO) give M + = 1 at the 68 percent confidence level.
 give M + = 1 at the 68 percent confidence level.")
42
Also, within 1- the equation of state parameter is
equal to , indicating that Einstein (1917) might have been right after all.
 might. have been right after all.")
43
Our preliminary answer is w =
If w is less than , then eventually the universe will be accelerating so fast that everything will be ripped apart. This is called the Big Rip. If w = 0.98 or so, then various string theory models could hold.

44
We live at a curious time in cosmic history, when the matter and Dark Energy densities are comparable.

46
What's next? Dark Energy Survey (w/ refurbished CTIO 4-m) Large Synoptic Survey Telescope (LSST) Joint Dark Energy Mission (JDEM) pushing the rest-frame optical and infrared Hubble diagrams to higher redshift

47
At near-IR wavelengths Type Ia super- novae are not
just standardizable candles. The slow decliners and mid-range decliners are standard candles. Krisciunas et al. (2004a)
")
48
Decline rate relations in the near-IR

49
In the near-IR Type Ia SNe that peak early are standard candles, even if they are fast decliners. The fast decliners are subluminous in the optical bands.

Similar presentations

, a planetary nebula (left), and the Crab Nebula (M1; right), a supernova remnant.>")


 –Short time period (few days) These explosions used.>")


: The distance from the earth to the sun (150,000,000 km) Light Years:>")
