Download presentation
Presentation is loading. Please wait.

1
Global Telecommunications Ben AsuncionMurtaza Dhanani Olga Ryabchinskaya Ali Shahkarami Ben AsuncionMurtaza Dhanani Olga Ryabchinskaya Ali Shahkarami Presented by:

2
OVERVIEW Introduction to the Telecommunications Industry Manitoba Telecom British Telecom Sprint-Nextel Summary Introduction to the Telecommunications Industry Manitoba Telecom British Telecom Sprint-Nextel Summary

3
Telecommunications History Early History1792183818391866187618781901 Transatlantic Telegraph Cable Morse & Vail Telegraph Register Smoke & Drums Claude Chappe Fixed Telegraphy Bell Conventional Telephone Wheatstone & Cooke Electrical Telegraph Commercial Telephone Marconi Transatlantic Wireless Communication Prior to modern communications

4
Telecom Monopolies Alexander Graham Bell patented the telephone on March 7, 1876 Once the Bell patents expired in 1894, thousands of competitors began wiring the nation By 1907, Bell rivals controlled 51 percent of local service In response to the burgeoning competition, American Telephone and Telegraph (AT&T) began buying up rivals Alexander Graham Bell patented the telephone on March 7, 1876 Once the Bell patents expired in 1894, thousands of competitors began wiring the nation By 1907, Bell rivals controlled 51 percent of local service In response to the burgeoning competition, American Telephone and Telegraph (AT&T) began buying up rivals
 began buying up rivals Alexander Graham Bell patented the telephone on March 7, 1876 Once the Bell patents expired in 1894, thousands of competitors began wiring the nation By 1907, Bell rivals controlled 51 percent of local service In response to the burgeoning competition, American Telephone and Telegraph (AT&T) began buying up rivals")
5
AT&T Formation of government regulated “natural monopoly” “One Policy, One System, Universal Service” Gov’t raised barriers to entry The more difficult it was to launch competitive service, the more secure was the company’s market share “Competition resulted in duplication of investment,” and that states were justified in denying requests by rivals to deploy new lines Firms that enjoy government protection from competition, and for whom rates of return are guaranteed through regulation, face less financial pressure to innovate or operate efficiently Formation of government regulated “natural monopoly” “One Policy, One System, Universal Service” Gov’t raised barriers to entry The more difficult it was to launch competitive service, the more secure was the company’s market share “Competition resulted in duplication of investment,” and that states were justified in denying requests by rivals to deploy new lines Firms that enjoy government protection from competition, and for whom rates of return are guaranteed through regulation, face less financial pressure to innovate or operate efficiently

6
AT&T 1970: FCC allows competition into the long distance services Local service was still protected Mid 1970: US Justice Department files antitrust lawsuit based on complaints by MCA & other long distance service providers 1982: AT&T settled with government requiring them to divest their local operating companies, and restrict its services to the long distance market Formation of the “Baby Bells” 1970: FCC allows competition into the long distance services Local service was still protected Mid 1970: US Justice Department files antitrust lawsuit based on complaints by MCA & other long distance service providers 1982: AT&T settled with government requiring them to divest their local operating companies, and restrict its services to the long distance market Formation of the “Baby Bells”

7
AT&T “Baby Bells” Allowed to keep local services SBC, Verizon, BellSouth and Qwest “Baby Bells” Allowed to keep local services SBC, Verizon, BellSouth and Qwest $.62/min $.20/min

8
US Telecom Statistics

9
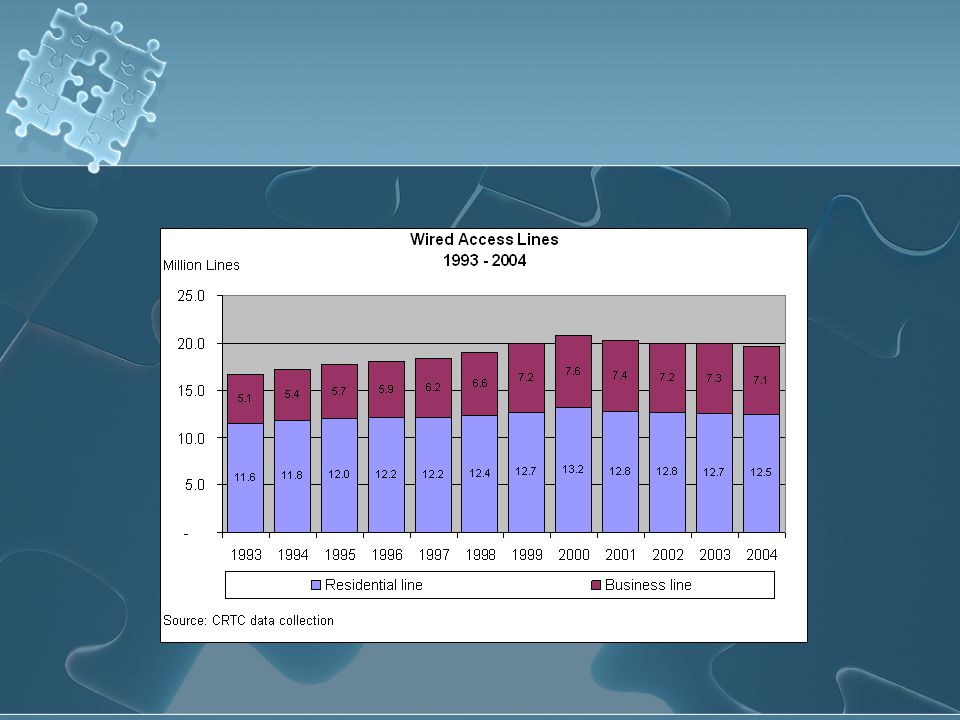
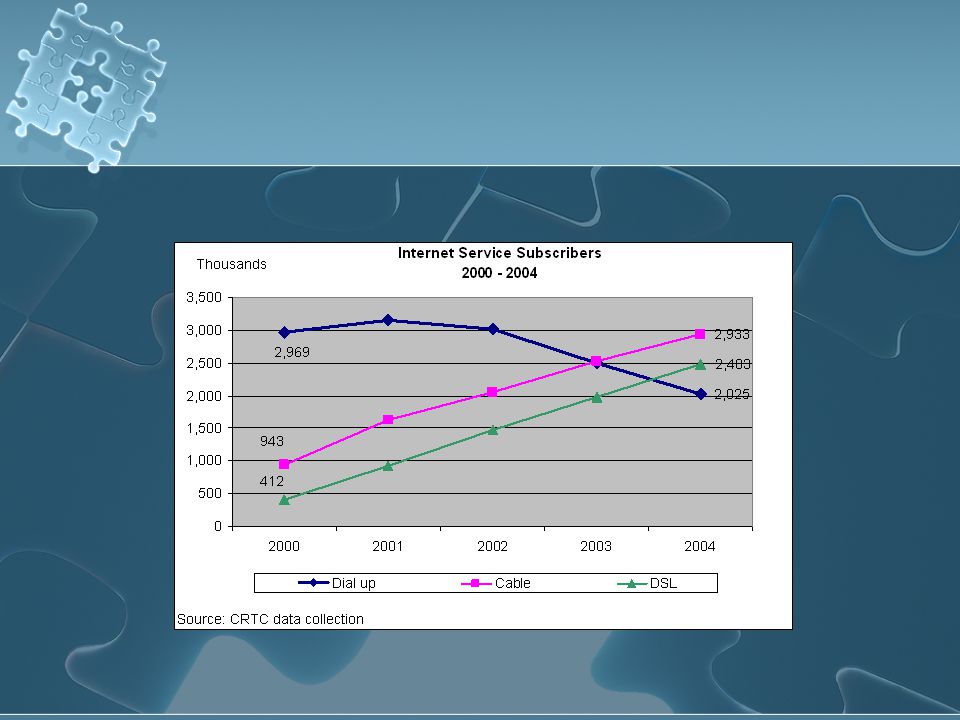
Canadian Telecom Statistics

10
Telecommunications History Key Telecom Metrics Current Telecommunications Industry Wired Telecommunications Carriers Wireless Telecommunications Carriers Cable and other Program Distribution Key Telecom Metrics Current Telecommunications Industry Wired Telecommunications Carriers Wireless Telecommunications Carriers Cable and other Program Distribution

11
Telecom Metrics EBITDA Margin EBITDA / Total Revenue Churn Rate (1 - Retention Rate) Proportion of contractual customers or subscribers who leave a carrier during a given time period Reduced by creating barriers to exit Contracts Proprietary technology Loyalty programs ARPU Avg Revenue Per Unit OR Avg Revenue per User Includes revenues billed to each customer for usage Also includes revenue generated from incoming calls ARMU Average Margin per User Alternative to ARPU, which focuses narrowly on revenue per unit Margin is based on profitability of customers EBITDA Margin EBITDA / Total Revenue Churn Rate (1 - Retention Rate) Proportion of contractual customers or subscribers who leave a carrier during a given time period Reduced by creating barriers to exit Contracts Proprietary technology Loyalty programs ARPU Avg Revenue Per Unit OR Avg Revenue per User Includes revenues billed to each customer for usage Also includes revenue generated from incoming calls ARMU Average Margin per User Alternative to ARPU, which focuses narrowly on revenue per unit Margin is based on profitability of customers
 Proportion of contractual customers or subscribers who leave a carrier during a given time period Reduced by creating barriers to exit Contracts Proprietary technology Loyalty programs ARPU Avg Revenue Per Unit OR Avg Revenue per User Includes revenues billed to each customer for usage Also includes revenue generated from incoming calls ARMU Average Margin per User Alternative to ARPU, which focuses narrowly on revenue per unit Margin is based on profitability of customers EBITDA Margin EBITDA / Total Revenue Churn Rate (1 - Retention Rate) Proportion of contractual customers or subscribers who leave a carrier during a given time period Reduced by creating barriers to exit Contracts Proprietary technology Loyalty programs ARPU Avg Revenue Per Unit OR Avg Revenue per User Includes revenues billed to each customer for usage Also includes revenue generated from incoming calls ARMU Average Margin per User Alternative to ARPU, which focuses narrowly on revenue per unit Margin is based on profitability of customers")
12
Wired Telecommunications Oldest & once largest sector of industry Wires & Cables connecting to central offices maintained Oldest & once largest sector of industry Wires & Cables connecting to central offices maintained All transmissions routed through switching equipment

13
Wired Telecommunications Traditionally, voice used to be main type of data transmitted over wires Now include transmission of all types of graphic, video, and electronic data Mainly transmitted over internet Efficiencies through technology Traditionally, voice used to be main type of data transmitted over wires Now include transmission of all types of graphic, video, and electronic data Mainly transmitted over internet Efficiencies through technology

14
Wired Telecommunications Packet Switching Networks Traditional One-Path Switching

15
Wired Telecommunications Voice requires small capacity compared to data, video, and graphics Bandwidth Frequency band: specific range of frequencies in the radio frequency spectrum (RF) Voice signal = 3 kHz Analog TV signal = 6 MHz (2000x as wide) Channel Capacity: amount of discrete info reliably transmitted over a channel Voice requires small capacity compared to data, video, and graphics Bandwidth Frequency band: specific range of frequencies in the radio frequency spectrum (RF) Voice signal = 3 kHz Analog TV signal = 6 MHz (2000x as wide) Channel Capacity: amount of discrete info reliably transmitted over a channel
 Voice signal = 3 kHz Analog TV signal = 6 MHz (2000x as wide) Channel Capacity: amount of discrete info reliably transmitted over a channel Voice requires small capacity compared to data, video, and graphics Bandwidth Frequency band: specific range of frequencies in the radio frequency spectrum (RF) Voice signal = 3 kHz Analog TV signal = 6 MHz (2000x as wide) Channel Capacity: amount of discrete info reliably transmitted over a channel")
16
Wired Telecommunications Improvements from Telecom Co’s Replacing copper wires with fibre optic Allows for 25 times more data than cable Allowing for transmission of new services Cable TV, Video-on-Demand, High-speed internet, and telephone Mostly, carrier’s leverage existing copper lines to provide DSL Lower transmission capacity & speed Less capital expenditures Improvements from Telecom Co’s Replacing copper wires with fibre optic Allows for 25 times more data than cable Allowing for transmission of new services Cable TV, Video-on-Demand, High-speed internet, and telephone Mostly, carrier’s leverage existing copper lines to provide DSL Lower transmission capacity & speed Less capital expenditures

17
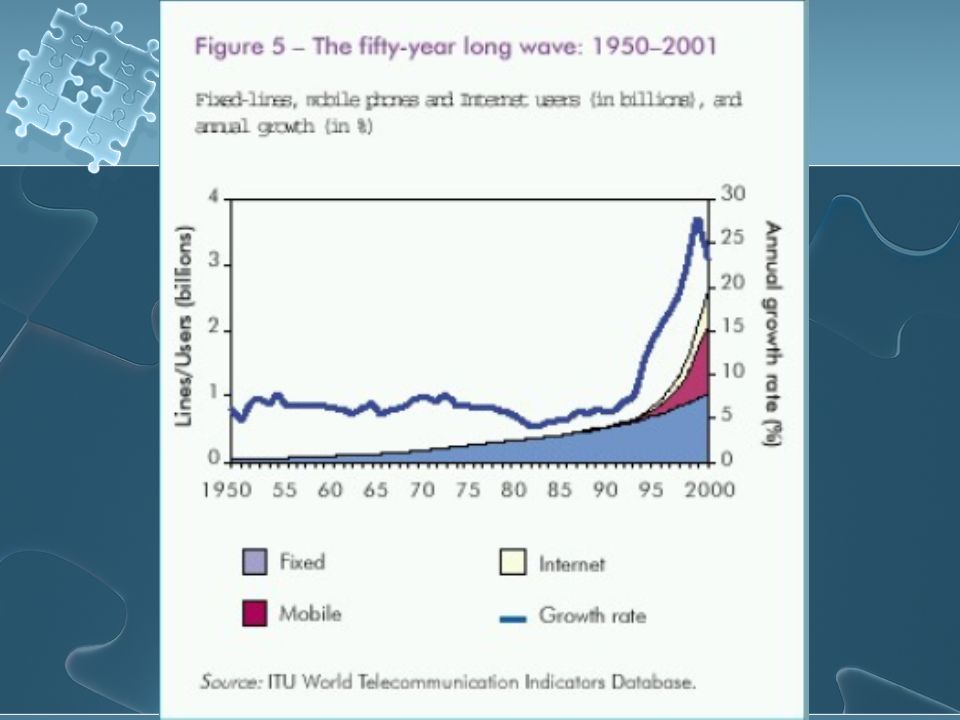
Global Telephone Calls

19
Wired Telecommunications

20
Wireline CapEx$

21
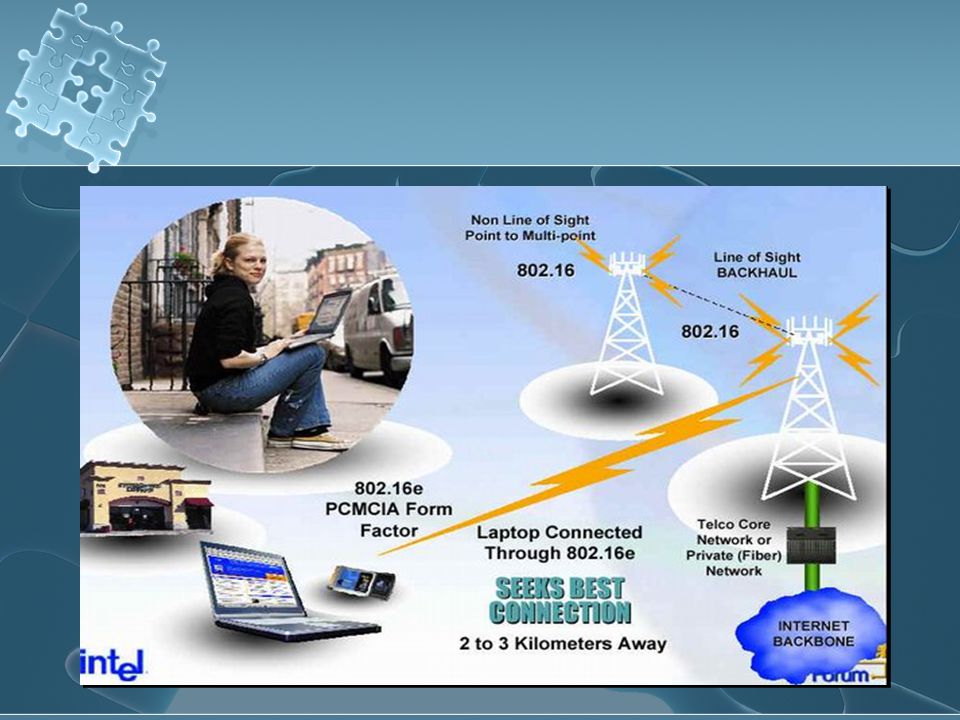
Wireless Telecommunications Transmit voice, graphics, data, and internet access through the transmission of signals over networks of radio towers Signal is transmitted through an antenna into the wireline network New technologies allow them to compete with wireline Transmit voice, graphics, data, and internet access through the transmission of signals over networks of radio towers Signal is transmitted through an antenna into the wireline network New technologies allow them to compete with wireline

22
How it works

23
Wireless Telecommunications Generations of Wireless Access 0G – mobile radio telephone systems that preceded modern cellular mobile technology 1G – Analog cellphone standards that were introduced in the 1980’s 2G – PCS – second-generation wireless Difference: radio signals are digital VS analog More efficient and greater reception Intermediate advancements: 2.5G, 2.75G Generations of Wireless Access 0G – mobile radio telephone systems that preceded modern cellular mobile technology 1G – Analog cellphone standards that were introduced in the 1980’s 2G – PCS – second-generation wireless Difference: radio signals are digital VS analog More efficient and greater reception Intermediate advancements: 2.5G, 2.75G

24
Wireless Telecommunications 3G – Third Generation Ability to transfer simultaneously both voice and non-voice data Momentous capacity and broadband capabilities to support greater numbers of voice and data customers & higher data rates at lower incremental cost than 2G Radio spectrum bands are subsequently licensed to operators (5MHz channel) Greater capacity and improved spectrum efficiency 3G – Third Generation Ability to transfer simultaneously both voice and non-voice data Momentous capacity and broadband capabilities to support greater numbers of voice and data customers & higher data rates at lower incremental cost than 2G Radio spectrum bands are subsequently licensed to operators (5MHz channel) Greater capacity and improved spectrum efficiency
 Greater capacity and improved spectrum efficiency 3G – Third Generation Ability to transfer simultaneously both voice and non-voice data Momentous capacity and broadband capabilities to support greater numbers of voice and data customers & higher data rates at lower incremental cost than 2G Radio spectrum bands are subsequently licensed to operators (5MHz channel) Greater capacity and improved spectrum efficiency")
25
Canada ~ License Costs

26
US ~ License Costs License term usually 15 years One of 8 similar auctions conducted License term usually 15 years One of 8 similar auctions conducted

27
Wireless Telecommunications High input fees for the 3G service licenses Great differences in the licensing terms Current high debt of many telecommunication companies, making it more of a challenge to build the necessary infrastructure for 3G Health aspects of the effects of electromagnetic waves Lack of 2G mobile user buy-in for 3G wireless service High prices of 3G mobile services in some countries, including Internet access High input fees for the 3G service licenses Great differences in the licensing terms Current high debt of many telecommunication companies, making it more of a challenge to build the necessary infrastructure for 3G Health aspects of the effects of electromagnetic waves Lack of 2G mobile user buy-in for 3G wireless service High prices of 3G mobile services in some countries, including Internet access

28
Wireless Telecommunications 4G – Fourth Generation Spectrally efficient system High network capacity (at least 10 times greater than 3G) Nominal data rate at high speeds (100 Mbps at stationary conditions and 20 Mbps at 100 miles/hr) Smooth handoff across heterogeneous network Seamless connectivity and global roaming across multiple networks High quality of service for next generation multimedia support (real time audio, high speed data, HDTV video content, mobile TV, etc) Interoperable with the existing wireless standards All IP system, packet switched network 4G – Fourth Generation Spectrally efficient system High network capacity (at least 10 times greater than 3G) Nominal data rate at high speeds (100 Mbps at stationary conditions and 20 Mbps at 100 miles/hr) Smooth handoff across heterogeneous network Seamless connectivity and global roaming across multiple networks High quality of service for next generation multimedia support (real time audio, high speed data, HDTV video content, mobile TV, etc) Interoperable with the existing wireless standards All IP system, packet switched network
 Nominal data rate at high speeds (100 Mbps at stationary conditions and 20 Mbps at 100 miles/hr) Smooth handoff across heterogeneous network Seamless connectivity and global roaming across multiple networks High quality of service for next generation multimedia support (real time audio, high speed data, HDTV video content, mobile TV, etc) Interoperable with the existing wireless standards All IP system, packet switched network 4G – Fourth Generation Spectrally efficient system High network capacity (at least 10 times greater than 3G) Nominal data rate at high speeds (100 Mbps at stationary conditions and 20 Mbps at 100 miles/hr) Smooth handoff across heterogeneous network Seamless connectivity and global roaming across multiple networks High quality of service for next generation multimedia support (real time audio, high speed data, HDTV video content, mobile TV, etc) Interoperable with the existing wireless standards All IP system, packet switched network")
29
Wireless Telecommunications

31
International Wireless Investment

32
Where is the industry now?

33
Product Mix

34
Profitability

35
Capital Expenditures

36
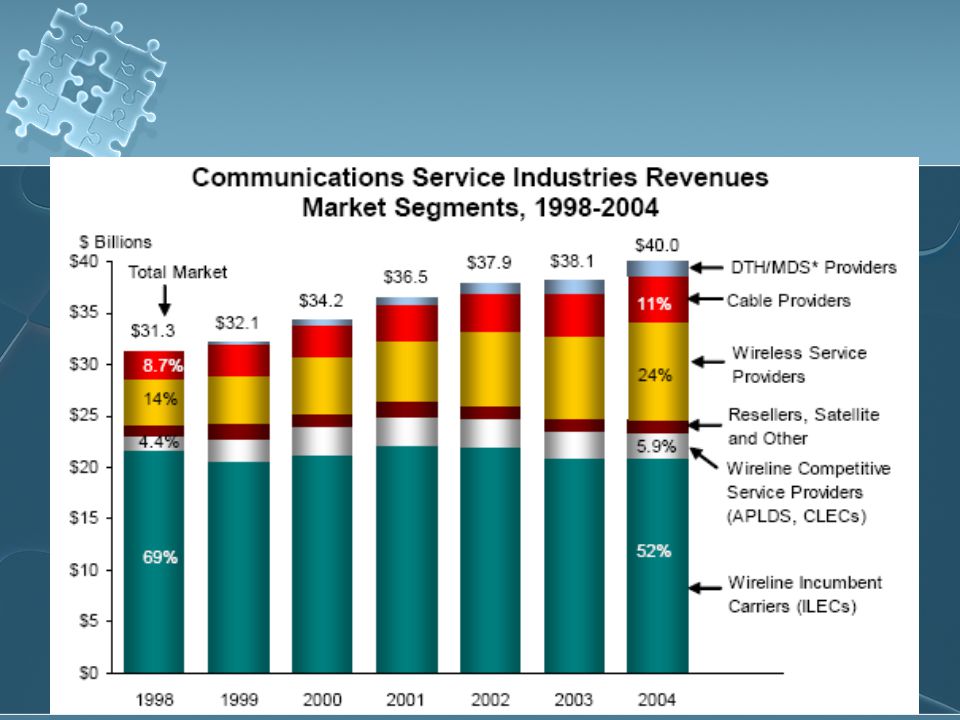
Cable & Other Service Providers Provide television & other services Generate revenue through subscriptions & service fees Primarily installation & advertising sales Charge a fee for services Transmission of programming Cable Systems: fiber optic & coaxial cables Direct Broadcasting Satellite (DBS) Orbiting satellites to customers’ receivers (mini-dishes) Voice over IP Using existing networks to infiltrate the telecom industry Provide television & other services Generate revenue through subscriptions & service fees Primarily installation & advertising sales Charge a fee for services Transmission of programming Cable Systems: fiber optic & coaxial cables Direct Broadcasting Satellite (DBS) Orbiting satellites to customers’ receivers (mini-dishes) Voice over IP Using existing networks to infiltrate the telecom industry
 Orbiting satellites to customers’ receivers (mini-dishes) Voice over IP Using existing networks to infiltrate the telecom industry Provide television & other services Generate revenue through subscriptions & service fees Primarily installation & advertising sales Charge a fee for services Transmission of programming Cable Systems: fiber optic & coaxial cables Direct Broadcasting Satellite (DBS) Orbiting satellites to customers’ receivers (mini-dishes) Voice over IP Using existing networks to infiltrate the telecom industry")
37
Third largest national provider in Canada

38
MTS AllStream Table of contents Current Financial Position Company History and Overview Company Analysis Financial Analysis Forecasting and Recommendations Table of contents Current Financial Position Company History and Overview Company Analysis Financial Analysis Forecasting and Recommendations

39
Current Market Position 10/28/06 Industry:Telecom Ticker Symbol: MBT-T Share Price: 43.15 P/E: 29.80 EPS: 1.45 Dividend: 2.6 (Yield, 5.66%) Shares Outstanding: 68,098,707 Dividend payout expected: $175 million (2006) Industry:Telecom Ticker Symbol: MBT-T Share Price: 43.15 P/E: 29.80 EPS: 1.45 Dividend: 2.6 (Yield, 5.66%) Shares Outstanding: 68,098,707 Dividend payout expected: $175 million (2006)
 Shares Outstanding: 68,098,707 Dividend payout expected: $175 million (2006) Industry:Telecom Ticker Symbol: MBT-T Share Price: P/E: EPS: 1.45 Dividend: 2.6 (Yield, 5.66%) Shares Outstanding: 68,098,707 Dividend payout expected: $175 million (2006)")
40
Return on MTS compared to TSX Share Performance This graph compares the cumulative total return on MTS’s Common Shares over the last nine years with the cumulative total return of the S&P/TSX Composite Index, assuming a $100 investment at the initial offering price of $13.00 and reinvestment of dividends.

41
MTS Allstream Focused Markets MTS offers a full suite of wireline voice, high-speed Internet and data, next generation wireless, directory, digital television, security and alarm monitoring services.

42
History on MTZ Manitoba Telecom Services Inc. (MTS) was founded by the Manitoba government in 1908. In 1996 Manitoba was privatized. In January 1999 MTS partnered with Bell Canada to form Intrigna, which was a company created to expand telecommunications options for the business market in Alberta and British Columbia. In August 1999 MTS completed work on a new trunked (digital) radio system known as FleetNet 800, technology licensed from neighboring Sasktel 2000Initiated broadband service in Manitoba In 2004, MTS acquired Allstream (formerly AT&T Canada) for $1.7 billion and merged both companies. This acquisition made MTS the third largest national telecom in Canada. MTS also ended its strategic alliance with bell in 2004 Manitoba Telecom Services Inc. (MTS) was founded by the Manitoba government in 1908. In 1996 Manitoba was privatized. In January 1999 MTS partnered with Bell Canada to form Intrigna, which was a company created to expand telecommunications options for the business market in Alberta and British Columbia. In August 1999 MTS completed work on a new trunked (digital) radio system known as FleetNet 800, technology licensed from neighboring Sasktel 2000Initiated broadband service in Manitoba In 2004, MTS acquired Allstream (formerly AT&T Canada) for $1.7 billion and merged both companies. This acquisition made MTS the third largest national telecom in Canada. MTS also ended its strategic alliance with bell in 2004
 radio system known as FleetNet 800, technology licensed from neighboring Sasktel 2000Initiated broadband service in Manitoba In 2004, MTS acquired Allstream (formerly AT&T Canada) for $1.7 billion and merged both companies. This acquisition made MTS the third largest national telecom in Canada. MTS also ended its strategic alliance with bell in 2004 Manitoba Telecom Services Inc. (MTS) was founded by the Manitoba government in In 1996 Manitoba was privatized. In January 1999 MTS partnered with Bell Canada to form Intrigna, which was a company created to expand telecommunications options for the business market in Alberta and British Columbia. In August 1999 MTS completed work on a new trunked (digital) radio system known as FleetNet 800, technology licensed from neighboring Sasktel 2000Initiated broadband service in Manitoba In 2004, MTS acquired Allstream (formerly AT&T Canada) for $1.7 billion and merged both companies. This acquisition made MTS the third largest national telecom in Canada. MTS also ended its strategic alliance with bell in")
43
History Cont. July, 2005 MTS Allstream acquired Delphi Solutions Corp by purchasing its outstanding shares for $15 million in cash. The acquisition was an important step in positioning the company to take advantage of the migration of customer networks to converged Internet Protocol ( “ IP ” ) technologies. Dec 7 th, 2005 former BCE executive Pierre Blouin was named new Chief Executive Officer of Manitoba Telecom Services Inc. and MTS Allstream Inc, replace longtime CEO Bill Fraser. September 12, 2006 MTS Allstream acquires Valley Cable Vision (local cable company serving 3700 cable customers) October 02, 2006 MTS Allstream announces Voluntary Reduction Program for Manitoba Employees. Part of TP2. July, 2005 MTS Allstream acquired Delphi Solutions Corp by purchasing its outstanding shares for $15 million in cash. The acquisition was an important step in positioning the company to take advantage of the migration of customer networks to converged Internet Protocol ( “ IP ” ) technologies. Dec 7 th, 2005 former BCE executive Pierre Blouin was named new Chief Executive Officer of Manitoba Telecom Services Inc. and MTS Allstream Inc, replace longtime CEO Bill Fraser. September 12, 2006 MTS Allstream acquires Valley Cable Vision (local cable company serving 3700 cable customers) October 02, 2006 MTS Allstream announces Voluntary Reduction Program for Manitoba Employees. Part of TP2.
 technologies. Dec 7 th, 2005 former BCE executive Pierre Blouin was named new Chief Executive Officer of Manitoba Telecom Services Inc. and MTS Allstream Inc, replace longtime CEO Bill Fraser. September 12, 2006 MTS Allstream acquires Valley Cable Vision (local cable company serving 3700 cable customers) October 02, 2006 MTS Allstream announces Voluntary Reduction Program for Manitoba Employees. Part of TP2. July, 2005 MTS Allstream acquired Delphi Solutions Corp by purchasing its outstanding shares for $15 million in cash. The acquisition was an important step in positioning the company to take advantage of the migration of customer networks to converged Internet Protocol ( IP ) technologies. Dec 7 th, 2005 former BCE executive Pierre Blouin was named new Chief Executive Officer of Manitoba Telecom Services Inc. and MTS Allstream Inc, replace longtime CEO Bill Fraser. September 12, 2006 MTS Allstream acquires Valley Cable Vision (local cable company serving 3700 cable customers) October 02, 2006 MTS Allstream announces Voluntary Reduction Program for Manitoba Employees. Part of TP2..")
44
Key Individuals Pierre Blouin CEO 2005~ a seasoned telecommunications executive, who spent 20 years + at BCE Inc. 2003 - 2005 Group President, Consumer Markets, Bell Canada. Responsible for all of Bell ’ s consumer products – nearly $10 billion in business annually. 2002 - 2003: CEO of BCE Emergis 2000 - 2002: CEO of Bell Mobility Kelvin A. Shepherd. President, MTS (Manitoba) 2006~ CTO of MTS 2000 ~ 2005 20 years with Saskatchewan Telecom.
 2006~ CTO of MTS 2000 ~ years with Saskatchewan Telecom..")
45
Key Individuals cont. Thomas E. Stefanson Current Positions: Manitoba Telecom Services Inc., chr. & dir. Associations: Fellow of the Institute of Chartered Accountants - F.C.A. Officer since 1989. Wayne S. Demkey, CA Executive Vice President, Finance & CFO; Joined MTS in 1996 1996. 11 years as senior manager at KPMG

46
Company Analysis

47
Manitoba network coverage across Canada. Manitoba network coverage in Canada runs across majority of the country, with services in several fields

48
Operating Revenue 2001-2005

49
Revenue Breakdown per Segment 2001-2005

50
% change in revenue

51
Customer Growth

52
Enterprise Solution Customer base

53
MTS Consumer and B2B solutions Consumer: MTS provides several services for its consumer based market. The major accountability for future growth in the consumer brand is from wireless services, IP-based data connectivity, high-speed internet and digital television. B2B: Operating under the Allstream brand, Enterprise Solutions division is a strong national competitor in the Canadian telecommunications market. This division has a solid track record of developing innovative solutions that help mid-sized and large businesses compete more effectively. Consumer: MTS provides several services for its consumer based market. The major accountability for future growth in the consumer brand is from wireless services, IP-based data connectivity, high-speed internet and digital television. B2B: Operating under the Allstream brand, Enterprise Solutions division is a strong national competitor in the Canadian telecommunications market. This division has a solid track record of developing innovative solutions that help mid-sized and large businesses compete more effectively.

54
Consumer Market Division MTS’s Consumer Markets division, is one of Canada’s strongest communications franchises. During 2005, there was overall growth from its operations, with particularly strong performance from wireless, Internet and digital television services. In total revenues from these growth services grew by 18% in 2005. Wireline telephony business faced competition from the long-anticipated entry of the cable companies in this market. MTS’s Consumer Markets division, is one of Canada’s strongest communications franchises. During 2005, there was overall growth from its operations, with particularly strong performance from wireless, Internet and digital television services. In total revenues from these growth services grew by 18% in 2005. Wireline telephony business faced competition from the long-anticipated entry of the cable companies in this market.

55
Future Goals to Increase Profitability In the fourth quarter of 2005, MTS launched its Transition Phase II – a two- year, $100 million cost reduction (now raised to 120 million) initiative designed to align its cost structure to the new market realities, and increase profitability. MTS has already achieved $30 million in annualized expense savings as at January 31, 2006. On 30 th Sept they had reached $78 million of these savings. On February 28, 2006, MTS announced the implementation of a new management structure that will help the team become a more cohesive organization, move closer to cost savings target, and drive more profitable growth in the marketplace. In the fourth quarter of 2005, MTS launched its Transition Phase II – a two- year, $100 million cost reduction (now raised to 120 million) initiative designed to align its cost structure to the new market realities, and increase profitability. MTS has already achieved $30 million in annualized expense savings as at January 31, 2006. On 30 th Sept they had reached $78 million of these savings. On February 28, 2006, MTS announced the implementation of a new management structure that will help the team become a more cohesive organization, move closer to cost savings target, and drive more profitable growth in the marketplace.
 initiative designed to align its cost structure to the new market realities, and increase profitability. MTS has already achieved $30 million in annualized expense savings as at January 31, On 30 th Sept they had reached $78 million of these savings. On February 28, 2006, MTS announced the implementation of a new management structure that will help the team become a more cohesive organization, move closer to cost savings target, and drive more profitable growth in the marketplace..")
56
EPS trend for the last 5 years The Sharp incline in EPS from 03 to 04 was due to the acquisition of Allstream

57
MTS EPS Analysis For the twelve months ended December 31, 2005, EPS from continuing operations climbed to $2.74, which is up by 10.9% or $0.27 from 2004. This increase is primarily attributable to the consolidation of Allstream’s financial results beginning June 4, 2004, together with growth in our Manitoba division and synergies realized.

58
EBITDA for the 5 year period ended 2005

59
Restructuring costs

60
Reason for sharp increase in restructuring cost. Total predicted acquisition of Allstream would be approximately $90 million. These expenses included severance and other employee-related costs, as well as costs to consolidate facilities, systems and operations. This amount includes (i) costs of $24.0 million that were incurred and included in the accounting for the acquisition of Allstream; (ii) $23.0 million that was expensed and $23.0 million that was capitalized for restructuring and integration costs incurred in 2004 and 2005; and (iii) $19.7 million restructuring and integration costs that were recorded as a liability as part of the purchase price allocation.
 costs of $24.0 million that were incurred and included in the accounting for the acquisition of Allstream; (ii) $23.0 million that was expensed and $23.0 million that was capitalized for restructuring and integration costs incurred in 2004 and 2005; and (iii) $19.7 million restructuring and integration costs that were recorded as a liability as part of the purchase price allocation..")
61
Competition

62
Stock Price Analysis MBT Vs Telus.

63
MBT vs BCE

64
Information for 2006 Third Quarter dividend : $0.65 FCF increase: 24.1% ($191.8 million) Cost reduction under TP2: $70 million Revenue increase due to Growth: (15%) $44 million Data Connectivity Revenue Increase: 58.9% Wireless Revenue Increase: 12.9% Increase in Cellular Customers: 11.6% Digital Television Customer Increase: 36.8% High-Speed Internet Customer Increase: 18.2% No Tax expense until 2014, due to Purchase of Allstream Third Quarter dividend : $0.65 FCF increase: 24.1% ($191.8 million) Cost reduction under TP2: $70 million Revenue increase due to Growth: (15%) $44 million Data Connectivity Revenue Increase: 58.9% Wireless Revenue Increase: 12.9% Increase in Cellular Customers: 11.6% Digital Television Customer Increase: 36.8% High-Speed Internet Customer Increase: 18.2% No Tax expense until 2014, due to Purchase of Allstream
 Cost reduction under TP2: $70 million Revenue increase due to Growth: (15%) $44 million Data Connectivity Revenue Increase: 58.9% Wireless Revenue Increase: 12.9% Increase in Cellular Customers: 11.6% Digital Television Customer Increase: 36.8% High-Speed Internet Customer Increase: 18.2% No Tax expense until 2014, due to Purchase of Allstream Third Quarter dividend : $0.65 FCF increase: 24.1% ($191.8 million) Cost reduction under TP2: $70 million Revenue increase due to Growth: (15%) $44 million Data Connectivity Revenue Increase: 58.9% Wireless Revenue Increase: 12.9% Increase in Cellular Customers: 11.6% Digital Television Customer Increase: 36.8% High-Speed Internet Customer Increase: 18.2% No Tax expense until 2014, due to Purchase of Allstream")
65
Expected Financials for 2006

66
MTS Allstream Income Trust? In evaluating a possible conversion to an income trust, management and the Board of Directors carried out an extensive review. An analysis of MTS's current and future cash flows and requirements to sustain the Company was carried out. In addition to ongoing operations expenses included in EBITDA, MTS also incurs additional significant cash costs. These include capital expenditures, interest expense, deferred charges and net funding of the MTS pension plan. The Board believes long-term shareholder value can best be achieved by continuing to follow MTS's proven strategies for delivering value to shareholders. (2004) In evaluating a possible conversion to an income trust, management and the Board of Directors carried out an extensive review. An analysis of MTS's current and future cash flows and requirements to sustain the Company was carried out. In addition to ongoing operations expenses included in EBITDA, MTS also incurs additional significant cash costs. These include capital expenditures, interest expense, deferred charges and net funding of the MTS pension plan. The Board believes long-term shareholder value can best be achieved by continuing to follow MTS's proven strategies for delivering value to shareholders. (2004)
 In evaluating a possible conversion to an income trust, management and the Board of Directors carried out an extensive review. An analysis of MTS s current and future cash flows and requirements to sustain the Company was carried out. In addition to ongoing operations expenses included in EBITDA, MTS also incurs additional significant cash costs. These include capital expenditures, interest expense, deferred charges and net funding of the MTS pension plan. The Board believes long-term shareholder value can best be achieved by continuing to follow MTS s proven strategies for delivering value to shareholders. (2004).")
67
MTS Take over? With recent announcements regarding no tax protection for income trusts. MTS is becoming an attractive target to take over. RBC Capital Markets analyst Jonathan Allen increased his price target from $50 to $54 on speculation the company would be a takeover target. "We believe MTS's tax losses of $2.7 billion including depreciation have become more much attractive and there is a high probability of MTS being acquired over the next year in our view," Allen wrote in a note to clients. In the absence of a take over bid Manitoba Tel shares are valued at $46 per share as a going concern. With recent announcements regarding no tax protection for income trusts. MTS is becoming an attractive target to take over. RBC Capital Markets analyst Jonathan Allen increased his price target from $50 to $54 on speculation the company would be a takeover target. "We believe MTS's tax losses of $2.7 billion including depreciation have become more much attractive and there is a high probability of MTS being acquired over the next year in our view," Allen wrote in a note to clients. In the absence of a take over bid Manitoba Tel shares are valued at $46 per share as a going concern.

68
Fisher’s Valuation Approach CriteriaDetails Superiority in Financial skills, Production, Marketing, Research -Clear strongly positioned Annual Reports -CapEx, Asset Impairment costs: Fairly High -R&D: Moderate to High People Factor-Management: Knowledgeable in the field, top management with plenty of experience. And history of long term presence within a company. Investment Characteristics-Good Market position -Wireless Growth, Data tech growth, cable tv growth P/E RatioP/E 29.8

69
Stock Price over 9 years

70
Recommendation Speculative Buy

71
British Telecom

72
Company Snapshot BT Group plc is a public limited company registered in England and Wales and listed on the London stock Exchange and NYSE Price US$ 54.380 P/E 15.70 Dividend & Yield: 2.83 (5.30%) Current Number of shares held (millions) 8,876 Full Time Employees: 104,400 BT Group plc is a public limited company registered in England and Wales and listed on the London stock Exchange and NYSE Price US$ 54.380 P/E 15.70 Dividend & Yield: 2.83 (5.30%) Current Number of shares held (millions) 8,876 Full Time Employees: 104,400
 Current Number of shares held (millions) 8,876 Full Time Employees: 104,400 BT Group plc is a public limited company registered in England and Wales and listed on the London stock Exchange and NYSE Price US$ P/E Dividend & Yield: 2.83 (5.30%) Current Number of shares held (millions) 8,876 Full Time Employees: 104,400")
73
Shares

74
BT

75
BT vs. FTSE350

76
BT vs. DOW

77
Average Revenue per Customer

78
BT History 1981- Formation of British Telecom 1982- End of BT’s monopoly w/grant of a license to Mercury Communications 1984- Privatization 1990’s joint venture with “ Electricity Supply Board” 1991- trading name Change to 'BT' 1991- The remaining state holdings in the company were sold 1994- Joint venture with MCI: “Concert Communication Services” 2001- demerger 2005- BT acquired El Segundo, California-based telecoms giant Infonet 2005- Openreach segment was opened 2006- BT acquired online electrical retailer Dabs.com 1981- Formation of British Telecom 1982- End of BT’s monopoly w/grant of a license to Mercury Communications 1984- Privatization 1990’s joint venture with “ Electricity Supply Board” 1991- trading name Change to 'BT' 1991- The remaining state holdings in the company were sold 1994- Joint venture with MCI: “Concert Communication Services” 2001- demerger 2005- BT acquired El Segundo, California-based telecoms giant Infonet 2005- Openreach segment was opened 2006- BT acquired online electrical retailer Dabs.com

79
Governance Chairman Sir Christopher Bland Member of the Prime Minister's Advisory Panel on the Citizen's Charter 1996-2001 chairman of the BBC Board of Governors 1982-1994 chairman of the Hammersmith and Queen Charlotte's Hospitals 1995-1996 chairman of the Private Finance Panel 1977-1985 chairman of printers and publishers Sir Joseph Causton & Sons 1972-1979 deputy chairman of the Independent Broadcasting Authority and chairman of its Complaints Review Board Chairman Sir Christopher Bland Member of the Prime Minister's Advisory Panel on the Citizen's Charter 1996-2001 chairman of the BBC Board of Governors 1982-1994 chairman of the Hammersmith and Queen Charlotte's Hospitals 1995-1996 chairman of the Private Finance Panel 1977-1985 chairman of printers and publishers Sir Joseph Causton & Sons 1972-1979 deputy chairman of the Independent Broadcasting Authority and chairman of its Complaints Review Board

80
Governance CEO Ben Verwaayen Since joining BT Group 1997, he had been with Lucent Technologies Inc ( his position on leaving was was vice chairman of the management board, he previously was executive vice- president ) Prior to joining Lucent, Ben worked for KPN in the Netherlands for nine years as president and managing director of its subsidiary PTT Telecom Education : Master's degree in law and international politics from the State University of Utrecht, Holland. CEO Ben Verwaayen Since joining BT Group 1997, he had been with Lucent Technologies Inc ( his position on leaving was was vice chairman of the management board, he previously was executive vice- president ) Prior to joining Lucent, Ben worked for KPN in the Netherlands for nine years as president and managing director of its subsidiary PTT Telecom Education : Master's degree in law and international politics from the State University of Utrecht, Holland.
 Prior to joining Lucent, Ben worked for KPN in the Netherlands for nine years as president and managing director of its subsidiary PTT Telecom Education : Master s degree in law and international politics from the State University of Utrecht, Holland..")
81
Governance CFO Hanif Lalani Since joining BT in 1983, he has held a variety of roles in the BT’s UK and international divisions: 1998, finance director BT Northern Ireland 1999, was appointed chief executive of BT Northern Ireland 1999-2000, chairman of OCEAN Communications (BT's subsidiary in the Republic of Ireland) 2002, was appointed managing director BT Regions. 2002, Hanif returned to London as chief finance officer for BT Wholesale Education : BA Honours degree in mathematics, operations, research and economics from Essex University. CFO Hanif Lalani Since joining BT in 1983, he has held a variety of roles in the BT’s UK and international divisions: 1998, finance director BT Northern Ireland 1999, was appointed chief executive of BT Northern Ireland 1999-2000, chairman of OCEAN Communications (BT's subsidiary in the Republic of Ireland) 2002, was appointed managing director BT Regions. 2002, Hanif returned to London as chief finance officer for BT Wholesale Education : BA Honours degree in mathematics, operations, research and economics from Essex University.
 2002, was appointed managing director BT Regions. 2002, Hanif returned to London as chief finance officer for BT Wholesale Education : BA Honours degree in mathematics, operations, research and economics from Essex University..")
82
Market Position & Power 1984’s the Telecommunications Act 1984-1900 only BT and Mercury were licensed to provide fixed line telecom networks in the UK. 1990s, new national Public Telecommunications companies entered the market. BT’s operations regulated by British telecoms operator Ofcom (imposing obligations such as meeting reasonable requests to supply services and not to discriminate) 1984’s the Telecommunications Act 1984-1900 only BT and Mercury were licensed to provide fixed line telecom networks in the UK. 1990s, new national Public Telecommunications companies entered the market. BT’s operations regulated by British telecoms operator Ofcom (imposing obligations such as meeting reasonable requests to supply services and not to discriminate)
 1984’s the Telecommunications Act only BT and Mercury were licensed to provide fixed line telecom networks in the UK. 1990s, new national Public Telecommunications companies entered the market. BT’s operations regulated by British telecoms operator Ofcom (imposing obligations such as meeting reasonable requests to supply services and not to discriminate).")
83
Current Market Share Data The FTSE 350 Index incorporates the largest 350 companies by capitalization which have their primary listing on the London Stock Exchange

84
Current Technologies Traditional Telephone exchanges or switches, trunk network and local loop connections Universal Service Obligation (USO) Newer Broadband internet service Bespoke solutions ( made to fit customer’s needs) IT Traditional Telephone exchanges or switches, trunk network and local loop connections Universal Service Obligation (USO) Newer Broadband internet service Bespoke solutions ( made to fit customer’s needs) IT
 Newer Broadband internet service Bespoke solutions ( made to fit customer’s needs) IT Traditional Telephone exchanges or switches, trunk network and local loop connections Universal Service Obligation (USO) Newer Broadband internet service Bespoke solutions ( made to fit customer’s needs) IT")
85
BT Group BT Retail-retail telecoms to consumers BT Wholesale- Wholesale telecoms core trunk network Openreach- fenced-off wholesale division, tasked with ensuring that all rival operators have equality of access to BT's own local network BT Global Services- Business services and solutions (formerly BT Ignite and BT Syntegra) BT Exact- Consultancy and internal IT solutions. Group operations- handles security, research and development, and other functions for BT Group Plc such as legal services BT Retail-retail telecoms to consumers BT Wholesale- Wholesale telecoms core trunk network Openreach- fenced-off wholesale division, tasked with ensuring that all rival operators have equality of access to BT's own local network BT Global Services- Business services and solutions (formerly BT Ignite and BT Syntegra) BT Exact- Consultancy and internal IT solutions. Group operations- handles security, research and development, and other functions for BT Group Plc such as legal services
 BT Exact- Consultancy and internal IT solutions. Group operations- handles security, research and development, and other functions for BT Group Plc such as legal services.")
86
Connections

87
BT's recent developments BT has recently announced its first step into 3G with the launch of a combined Wi-Fi, 3G and GPRS tariff, known as BT Datazone. BT is investing 75% of its total capital spending, in its new Internet protocol(IP) based 21 st Century Network (21CN) In June 2006, BT launched BT Total Broadband - new broadband packages BT Vision (a broadband Television service ) BT has recently announced its first step into 3G with the launch of a combined Wi-Fi, 3G and GPRS tariff, known as BT Datazone. BT is investing 75% of its total capital spending, in its new Internet protocol(IP) based 21 st Century Network (21CN) In June 2006, BT launched BT Total Broadband - new broadband packages BT Vision (a broadband Television service )
 based 21 st Century Network (21CN) In June 2006, BT launched BT Total Broadband - new broadband packages BT Vision (a broadband Television service ) BT has recently announced its first step into 3G with the launch of a combined Wi-Fi, 3G and GPRS tariff, known as BT Datazone. BT is investing 75% of its total capital spending, in its new Internet protocol(IP) based 21 st Century Network (21CN) In June 2006, BT launched BT Total Broadband - new broadband packages BT Vision (a broadband Television service ).")
88
Strategy

89
Financial Analysis

90
Headline financials - historical summary

91
Operation Analysis Revenue Breakdown (2006)
")
92
Revenue Breakdown per Segment 2002-2006

93
financials - lines of business * Before specific items ** Operating free cash flow (EBITDA less capital expenditure)
")
94
As of Q1 ended 30 June ’06: Company Analysis

95
Free Cash Flow

96
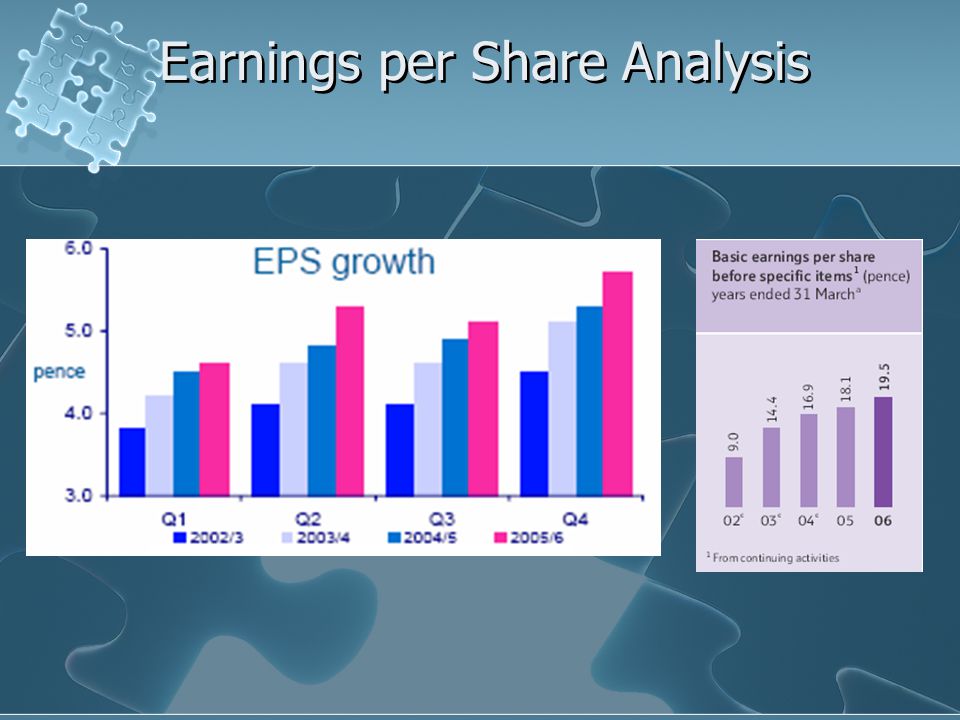
Free Cash Flow Chart Year ended 31 March ’06 * Before specific items Free cash flow £1.6bn for 2006 Profit before tax* £2.2bn up 5% on last year Year ended 31 March ’06 * Before specific items Free cash flow £1.6bn for 2006 Profit before tax* £2.2bn up 5% on last year

97
Earnings per Share Analysis

99
CapEx & Profit

100
Performance

101
Fisher’s Valuation Approach

102
CriteriaDetails Superiority in Financial skills, Production, Marketing, Research -Clear Annual Reports -Britain’s first Wi-Fi cities & 3G -CapEx, Asset Impairment costs: reasonable -R&D: Moderate People Factor-Management: Knowledgeable in the field, long-term managers -Long-term management & employees ( Training the management from within the org) Investment Characteristics of Some Business -Strong Market position & power -G3 & IT sectors potentials -Wireless Growth -Dow Jones Telecom Sustainable Index Award winner for last five years P/E RatioP/E 15.70
 Investment Characteristics of Some Business -Strong Market position & power -G3 & IT sectors potentials -Wireless Growth -Dow Jones Telecom Sustainable Index Award winner for last five years P/E RatioP/E 15.70")
103
Recommendation Buy

105
Agenda 1. Company Background 2. Products/services 3. Financial analysis 4. Fisher’s valuation approach 5. Recommendation 1. Company Background 2. Products/services 3. Financial analysis 4. Fisher’s valuation approach 5. Recommendation

106
1. Company Background

107
Company Snapshot Ticker Symbol: S Index Membership: S&P 500 S&P 100 S&P 1500 Super Comp Sector: Technology Industry: Diversified Communication Full Time Employees: 79, 900 Ticker Symbol: S Index Membership: S&P 500 S&P 100 S&P 1500 Super Comp Sector: Technology Industry: Diversified Communication Full Time Employees: 79, 900

108
Company Snapshot Using avg growth based on Q3 results: (As of Nov 6/06) Last Quote 19.05 52wk Range 15.95-26.89 P/E 40.53 Volume 33 962 100 # of Shares 2987.5M Market Cap 55.46B Rev. 40 778.67B % Held by Insiders 1.25 NI 1 381.33M % Held by Institutions 86 EPS 0.47 Div/Share 0.01 Yield 0.5% Using avg growth based on Q3 results: (As of Nov 6/06) Last Quote 19.05 52wk Range 15.95-26.89 P/E 40.53 Volume 33 962 100 # of Shares 2987.5M Market Cap 55.46B Rev. 40 778.67B % Held by Insiders 1.25 NI 1 381.33M % Held by Institutions 86 EPS 0.47 Div/Share 0.01 Yield 0.5%
 Last Quote wk Range P/E Volume # of Shares M Market Cap 55.46B Rev B % Held by Insiders 1.25 NI M % Held by Institutions 86 EPS 0.47 Div/Share 0.01 Yield 0.5%.")
109
Stock Price Behavior Daily (1985-2006) Stock Price Behavior 1985-present
 Stock Price Behavior 1985-present")
110
Sprint-Nextel vs. S&P Telecom 5-yr Daily (2001-2006)
")
111
Sprint-Nextel vs. NASDAQ Composite 5-yr Daily (2001-2006)
")
112
Sprint-Nextel vs S&P 500 5yr Daily (2001-2006)
")
113
General Background Founded: 1899, Cleyson Brown, landline telephone (Bell System’s competitor); HQ: Virginia Steady growth through acquisitions Enter long-distance voice: acquire ISACOMM (1981), US Tel. (1984) Sprint-MCI $129B merger (1995) falls through Mission: “To be No. 1 in providing a simple, instant, enriching and productive customer experience.” Global Tier 1 backbone operator 3 rd largest wireless network in US; 51.9M subscribers ($668 in revenues / subscriber in 2005) Largest independent local telephone provider Industry pioneer Secured spot in 2.5Ghz range Founded: 1899, Cleyson Brown, landline telephone (Bell System’s competitor); HQ: Virginia Steady growth through acquisitions Enter long-distance voice: acquire ISACOMM (1981), US Tel. (1984) Sprint-MCI $129B merger (1995) falls through Mission: “To be No. 1 in providing a simple, instant, enriching and productive customer experience.” Global Tier 1 backbone operator 3 rd largest wireless network in US; 51.9M subscribers ($668 in revenues / subscriber in 2005) Largest independent local telephone provider Industry pioneer Secured spot in 2.5Ghz range
 Sprint-MCI $129B merger (1995) falls through Mission: To be No. 1 in providing a simple, instant, enriching and productive customer experience. Global Tier 1 backbone operator 3 rd largest wireless network in US; 51.9M subscribers ($668 in revenues / subscriber in 2005) Largest independent local telephone provider Industry pioneer Secured spot in 2.5Ghz range Founded: 1899, Cleyson Brown, landline telephone (Bell System’s competitor); HQ: Virginia Steady growth through acquisitions Enter long-distance voice: acquire ISACOMM (1981), US Tel. (1984) Sprint-MCI $129B merger (1995) falls through Mission: To be No. 1 in providing a simple, instant, enriching and productive customer experience. Global Tier 1 backbone operator 3 rd largest wireless network in US; 51.9M subscribers ($668 in revenues / subscriber in 2005) Largest independent local telephone provider Industry pioneer Secured spot in 2.5Ghz range.")
114
General Background Con’t Founded: 1987, Morgan O'Brien Focus on wireless 5 th leading provider in US mobile phone industry 18.5M subscribers; southern US-popular Market-defining innovation Loyal customer base Founded: 1987, Morgan O'Brien Focus on wireless 5 th leading provider in US mobile phone industry 18.5M subscribers; southern US-popular Market-defining innovation Loyal customer base

115
General Background Con’t Sprint-Nextel merger Aug. 12/05 Shareholders “overwhelmingly approved” Affiliates “strongly opposed” ($19.58B in problems over 3 yrs)
.")
116
Post-Merger: Forced Acquisitions - $1.3B: Sprint’s PCS affiliate US Unwired (2005); 0.5M direct customers - $4.3B (announce): PCS affiliate Alamosa Holdings (2005); 1.48M potential customers - $98M: Enterprise Communications (2006); 52K customers to Wireless division - $6.5B (announce): the largest of Nextel's affiliates to end Nextel Partners' opposition to any changes by Sprint in relation to the NEXTEL merger (2006); 2M direct customers - $1.3B: Sprint’s PCS affiliate US Unwired (2005); 0.5M direct customers - $4.3B (announce): PCS affiliate Alamosa Holdings (2005); 1.48M potential customers - $98M: Enterprise Communications (2006); 52K customers to Wireless division - $6.5B (announce): the largest of Nextel's affiliates to end Nextel Partners' opposition to any changes by Sprint in relation to the NEXTEL merger (2006); 2M direct customers
; 0.5M direct customers - $4.3B (announce): PCS affiliate Alamosa Holdings (2005); 1.48M potential customers - $98M: Enterprise Communications (2006); 52K customers to Wireless division - $6.5B (announce): the largest of Nextel s affiliates to end Nextel Partners opposition to any changes by Sprint in relation to the NEXTEL merger (2006); 2M direct customers - $1.3B: Sprint’s PCS affiliate US Unwired (2005); 0.5M direct customers - $4.3B (announce): PCS affiliate Alamosa Holdings (2005); 1.48M potential customers - $98M: Enterprise Communications (2006); 52K customers to Wireless division - $6.5B (announce): the largest of Nextel s affiliates to end Nextel Partners opposition to any changes by Sprint in relation to the NEXTEL merger (2006); 2M direct customers")
117
Competition

118
Timeline: Sprint, Nextel 1976: $1bil. Rev (Sprint- S) 1980s: Enter long distance; leader: fiber-optic network & packet data network (S) 1990s: Global leader: voice & data services (S) 1992: Internet pioneer (S) 1993: First provider: local, long dist., wireless (S) 1996: 1 st Digital wireless network (S) 1996: iDen tech. – talk of the industry (Nextel-N) 1998: Fiber-optic connection (N) 2000: Worldwide service: largest digital wireless coverage (N) 2001: Walkie-talkie; 1 st Java phone (N); Transatlantic IP backbone (S) 2002: 1 st Wireless national network (S); 1 st GPS phone (S) 2003: 1 st To begin conversion to next-generation packet network (S) 2004: NASCAR partnership (N); EV-DO plans (S) 1976: $1bil. Rev (Sprint- S) 1980s: Enter long distance; leader: fiber-optic network & packet data network (S) 1990s: Global leader: voice & data services (S) 1992: Internet pioneer (S) 1993: First provider: local, long dist., wireless (S) 1996: 1 st Digital wireless network (S) 1996: iDen tech. – talk of the industry (Nextel-N) 1998: Fiber-optic connection (N) 2000: Worldwide service: largest digital wireless coverage (N) 2001: Walkie-talkie; 1 st Java phone (N); Transatlantic IP backbone (S) 2002: 1 st Wireless national network (S); 1 st GPS phone (S) 2003: 1 st To begin conversion to next-generation packet network (S) 2004: NASCAR partnership (N); EV-DO plans (S)
 1980s: Enter long distance; leader: fiber-optic network & packet data network (S) 1990s: Global leader: voice & data services (S) 1992: Internet pioneer (S) 1993: First provider: local, long dist., wireless (S) 1996: 1 st Digital wireless network (S) 1996: iDen tech. – talk of the industry (Nextel-N) 1998: Fiber-optic connection (N) 2000: Worldwide service: largest digital wireless coverage (N) 2001: Walkie-talkie; 1 st Java phone (N); Transatlantic IP backbone (S) 2002: 1 st Wireless national network (S); 1 st GPS phone (S) 2003: 1 st To begin conversion to next-generation packet network (S) 2004: NASCAR partnership (N); EV-DO plans (S) 1976: $1bil. Rev (Sprint- S) 1980s: Enter long distance; leader: fiber-optic network & packet data network (S) 1990s: Global leader: voice & data services (S) 1992: Internet pioneer (S) 1993: First provider: local, long dist., wireless (S) 1996: 1 st Digital wireless network (S) 1996: iDen tech. – talk of the industry (Nextel-N) 1998: Fiber-optic connection (N) 2000: Worldwide service: largest digital wireless coverage (N) 2001: Walkie-talkie; 1 st Java phone (N); Transatlantic IP backbone (S) 2002: 1 st Wireless national network (S); 1 st GPS phone (S) 2003: 1 st To begin conversion to next-generation packet network (S) 2004: NASCAR partnership (N); EV-DO plans (S).")
119
Strategy Customer experience Innovation, R&D: pioneer in industry Focus on wireless, broadband Operational efficiencies: restructuring, cost- savings, R&D direction: -ve EBIT Customer experience Innovation, R&D: pioneer in industry Focus on wireless, broadband Operational efficiencies: restructuring, cost- savings, R&D direction: -ve EBIT

120
Key Awards Innovation - Outstanding Corporate Innovator 2005 - 1 st In innovation category 2006 Management - 2 nd most admired company in Telecom - Institutional Investor: #1 in Telecom: most shareholder-friendly Fortune Magazine 2006: #59/100 of best companies to work for Credit risk management HRC's Corporate Equality Index: 100% Innovation - Outstanding Corporate Innovator 2005 - 1 st In innovation category 2006 Management - 2 nd most admired company in Telecom - Institutional Investor: #1 in Telecom: most shareholder-friendly Fortune Magazine 2006: #59/100 of best companies to work for Credit risk management HRC's Corporate Equality Index: 100%

121
Management Corporate Governance Quotient: “Sprint-Nextel is better than 45.6% of S&P500 companies and 96.6% of Telecom. Services companies as of Oct 06.” Corporate Governance Quotient: “Sprint-Nextel is better than 45.6% of S&P500 companies and 96.6% of Telecom. Services companies as of Oct 06.”

122
Management Timothy M. Donahue Executive Chairman Nextel: Jan. 1996 President and Chief Operating Officer Fortune 200: record-setting performance Forbes: top-rated CEO in Telecom. 2005 John Carroll University, BA (Eng. Literature) NE regional president for AT&T Wireless Services operations (1991-1996) On the Boards of Kodak, John Carroll Univ., NVR, Inc. Timothy M. Donahue Executive Chairman Nextel: Jan. 1996 President and Chief Operating Officer Fortune 200: record-setting performance Forbes: top-rated CEO in Telecom. 2005 John Carroll University, BA (Eng. Literature) NE regional president for AT&T Wireless Services operations (1991-1996) On the Boards of Kodak, John Carroll Univ., NVR, Inc.
 NE regional president for AT&T Wireless Services operations ( ) On the Boards of Kodak, John Carroll Univ., NVR, Inc. Timothy M. Donahue Executive Chairman Nextel: Jan President and Chief Operating Officer Fortune 200: record-setting performance Forbes: top-rated CEO in Telecom John Carroll University, BA (Eng. Literature) NE regional president for AT&T Wireless Services operations ( ) On the Boards of Kodak, John Carroll Univ., NVR, Inc..")
123
Management Gary D. Forsee President and Chief Executive Officer Sprint: May 2003 Appointed to National Security Telecom. Advisory Committee by Bush in 2004 BusinessWeek: 1 of best leaders 2005, 1 of 19 best managers 2004 Sprint emerges as 1 of strongest competitors Sprint's equity value rises 72% University of Missouri (BS in engineering) Awarded an honorary Doctor of Engineering degree (2005) 18 years at AT&T and Southwestern Bell VP of gov’t sales and programs (AT&T's Federal Systems) Gary D. Forsee President and Chief Executive Officer Sprint: May 2003 Appointed to National Security Telecom. Advisory Committee by Bush in 2004 BusinessWeek: 1 of best leaders 2005, 1 of 19 best managers 2004 Sprint emerges as 1 of strongest competitors Sprint's equity value rises 72% University of Missouri (BS in engineering) Awarded an honorary Doctor of Engineering degree (2005) 18 years at AT&T and Southwestern Bell VP of gov’t sales and programs (AT&T's Federal Systems)
 Awarded an honorary Doctor of Engineering degree (2005) 18 years at AT&T and Southwestern Bell VP of gov’t sales and programs (AT&T s Federal Systems) Gary D. Forsee President and Chief Executive Officer Sprint: May 2003 Appointed to National Security Telecom. Advisory Committee by Bush in 2004 BusinessWeek: 1 of best leaders 2005, 1 of 19 best managers 2004 Sprint emerges as 1 of strongest competitors Sprint s equity value rises 72% University of Missouri (BS in engineering) Awarded an honorary Doctor of Engineering degree (2005) 18 years at AT&T and Southwestern Bell VP of gov’t sales and programs (AT&T s Federal Systems).")
124
Management Paul Saleh Chief Financial Officer Nextel: Sept. 2001: Executive VP and CFO Institutional Investor: best Telecom. CFO 2004, 2005, 2006 Treasury & Risk Management 2005: 1 of 100 most influential people in finance Public Company CFO of the Year Award: 2003, 2006 Univ. of Michigan (MBA-Finance; MS, BS in electrical engineering) VP, CFO: Walt Disney Int. (1997-2001) Senior VP, Treasurer: The Walt Disney Company Paul Saleh Chief Financial Officer Nextel: Sept. 2001: Executive VP and CFO Institutional Investor: best Telecom. CFO 2004, 2005, 2006 Treasury & Risk Management 2005: 1 of 100 most influential people in finance Public Company CFO of the Year Award: 2003, 2006 Univ. of Michigan (MBA-Finance; MS, BS in electrical engineering) VP, CFO: Walt Disney Int. (1997-2001) Senior VP, Treasurer: The Walt Disney Company
 VP, CFO: Walt Disney Int. ( ) Senior VP, Treasurer: The Walt Disney Company Paul Saleh Chief Financial Officer Nextel: Sept. 2001: Executive VP and CFO Institutional Investor: best Telecom. CFO 2004, 2005, 2006 Treasury & Risk Management 2005: 1 of 100 most influential people in finance Public Company CFO of the Year Award: 2003, 2006 Univ. of Michigan (MBA-Finance; MS, BS in electrical engineering) VP, CFO: Walt Disney Int. ( ) Senior VP, Treasurer: The Walt Disney Company.")
125
Major holders HolderPosition# Shares%Reported ForeseeCEO1,514,9100.051Aug 12/06 DonahueExecutive Chairman902,3160.030Aug 12/06 SalehCFO626,3830.021Aug 12/06 Capital Research & Mng Company187,876,8826.37%Jun. 30/06 Growth Fund of America Inc.54,221,0071.84%Jun. 30/06 All Insiders and 5% Owners1.25% Institutional, Mutual Fund Owners86%

126
Current Technologies 3G wireless networks (EV-DO) (data network) - upgrade Ev-Do Rev A (2007): faster speeds - old: 2.4Mbs download, 0.15Mbs upload - new: 3.1Mbs download, 1.8 upload - CapEx $7B by 2007 2G iDEN (Nextel) 2.5, 2.75, 3G CDMA (Sprint) (voice networks) - marketing costs 2008 for conversion 3G wireless networks (EV-DO) (data network) - upgrade Ev-Do Rev A (2007): faster speeds - old: 2.4Mbs download, 0.15Mbs upload - new: 3.1Mbs download, 1.8 upload - CapEx $7B by 2007 2G iDEN (Nextel) 2.5, 2.75, 3G CDMA (Sprint) (voice networks) - marketing costs 2008 for conversion Not Compatible Networks
 (data network) - upgrade Ev-Do Rev A (2007): faster speeds - old: 2.4Mbs download, 0.15Mbs upload - new: 3.1Mbs download, 1.8 upload - CapEx $7B by G iDEN (Nextel) 2.5, 2.75, 3G CDMA (Sprint) (voice networks) - marketing costs 2008 for conversion 3G wireless networks (EV-DO) (data network) - upgrade Ev-Do Rev A (2007): faster speeds - old: 2.4Mbs download, 0.15Mbs upload - new: 3.1Mbs download, 1.8 upload - CapEx $7B by G iDEN (Nextel) 2.5, 2.75, 3G CDMA (Sprint) (voice networks) - marketing costs 2008 for conversion Not Compatible Networks")
127
Future Technologies VoIP Mobile TV WiMax (4G: 15Mbits) Data netowrk Pioneer $3 CapEx 100M people by 2008 Broader coverage Competitive edge Implications Operate on 2.5Ghz VoIP Mobile TV WiMax (4G: 15Mbits) Data netowrk Pioneer $3 CapEx 100M people by 2008 Broader coverage Competitive edge Implications Operate on 2.5Ghz Excited? Not So Much!

128
2. Products & Services

129
Segments Wireless: strong growth Local: spun off 2006: EMBARQ Long Distance: losing money Wireless: strong growth Local: spun off 2006: EMBARQ Long Distance: losing money

130
Wireless Segment Voice Local Long distance Walkie-talkie Data transmission Wireless imaging Internet access Messaging and email services Wireless entertainment Voice Local Long distance Walkie-talkie Data transmission Wireless imaging Internet access Messaging and email services Wireless entertainment

131
Local Segment Voice services Data services Sale of communication equipt. Switched access services Voice services Data services Sale of communication equipt. Switched access services

132
Long Distance Segment Internet service End user ISP Backbone operations Data services ATM Frame relay Internet service End user ISP Backbone operations Data services ATM Frame relay

133
Revenues & Costs Total

134
Revenues & Costs Wireless

135
Revenues & Costs Local

136
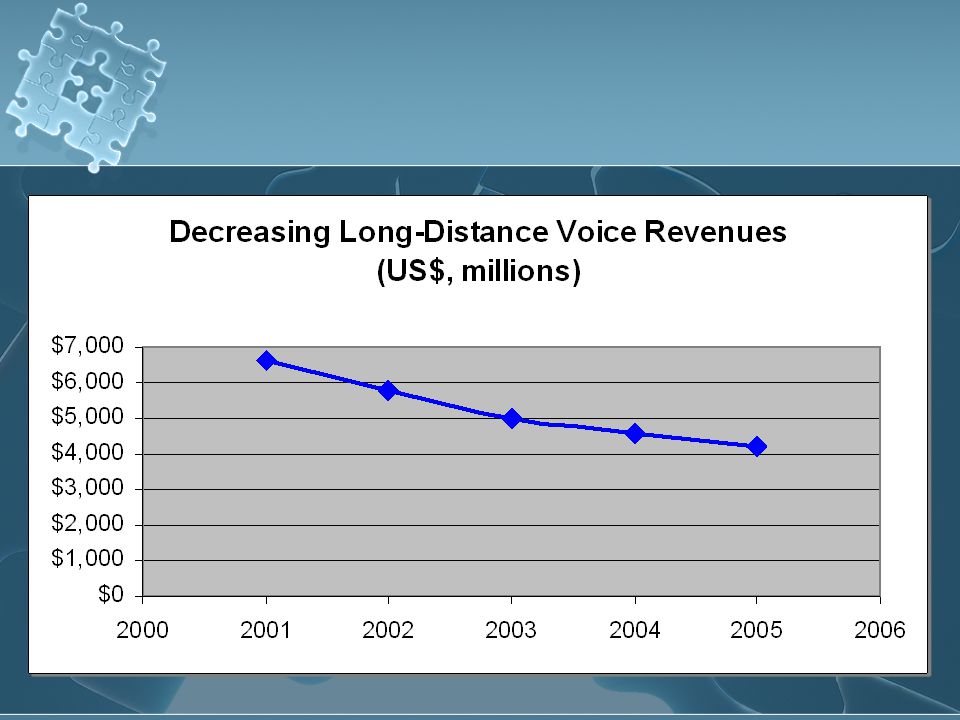
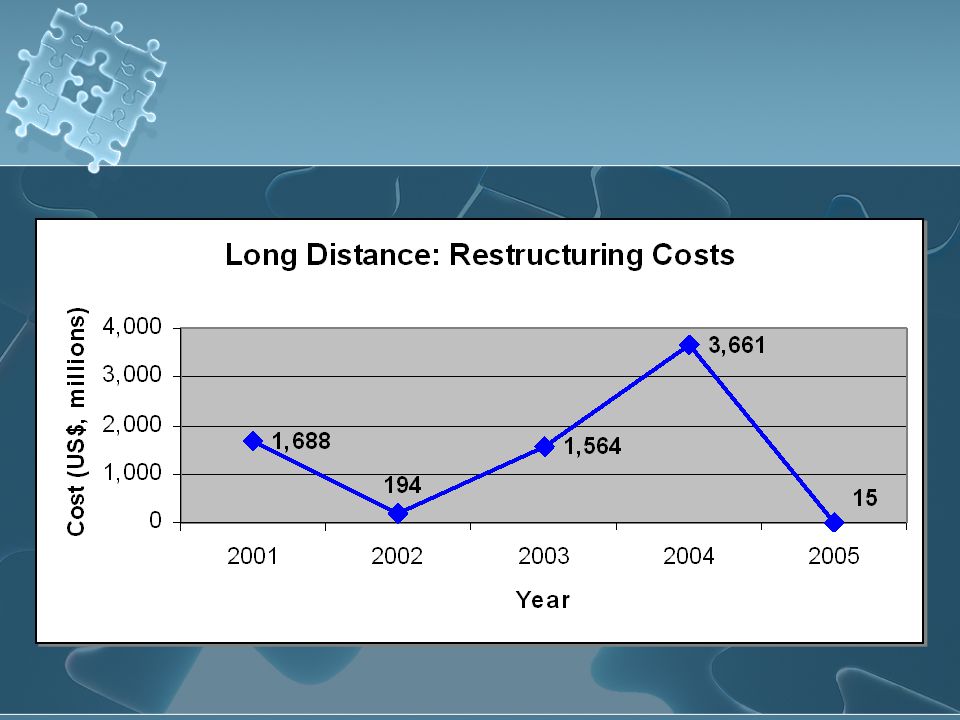
Revenues & Costs Long Distance

139
3. Financial Analysis

140
P/E 40.53

142
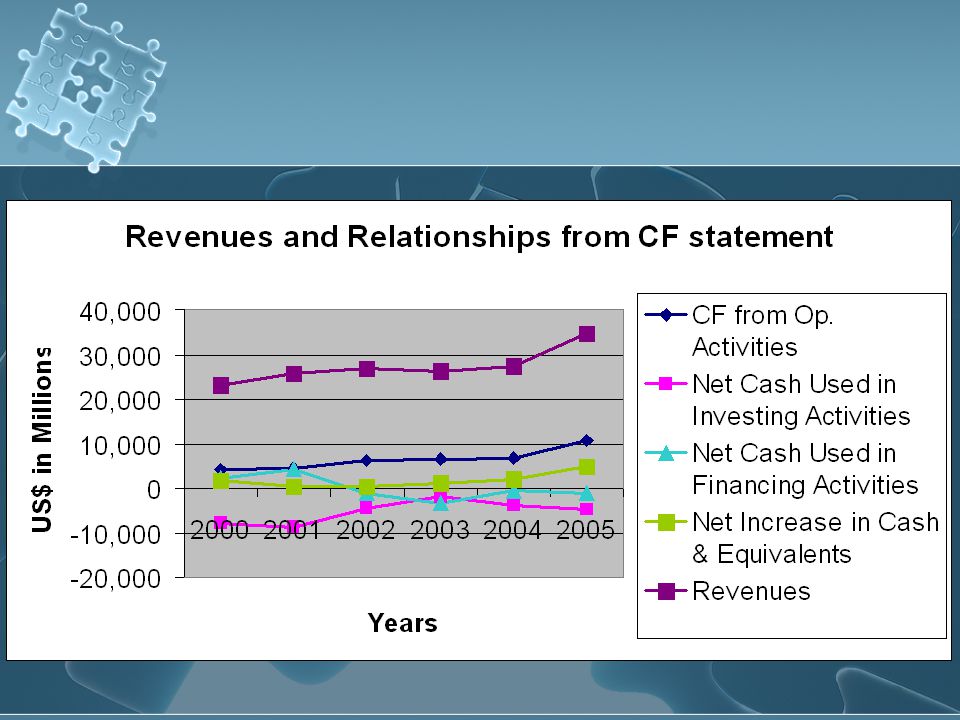
Observations Revenue growth: slow down Misleading revenues; Rev > CF from Op. Act. Losing $, often saved by tax savings Growing revenues, CF from Op. Activities Good underlying business Lose $ from asset impairment, restructuring - $1.66B: litigation (2001) - $1.2B: BRS spectrum fair value decline (2003) - $3.54B: equipment (2004) Revenue growth: slow down Misleading revenues; Rev > CF from Op. Act. Losing $, often saved by tax savings Growing revenues, CF from Op. Activities Good underlying business Lose $ from asset impairment, restructuring - $1.66B: litigation (2001) - $1.2B: BRS spectrum fair value decline (2003) - $3.54B: equipment (2004)
 - $1.2B: BRS spectrum fair value decline (2003) - $3.54B: equipment (2004) Revenue growth: slow down Misleading revenues; Rev > CF from Op. Act. Losing $, often saved by tax savings Growing revenues, CF from Op. Activities Good underlying business Lose $ from asset impairment, restructuring - $1.66B: litigation (2001) - $1.2B: BRS spectrum fair value decline (2003) - $3.54B: equipment (2004).")
144
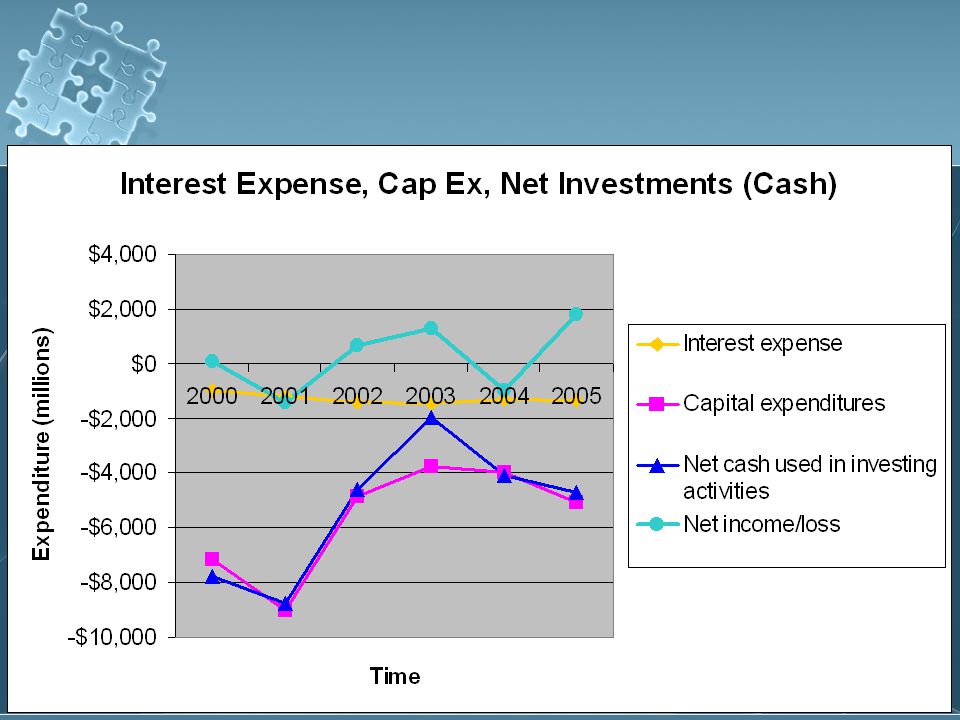
Financing Activities Constant interest expense Cash from financing activities: used mainly to fund capital investments, working capital requirements, retire debt (2005) 2003-4: borrow little due to lower CapEx (mostly), continuously improving Operating CF CapEx is expected to increase Constant interest expense Cash from financing activities: used mainly to fund capital investments, working capital requirements, retire debt (2005) 2003-4: borrow little due to lower CapEx (mostly), continuously improving Operating CF CapEx is expected to increase
 : borrow little due to lower CapEx (mostly), continuously improving Operating CF CapEx is expected to increase Constant interest expense Cash from financing activities: used mainly to fund capital investments, working capital requirements, retire debt (2005) : borrow little due to lower CapEx (mostly), continuously improving Operating CF CapEx is expected to increase")
145
Observations Con’t Large CapEx vs. CF from Op. Activities CapEx: - ≈ $3B always there (to maintain network reliability, upgrade capabilities for providing new products/services, meet capacity demands) - iDen/CDMA tech, mkt, $7B Ev-Do Rev. A (2007) - $3B WiMax (2006-8) - $19.58B in acquisitions due to merger (2005-2007) - TOTAL: $29.58B/4yrs = $7.4B/yr + $3B/yr = $10.4B/yr Borrow more debt to finance CapEx Large CapEx vs. CF from Op. Activities CapEx: - ≈ $3B always there (to maintain network reliability, upgrade capabilities for providing new products/services, meet capacity demands) - iDen/CDMA tech, mkt, $7B Ev-Do Rev. A (2007) - $3B WiMax (2006-8) - $19.58B in acquisitions due to merger (2005-2007) - TOTAL: $29.58B/4yrs = $7.4B/yr + $3B/yr = $10.4B/yr Borrow more debt to finance CapEx
 - iDen/CDMA tech, mkt, $7B Ev-Do Rev. A (2007) - $3B WiMax (2006-8) - $19.58B in acquisitions due to merger ( ) - TOTAL: $29.58B/4yrs = $7.4B/yr + $3B/yr = $10.4B/yr Borrow more debt to finance CapEx Large CapEx vs. CF from Op. Activities CapEx: - ≈ $3B always there (to maintain network reliability, upgrade capabilities for providing new products/services, meet capacity demands) - iDen/CDMA tech, mkt, $7B Ev-Do Rev. A (2007) - $3B WiMax (2006-8) - $19.58B in acquisitions due to merger ( ) - TOTAL: $29.58B/4yrs = $7.4B/yr + $3B/yr = $10.4B/yr Borrow more debt to finance CapEx.")
146
Dividends & Earnings Div 2006: $0.10 Buyback $6B common shares over 18 months (starting Aug 2006) Q3: 91M common shares for $1.5B ($16.48/sh; Aug. market price/share: ≈ $16-17) 2006 shares 2987.5M (due to merger) BUT: cannot afford to buy back Div 2006: $0.10 Buyback $6B common shares over 18 months (starting Aug 2006) Q3: 91M common shares for $1.5B ($16.48/sh; Aug. market price/share: ≈ $16-17) 2006 shares 2987.5M (due to merger) BUT: cannot afford to buy back
 2006 shares M (due to merger) BUT: cannot afford to buy back Div 2006: $0.10 Buyback $6B common shares over 18 months (starting Aug 2006) Q3: 91M common shares for $1.5B ($16.48/sh; Aug. market price/share: ≈ $16-17) 2006 shares M (due to merger) BUT: cannot afford to buy back.")
147
Dividends & Earnings

148
More Observations Merger: double cash (buy back $6B) Cost of merger: goodwill, FCC licenses, customer relationships Merger: double cash (buy back $6B) Cost of merger: goodwill, FCC licenses, customer relationships
 Cost of merger: goodwill, FCC licenses, customer relationships Merger: double cash (buy back $6B) Cost of merger: goodwill, FCC licenses, customer relationships")
149
Rev, Op Costs, Op Income, NI, CapEx Relationships

150
2006 Expectations Net Revenue: $41M Wireless: high single-low double digit growth Long distance: mid single digit loss CapEx $6.3B $14.5B NPV synergies from Nextel merger Net Revenue: $41M Wireless: high single-low double digit growth Long distance: mid single digit loss CapEx $6.3B $14.5B NPV synergies from Nextel merger

151
4. Fisher’s Valuation Approach

152
Fisher: Superiority in Financial skills, Production, Marketing, Research Annual reports: clear, desired info past 2000; prior: not enough info Cost control: COGS, interest expense Restructuring, Asset Impairment costs, CapEx Innovation: high R&D Large mkt campaigns: not always meet expectations Overall: 1.5/5 Annual reports: clear, desired info past 2000; prior: not enough info Cost control: COGS, interest expense Restructuring, Asset Impairment costs, CapEx Innovation: high R&D Large mkt campaigns: not always meet expectations Overall: 1.5/5

153
Fisher: People Factor Fair treatment: pleased employees HRC's Corporate Equality Index: 100% score Fortune 2006: #59 (from 67): Top 100 companies to work for Corp. Gov: fair treatment shareholders, directors’ composition Corporate Governance Quotient score Overall 4.5/5 Fair treatment: pleased employees HRC's Corporate Equality Index: 100% score Fortune 2006: #59 (from 67): Top 100 companies to work for Corp. Gov: fair treatment shareholders, directors’ composition Corporate Governance Quotient score Overall 4.5/5
: Top 100 companies to work for Corp. Gov: fair treatment shareholders, directors’ composition Corporate Governance Quotient score Overall 4.5/5.")
154
Fisher: Investment Characteristics of Some Business Position in market Market share Tier 1 implications Less licensing from others; more to firm Wireless growth, WiMax potential Overall 4/5 Position in market Market share Tier 1 implications Less licensing from others; more to firm Wireless growth, WiMax potential Overall 4/5

155
Fisher: P/E Ratio Expected vs. realistic growth: P/E 40.53 (NI for Earnings, 2006 data) DDM: 9.75% Overall: 0/5 Expected vs. realistic growth: P/E 40.53 (NI for Earnings, 2006 data) DDM: 9.75% Overall: 0/5
 DDM: 9.75% Overall: 0/5 Expected vs. realistic growth: P/E (NI for Earnings, 2006 data) DDM: 9.75% Overall: 0/5.")
156
5. Recommendation

157
Not Buy …in 1.5yrs at a cheaper price?

158
SUMMARY

160
APPENDIX CHARTS

167
AT&T

Similar presentations


Background of PCCW 2)Industry Life Cycle 3)Key Strategies -Where to compete -How to compete.>")


 Marc Reitter Siddhesh Sankulkar T E L E C O M S E C.>")


>")


