Defining the Mean in Simple Terms! Mastering the Basics
The mean, or average, is a measure of central tendency in statistics, representing the center of a dataset. To define the mean, sum all data points and divide by the total number of points, providing a single value that reflects the overall data trend.
Define The Mean!
The mean, commonly known as the average, is a measure of central tendency used in statistics to describe the center of a dataset. It is calculated by summing all the data points and dividing the sum by the total number of points. Understanding how to define the mean is crucial for data analysis and interpretation. In addition, it provides valuable insights into the overall trends and patterns within a dataset.
Highlights
- The mean is a central tendency measure representing the center of a dataset.
- The main mean types are arithmetic, geometric, harmonic, and weighted.
- The arithmetic mean is calculated by summing data points and dividing by their count.
- The mean is sensitive to outliers, which can skew its value.
- Mean, and standard deviation provide insights into central tendency and dispersion.
Ad Title
Ad description. Lorem ipsum dolor sit amet, consectetur adipiscing elit.
What Are Central Tendency Measures?
Central tendency measures are statistical tools that summarize a dataset’s central value or typical score. They help simplify complex datasets by providing a single value representing the center or average. Three main central tendency measures are mean, median, and mode. Each measure provides a different perspective on the dataset, making understanding their differences and applications essential.
Different Types of Mean
While most people are familiar with the arithmetic mean, other types of the mean can be more suitable for specific situations. The three main types of the mean are:
Arithmetic mean: The most common type, calculated by summing all data points and dividing by the total number of points.
Geometric mean: Calculated by multiplying all data points and taking the nth root (n is the total number of points). Useful for data that grows or shrinks constantly, such as investment returns or population growth.
Harmonic mean: Calculated by taking the arithmetic mean reciprocal of the data points reciprocals. Often used in scenarios where rates or ratios are involved, such as speed or efficiency.
Weighted mean: A variation of the arithmetic mean that accounts for the importance or relevance of each data point. It is calculated by multiplying each data point by its respective weight, summing the results, and dividing by the sum of the weights. The weighted mean is useful when some data points have greater significance than others, such as calculating grades or investment portfolios.
Step-by-Step Guide: How to Calculate the Mean
To calculate the arithmetic mean, follow these simple steps:
- Add up all the data points in the dataset.
- Count the total number of data points.
- Divide the sum of the data points by the total number of points.
If you have a dataset with five values, for example, 2, 4, 6, 8, and 10, the mean is calculated as follows:
(2 + 4 + 6 + 8 + 10) / 5 = 30 / 5 = 6
Thus, the mean of the dataset is 6.
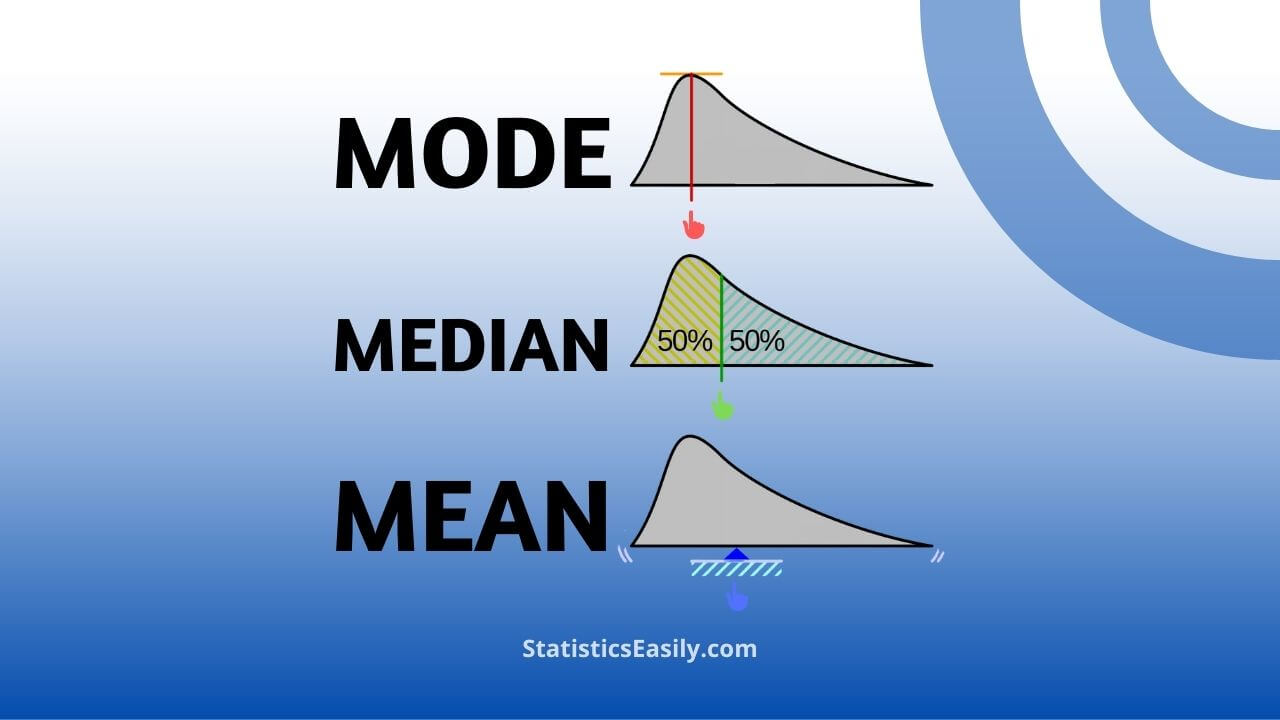
Mean vs. Median vs. Mode
While all three measures of central tendency aim to represent the center of a dataset, they have distinct characteristics and use cases:
Mean: As discussed earlier, the mean is the sum of data points divided by the total number of points. It is sensitive to extreme values, which can skew the mean.
Median: The middle value in a dataset when the data points are sorted in ascending or descending order. It is less sensitive to outliers, making it more suitable for skewed datasets.
Mode: The value that appears most often in a set of data. It can be helpful for categorical data or when identifying the most common occurrence.
The Role of Mean in Inferential Statistics
In inferential statistics, the mean estimates population parameters based on sample data. It plays a critical role in hypothesis testing and calculating confidence intervals, allowing researchers to draw conclusions about a population based on a limited sample. The mean is often the basis for various statistical tests, such as the t-test and ANOVA, which compare means across different groups or conditions.
The Interplay Between Mean and Standard Deviation
The mean and standard deviation are closely related statistical measures that provide insight into a dataset’s central tendency and dispersion. While the mean represents the average value, the standard deviation quantifies the spread or variability of the data points around the mean. A small standard deviation indicates the data points are closely clustered around the mean. In contrast, a large standard deviation implies greater variability. Understanding the mean and standard deviation relationship is essential for accurately interpreting the data and making informed decisions.

Ad Title
Ad description. Lorem ipsum dolor sit amet, consectetur adipiscing elit.
Conclusion
Mastering the basics of how to define the mean is essential for anyone working with data, as it serves as a foundation for understanding more complex statistical concepts and techniques. By learning the different types of mean, how to calculate the mean, and its role in inferential statistics, you will be well-equipped to analyze and interpret data effectively. Finally, remember to consider the relationship between the mean and other measures of central tendency, such as the median and mode, as well as the standard deviation, to ensure a comprehensive understanding of your dataset.
Recommended Articles
Are you prepared to explore further into statistics and data analysis? Check out our other informative articles on related topics in our blog. Expand your knowledge and sharpen your skills by exploring valuable insights and expert tips. Click here to start your learning journey now!
- Standard Deviation Calculator
- Exploring Standard Deviation
- Mastering the Mean (Story)
- What is the Standard Deviation?
- Which is Better, Mean or Median?
- Can Standard Deviations Be Negative?
- Measures of Central Tendency: Mean, Mode, Median
- How to Calculate the Median in Excel – Simple Steps
- Can Standard Deviations Be Negative? (Story)
- What does the mean mean? (External Link)
FAQ: Define The Mean
The mean, or average, is a measure of central tendency representing a dataset’s center.
Sum all data points and divide by the total number of points.
The main types are the arithmetic, geometric, harmonic, and weighted mean.
When data grows or shrinks at a constant rate, such as investment returns or population growth.
In scenarios involving rates or ratios, like speed or efficiency.
A variation of the arithmetic mean that accounts for the importance or relevance of each data point.
Mean is the average, median is the middle value, and mode is the most frequent value in a dataset.
Yes, extreme values can have a significant impact on the mean.
It’s used to estimate population parameters, conduct hypothesis testing, and calculate confidence intervals.
Mean represents central tendency, while standard deviation quantifies the spread or variability of data points around the mean.