April 3, 2023
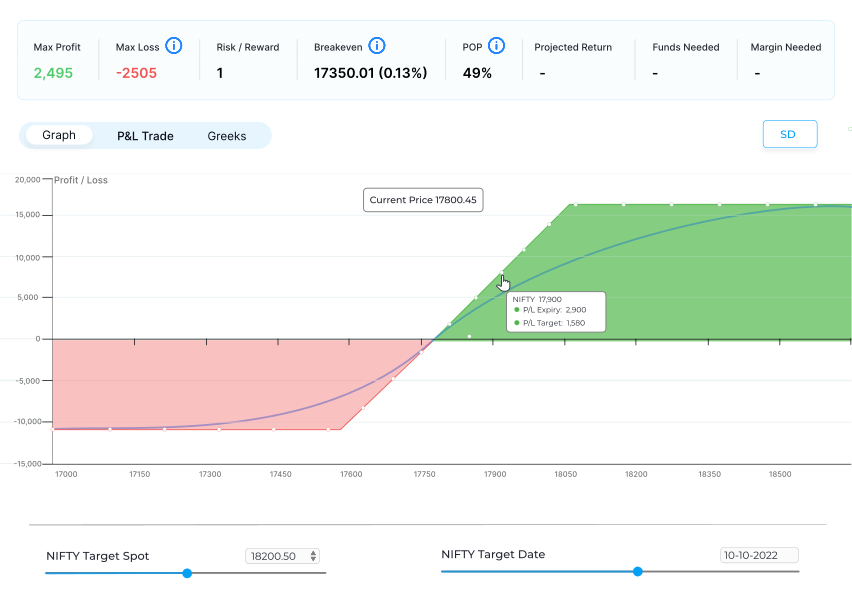
A payoff curve is a graphical representation of the profit or loss of a derivatives trade at expiration. It helps derivatives traders understand the potential outcomes of a trade and make informed decisions about risk and reward. The shape of the curve can indicate the likelihood of different levels of profit or loss, and can help traders identify potential strategies for managing risk.
As you may be aware, an option gives a right without the obligation to do so. There exist two types of options – a call and a put option. The former gives the right to buy without the obligation to do so, and the latter gives the right to sell without the obligation to do so. The loss associated with the holding of an option is restricted to the premium paid. This is the maximum loss that is possible. However, profits can be unlimited on the upside. Due to thin holding, an options portfolio becomes attractive to investors. This said, when options are held, it becomes important to know the option payoff and how the options would perform under different circumstances. What is an option payoff? How can it be graphically represented using a payoff curve? Read on to know more.
Understanding Payoffs

Defining Option Payoff
The payoff is the profit an option can earn under different price conditions. The price at which an option is bought – the strike price – is the reference point for evaluating the payoffs of the options.
The Payoff for Call and Put Options
When trying to find out the payoffs, three important variables that need to be considered are the strike price, expiration date, and premium.
The Payoff for Call Options
Once a call option is bought, the breakeven is reached when the underlying asset’s worth is the same as the sum of the premium paid plus the stock’s purchase price. When there is an increase above this point, a profit is earned. Thus, the payoff when there is an increase in the value of the option is unlimited. On the other hand, when the option’s price falls, since an option does not carry an obligation, the investor can choose not to exercise it. The losses, in this case, will be limited to the price paid to buy the option. On the other hand, If an option is sold, profits happen when prices fall, stay right where they were at the time of entering the contract or rise but less than the premium received!
At expiration, a call option’s value is zero if the investor is unable to derive any economic benefit out of it. This happens when the stock’s final price is less than the exercise price.
The Payoff for Put Options
For a put option, if the underlying price decreases, then the total profit increases. When the underlying’s price becomes equal/more than the strike price, the put option doesn’t have any value. This is because, at this point, there is no point in selling it at the strike price when the asset can be sold at a higher price without the option. The third situation is when the underlying price is above the strike price. In this case, losses would accrue. In such a case, one can choose not to exercise the option (as it is only an obligation). In this case, hence, the cash flow at expiration is zero.
Understanding a Payoff Diagram

In the above graph, the y-axis shows the profits or losses that can be earned by an option on expiration day due to a particular strategy. The x-axis shows the price of the underlying asset on the option’s expiration day. By convention, the effect of commissions is not considered in the diagrams.
Let us, now, use this graph to analyze a long call option.

The graph shows that if the price of the underlying asset is lower than the strike price, then there will be a loss. This loss amount is equal to the premium value. On the other hand, if the price of the underlying asset price is more than the strike price (and is increasing) then the losses will fall till the breakeven is reached at the point when the graph cuts the x-axis. Thereafter the investor will earn profits.
Similar analysis can be done for other long/short call and put options. The graphs are shown below.
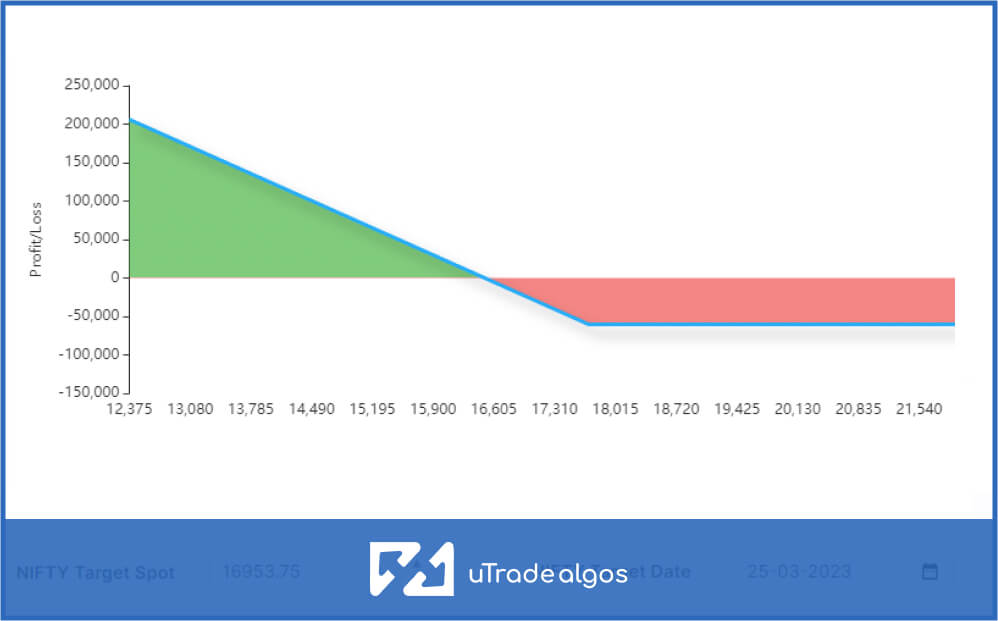
Short Call Option

Long Put Option
Benefits of a Payoff Diagrams
- Payoff diagrams are a way to understand profits and losses associated with the buying and selling of options better. Since visual representations help, it can be said that a payoff diagram is a convenient way to envision what happens with call/put option strategies when the underlying asset’s value changes.
- These diagrams are simple tools that help an investor to analyse the option strategies before actually investing. Once the diagram has been completed it is easy to understand the profit/risk potential and the breakeven point of an option.
- With the help of a payoff diagram, the data can be summarised in a more crisp fashion, thus making data comparison easier for an investor – especially if he is just starting off.
- Understanding the probability of a profit/loss when it comes to buying/selling options can be complex. Graphs help to get an instant view of the profit/loss. This graphical representation can be depicted for any point in time, although usually it is for the results at expiration.
An Example of a Payoff Diagram
This chart, which shows the net payoff of a call option of 700, has three phases.
Phase 1 – In the first phase, the market price is below ₹700. During this phase, losses accrue, which is represented by the straight horizontal line. This shows that the losses are fixed. In this case, the loss is ₹15.
Phase 2 – In the second phase, when the price is between ₹700 and ₹715, there is a gradual reduction of the net cost of the premium, which is already sunk in. The point at which the graph intersects the x-axis represents the breakeven point. In this case, it is at ₹715.
Phase 3 – The third phase starts from ₹715 onwards. This is the phase when the buyer will make unlimited profits since the premium cost is covered by the price.
Summary

Payoffs are important when it comes to trading options. Calculations of it though can be a little challenging to understand, especially for beginners. Hence, the need for payoff diagrams. So, if you are into options trading, do check out the payoff curves before deciding on what you would like to do with the options that you hold. Informed decisions are the crux of doing well in the options market.
The payoff is the profit an option can earn under different price conditions, with the strike price as the reference point.
A payoff diagram is a graphical representation of an option’s potential profits and losses at expiration.
Payoff diagrams help investors understand the risk/reward potential of different option strategies.
Payoff diagrams are a simple tool for visualizing data, making data comparison easier.
Using a payoff diagram, an investor can understand the probability of profit or loss when buying or selling options.
Using a payoff diagram, an investor can understand the probability of profit or loss when buying or selling options.Explore our platform to learn more about options trading and how our extremely intuitive Payoff Graph can help your strategy development.