Weather Data from the Bridge: Wind speed (knots): 13.47
Sea Temp (deg C): 8.55
Air Temp (deg C): 9
Science and Technology Log
The sound of fishes.
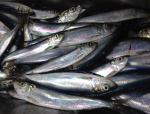
What are we doing here off the coast of the Aleutian Islands? Listening…sort of. We are collecting data used to estimate biomass (total amount of living matter in a given habitat) and to project population estimates for the Walleye Pollock Gadus chalcogrammus fishery.
Transects we fish are perpendicular to the islands.
How do we do this? In order to understand the instruments we are utilizing, I’ll attempt a simple but not completely accurate analogy: if I bounce a basketball on a cement driveway – it could bounce back with enough energy to hit me in the face (I’m not saying this has happened to me); however, if instead, I bounce the ball down onto a grassy lawn, the ball will barely bounce back up. Different materials reflect energy back with different frequencies and the picture this information translates to on a computer monitor is called an echogram:
Red – seafloor Bluish dots above – fishes!
The Oscar Dyson has several scientific echosounders (EK60, EK80, and ME70) with transducers attached to our hull that send out energy at various frequencies. As we travel along the transects (mostly perpendicular to the island chain) we are collecting these acoustic data. The fish species produce a different pattern on the echogram and the swimbladder (full of air) makes them show up clearly; scientists have been studying the Walleye Pollock for a while now and have a pretty good idea of what Walleye Pollock “look” like on an echogram. Sometimes the scientists observe an echogram that they are not certain about or want to verify characteristics such as length, weight, and age for an area – this means we get to fish!
Me learning to measure the length of a ~3 yr Pollock. Photo Credit: Patrick Ressler
Personal Log
The process began with a bit of dancing to Macklemore and Gangnam Style (thanks, Alyssa Pourmonir for providing the playlist!). Music makes every task more enjoyable! I learned how to sex a fish and cut its skull open to pull out the otoliths (calcium carbonate structures located behind the brain that can be used to estimate age and growth rate) – more on this process to come! Given that I spent the majority of my childhood as a vegetarian and maintained aspirations of becoming a veterinarian and saving the lives of animals, today was a gigantic step in another direction. I could not help but feel remorse as I sliced into the bellies of the fish and splayed them open to reveal the ovaries or testis. As a newbie, I was quite a bit slower than my coworkers, but after about 30 fish, I started to hesitate less often and verify the gonads more quickly. If any of you have spent time fishing with me, you’ll know that I enjoy the chase, but avoid handling the fish once they are on board, I’ve even been known to utter an impulsive “uh oh” when I catch a fish. I am pretty sure that after this trip, I’ll be comfortable filleting…no guarantees on my casting skills.
We unintentionally caught a salmon shark but the crew was able to return it to the ocean safely!
Did you know? Killer whales are the most widely distributed marine mammal and live in matriarchal societies. I’ve been enjoying watching these whales from the bridge!
NOAA Teacher at Sea Tom Savage On Board NOAA Ship Henry B. Bigelow June 10 – 19, 2015
Mission: Cetacean and Turtle Research Geographic area of Cruise: North Atlantic Date: June 11, 2015
Weather Data from the Bridge
Air temperature: 15 C
Wind speed: 22 knots
Wind direction: coming from south-east
Relative humidity: 95%
Barometer: 1010 millibars
Personal Log
My first day at sea began at the bow of the ship searching for Sei and Beaked Whales. What a privilege it is to wake up and walk to the front of a research vessel to start your work day. The early morning hours were ideal for sighting whales as we experienced sunny skies and calm seas. The weather conditions deteriorated into the afternoon and made sightings very challenging. To accurately record the distance from the ship to the marine animals, the observer needs to see the visual horizon. This wind speed also increased during the day causing the ship to move in all directions impacting our accuracy.
Using the “Big Eyes”
Preparing for a complex research mission is not easy and takes months of planning. Due to the complexity of this mission, we were delayed three days to ensure that all scientific equipment and gear was properly working. During this delay, the mission’s chief scientist, Dr. Danielle Cholewiak, has been exceptional in welcoming me. I took her advice and stayed in Falmouth, Massachusetts, which is near Woods Hole. Woods Hole is home to NOAA’s Northeast Fisheries Science Center. Woods Hole is a village in the town of Falmouth with a strong science contingent including Woods Hole Marine Biological Laboratory and the Woods Hole Oceanographic Institute which are private research institutions not directly affiliated with NOAA.
During this time, I had the privilege of meeting other scientists who are participating on this mission, Mike and Lorenzo. Mike will be collecting data on sea birds and Lorenzo is an acoustics (sound) specialist from Scotland.
Everyone on board NOAA’s research vessel Henry B. Bigelow has been exceptionally welcoming and nice which made my transition to life at sea smooth.
The food on board the ship is amazing; my Teacher at Sea colleagues were correct.
Science and Technology Log
Although visual whale sightings were difficult today, this did not prevent the scientists from using other technologies to detect the animals. Today, a Sonobouy was deployed for the purpose of detecting a “call” from Sei Whales. Like a human voice, whales produce sounds for communication. Each species of whale has unique vocalizations with distinctive frequency range and timing characteristics, and the sonobouy is used to detect these sounds and to track their location. The sonobouy contains a single omni-directional hydrophone, particle motion sensors and a magnetic compass.
Preparing the Sonobouy
This device is deployed from stern of the ship. The sonobuoy is configured to drift at a depth of 90 feet and send back acoustic signals to the vessel by VHF radio, where the data are processed using computer software. The hydrophone is connected to the sonobouy by 90 feet of thin wire. This technology is relatively new in detecting whales for NOAA, but have been used extensively by the Navy for locating submarines. Today, the sonobouy did detect sounds from Sei whales (called “downsweeps”). The acoustics team plan on launching another sonobouy tonight and depending on this outcome will determine our travel plans for tomorrow.
NOAA Teacher at Sea Emily Whalen Aboard NOAA Ship Henry B. Bigelow April 27 – May 10, 2015
Mission: Spring Bottom Trawl Survey, Leg IV
Geographical Area of Cruise: Gulf of Maine Date: May 1, 2015
Weather Data from the Bridge: Winds: Light and variable
Seas: 1-2ft
Air Temperature: 6.2○ C
Water Temperature: 5.8○ C
Science and Technology Log:
Earlier today I had planned to write about all of the safety features on board the Bigelowand explain how safe they make me feel while I am on board. However, that was before our first sampling station turned out to be a monster haul! For most stations I have done so far, it takes about an hour from the time that the net comes back on board to the time that we are cleaning up the wetlab. At station 381, it took us one minute shy of three hours! So explaining the EEBD and the EPIRB will have to wait so that I can describe the awesome sampling we did at station 381, Cashes Ledge.
This is a screen that shows the boats track around the Gulf of Maine. The colored lines represent the sea floor as determined by the Olex multibeam. This information will be stored year after year until we have a complete picture of the sea floor in this area!
Before I get to describing the actual catch, I want to give you an idea of all of the work that has to be done in the acoustics lab and on the bridge long before the net even gets into the water.
The bridge is the highest enclosed deck on the boat, and it is where the officers work to navigate the ship. To this end, it is full of nautical charts, screens that give information about the ship’s location and speed, the engine, generators, other ships, radios for communication, weather data and other technical equipment. After arriving at the latitude and longitude of each sampling station, the officer’s attention turns to the screen that displays information from the Olex Realtime Bathymetry Program, which collects data using a ME70 multibeam sonar device attached to bottom of the hull of the ship .
Traditionally, one of the biggest challenges in trawling has been getting the net caught on the bottom of the ocean. This is often called getting ‘hung’ and it can happen when the net snags on a big rock, sunken debris, or anything else resting on the sea floor. The consequences can range from losing a few minutes time working the net free, to tearing or even losing the net. The Olex data is extremely useful because it can essentially paint a picture of the sea floor to ensure that the net doesn’t encounter any obstacles. Upon arrival at a site, the boat will cruise looking for a clear path that is about a mile long and 300 yards wide. Only after finding a suitable spot will the net go into the water.
Check out this view of the seafloor. On the upper half of the screen, there is a dark blue channel that goes between two brightly colored ridges. We trawled right between the ridges and caught a lot of really big fish!
The ME70 Multibeam uses sound waves to determine the depth of the ocean at specific points. It is similar to a simpler, single stream sonar in that it shoots a wave of sound down to the seafloor, waits for it to bounce back up to the ship and then calculates the distance the wave traveled based on the time and the speed of sound through the water, which depends on temperature. The advantage to using the multibeam is that it shoots out 200 beams of sound at once instead of just one. This means that with each ‘ping’, or burst of sound energy, we know the depth at many points under the ship instead of just one. Considering that the multibeam pings at a rate of 2 Hertz to 0.5 Herts, which is once every 0.5 seconds to 2 seconds, that’s a lot of information about the sea floor contour!
This is what the nautical chart for Cashes Ledge looks like. The numbers represent depth in fathoms. The light blue lines are contour lines. The places where they are close together represent steep cliffs. The red line represents the Bigelow’s track. You can see where we trawled as a short jag between the L and the E in the word Ledge
The stations that we sample are randomly selected by a computer program that was written by one of the scientists in the Northeast Fisheries Science Center, who happens to be on board this trip. Just by chance, station number 381 was on Cashes Ledge, which is an underwater geographical feature that includes jagged cliffs and underwater mountains. The area has been fished very little because all of the bottom features present many hazards for trawl nets. In fact, it is currently a protected area, which means the commercial fishing isn’t allowed there. As a research vessel, we have permission to sample there because we are working to collect data that will provide useful information for stock assessments.
My watch came on duty at noon, at which time the Bigelowwas scouting out the bottom and looking for a spot to sample within 1 nautical mile of the latitude and longitude of station 381. Shortly before 1pm, the CTD dropped and then the net went in the water. By 1:30, the net was coming back on board the ship, and there was a buzz going around about how big the catch was predicted to be. As it turns out, the catch was huge! Once on board, the net empties into the checker, which is usually plenty big enough to hold everything. This time though, it was overflowing with big, beautiful cod, pollock and haddock. You can see that one of the deck crew is using a shovel to fill the orange baskets with fish so that they can be taken into the lab and sorted!
You can see the crew working to handling all of the fish we caught at Cashes Ledge. How many different kinds of fish can you see? Photo by fellow volunteer Joe Warren
At this point, I was standing at the conveyor belt, grabbing slippery fish as quickly as I could and sorting them into baskets. Big haddock, little haddock, big cod, little cod, pollock, pollock, pollock. As fast as I could sort, the fish kept coming! Every basket in the lab was full and everyone was working at top speed to process fish so that we could empty the baskets and fill them up with more fish! One of the things that was interesting to notice was the variation within each species. When you see pictures of fish, or just a few fish at a time, they don’t look that different. But looking at so many all at once, I really saw how some have brighter colors, or fatter bodies or bigger spots. But only for a moment, because the fish just kept coming and coming and coming!
Finally, the fish were sorted and I headed to my station, where TK, the cutter that I have been working with, had already started processing some of the huge pollock that we had caught. I helped him maneuver them up onto the lengthing board so that he could measure them and take samples, and we fell into a fish-measuring groove that lasted for two hours. Grab a fish, take the length, print a label and put it on an envelope, slip the otolith into the envelope, examine the stomach contents, repeat.
Cod, pollock and haddock in baskets waiting to get counted and measured. Photo by Watch Chief Adam Poquette.
Some of you have asked about the fish that we have seen and so here is a list of the species that we saw at just this one site:
Pollock
Haddock
Atlantic wolffish
Cod
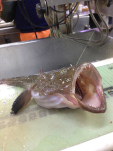
Goosefish
Herring
Mackerel
Alewife
Acadian redfish
Alligator fish
White hake
Red hake
American plaice
Little skate
American lobster
Sea raven
Thorny skate
Red deepsea crab
Atlantic Herring
Goosefish. Does this remind you of anyone you know?
Mackerel. Possibly the best looking fish in the sea.
I think it’s human nature to try to draw conclusions about what we see and do. If all we knew about the state of our fish populations was based on the data from this one catch, then we might conclude that there are tons of healthy fish stocks in the sea. However, I know that this is just one small data point in a literal sea of data points and it cannot be considered independently of the others. Just because this is data that I was able to see, touch and smell doesn’t give it any more validity than other data that I can only see as a point on a map or numbers on a screen. Eventually, every measurement and sample will be compiled into reports, and it’s that big picture over a long period of time that will really allow give us a better understanding of the state of affairs in the ocean.
Sunset from the deck of the Henry B. Bigelow
Personal Log
Lunges are a bit more challenging on the rocking deck of a ship!
It seems like time is passing faster and faster on board the Bigelow. I have been getting up each morning and doing a Hero’s Journey workout up on the flying bridge. One of my shipmates let me borrow a book that is about all of the people who have died trying to climb Mount Washington. Today I did laundry, and to quote Olaf, putting on my warm and clean sweatshirt fresh out of the dryer was like a warm hug! I am getting to know the crew and learning how they all ended up here, working on a NOAA ship. It’s tough to believe but a week from today, I will be wrapping up and getting ready to go back to school!
NOAA Teacher at Sea Lauren Wilmoth Aboard NOAA Ship Rainier October 4 – 17, 2014
Mission: Hydrographic Survey Geographical area of cruise: Kodiak Island, Alaska Date: Friday, October 16, 2014
Weather Data from the Bridge Air Temperature: 7.32 °C
Wind Speed: 9.2 knots
Latitude: 57°44.179′ N
Longitude: 152°27.987′ W
Science and Technology Log
ENS Steve Wall collecting a bottom sample.
Wednesday, I went on a launch to do bottom sampling and cross lines. Wednesday was our last day of data acquisition, so the motto on the POD (Plan of the Day) was “LEAVE NO HOLIDAYS! If in doubt, ping it again!” Bottom sampling is pretty straight forward. We drive to designated locations and drop a device that looks a little like a dog poop scooper down into the water after attaching it to a wench. The device has a mechanism that holds the mouth of it open until it is jarred from hitting the bottom. When it hits the bottom, it snaps closed and hopefully snatches up some of the sediment from the bottom. Then, we reel it up with the wench and see what’s inside.
We took 10 bottom samples and most were the same. We had a fine brown sand in most samples. Some samples contained bits of shell, so we documented when that was the case. At one location, we tried for samples three times and every time, we got just water. This happens sometimes if the sea floor is rocky and the device can’t pick up the rocks. If you try three times and get no definitive answer, you label the sample as unknown. Two times we got critters in our samples. One critter we found was an amphipod most likely. The second critter was shrimp/krill-like, but I don’t know for sure. Cross lines are just collecting sonar data in lines that run parallel to the previous data lines. This gives us a better image and checks the data.
Survey Tech Christie and Me on our bottom sampling launch.
Amphipod found in bottom sample.
Unknown shrimp/krill critter from bottom sample.
Staff observations at Terror Bay.
Thursday, we closed out the tidal station at Terror Bay. This entailed doing staff observations, a tidal gauge leveling check, and then break down everything including completing a dive to remove the orifice. Since I have already taken part in a tidal gauge leveling check, I was assigned to the staff observations and dive party. As I mentioned in an earlier post, for staff observations you just record the level of the water by reading a staff every six minutes for three hours. We did this while on a boat, because the tide was pretty high when we got started, so we wouldn’t be able to read the staff if we were on shore. Again, the reason we do staff observations is so we can compare our results to what the tidal gauge is recording to make sure the tidal gauge is and has been working properly.
While doing staff observations, I saw a small jellyfish looking creature, but it was different. It had bilateral symmetry instead of radial symmetry. Bilateral symmetry is what we have, where one side is more or less the same as the other side. Jellyfish have radial symmetry which means instead of just one possible place you could cut to make two side that are the same, there are multiple places you can cut to make it the same on each side. Also, the critter was moving by flopping its body from side to side which is nothing like a jellyfish. I had to figure out what this was! In between our observations, Jeff, the coxswain, maneuvered the boat so I could scoop this guy into a cup. Once we finished our staff observations, we headed to the ship. I asked around and Adam (the FOO) identified my creature. It’s a hooded nudibranch (Melibe leonina). Nudibranches are sea slugs that come in a beautiful variety of colors and shapes.
Bilateral versus radial symmetry.
The hooded nudibranch.
ENS Wood and ENS DeCastro diving for the orifice.
After a quick return to the ship, we headed back out with a dive team to remove the orifice from underwater. Quick reminder: the orifice was basically a metal tube that air bubbles are pushed out of. The amount of pressure needed to push out the air bubbles is what tells us the depth of the water. Anyways, the water was crystal clear, so it was really neat, because we could see the divers removing the orifice and orifice tubing. Also, you could see all sorts of jellyfish and sea stars. At this point, I released the hooded nudibranch back where I got him from.
Jellyfish!
Just as we were wrapping up with everything. The master diver Katrina asked another diver Chris if he was alright, because he was just floating on his back in the water. He didn’t respond. It’s another drill! One person called it in on the radio, one of the divers hopped back in the water and checked his vitals, and another person grabbed the backboard. I helped clear the way to pull Chris on board using the backboard, strap him down with the straps, and pull out the oxygen mask. We got him back to the ship where the drill continued and the medical officer took over. It was exciting and fun to take part in this drill. This was a very unexpected drill for many people, and they acted so professional that I am sure if a real emergency occurred, they would be prepared.
Drill: Saving ENS Wood.
Personal Log
Sadly, this was most likely my last adventure for this trip, because I fly out tomorrow afternoon. This trip has really been a one-of-a-kind experience. I have learned and have a great appreciation for what it takes to make a quality nautical chart. I am excited about bringing all that the Rainier and her crew have taught me back to the classroom to illustrate to students the importance of and the excitement involved in doing science and scientific research. Thank you so much to everyone on board Rainier for keeping me safe, helping me learn, keeping me well fed, and making my adventure awesome! Also, thank you to all those people in charge of the NOAA Teacher at Sea program who arranged my travel, published my blogs, provided me training, and allowed me to take part in this phenomenal program. Lastly, thank you to my students, family, and friends for reading my blog, participating in my polls, and asking great questions.
Did You Know?
1 knot is one nautical mile per hour which is equal to approximately 1.151 miles per hour.
Challenge:
Can you figure out what my unknown shrimp/krill critter is?
NOAA Teacher at Sea Lauren Wilmoth Aboard NOAA Ship Rainier October 4 – 17, 2014
Mission: Hydrographic Survey Geographical area of cruise: Kodiak Island, Alaska Date: Wednesday, October 15th, 2014
Weather Data from the Bridge Air Temperature: 4.4 °C
Wind Speed: 5 knots
Latitude: 57°56.9′ N
Longitude: 153°05.8′ W
Science and Technology Log
Thank you all for the comments you all have made. It helps me decide what direction to go in for my next post. One question asked, “How long does it take to map a certain area of sea floor?” That answer, as I responded, is that it depends on a number of factors including, but not limited to, how deep the water is and how flat the floor is in that area.
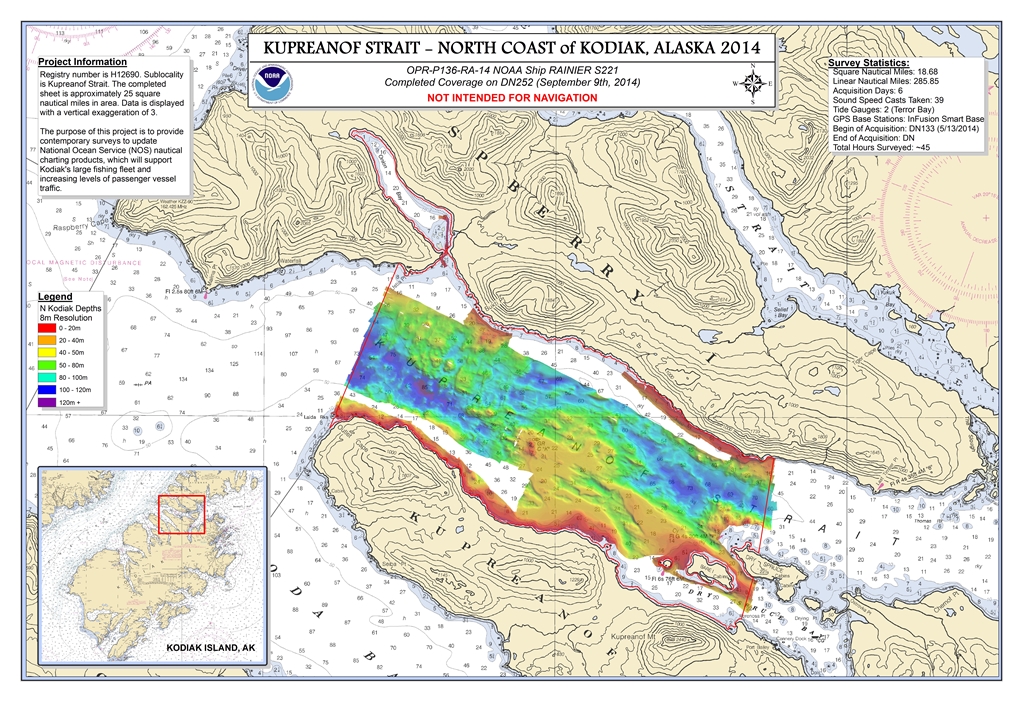
To make things easier, the crew uses an Excel spreadsheet with mathematical equations already built-in to determine the approximate amount of time it will take to complete an area. That answer is a bit abstract though. I wanted an answer that I could wrap my head around. The area that we are currently surveying is approximately 25 sq nautical miles, and it will take an estimated 10 days to complete the surveying of this area not including a couple of days for setting up tidal stations. To put this in perspective, Jefferson City, TN is approximately 4.077 sq nautical miles. So the area we are currently surveying is more than 6 times bigger than Jefferson City! We can do a little math to determine it would take about 2 days to survey an area the size of Jefferson City, TN assuming the features are similar to those of the area we are currently surveying.
Try to do the math yourself! Were you able to figure out how I got 2 or 3 days?
Since we’re talking numbers, Rainier surveyed an area one half the size of Puerto Rico in 2012 and 2013! We can also look at linear miles. Linear miles is the distance they traveled while surveying. It takes into account all of the lines the ship has completed. In 2012 and 2013, Rainier surveyed the same amount of linear nautical miles that it would take to go from Newport, Oregon to the South Pole Station and back!
Area we are currently surveying (outlined in red) with some depth data we have collected.
Casting a CTD (Conductivity, Temperature, and Depth) gauge.
Monday, I went on a launch to collect sonar data. This is my first time to collect sonar data since I started this journey. Before we could get started, we had to cast a CTD (Conductivity, Temperature and Depth) instrument. Sound travels a different velocities in water depending on the salinity, temperature, and pressure (depth), so this instrument is slowly cast down from the boat and measures all of these aspects on its way to the ocean floor. Sound travels faster when there is higher salinity, temperature, and pressure. These factors can vary greatly from place to place and season to season.
Imagine how it might be different in the summertime versus the winter. In the summertime, the snow will be melting from the mountains and glaciers causing a increase in the amount of freshwater. Freshwater is less dense than saltwater, so it mainly stays on top. Also, that glacial runoff is often much colder than the water lower in the water column. Knowing all of this, where do you think sound will travel faster in the summertime? In the top layer of water or a lower layer of water? Now you understand why it is so important to cast a CTD to make sure that our sonar data is accurate. To learn more about how sound travels in water, click here.
I’m driving the boat.
After casting our CTD, we spent the day running the sonar up and down and up and down the areas that needed to be surveyed. Again, this is a little like mowing the lawn. At one point, I was on bow watch. On bow watch, you sit at the front of the boat and look out for hazards. Since this area hasn’t been surveyed since before 1939, it is possible that there could be hazards that are not charted. Also, I worked down in the cabin of the boat with the data acquisition/sonar tuning. Some important things to do below deck including communicating the plan of attack with the coxswain (boat driver), activating the sonar, and adjusting the sonar for the correct depth. I helped adjust the range of the sonar which basically tells the sonar how long to listen. If you are in deeper water, you want the sonar to listen longer, because it takes more time for the ping to come back. I also adjusted the power which controls how loud the sound ping is. Again, if you are surveying a deeper area, you might want your ping to be a little louder.
Eli working the sonar equipment.
Tuesday, I helped Survey Tech Christie Rieser and Physical Scientist Fernando Ortiz with night processing. When the launches come back after acquiring sonar data, someone has to make all that data make sense and apply it to the charts, so we can determine what needs to be completed the following day. Making sense of the data is what night processing is all about. First, we converted the raw data into a form that the program for charting (CARIS) can understand. The computer does the converting, but we have to tell it to do so. Then, we apply all of the correctors that I spoke about in a previous blog in the following order: POS/MV (Position and Orientation Systems for Marine Vessels) corrector, Tides corrector, and CTD (Conductivity, Temperature, and Depth) corrector. POS/MV corrects for the rocking of the boat. For the tides corrector, we use predicted tides for now, and once all the data is collected from our tidal stations, we will add that in as well. Finally, the CTD corrects for the change in sound velocity due to differences in the water as I discussed above.
After applying all of the correctors, we have the computer use an algorithm (basically a complicated formula) to determine, based on the data, where the sea floor is. Basically, when you are collecting sonar data there is always going to be some noise (random data that is meaningless) due to reflection, refraction, kelp, fish, and even the sound from the boat. The algorithm is usually able to recognize this noise and doesn’t include it when calculating the location of the seafloor. The last step is manually cleaning the data. This is where you hide the noise, so you can get a better view of the ocean floor. Also, when you are cleaning, you are double checking the algorithm in a way, because some things that are easy for a human to distinguish as noise may have thrown off the algorithm a bit, so you can manually correct for that. Cleaning the data took the longest amount of time. It took a couple of hours. While processing the data, we did notice a possible ship wreck, but the data we have isn’t detailed enough to say whether it’s a shipwreck or a rock. Senior Tech Jackson noted in the acquisition log that it was “A wreckish looking rock or a rockish looking wreck.” We are going to have the launches go over that area several more times today to get a more clear picture of is going on at that spot.
This is an example of noisy data. In this case, the noise was so great that the algorithm thought the seafloor went down 100 extra meters. Manually cleaning the data can adjust for this so our end product is accurate. The actual seafloor in this case is the relatively straight line at about 100 meters depth.
Personal Log
Monday was the most spectacular day for wildlife viewing! First, I saw a bald eagle. Then, I saw more sea otters. The most amazing experience of my trip so far happened next. Orcas were swimming all around us. They breached (came up for air) less than 6 feet from the boat. They were so beautiful! I got some good pictures, too! As if that wasn’t good enough, we also saw another type of whale from far away. I could see the blow (spray) from the whale and a dorsal fin, but I am not sure if it is was a Humpback Whale or a Fin Whale. Too cool!
Bald Eagle Sighting!
Sea otter
Orca!
Very close orca!
Did You Know?
Killer whales are technically dolphins, because they are more closely related to other dolphins than they are to whales.
NOAA Teacher At Sea Amy Orchard Aboard NOAA Ship Nancy Foster September 14 – 27, 2014
Mission: Fish Tagging Geographical area of cruise: Riley’s Hump: Tortugas Ecological Reserve South Date: September 14, 15, 16, 2014
Weather: September 16, 2014 20:00 hours
Latitude 24° 30’ 30’’N Longitude 83° 09’ 9’’W
Few clouds, clear. Humidity 10%.
Wind speed 7 knots.
Air Temperature: 28° Celsius (83° Fahrenheit)
Sea Water Temperature: 30.4° Celsius (86.7°Fahrenheit)
SUNDAY:
Getting to Know the Nancy Foster
Scott Donahue, Science Coordinator for Florida Keys National Marine Sanctuary and Chief Scientist for this cruise, brought me aboard and gave me a tour of the Nancy Foster early in the day. Also there was Tim Olsen, Chief Engineer, who I had met on the plane from Atlanta to Key West. I was overwhelmed with the capacity of the ship. It is huge and fully equipped for a wide variety of scientific endeavors, diving, mapping, surveying, launching large equipment etc. I feel lucky to be a part of what is going on.
Click on these two photos for more information
When I boarded the small jet plane from Atlanta to Key West, the man sitting behind me pointed at my TAS hat and said “You are on my ship tomorrow!” It was nice to have a friendly greeting even before I saw the ship. Photo by Scott Donahue 9/14
Scott Donahue, Chief Scientist, showed me the ship and then gave me a nice tour of the NOAA’s ship Nancy Foster Complex where his office is. They have a great LEED certified building with low profile solar panels (due to hurricanes) Photo credit: Tim Olsen 9/14
Short Jaunt into Key West
After taking some time to see Key West, I headed back to the ship where I met Cammy Clark from the Miami Herald who will be with us for one week reporting on our experience. Cammy and I spent the night on the ship awaiting the science team to arrive early tomorrow morning. The ship is in dock so I can’t yet be sure if I will suffer from sea sickness. However, I hear that there is 100% survival rate if it does occur!
Click on these two photos for more information
Key West beach. No one was swimming but me and the pelicans – can’t be near water without getting wet!
Drinking water out of native coconuts, chopped open by a local with a machette. Photo by: nearest tourist!
MONDAY:
Meeting the Scientists
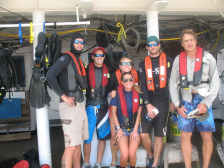
During the two weeks aboard, I will be working with 10 scientists from the Florida Fish and Wildlife Conservation Commission (FWC), 7 NOAA Florida Keys National Marine Sanctuary scientists and 2 ROV pilots from the University of North Carolina at Wilmington. I am excited to be a part this interagency collaboration. Seems like an efficient way to communicate and share experiences.
Guess which photo shows the scientists I will be working with…
stock photo
photo by Amy Orchard
Answer: PHOTO ON THE RIGHT. FWC scientists from left to right: Mike McCallister, Jeff Renchen,Danielle Morley, Ariel Tobin (in front), Ben Binder, Paul Barbera. Not as reserved or stodgy as you might picture a group of scientists, but they are incredibly knowledgeable and dedicated to their work. They are unbelievably cool people! They have amazing stories to tell, are easy-going and love to have a good time. I want to be like them when I grow up!
Preparing to Do Science
One of the many things we will do this week is tagging fish. To do this, we will travel away from the ship on small boats to set fish traps. Once the right fish are contained, the dive team will surgically insert an acoustic tag which will allow them to monitor the fish’s movements throughout different reaches of the sanctuary. This information is important to see the effectiveness of protected areas vs. non-protected areas.
The divers perform this surgery underwater (usually at depths of 95-110 feet) in order to reduce stress on the fish and to avoid air bladder expansion.
Today the divers went out to practice their diving skills before the intense work begins. I got to travel with them in the small boat. Even though I am certified to SCUBA dive, only American Academy of Underwater Sciences divers and other divers with official reciprocity are allowed to dive off NOAA ships. (reciprocity is the word of the day – look it up!) The diving these scientists do is much more technical than the recreational diving I do in Mexico, but they enjoy it just as much.
Best note of the day: No sea sickness! (yet)
The 4 small boats sit on the back deck of the ship and are lowered over the side with a large crane. Once the boat is on the water, we climb down a rope ladder (which is swinging ferociously in the waves!)
The Nancy Foster has four small boats. Three for dive operations and one reserved as a rescue boat. It was exciting to have a different perspective and to see the Nancy Foster out at sea from the small boat. Photo by Linh Nugyen
TUESDAY:
Multibeam Sonar
Last night was the first night I slept on the ship while it was out to sea. I had a really hard time sleeping as I would awaken every half hour feeling as if I were going to roll over and fall out of my top bunk! This movement was due to the fact that science is being done aboard the Nancy Foster 24 hours a day. During the night time, Nick Mitchell and Samantha Martin, the Survey Technicians, are running the Multibeam Sonar which determines ocean depth and creates a map of the sea floor contours. Using 512 sonic beams, sound is emitted, bounces off the sea bed, then returns to the ship.
The ship would travel out about 3 miles, then turn 180° to make the next pass. Cruising at about 1 mile every 10 minutes (walking speed) we were turning about every 30 minutes, explaining my rockn’ night!
More on MSB in upcoming posts.
Click on these two photos for more information
Here is my locker& hard hat in my state room. There are 4 of us sharing this tiny room. Good thing we all like each other!
I sleep on the top bunk and Ariel has the bottom. It is extremely difficult to get out of bed, not because I am sleepy, but because the space allotted for my exit is tiny!
Setting Fish Traps
I joined the divers on the small boat to set out the first two traps. We used cooked and peeled shrimp as bait. The traps were still empty late afternoon. Let’s hope they take the shrimp so the tagging can begin!
Here sits the modified chevron trap Ben and I will be deploying from our small boat. Divers on a second small boat will follow us, dive down and be sure the trap sits on the ocean floor upright and will set the bait.
I am making sure the rope which attaches the float buoys to the trap doesn’t get caught on the boat as the fish trap is deployed into the water. Photo by Nick Mitchell
Here Ben Binder & Survey Technician, Nick Mitchell, record the exact Latitude and Longitude where the trap was set. Can you figure out the general GPS coordinates for the Tortuga South Ecological Reserve? Need help? Go to http://shiptracker.noaa.gov/
We are focusing on two species during this trip: the Black Grouper and the Cubera Snapper. These two were selected because they are commercially and recreationally important species. The FWC’s aim is to monitor the seasonal movement of these species to better understand how the fishes are utilizing the protected areas, as well as those outside of the reserve, so they can make the best management decisions.
I will attach photos of each species that will be taken from the Remotely Operated Vehicle (ROV) in my next blog since this one is getting long…
Challenge Your Understanding
Identify this animal.
I took this photo and video on day 1. We have seen them each day since!
Am I a porpoise, dolphin or vaquita?
The species in my photo/video is part of the Order Cetacea and the suborder Odontoceti (or toothed whales) which includes the porpoises , dolphins, vaquitas, narwhals and killer whales (to name only a few – there are 67 species in this suborder.)
Go to this website to help you find the correct answer
Bonus Points – make a COMMENT and share some information you have found about the VAQUITA.
Cool fact – all members of Odontoceti can echolocate.
Junior Docents – add that to your bat interpretations!
The question from my last post about the relationship between Tucson and the Sea of Cortez could be answered with all of the first four answers. Glad NO ONE chose the last answer! The sea is an integral part of our lives no matter how far we live from it.
NOAA Teacher at Sea Joanie Le Aboard NOAA Ship Henry B. Bigelow August 5 – 16, 2014
Mission: Deep-Sea Coral Research Geographic area of the cruise: Off the coast of Assateague Island, Virginia Date: August 8, 2014
Weather information from the Bridge:
Air Temperature: 24° C
Wind Direction: 320° at 5 knots
Weather Conditions: Partly Cloudy
Latitude: 37° 49.460′
Longitude: 74° 03.380′
Science and Technology Log
Recording “zero winch” time (when TowCam splashes down). Photo credit Dr. Martha Nizinski.
After arriving at our first dive location yesterday at 16:00, we successfully completed our first dive. In the water for almost 8 hours, we collected 2,946 high resolution pictures and lots of data.
Deployment is a team effort, and everyone is on high alert. With steel toe shoes, hard hats, and life vests in place, the crew carefully raises TowCam off the deck by a winch wire and gently into the water below. Though I’m getting used to it, the bobbing of the ship while it holds position for deployment is noticeable. Keeping an eye on the horizon goes a long way to settle the stomach.
Because shorter wavelengths can’t reach our eyes through the moving water, you can see the yellow net on TowCam appear to turn green as it submerges.
As TowCam descends into the water, it is hard not to be impressed by the depth beneath us. For almost half an hour, the winch pays out cable at a rate of 35 meters per minute. Fuzzy images of the water column begin to arrive, and adds to the abyssal sensation of the water below.
Dr. Lizet Christiansen monitors the location of TowCam as images stream back to the lab
Finally, TowCam sends visual of the bottom, and logging of observations begins. At first, only a few images of soft sediment appear–one after the other, 10 seconds apart. And then, a red crab. Then a fish. I felt not unlike an astronomer receiving those first black and white images from Mars’s Curiosity. It was that exciting. We note the time, location, features of the seafloor, and tentative ids of the organisms we see. Later, we’ll match these up with the high-res images inside TowCam.
Chief Scientist Dr. Martha Nizinski monitors low resolution images as they stream from TowCam.
After about 8 hours, TowCam returns the way it arrived–slowly back up the water column. It’ll stay on deck just long enough to charge batteries and download the precious images while we make our way to the next dive location. Then, back to the drink it goes.
“Burping” TowCam’s batteries to remove excess air. Photo credit Matt Poti.
An Unlucky Passenger
The TowCam is a pretty amazing instrument, but we didn’t know how alluring it might appear to the fish that come and go. Unfortunately for this little guy, he never did manage to leave until it was too late. Evolved to withstand life under pressure, this unlucky swimmer lost his innards while TowCam returned home.
(tentatively identified as Dicrolene intronigra)
Personal Log
The Moon rises over the water at the beginning of my shift at midnight.
The first watch was pretty exciting. It was strange to wake up at 11 PM and get ready for work, but the commute was sweet! Instead of my usual hour-long metro ride (okay, I usually just drive) I simply walked downstairs and greeted the folks that had just spent the previous 12 hours logging and monitoring the submerged TowCam. They were in surprisingly good spirits.
I also must say that not much can top the wonderfully eerie feeling of moving steadily along through the ocean in a moonlit night. The light from the deck makes the water a velvety blue, and if you’re lucky you can see dolphins slipping quietly by as the Sun begins to peek up over the horizon.