Gerber-Las Flores, California
Submit your own pictures of this place and show them to the world
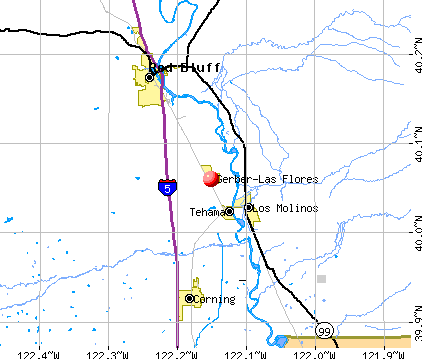
- OSM Map
- General Map
- Google Map
- MSN Map
| Males: 753 | |
| Females: 750 |
| Median resident age: | 30.2 years |
| California median age: | 33.3 years |
Zip codes: 96035.
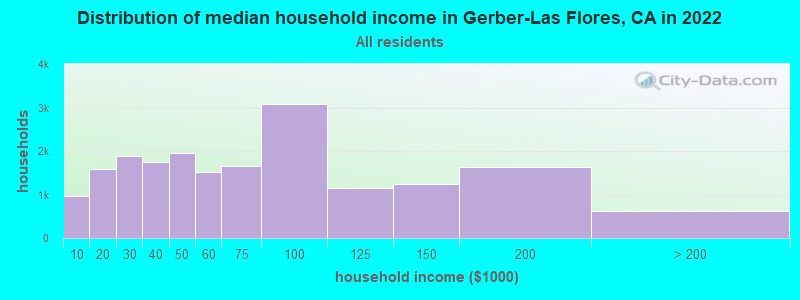
| Gerber-Las Flores: | $45,489 |
| CA: | $91,551 |
Estimated per capita income in 2022: $22,352 (it was $11,888 in 2000)
Gerber-Las Flores CDP income, earnings, and wages data
Estimated median house or condo value in 2022: $228,890 (it was $64,900 in 2000)
| Gerber-Las Flores: | $228,890 |
| CA: | $715,900 |
Mean prices in 2022: all housing units: $341,623; detached houses: $378,867; townhouses or other attached units: $281,544; in 5-or-more-unit structures: $207,517; mobile homes: $211,680; occupied boats, rvs, vans, etc.: $84,243
Gerber-Las Flores, CA residents, houses, and apartments details
Detailed information about poverty and poor residents in Gerber-Las Flores, CA


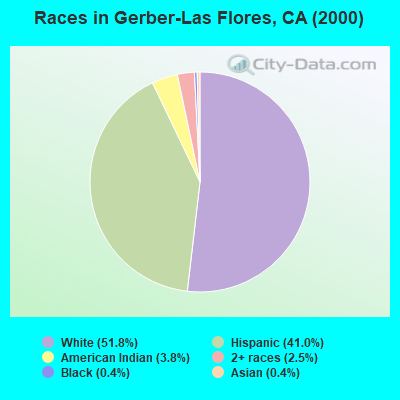
- 72051.8%White alone
- 56941.0%Hispanic
- 533.8%American Indian alone
- 352.5%Two or more races
- 50.4%Black alone
- 50.4%Asian alone
- 10.07%Native Hawaiian and Other
Pacific Islander alone - 10.07%Other race alone
 Recent articles from our blog. Our writers, many of them Ph.D. graduates or candidates, create easy-to-read articles on a wide variety of topics.


Ancestries: United States (7.5%), Irish (6.6%), German (6.2%), English (5.5%), French (2.6%), Scotch-Irish (2.4%).
Current Local Time: PST time zone
Land area: 1.26 square miles.
Population density: 1,194 people per square mile (low).
359 residents are foreign born (25.5% Latin America).
| This place: | 25.8% |
| California: | 26.2% |
| Gerber-Las Flores CDP: | 0.7% ($470) |
| California: | 0.8% ($1,564) |
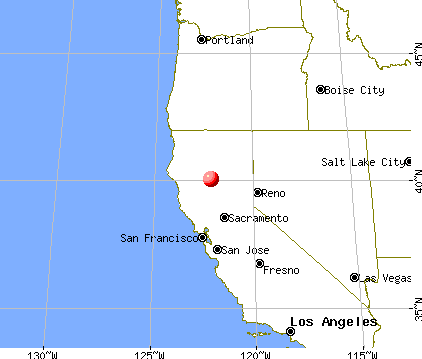
Nearest city with pop. 50,000+: Chico, CA  (27.8 miles , pop. 59,954).
Nearest city with pop. 200,000+: Sacramento, CA (110.3 miles , pop. 407,018).
Nearest city with pop. 1,000,000+: Los Angeles, CA (462.6 miles , pop. 3,694,820).
Nearest cities:
), ), ), ), )Latitude: 40.06 N, Longitude: 122.15 W
Area code commonly used in this area: 530

| Here: | 6.4% |
| California: | 5.1% |
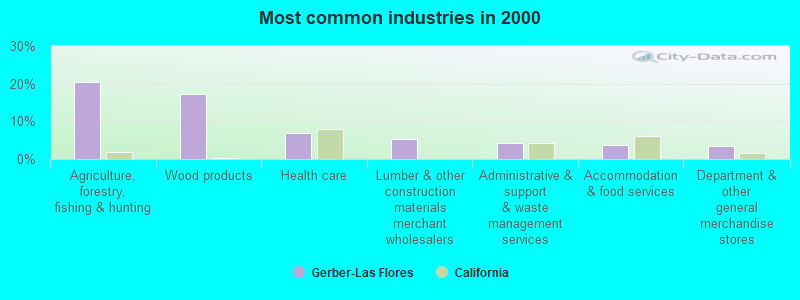
- Agriculture, forestry, fishing & hunting (20.4%)
- Wood products (17.1%)
- Health care (6.9%)
- Lumber & other construction materials merchant wholesalers (5.2%)
- Administrative & support & waste management services (4.3%)
- Accommodation & food services (3.7%)
- Department & other general merchandise stores (3.5%)
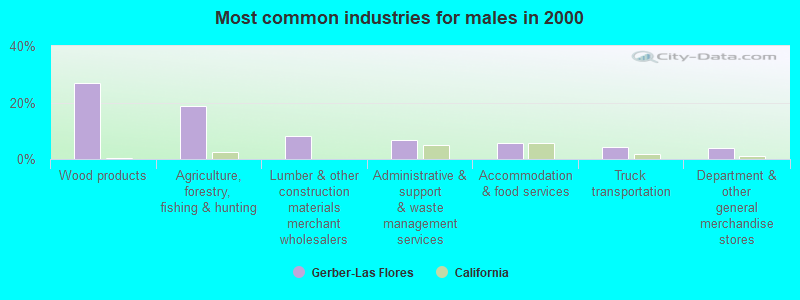
- Wood products (27.0%)
- Agriculture, forestry, fishing & hunting (18.8%)
- Lumber & other construction materials merchant wholesalers (8.2%)
- Administrative & support & waste management services (6.8%)
- Accommodation & food services (5.8%)
- Truck transportation (4.1%)
- Department & other general merchandise stores (3.8%)
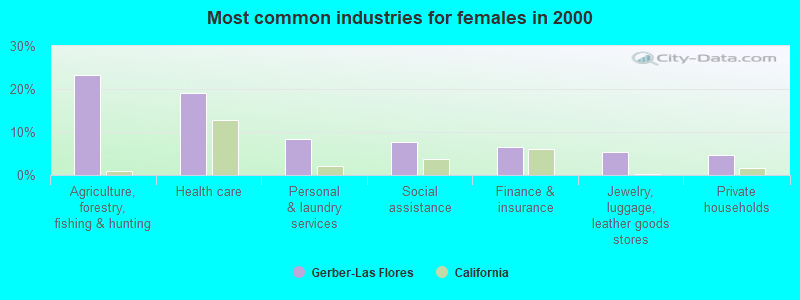
- Agriculture, forestry, fishing & hunting (23.2%)
- Health care (19.0%)
- Personal & laundry services (8.3%)
- Social assistance (7.7%)
- Finance & insurance (6.5%)
- Jewelry, luggage, leather goods stores (5.4%)
- Private households (4.8%)
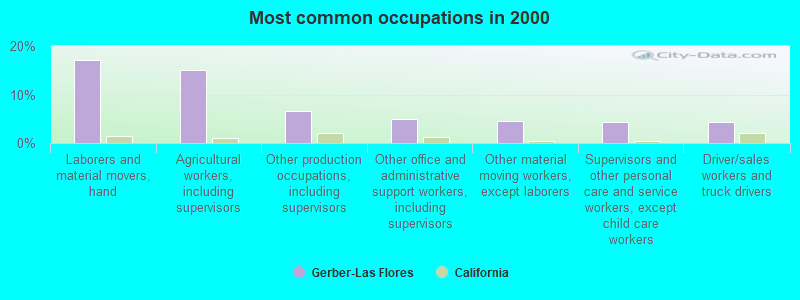
- Laborers and material movers, hand (17.1%)
- Agricultural workers, including supervisors (15.0%)
- Other production occupations, including supervisors (6.5%)
- Other office and administrative support workers, including supervisors (5.0%)
- Other material moving workers, except laborers (4.6%)
- Supervisors and other personal care and service workers, except child care workers (4.3%)
- Driver/sales workers and truck drivers (4.3%)
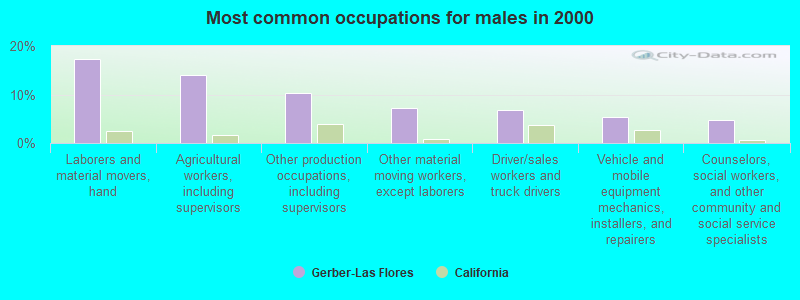
- Laborers and material movers, hand (17.4%)
- Agricultural workers, including supervisors (14.0%)
- Other production occupations, including supervisors (10.2%)
- Other material moving workers, except laborers (7.2%)
- Driver/sales workers and truck drivers (6.8%)
- Vehicle and mobile equipment mechanics, installers, and repairers (5.5%)
- Counselors, social workers, and other community and social service specialists (4.8%)
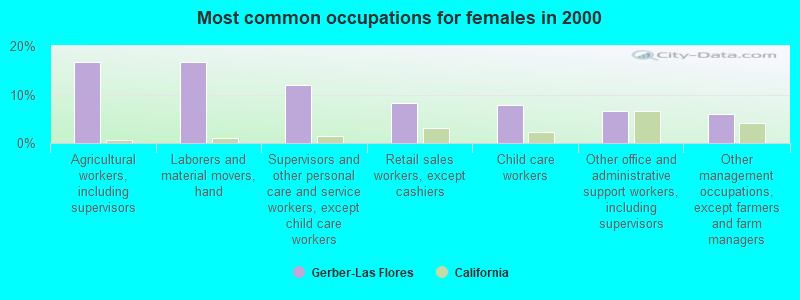
- Agricultural workers, including supervisors (16.7%)
- Laborers and material movers, hand (16.7%)
- Supervisors and other personal care and service workers, except child care workers (11.9%)
- Retail sales workers, except cashiers (8.3%)
- Child care workers (7.7%)
- Other office and administrative support workers, including supervisors (6.5%)
- Other management occupations, except farmers and farm managers (6.0%)
Average climate in Gerber-Las Flores, California
Based on data reported by over 4,000 weather stations


(lower is better)
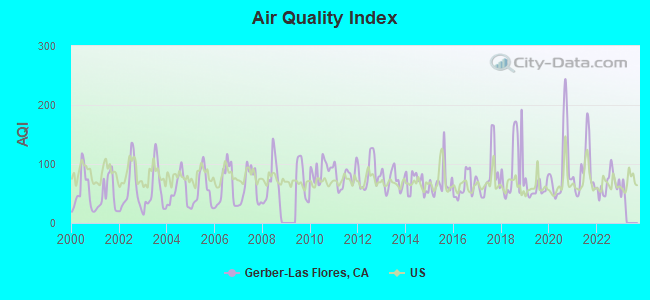
Air Quality Index (AQI) level in 2022 was 66.3. This is about average.
| City: | 66.3 |
| U.S.: | 72.6 |
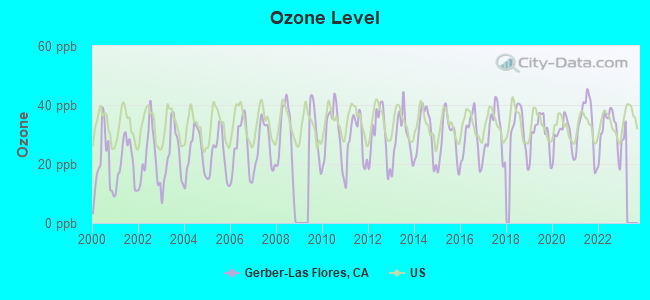
Ozone [ppb] level in 2022 was 31.4. This is about average. Closest monitor was 9.2 miles away from the city center.
| City: | 31.4 |
| U.S.: | 33.3 |
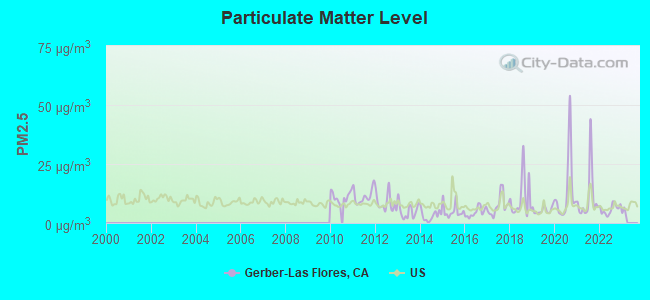
Particulate Matter (PM2.5) [µg/m3] level in 2022 was 5.87. This is better than average. Closest monitor was 8.5 miles away from the city center.
| City: | 5.87 |
| U.S.: | 8.11 |
Earthquake activity:
Gerber-Las Flores-area historical earthquake activity is significantly above California state average. It is 6057% greater than the overall U.S. average.On 4/18/1906 at 13:12:21, a magnitude 7.9 (7.9 UK, Class: Major, Intensity: VIII - XII) earthquake occurred 149.6 miles away from the city center, causing $524,000,000 total damage
On 1/31/1922 at 13:17:28, a magnitude 7.6 (7.6 UK) earthquake occurred 184.6 miles away from the city center
On 4/25/1992 at 18:06:04, a magnitude 7.2 (6.3 MB, 7.1 MS, 7.2 MW, 7.1 MW, Depth: 9.4 mi) earthquake occurred 103.2 miles away from Gerber-Las Flores center, causing $75,000,000 total damage
On 11/8/1980 at 10:27:34, a magnitude 7.2 (6.2 MB, 7.2 MS, 7.2 MW, 7.0 ML) earthquake occurred 134.2 miles away from the city center
On 10/3/1915 at 06:52:48, a magnitude 7.6 (7.6 UK) earthquake occurred 247.3 miles away from the city center
On 1/22/1923 at 09:04:18, a magnitude 7.2 (7.2 UK) earthquake occurred 170.0 miles away from Gerber-Las Flores center
Magnitude types: body-wave magnitude (MB), local magnitude (ML), surface-wave magnitude (MS), moment magnitude (MW)
Natural disasters:
The number of natural disasters in Tehama County (19) is greater than the US average (15).Major Disasters (Presidential) Declared: 12
Emergencies Declared: 3
Causes of natural disasters: Floods: 13, Storms: 7, Winter Storms: 6, Landslides: 4, Fires: 2, Mudslides: 2, Drought: 1, Freeze: 1, Heavy Rain: 1, Hurricane: 1, Tornado: 1, Other: 1 (Note: some incidents may be assigned to more than one category).

Hospitals and medical centers near Gerber-Las Flores:
- RED BLUFF DIALYSIS (Dialysis Facility, about 8 miles away; RED BLUFF, CA)
- ST ELIZABETH COMMUNITY HOSPITAL Acute Care Hospitals (about 8 miles away; RED BLUFF, CA)
- RED BLUFF HEALTH CARE CENTER (Nursing Home, about 9 miles away; RED BLUFF, CA)
- ACCENTCARE HOME HEALTH OF CALIFORNIA, INC (Home Health Center, about 10 miles away; CORNING, CA)
- BRENTWOOD SKILLED NURSING (Nursing Home, about 10 miles away; RED BLUFF, CA)
- ADDUS HEALTHCARE, INC (Home Health Center, about 11 miles away; RED BLUFF, CA)
Colleges/universities with over 2000 students nearest to Gerber-Las Flores:
- California State University-Chico (about 29 miles; Chico, CA; Full-time enrollment: 14,838)
- Butte College (about 40 miles; Oroville, CA; FT enrollment: 8,649)
- Shasta College (about 41 miles; Redding, CA; FT enrollment: 5,645)
- Yuba College (about 73 miles; Marysville, CA; FT enrollment: 4,737)
- Mendocino College (about 84 miles; Ukiah, CA; FT enrollment: 2,263)
- Sierra College (about 101 miles; Rocklin, CA; FT enrollment: 11,488)
- Universal Technical Institute of Northern California Inc (about 104 miles; Sacramento, CA; FT enrollment: 3,193)
Points of interest:
Notable location: Gerber Fire Department (A). Display/hide its location on the map
| This place: | 3.1 people |
| California: | 2.9 people |
| This place: | 75.2% |
| Whole state: | 69.4% |
| This place: | 7.1% |
| Whole state: | 5.9% |
Likely homosexual households (counted as self-reported same-sex unmarried-partner households)
- Lesbian couples: 0.0% of all households
- Gay men: 1.1% of all households
| This place: | 28.7% |
| Whole state: | 14.2% |
| This place: | 6.3% |
| Whole state: | 6.3% |
For population 15 years and over in Gerber-Las Flores:
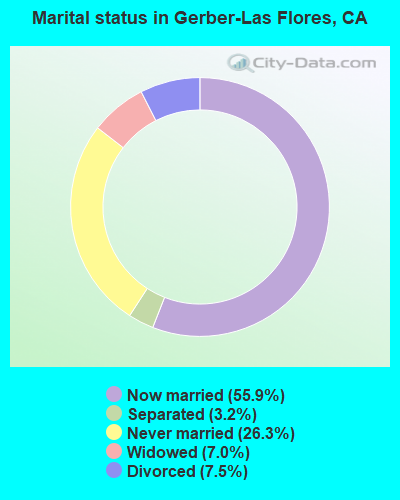
- Never married: 26.3%
- Now married: 55.9%
- Separated: 3.2%
- Widowed: 7.0%
- Divorced: 7.5%
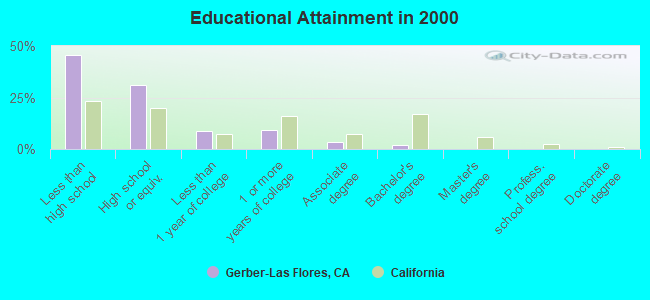
For population 25 years and over in Gerber-Las Flores:
- High school or higher: 54.4%
- Bachelor's degree or higher: 1.9%
- Graduate or professional degree: 0.0%
- Unemployed: 15.4%
- Mean travel time to work (commute): 21.2 minutes
| Here: | 18.3 |
| California average: | 16.1 |
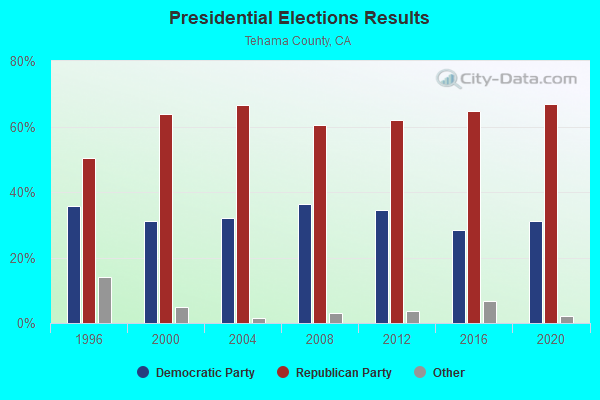
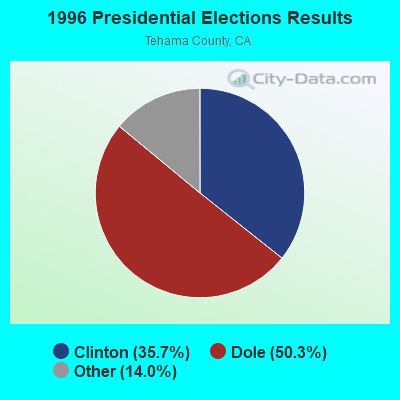

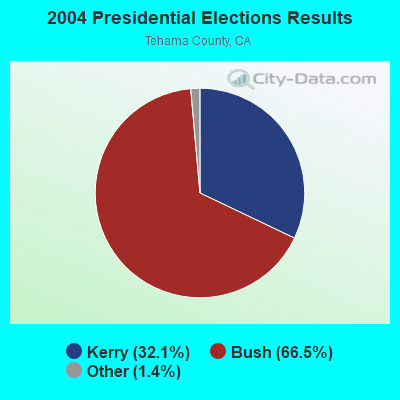
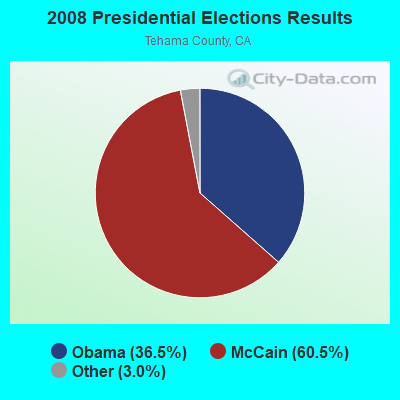
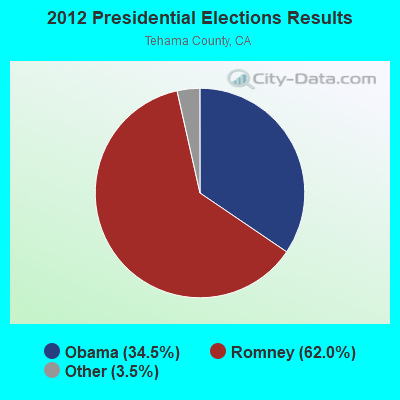
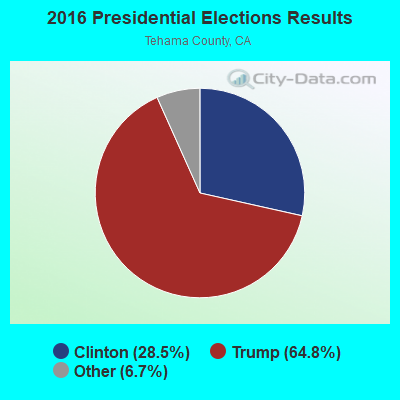

Graphs represent county-level data. Detailed 2008 Election Results
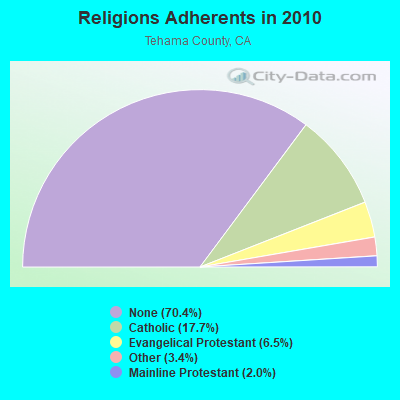
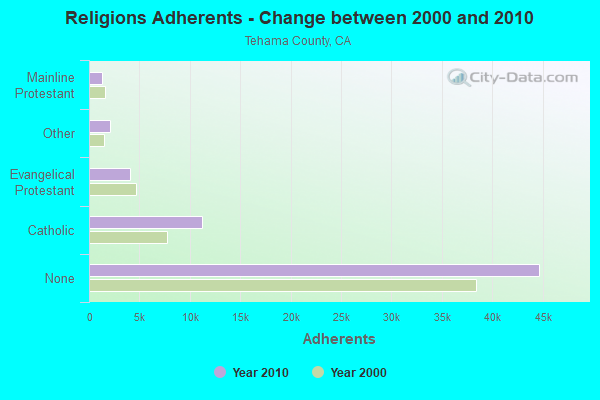
Religion statistics for Gerber-Las Flores, CA (based on Tehama County data)
| Religion | Adherents | Congregations |
|---|---|---|
| Catholic | 11,243 | 3 |
| Evangelical Protestant | 4,100 | 39 |
| Other | 2,130 | 6 |
| Mainline Protestant | 1,280 | 11 |
| Orthodox | 20 | 1 |
| None | 44,690 | - |
Food Environment Statistics:
| Tehama County: | 1.80 / 10,000 pop. |
| State: | 2.14 / 10,000 pop. |
| This county: | 0.98 / 10,000 pop. |
| State: | 0.62 / 10,000 pop. |
| Tehama County: | 3.12 / 10,000 pop. |
| State: | 1.49 / 10,000 pop. |
| Here: | 4.76 / 10,000 pop. |
| California: | 7.42 / 10,000 pop. |
| Here: | 8.4% |
| State: | 7.3% |
| This county: | 25.5% |
| California: | 21.3% |
| This county: | 13.3% |
| State: | 17.9% |
Strongest AM radio stations in Gerber-Las Flores:
- KBLF (1490 AM; 1 kW; RED BLUFF, CA; Owner: TOM HUTH)
- KNRO (1670 AM; 10 kW; REDDING, CA; Owner: REGENT LICENSEE OF REDDING, INC.)
- KPAY (1290 AM; 5 kW; CHICO, CA; Owner: CAPSTAR TX LIMITED PARTNERSHIP)
- KFBK (1530 AM; 50 kW; SACRAMENTO, CA; Owner: AMFM RADIO LICENSES, L.L.C.)
- KKOH (780 AM; 50 kW; RENO, NV; Owner: CITADEL BROADCASTING COMPANY)
- KFIA (710 AM; 25 kW; CARMICHAEL, CA; Owner: VISTA BROADCASTING INC.)
- KCBS (740 AM; 50 kW; SAN FRANCISCO, CA; Owner: INFINITY BROADCASTING OPERATIONS, INC.)
- KHTK (1140 AM; 50 kW; SACRAMENTO, CA; Owner: INFINITY RADIO SUBSIDIARY OPERATIONS INC.)
- KVIP (540 AM; 2 kW; REDDING, CA; Owner: PACIFIC CASCADE COMMUNICATIONS CORP.)
- KSTE (650 AM; 25 kW; RANCHO CORDOVA, CA; Owner: AMFM RADIO LICENSES, L.L.C.)
- KTRB (860 AM; 50 kW; MODESTO, CA; Owner: PAPPAS RADIO OF CALIFORNIA, A CALIFORNIA LIMITED PARTNERSHIP)
- KNBR (680 AM; 50 kW; SAN FRANCISCO, CA; Owner: KNBR LICO, INC.)
- KCBC (770 AM; 50 kW; RIVERBANK, CA; Owner: KIERTRON, INC.)
Strongest FM radio stations in Gerber-Las Flores:
- KLVB-FM (102.7 FM; RED BLUFF, CA; Owner: EDUCATIONAL MEDIA FOUNDATION)
- KHRD (103.1 FM; WEAVERVILLE, CA; Owner: RESULTS RADIO LICENSEE, LLC)
- KNCQ (97.3 FM; REDDING, CA; Owner: RESULTS RADIO OF REDDING, LLC)
- KRDG (105.3 FM; SHINGLETOWN, CA; Owner: REGENT LICENSEE OF REDDING, INC.)
- KTHU (100.7 FM; CORNING, CA; Owner: RESULTS RADIO LICENSEE, LLC)
- KLVC (88.3 FM; MAGALIA, CA; Owner: EDUCATIONAL MEDIA FOUNDATION)
- K216CF (91.1 FM; CHICO, CA; Owner: YOUR CHRISTIAN COMPANION NETWORK, INC.)
- KZAP (96.7 FM; PARADISE, CA; Owner: REGENT LICENSEE OF CHICO, INC.)
- KHSL-FM (103.5 FM; PARADISE, CA; Owner: CAPSTAR TX LIMITED PARTNERSHIP)
- KCHO (91.7 FM; CHICO, CA; Owner: UNIV. FOUNDATION/CA. ST. UNIV. CHICO)
- KMXI (95.1 FM; CHICO, CA; Owner: CAPSTAR TX LIMITED PARTNERSHIP)
- K225AJ (92.9 FM; BURNEY/REDDING, CA; Owner: CALVARY CHAPEL OF TWIN FALLS, INC.)
- KFMF (93.9 FM; CHICO, CA; Owner: REGENT LICENSEE OF CHICO, INC)
- KALF (95.7 FM; RED BLUFF, CA; Owner: REGENT LICENSEE OF CHICO, INC)
- KKXS (96.1 FM; SHINGLETOWN, CA; Owner: RESULTS RADIO LICENSEE, LLC)
- K205EJ (88.9 FM; CHESTER, CA; Owner: CALVARY CHAPEL OF TWIN FALLS, INC.)
- KNNN (99.3 FM; SHASTA LAKE CITY, CA; Owner: REGENT LICENSEE OF REDDING, INC.)
- KVIP-FM (98.1 FM; REDDING, CA; Owner: PACIFIC CASCADE COMMUNICATIONS CORP.)
- KTOR (99.7 FM; WESTWOOD, CA; Owner: SIERRA RADIO, INC.)
- KBNF (98.9 FM; CHESTER, CA; Owner: CAROUSEL BROADCASTING, INC.)
TV broadcast stations around Gerber-Las Flores:
- KNVN (Channel 24; CHICO, CA; Owner: CHICO LICENSE, L.L.C.)
- KCVU (Channel 30; PARADISE, CA; Owner: SAINTE PARTNERS II, L.P.)
Gerber-Las Flores fatal accident list:
- National Bridge Inventory (NBI) Statistics
- 2Number of bridges
- 7ft / 1.6mTotal length
- 500Total average daily traffic
- 10Total average daily truck traffic
- 875Total future (year 2040) average daily traffic
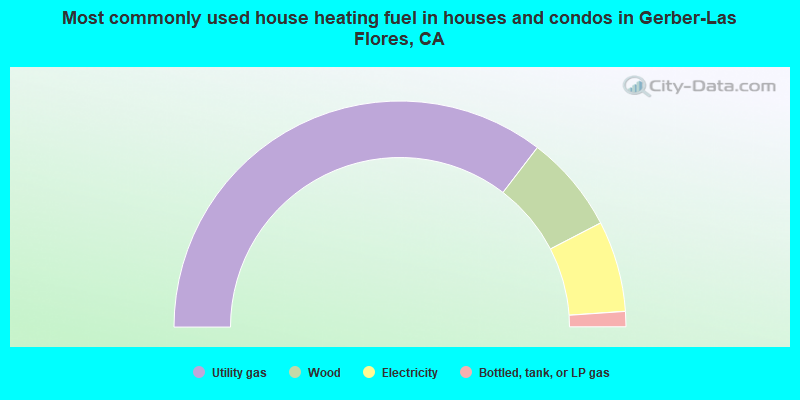
- 70.8%Utility gas
- 14.0%Wood
- 13.0%Electricity
- 2.2%Bottled, tank, or LP gas
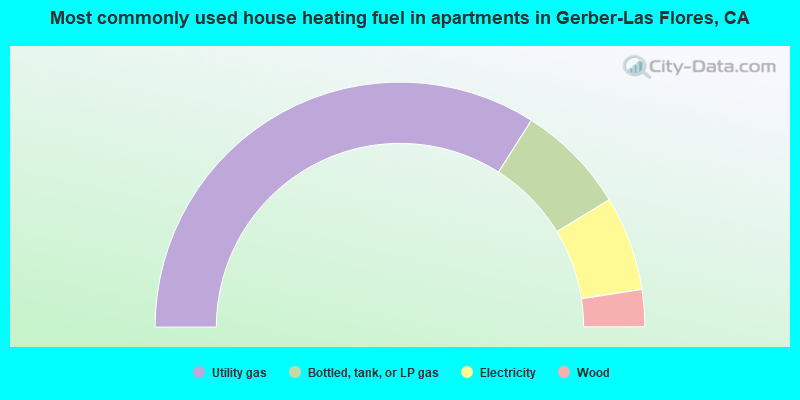
- 68.1%Utility gas
- 14.6%Bottled, tank, or LP gas
- 12.5%Electricity
- 4.9%Wood
Gerber-Las Flores compared to California state average:
- Median household income below state average.
- Median house value significantly below state average.
- Black race population percentage significantly below state average.
- Renting percentage significantly below state average.
- Length of stay since moving in significantly above state average.
- Number of rooms per house significantly below state average.
- House age significantly below state average.
- Number of college students significantly below state average.
- Percentage of population with a bachelor's degree or higher significantly below state average.