

Announcing Updated and Enhanced US Tornado and Hail Frequency Maps!
The SPC, NOAA’s “Annual Occurrence Frequency Maps” for tornado and hail have now been brought up to date (they now include 2020 data) and are now available in EigenPrism.
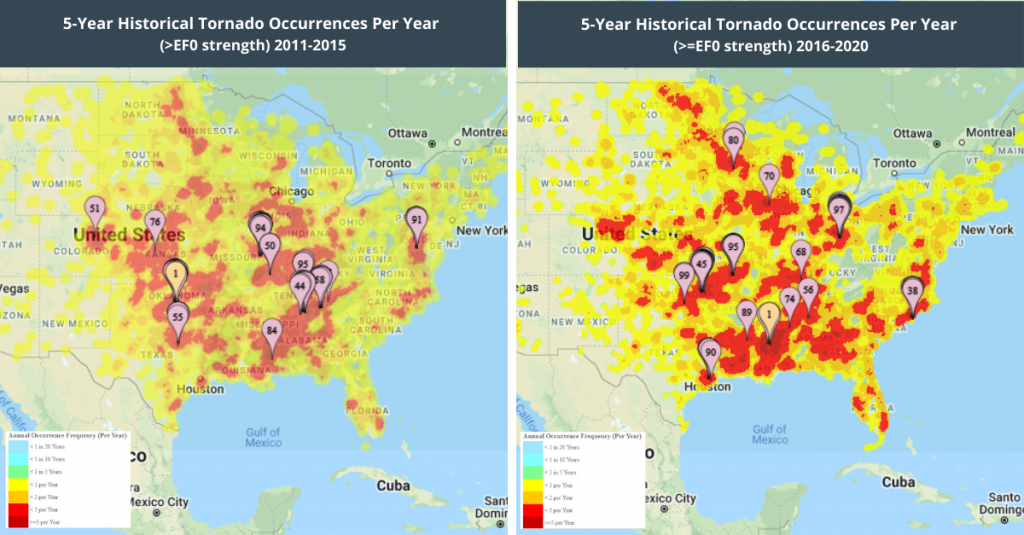
These ‘frequency maps’ display the frequency of events across the US. This is just in time with the ongoing severe weather season especially following the weather outbreak from the past few weeks that resulted in multiple disastrous tornados across the country.
With an increasing upward shift in early-spring severe weather activity, the high-resolution Frequency Maps display accurate data that helps in improving the understanding of the relative risk of tornado and hail activity between locations. Key highlights of the enhanced Frequency Maps are:
- Both maps now include data current to 2020 (previously 2015)
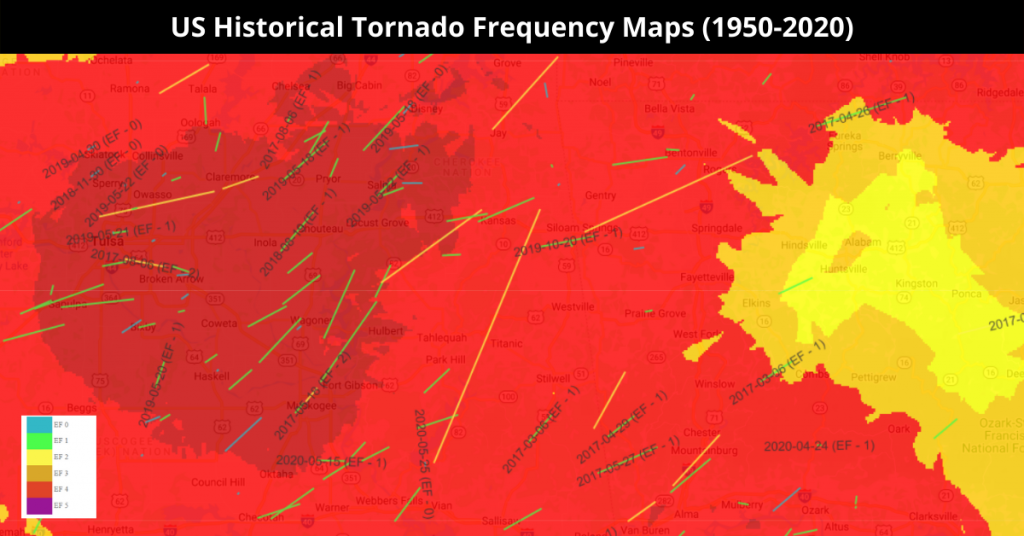
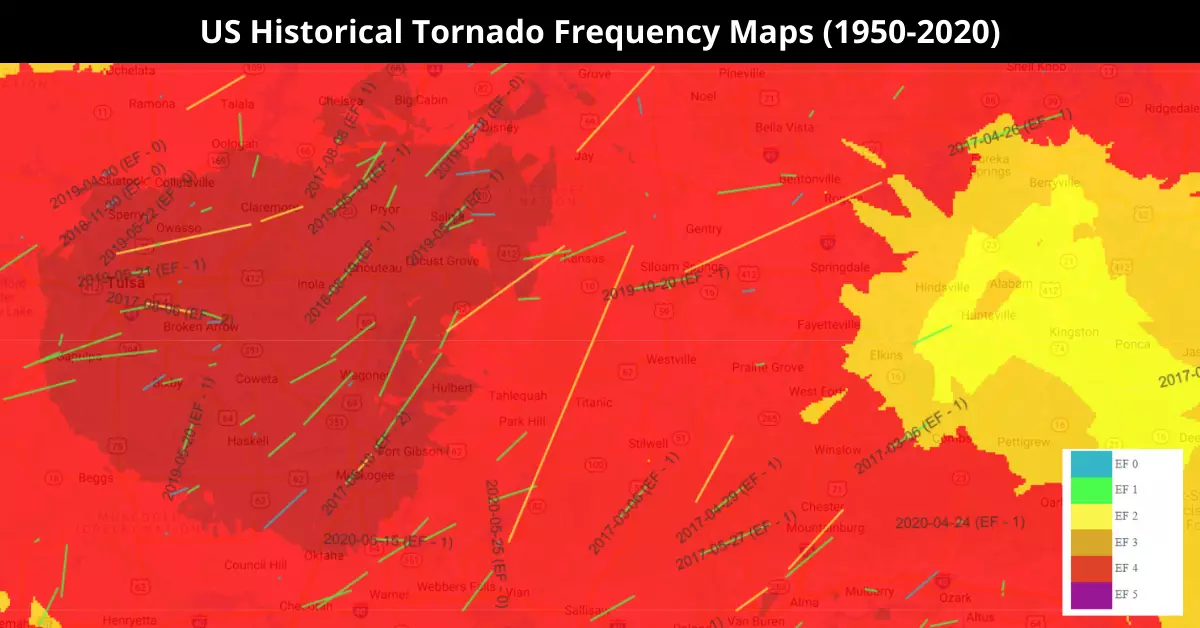
- All users can now visualize historical tornado tracks for greater context into frequencies.
- Our 4.0 Beta users can create more powerful tornado hazard reports combining hazard maps and historical tracks, to clearly communicate risk.
Click below to access the event footprints:
5-Year Historical Tornado Occurrences Per Year (>EFO Strength) | 2011-2015
5-Year Historical Tornado Occurrences Per Year (>EFO Strength) | 2016-2020
10-Year Historical Tornado Occurrences Per Year (>EFO Strength) | 2006-2015
10-Year Historical Tornado Occurrences Per Year (>EFO Strength) | 2011-2020
To learn how to access the “US Historical Tornado Frequency Maps (1950-2020)” and overlay the tornado tracks, please click here.


