When performing vibration analysis in rotating machinery, sidebands are a critical piece of the puzzle in determining certain types of faults. Often, sidebands can be a bit cumbersome to comprehend. If not properly understood, it means a lot of vibration data analysts miss out on the information that the presence of sidebands offers during the resolution of machinery health status.
What are Sidebands
Imagine the ideal scenario where gears mesh perfectly with no issues, no wear in the teeth, no shaft play, and no eccentricity problems. In this case, we would only have vibration activities occurring at Gear Mesh Frequency (GMF). In reality, this is rarely the case as there would be some imperfections. As the gears mate during operation, the GMF is the center frequency and the other pairs of frequencies that show up due to worn or damaged teeth or shaft play are know as sidebands.
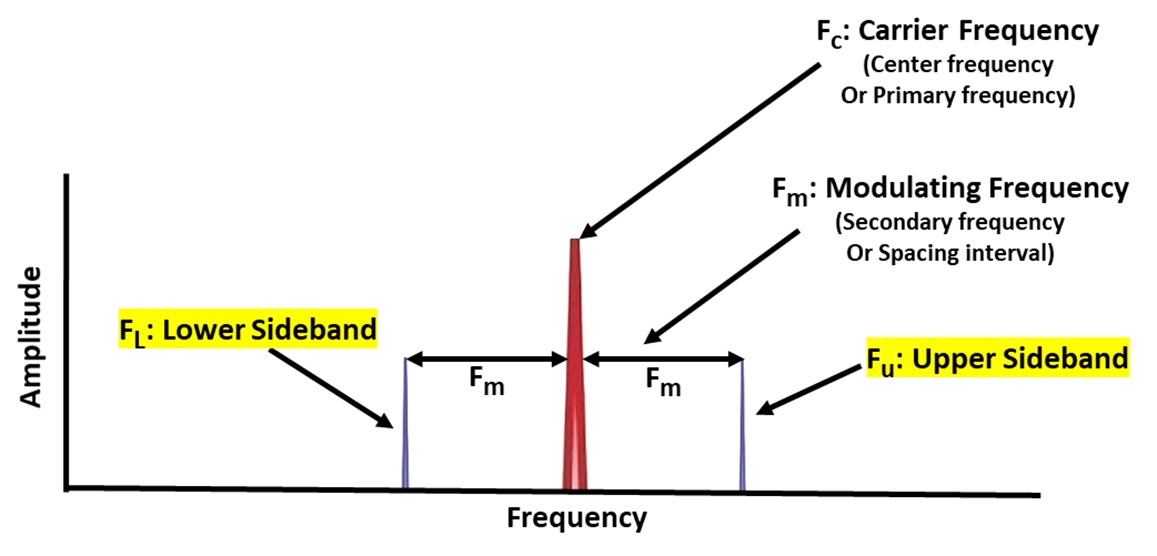
Sidebands are frequencies that are generated in the frequency domain because of the modulation of a Carrier signal by a Modulating signal. Modulation itself is usually the fluctuation (periodic change) in amplitude or in frequency of the Combined signal (Carrier plus Modulating signals) due to the influence of the modulating signal. The frequency of the Modulating signal is in most cases lower than that of the Carrier signal. The sidebands are formed in pairs as new frequencies above and below the Carrier Frequency (Figure 1).
Simply put, sidebands are the way the FFT (Fast Fourier Transform) expresses the occurrence of modulation (as observed in the time domain) in the Frequency domain.
Sideband Formation
Sidebands are typically formed from two types of modulation – amplitude and frequency.
Amplitude Modulation:
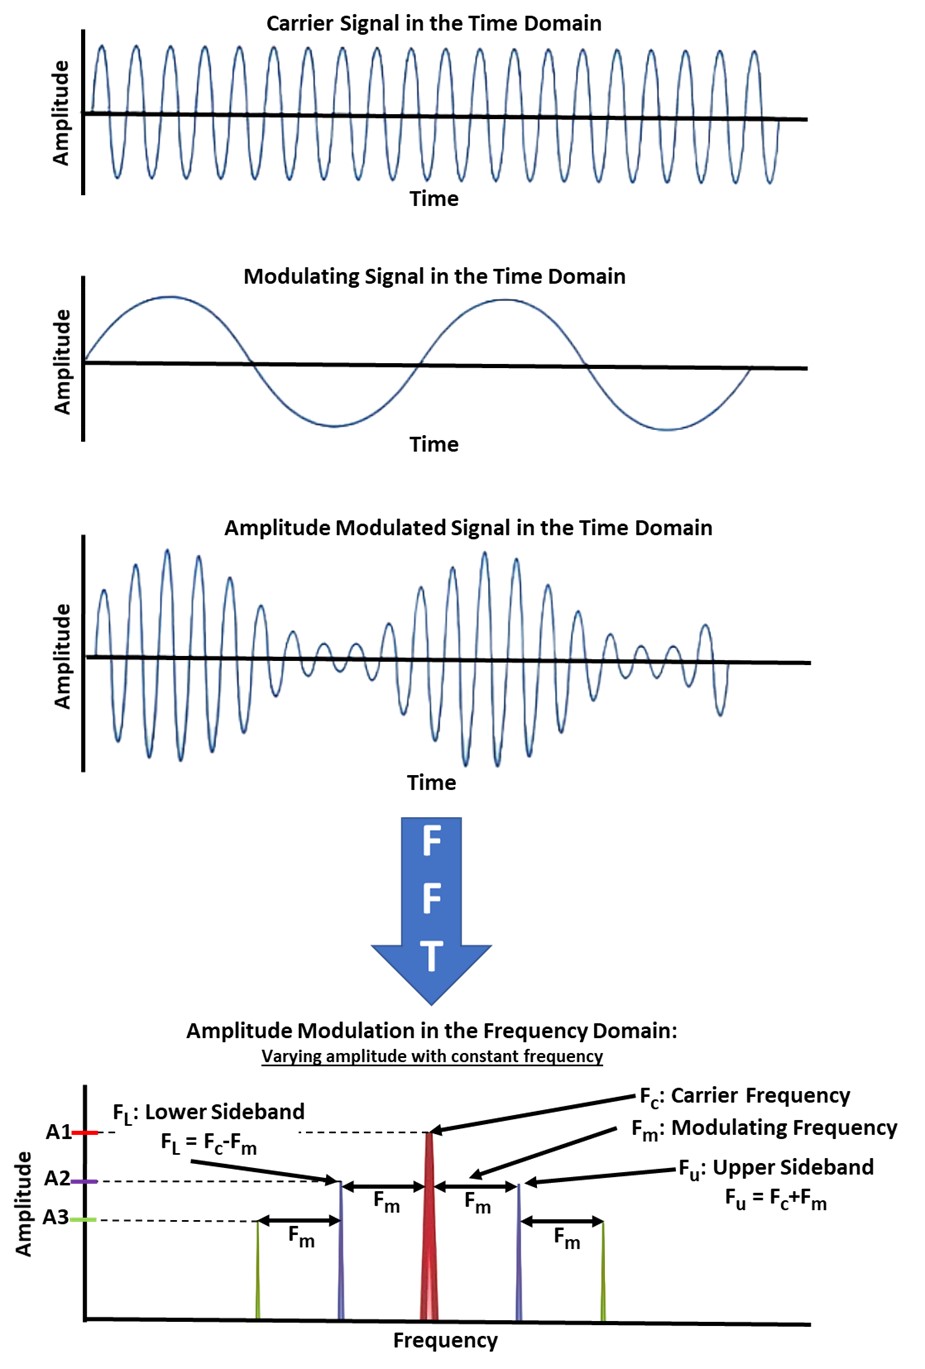
This is the form of modulation that generates the most common cases of sidebands in vibration analysis. For this form of modulation, the Carrier signal and the Modulating signal are somewhat superimposed to result in a new signal with varying amplitude but at a constant frequency. When this is passed though the FFT (Fast Fourier Transform) and viewed in the frequency domain, it typically shows the sidebands with varying amplitudes at constant frequency (see Figure 2).
Frequency Modulation:
In this case, the new signal formed because the Carrier and the Modulating signals merged together. The signal has a constant amplitude but at varying frequency. Passing this through the FFT (Fast Fourier Transform) into the frequency domain gives the sideband peaks with varying frequency at a constant amplitude (see Figure 3). This case of Frequency Modulation is not very common.

Important Features of Sidebands in Vibration Analysis
- Increase in their amplitude levels mostly indicate the presence of a machinery issue. (Note: They do not show up for fun)
- Their presence even at very low amplitude levels can be significant during vibration data analysis
- They are mostly equally spaced from the center frequency
- They can occur around multiple harmonics of the center frequency
- They can be formed around different center frequencies
- They can occur in multiple pairs of more than one.
- They can have different amplitude levels relative to the center frequency (sometimes known as asymmetric sidebands)
Note: Sidebands are usually the lower and upper frequencies evenly spaced around the center frequency. The spacing or separation is the Modulating Frequency, and it is sometimes confused as the sidebands. For example, you may hear vibration analysts say, “there is a peak at 890Hz with sidebands of 30Hz”. This means that the center frequency (Carrier signal) is 890Hz. The equal spacing or Modulating Frequency is 30Hz. This signifies that the Upper and Lower sidebands are 920Hz and 860Hz (890+30 and 890-30) respectively.
Fault Progression
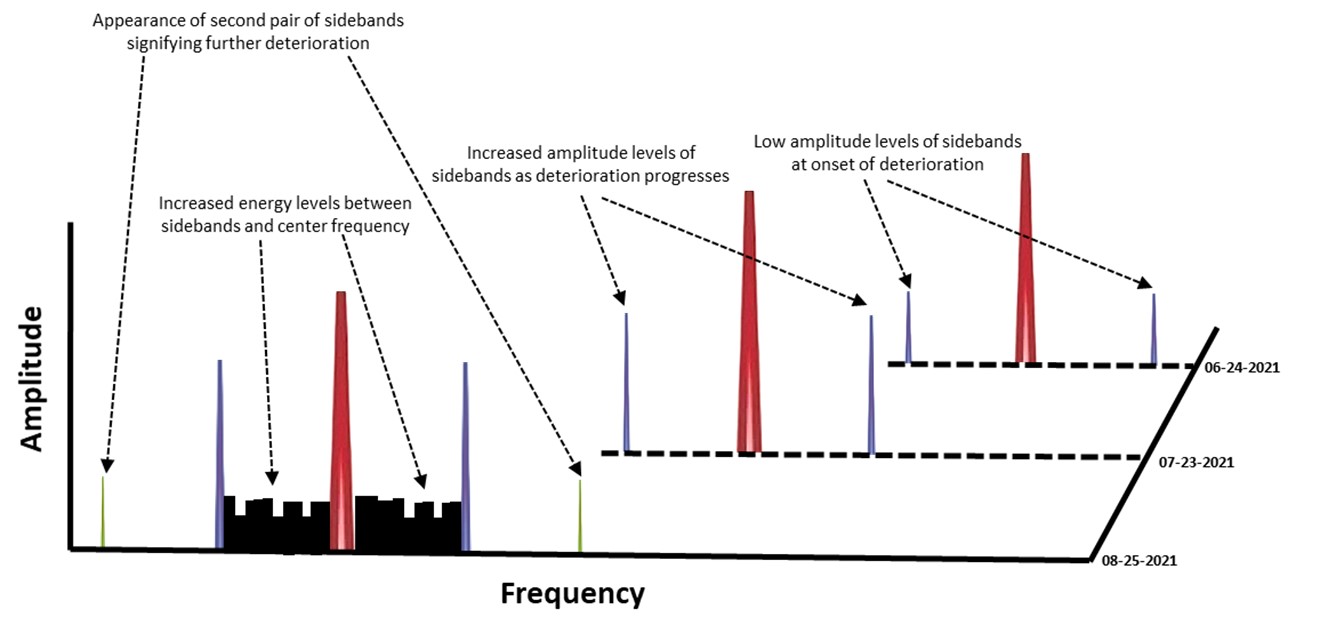
If sidebands are present and do not change over time, it means that is there is no increase in the rate of deterioration. However, as a fault progresses, the amplitude levels of the sidebands will experience an increase. As things get even worse with the machine’s health status, it is also possible to see multiple pairs of sidebands appear especially with amplitude modulation-type sidebands. With increased levels of deterioration, the carpet level (energy level) between the sidebands and the center frequency also tends to be increased. See Figure 4 showing progressive deterioration from June through to August.
Identification and Trending of Sidebands
Sidebands can sometime be difficult to identify from linear spectral plots. This is primarily due to their low amplitude levels especially at the onset of a machinery fault. If vibration data analysis is carried out manually, it will be beneficial to view the spectra in the logarithmic display.
If you have any questions regarding vibration monitoring or would like to learn more, contact our Reliability Team at 877-962-2400 or complete the Contact Us form.