Gamma-ray, stable carbon and oxygen isotope chemostratigraphy and sequence stratigraphy of the Lower Mahil Formation (KS-1 Khuff-Equivalent), Northern Oman
 Mohamed S. H. Moustafa1
  Rasha Al Raqaishi1 Mohamed A. K. El-Ghali1,2
  Mohamed Gharbi3 Iftikhar Ahmed Abbasi1 Aaraf Al Humaidi4 Nada Al Ghafri1 Marwa Musallam Alshukaili1
  Hezam Al-Awah5*
- 1Department of Earth Sciences, Sultan Qaboos University, Muscat, Oman
- 2Earth Sciences Research Center, Sultan Qaboos University, Muscat, Oman
- 3Geo-Resources Laboratory, Water Research and Technologies Center, Borj-Cedria, Soliman, Tunisia
- 4Petrogas Oil Company, Muscat, Oman
- 5Geology Program, Department of Chemistry and Earth Sciences, College of Arts and Sciences, Qatar University, Doha, Qatar
This research presents findings from a study focused on the Lower Triassic (Induan) Lower Mahil KS-1 Formation, situated on a homoclinal carbonate platform in Northern Oman. The sequence stratigraphy of this formation is characterized by a considerable thickness variation, slumps, and breccia deposits related to active normal faults coupled with intra-basin growth faults. The main objective was to establish a reliable stratigraphic framework for the Lower Mahil KS-1 Formation by integrating high-resolution carbon isotope data along with high-resolution spectral and total gamma-ray data. To achieve this, whole-rock samples were analyzed for δ13C and δ18O isotopes. Spectral and total gamma-ray records were obtained for the formation. Isotope sampling is conducted every 0.5 m in the Saiq Plateau and Wadi Sahtan sections. Furthermore, spectral gamma-ray measurements were taken at intervals of 10 cm from the logged sections. Within the third-order sequence, the spectral gamma-ray data revealed a distinct sea-level trend, leading to the division of KS1 into two different parts. Five fourth-order depositional sequences were identified by analyzing stable carbon isotopes, uranium, and total gamma-ray profiles. Four of these sequences displayed complete patterns, reflecting transgression and regression phases, while the fifth sequence was incomplete and solely comprised a transgressive phase. An essential outcome of the study is the correlation of the δ13C curve of the Lower Mahil KS-1 Formation with other similar formations around the Tethys region. This correlation indicates that the Lower Mahil KS-1 Formation captures the near-primary signal of carbon isotope variations in coeval seawater. As a result, it holds promise as a reference section for future investigations and studies in this field. Compared to the prior investigation, this study utilizes data with higher precision, capturing spectral gamma-ray measurements at 10 cm intervals and isotope measurements at 50 cm intervals. Furthermore, the study’s focus is confined explicitly to KS1.
1 Introduction
Sequence stratigraphy defines sequences as repeating strata separated by erosion or nondeposition surfaces (Vail, 1987; Van Wagoner et al., 1988). Sea-level changes and tectonic subsidence control sediment accommodation potential (Haq et al., 1987; Aigner and Bachmann, 1992; Schlager, 1993), influencing retrogradation, aggradation, and progradation trends (Catuneanu et al., 2009). Eustatic fluctuations create cycles of different orders on the sea-level curve, varying durations (Vail et al., 1977; Goldhammer et al., 1991). Marine outcrops reveal three key depositional surfaces during specific time intervals: sequence boundary (SB), maximum flooding surface (MFS), and transgression surface (TS). These define distinct depositional system tracts (HST, TST, and LST) within sequences (Mitchum et al., 1991). The transgressive surface marks the onset of relative sea-level rise and significant lithologic changes (Dravis, 1996; Brachert et al., 2003). The maximum flooding surface shows periods of depositional starvation (Haq et al., 1987). Stable isotope data offer quantitative evidence for ocean circulation and global climate changes (Marshall, 1992).
Marine carbonate rocks serve as a repository of ancient oceanic chemistry information due to chemical precipitation (Patterson and Walter, 1994; Jenkyns and Clayton, 1997). Carbon and oxygen stable isotopes are studied over geologic history, aiding chemostratigraphic correlations using marine carbonate rocks and fossils (Scholle and Arthur, 1980; Scholle, 1995; Kump and Arthur, 1999; Veizer et al., 1999; Moustafa et al., 2016). The δ13C and δ18O exhibit shifts correlating with major stratigraphic surfaces: a positive shift toward maximum flooding surface (MFS) and decreasing excursion toward sequence boundary (SB) (Hamon and Merzeraud, 2007; Moustafa et al., 2016; Peyravi et al., 2021). Carbon isotopes, mainly derived from seawater at sediment deposition time, maintain their marine signature over time (Garrels and Abraham, 1981; Vahrenkamp, 1996). δ13C is a reliable criterion for correlating and constraining stratigraphic sequences and is considered a proxy of sea-level changes (Morante, 1996; Vahrenkamp, 1996; Veizer et al., 1999; Bartley et al., 2001; Krull et al., 2004; Sharifi-Yazdi et al., 2019; Gröcke, 2020). Stable oxygen isotopes, determined by water composition and temperature, help in understanding ancient seawater changes and climate Hudson, 1977; Hoefs and Hoefs, 1997; Hamon and Merzeraud, 2007; Grossman and Joachimski, 2020].
δ18O variations provide valuable information on climate changes and diagenetic fluids (Sharifi-Yazdi et al., 2019; McConnaughey, 1989; deMenocal et al., 1990; Moustafa et al., 2016). Spectral gamma-ray logs offer valuable insights into stratigraphy, formation composition, and lithology (Fertl and Rieke, 1980; Davies et al., 1996; Hampson et al., 2005; Tavakoli, 2017; Khalifa and Mills, 2020; Farouk et al., 2022; Farouk et al., 2023). These logs measure natural radioactivity resulting from unstable isotopes in rocks (Buccianti et al., 2009; Klaja and Dudek, 2016). The spectral gamma-ray spectrometry tool allows the measurement of radioactivity from primary isotopic sources, namely, Thorium (Th), Uranium (U), and Potassium (K) (Serra et al., 1980; Hurst, 1990; Davies et al., 1996; Glover, 2000). These elements are observed and measured separately using the tool, with K recorded as a percentage and U238 and Th232 recorded in parts per million (ppm) (Serra et al., 1980; Myers and Bristow, 1989a; Hurst, 1990; Doveton and Prensky, 1992; Buccianti et al., 2009; Klaja and Dudek, 2016; Guagliardi et al., 2020). The relative abundance of Th and K in a formation indicates pure carbonate, whereas the presence of U in carbonate rock suggests the presence of organic material (Serra, 1984; Glover, 2000; Gao et al., 2020). The sum of Th, U, and K radiation should match the total gamma-ray value (total GR) measured by the entire gamma-ray tool. Low gamma radiation suggests coarse-grained sandstone and carbonate rocks, while high gamma ray indicates fine-grained sediments or clay-rich formations like shale and mudstone (Doveton and Prensky, 1992; Klaja and Dudek, 2016).
The computed gamma-ray response (CGR), derived from the sum of potassium and thorium radiation, is used to avoid the potential effects of U radiation (Glover, 2000; Cong et al., 2019). Analyzing the spectral gamma-ray data often involves using ratios of the abundances of primary radioactive sources (Glover, 2000). The Th/K ratio and Th-K cross-plots aid in identifying facies, clay mineral segregation, and other radioactive species (Myers and Bristow, 1989b; Hurst, 1990; Doveton and Prensky, 1992). Additionally, Th/U ratio variations can indicate sedimentary processing and depositional settings, providing insights into transgressive-regressive and oxidizing-reducing conditions (Adams and Weaver, 1958; Doveton and Prensky, 1992; Klaja and Dudek, 2016). A low Th/U ratio, when coinciding with a notable U peak, may indicate the maximum flooding surface (Davies et al., 1996).
This study aimed to provide a sequence stratigraphic interpretation of the Lower Triassic Mahil Formation (KS-1) in Saiq Plateau and Wadi Sahtan, northern Oman (Figure 1). The research integrated various data sets, including detailed measured sections, stable carbon isotopes, gamma-ray measurements, lithologies, and microfacies analysis. The main objective was to enhance the understanding of the Mahil Formation by integrating high-resolution carbon isotopes and gamma-ray measurements, leading to the identification and correlation of key stratigraphic surfaces and depositional sequences. This integration addressed potential misleading interpretations of the isotopic curve and gamma-ray within the Khuff Formation.
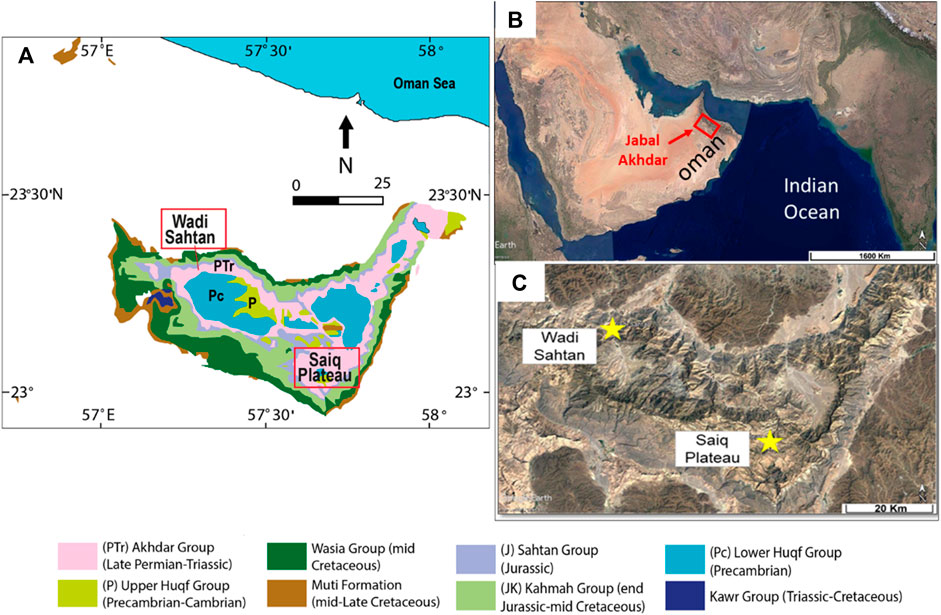
FIGURE 1. Location maps of the study areas in the Oman Mountains. (A) The geological map of the Oman Mountains displays the study areas. It indicates the Saiq and Mahil formations of the Akhdar Group, which belong to the Permian Triassic boundary (PTr) [modified after (59)]. (B) A Google image of the Sultanate of Oman highlights the location of the northern Oman Mountains, specifically the Jabel Akhdar Window (marked with a red square). (C) Another Google image focuses on the two study locations, namely, the Saiq Plateau and Wadi Sahtan, marked with yellow stars.
The study explored the relationship between facies characteristics, isotopic values, and depositional environments, enhancing the understanding of the area’s geological history, using detailed measured sections, microfacies analysis, stable carbon isotopes, and gamma-ray measurements allowed for a comprehensive characterization of the depositional environments and their spatial distribution within the Mahil Formation.
Biostratigraphic data were also incorporated to aid in age determination and correlation. The methodological advancements in this study, including higher resolution sampling and recent microfacies analysis, contribute to a more accurate interpretation of the sequence stratigraphy and a better understanding of the geology of the studied area. Overall, this research contributes valuable insights to the field and enhances our knowledge of the depositional processes and paleoenvironmental changes within the Mahil Formation.
2 Geological setting and stratigraphy
During the Middle Permian-Early Triassic, the movement of Cimmerian terranes away from the Pangea Supercontinent and the opening of the Neo-Tethys Ocean resulted in a significant syn-to post-rift stage in northern Oman (Pillevuit, 1993; Abdolmaleki and Tavakoli, 2016; Haghighat et al., 2020). Subsequently, the Khuff Formation, a well-bedded, widespread shallow-water carbonate deposit, formed on the passive continental margin of the Neo-Tethys Ocean due to rapid subsidence caused by a Late Permian marine transgression (Al-Jallal and Ibrahim, 1991; Wender et al., 1998; Poppelreiter and Marshall, 2013; Walz et al., 2013; Alqahtani, 2019). The Khuff Formation was deposited on a flat epeiric carbonate ramp, forming extensive facies tracts covering tens to hundreds of kilometers (Insalaco et al., 2006).
During the Late Paleozoic period, the Neo-Tethys Ocean along the Arabian Plate margin underwent significant geological processes, including extensional tectonics, crustal stretching, and rapid subsidence (Geert et al., 2001; Martin, 2001; Poppelreiter and Marshall, 2013; Cooper et al., 2016). These forces gradually caused continental rifting across the entire plate, resulting in passive borders oriented towards the north and southeast. The swift subsidence and substantial marine transgression led to the new passive margin Khuff deposits (Alqahtani, 2019). This geological evolution involved marine flooding and a transition from clastic to carbonate deposition, driven by the increased accommodation space resulting from rifting and drifting activities (Koehrer et al., 2010; Koehrer et al., 2012; Bendias et al., 2013). Consequently, the Khuff period was characterized by shallow marine conditions, predominantly marked by the deposition of carbonate rocks (Poppelreiter and Marshall, 2013).
The subsurface Khuff Formation is time-equivalent to the Saiq and Lower Mahil members in the Northern Oman Mountains. The Late Permian Saiq Formation correlates with the Lower and Middle Khuff formations in the Oman subsurface (Figure 2), while the overlying Triassic dolomitic Mahil Formation corresponds to the Upper Khuff, Sudair, and Jilh formations in the Oman subsurface (Alsharhan et al., 1986; Walz et al., 2013).
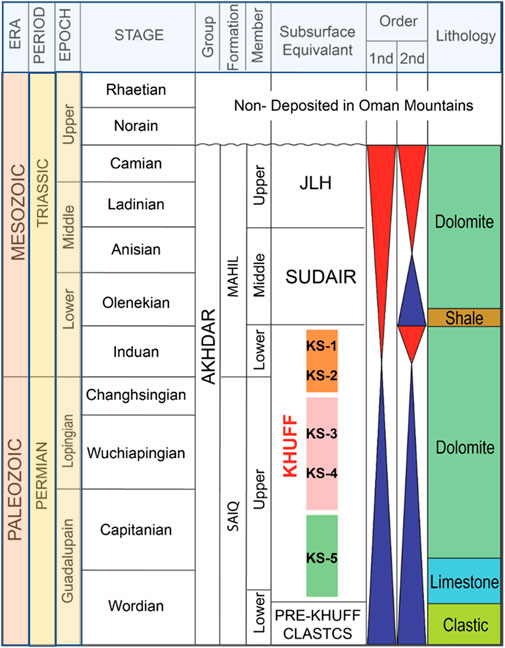
FIGURE 2. The sequence and sedimentary framework scheme of the Khuff Formation and its equivalents in the Oman Mountains, as presented by (Koehrer et al., 2010).
The Khuff Permian lies unconformably on the pre-Permian rocks of the Oman Mountains and is conformably overlain with a sharp contact by the Middle Triassic Sudair Shale (Lee, 1990; Al-Jallal and Ibrahim, 1991; Al-Aswad, 1997; Vaslet et al., 2005; Al-Husseini et al., 2013; Walz et al., 2013). The Saiq-Mahil boundary (SMB) has different interpretations among researchers (Baud and Sylvain, 2013). identified two positions of the SMB in Al Jabal al-Akhdar, with an interval of about 75 m thick on the Saiq Plateau. They named this interval “Saiq unit C” for the “upper SMB position” or the “lower Mahil member” for the “lower SMB position.” On the other hand (Koehrer et al., 2010), proposed a different interpretation, considering the Lower Triassic Khuff Formation as one supersequence comprising six transgressive-regressive sequences (KS6–KS1). According to (Koehrer et al., 2010), on the Saiq Plateau in Oman, the Upper Saiq Formation is time-equivalent to the Lower and Middle Khuff Formation (K5–K3), and the Lower Mahil Member is time-equivalent to the Upper Khuff Formation (K2-K1). Their interpretation has been widely used in publications related to the petroleum industry. (Koehrer et al., 2010; Baud and Richoz, 2013).
3 Dataset and methodology
In this study, data were collected from two logged sections: a 49 m Saiq Plateau and a 40 m Wadi Sahtan, both from the upper part of the Lower Mahil Formation (KS-1). The tectonic-sedimentary evolution and the fault activity of the passive margin of Neo Tethys in North Oman, field observation, and restored field geological cross-section have been carried out. Sedimentological logs were manually constructed in the field, focusing on lithology, grain size, bed thickness, color, and sedimentary structure.
Additionally, 179 fresh carbonate samples were collected from both sections. Gamma-ray radiation measurements were taken at intervals of 10 cm using a portable radiation spectrometer survey instrument (RS 230 BGO-SUPER-SPEC) equipped with a 2 × 2″ sodium-iodide detector. The output data provided parts per million (ppm) values for uranium and thorium and percentage (%) values for potassium. The samples underwent processing, thin sectioning, and half-staining in the laboratory following (Dickson, 1965) procedure.
Microsampling was performed using a Hand-Operated Micro-drilling device with a 0.1–0.8 mm bit at the Department of Earth Sciences of Sultan Qaboos University (SQU). The collected samples were sent to the Stable Isotope Geosciences Facility (SIGF) at Texas A&M University for stable carbon and oxygen isotope analysis using a Kiel IV carbonate device coupled with a Thermo Scientific MAT 253 isotope ratio mass spectrometer. The precision of the analyses was reported as 0.04‰ for δ13C and 0.06‰ for δ18O, relative to Vienna Pee Dee Belemnite (VPDB) using the NBS-19 standard (δ13C = 1.95‰, δ18O = −2.20‰).
4 Lithofacies and depositional environment of Lower Mahil KS-1
The lithofacies and microfacies of the lower Mahil KS-1 outcrop-microfacies are outlined in (Al Ruqaishi et al., 2023) (Figures 3–5) and summarized in Tables 1–3. Accordingly, microfacies were grouped into three lithofacies-dominated groups: location, fossil, and lithofacies association distribution.
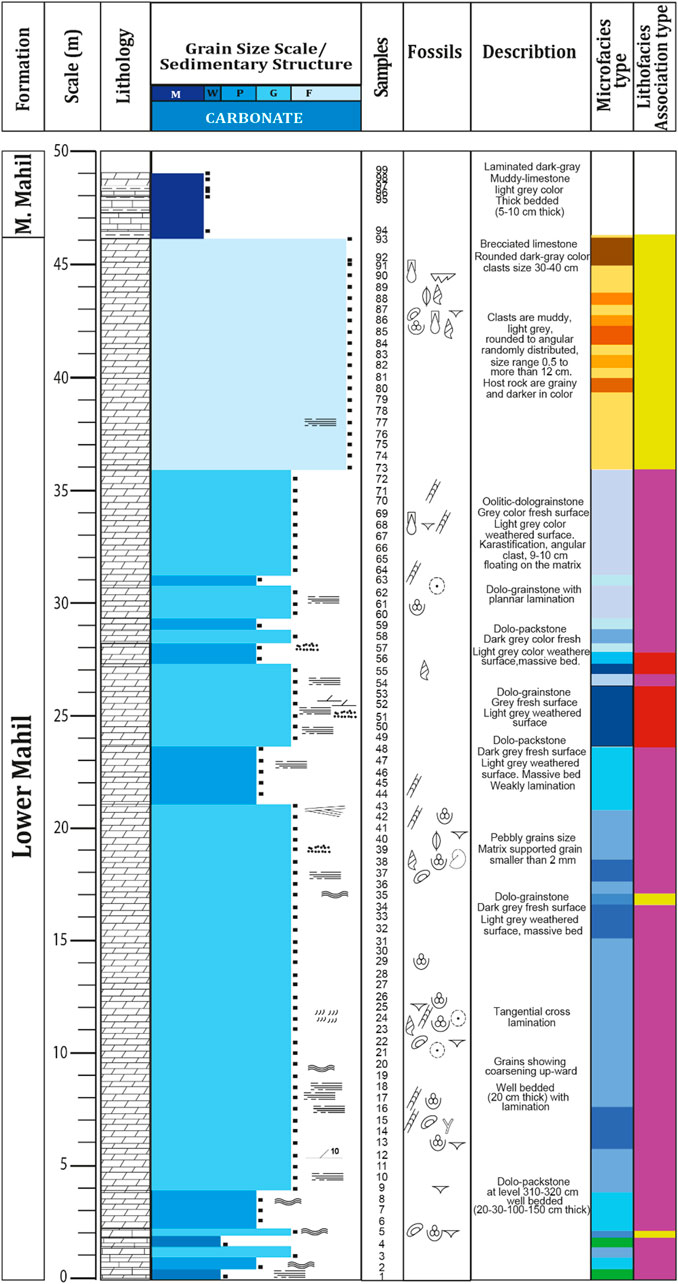
FIGURE 3. Sedimentological log of the Saiq Plateau section of the Lower Mahil KS-1 Formation. The log provides information on the height, lithology, texture, sedimentary features, sample locations, fossils, microfacies, and distribution of lithofacies associations. Refer to the legend provided for further details and explanations [modified from (Al Raqaishi et al., 2023)].
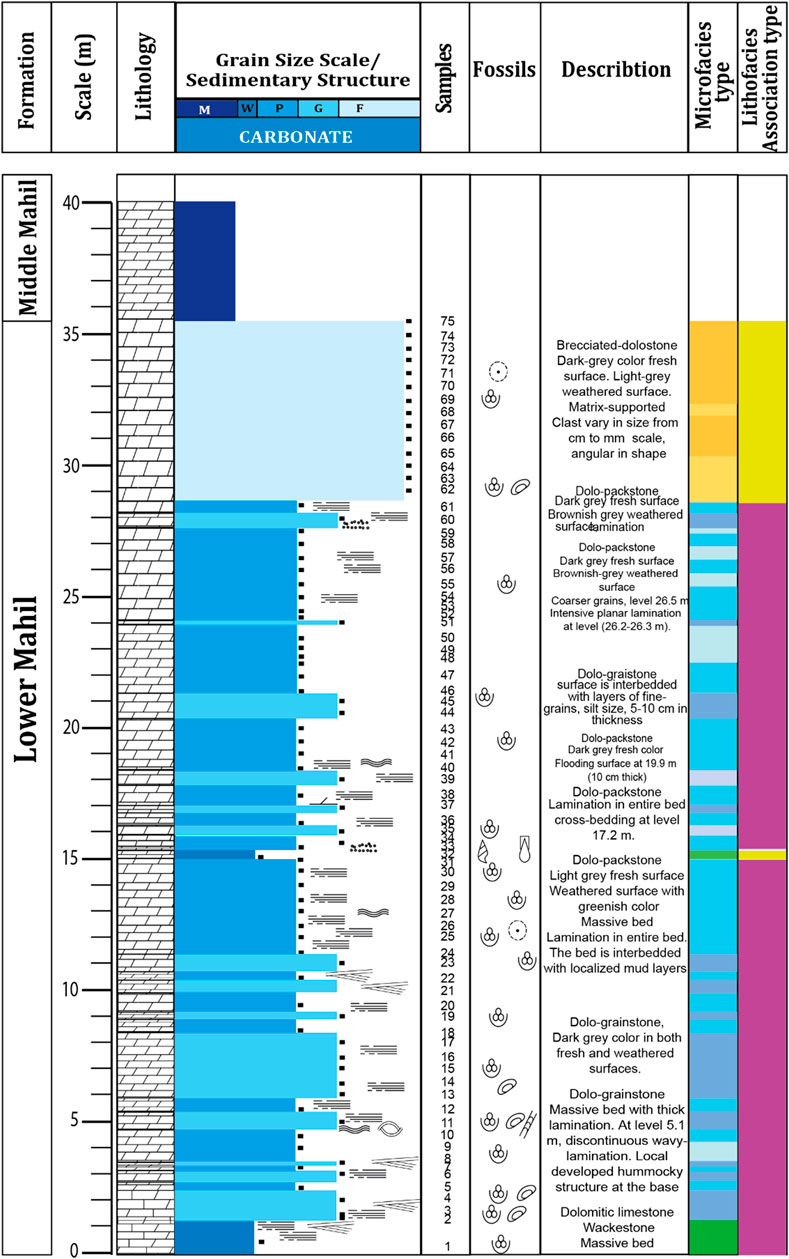
FIGURE 4. Sedimentological log of the Wadi Sahtan section of the Lower Mahil KS-1 Formation. The log provides information on the height, lithology, texture, sedimentary features, sample locations, fossils, microfacies, and distribution of lithofacies associations. Refer to the legend provided for further details and explanations [modified from (Al Raqaishi et al., 2023)].
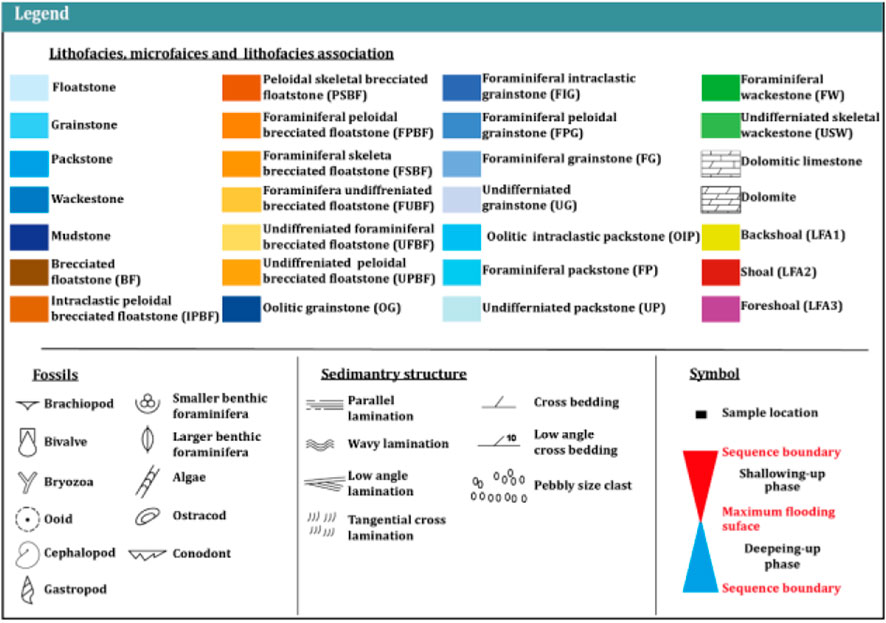
FIGURE 5. Legend for the sedimentological logs of the Saiq Plateau and Wadi Sahtan sections, Lower Mahil KS-1 Formation, Northern Oman [modified from (Al Raqaishi et al., 2023)].
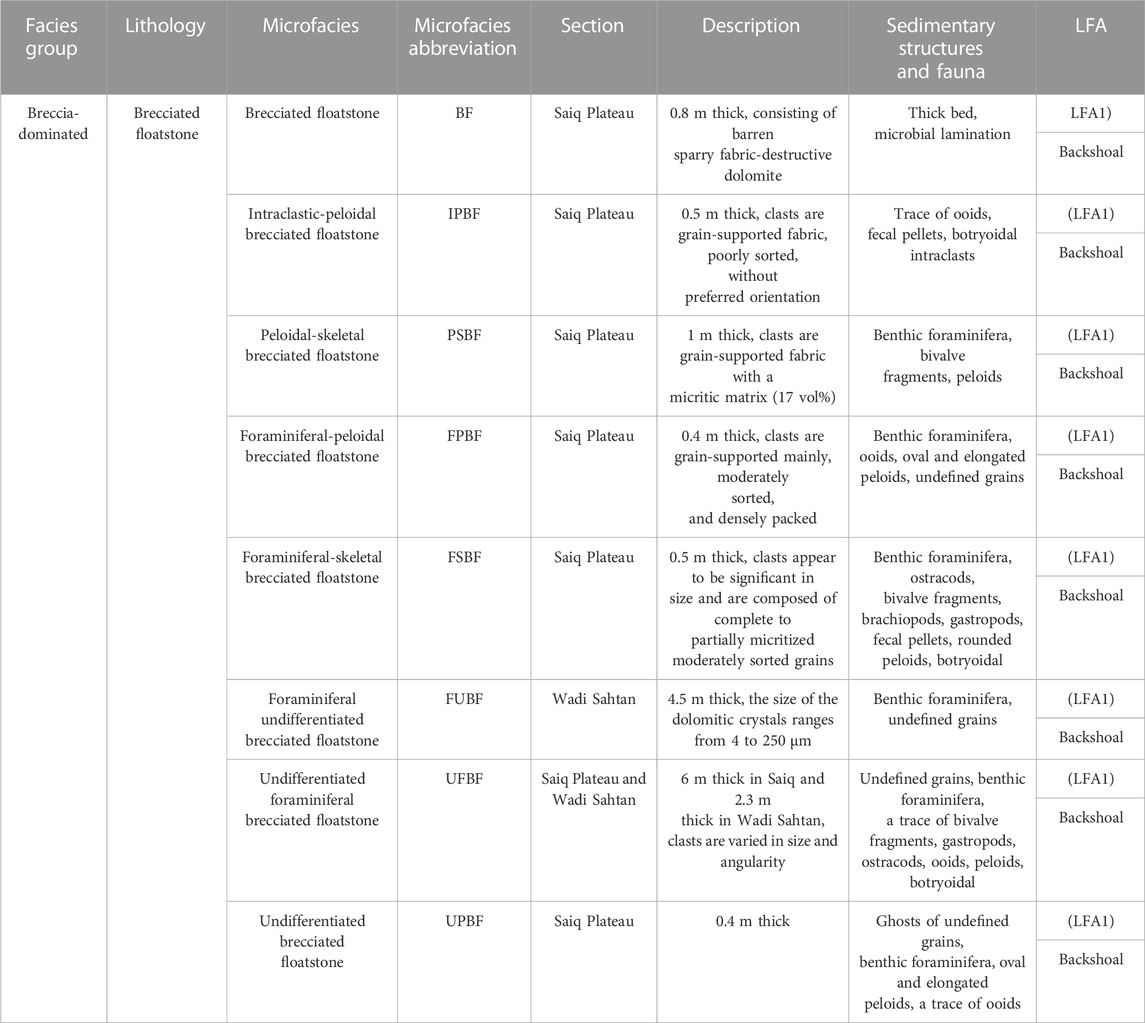
TABLE 1. Summarizes the breccia-dominated lithofacies, microfacies, and their lithofacies association within the Lower Mahil KS-1 Formation in Jabel Akhdar. The information in the table has been modified from the research conducted by (Al Raqaishi et al., 2023).
4.1 Polymictic brecciated floatstones dominated lithofacies
The Upper Lower-Triassic Mahil Formation contains thickly bedded polymictic brecciated floatstones, which comprise eight identified microfacies types, including undifferentiated foraminifera brecciated floatstones and foraminifera undifferentiated brecciated floatstones. These lithofacies consist of various skeletal and non-skeletal grains, with foraminifera being the most predominant, along with observed bivalve and brachiopod fragments (Table 1; Figures 3–6).
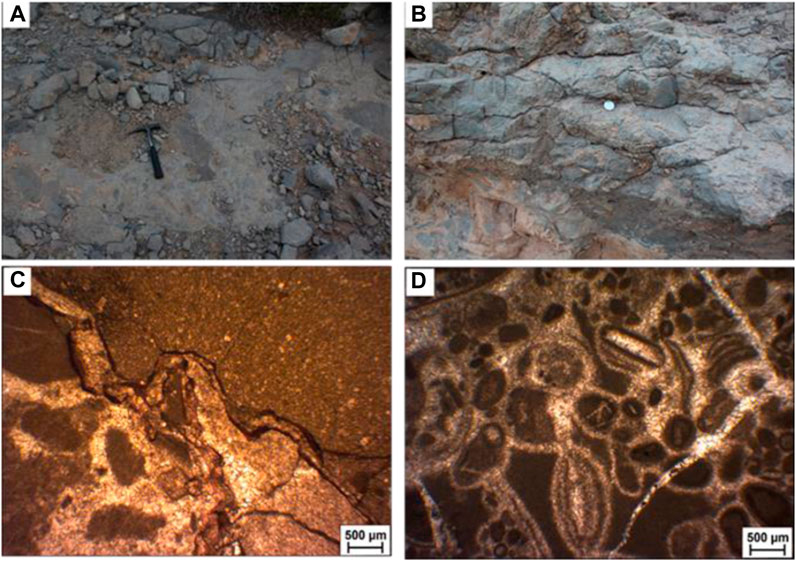
FIGURE 6. Photomicrographs captured under plane-polarized light, focusing on the breccia-dominated microfacies group. The photomicrographs showcase (A) Undifferentiated foraminiferal brecciated floatstone (UFBF) microfacies from the Saiq Plateau section at level 41 m. (B) Foraminiferal skeletal brecciated floatstone (FSBF) microfacies from the Saiq Plateau section at level 42.5 m. (C) Undifferentiated foraminiferal brecciated floatstone (UFBF) microfacies from the Wadi Sahtan section at level 30 m. (D) Foraminiferal undifferentiated brecciated floatstone (FUBF) microfacies from the Wadi Sahtan section at level 33 m.
4.2 Grain-dominated lithofacies
The most dominant lithofacies in both logged sections are grain-dominated, primarily consisting of grainstone and packstone lithologies (Figure 7). Eight microfacies have been identified within these lithofacies, including oolitic packstone/grainstone, foraminiferal packstone/grainstone, and other microfacies types. These microfacies contain small benthic foraminifera, brachiopods, ostracod, bivalves, ooids, peloids, and intraclasts (Table 2).
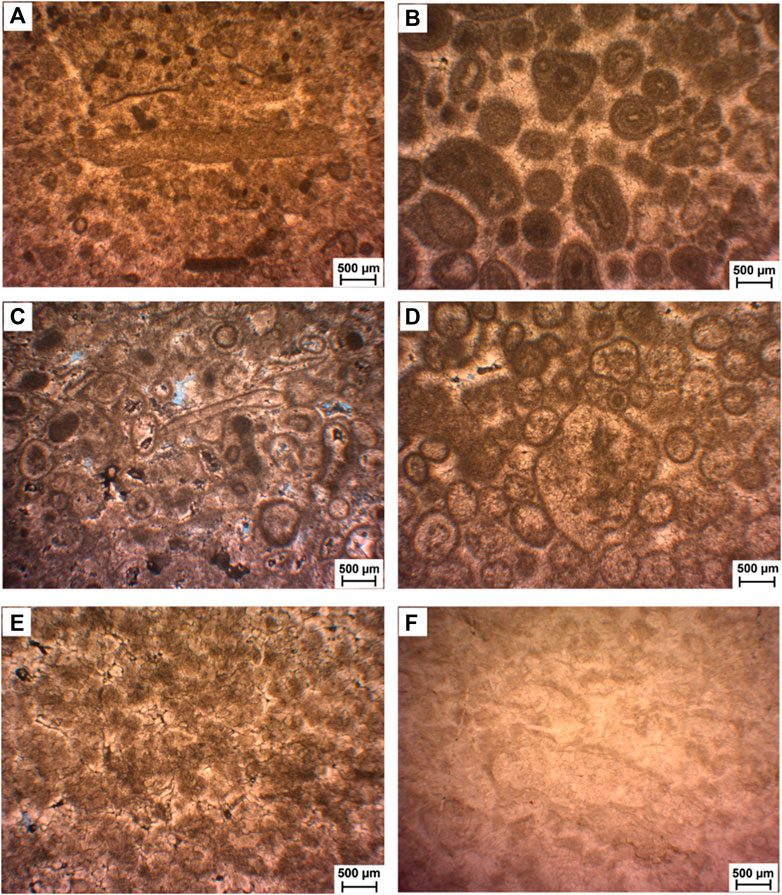
FIGURE 7. Provides a comprehensive overview of the grain-dominated microfacies group through thin section photomicrographs taken under plane-polarized light. In (A), the foraminiferal peloidal grainstone (FPG) microfacies is revealed at a depth of 2 m in the Saiq Plateau section, while (B) displays the foraminiferal intraclastic grainstone (FIG) microfacies at 6 m in the same section. (C,D) Offer a glimpse into the oolitic grainstone (OG) microfacies at depths of 25.5 m and 27 m on the Saiq Plateau. Meanwhile, (E) showcases the undifferentiated grainstone (UG) microfacies at 35.5 m in the Saiq Plateau section, and finally, (F) captures the undifferentiated packstone (UP) microfacies at a depth of 25.5 m in the Wadi Sahtan section.
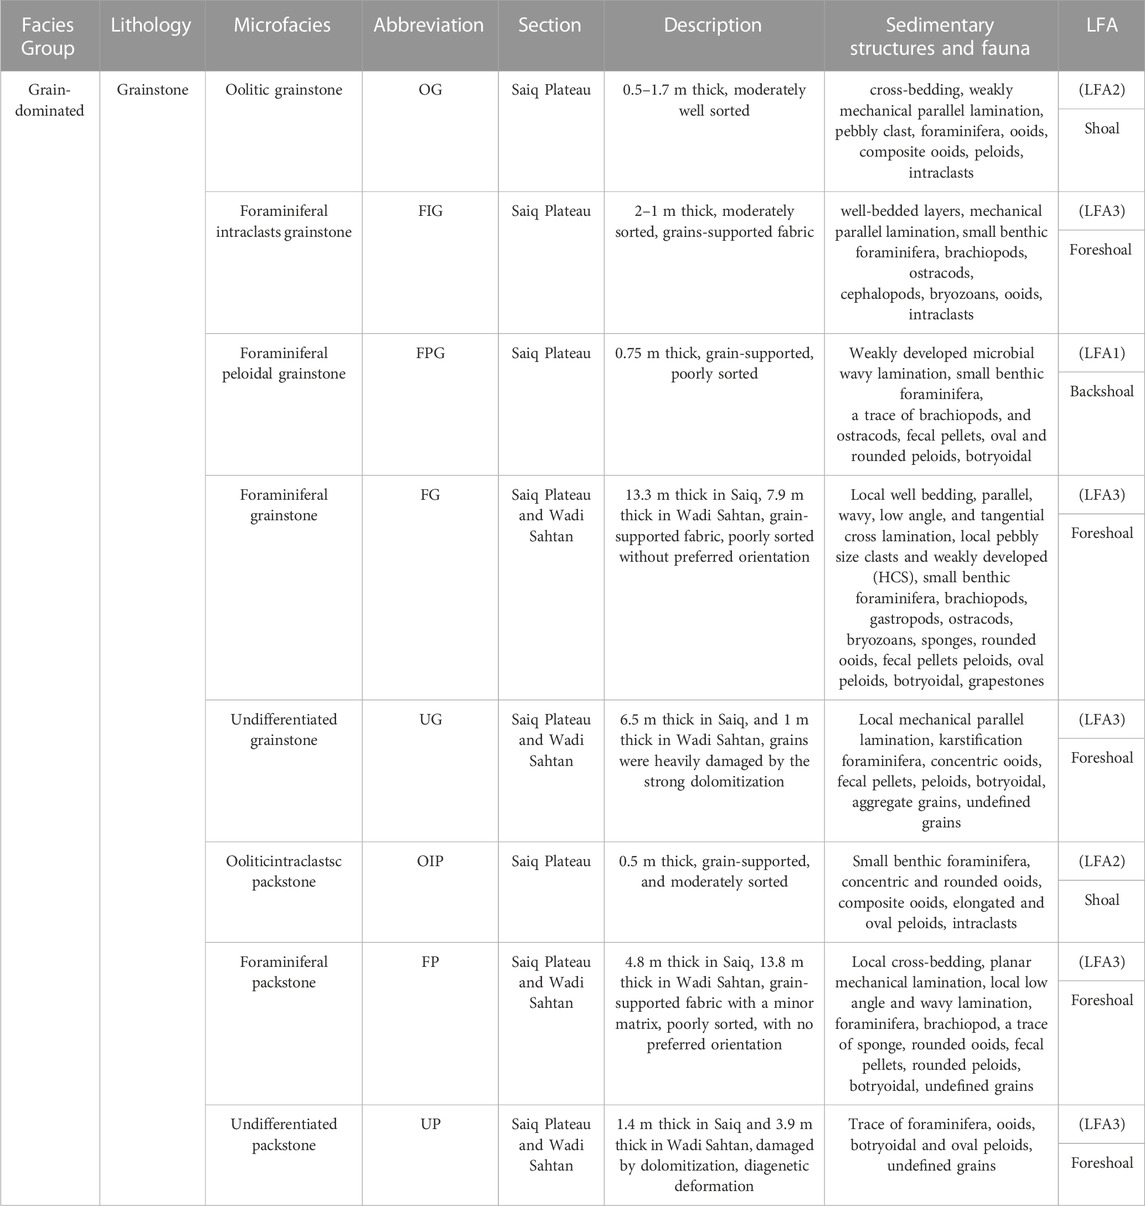
TABLE 2. Presents the grain-dominated lithofacies, microfacies, and their lithofacies association within the Lower Mahil KS-1 Formation in Jabel Akhdar. The data in the table is based on the research conducted by (Al Raqaishi et al., 2023).
4.3 Mud-dominated lithofacies
The least dominant lithofacies in both logged sections are mud-dominated, primarily composed of wackestone. Only two microfacies have been identified: foraminiferal wackestone and undifferentiated skeletal wackestone. These mud-dominated lithofacies are matrix-supported and contain micrite (Figure 8). The skeletal components are varied but mainly consist of small benthic foraminifera (Table 3).
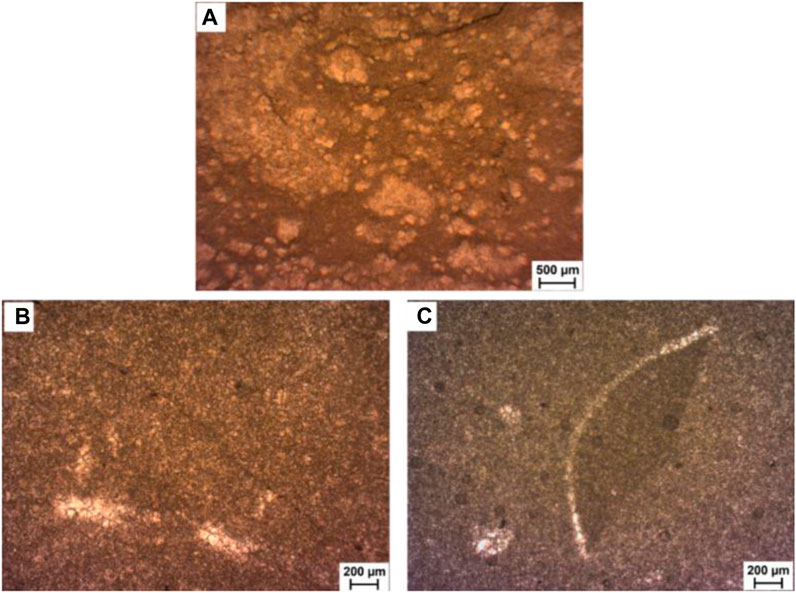
FIGURE 8. Presents thin section photomicrographs under plane-polarized light, illustrating the mud-dominated microfacies group. Subfigure (A) showcases the foraminiferal wackestone (FW) microfacies, specifically from the Saiq Plateau section at a depth of 1.5 m. In subfigure (B), we observe another depiction of the foraminiferal wackestone (FW) microfacies, this time from the Wadi Sahtan section at a depth of 0.5 m. Lastly, subfigure (C) displays the undifferentiated skeletal wackestone (USW) microfacies, captured in the Wadi Sahtan section at a depth of 15.1 m.
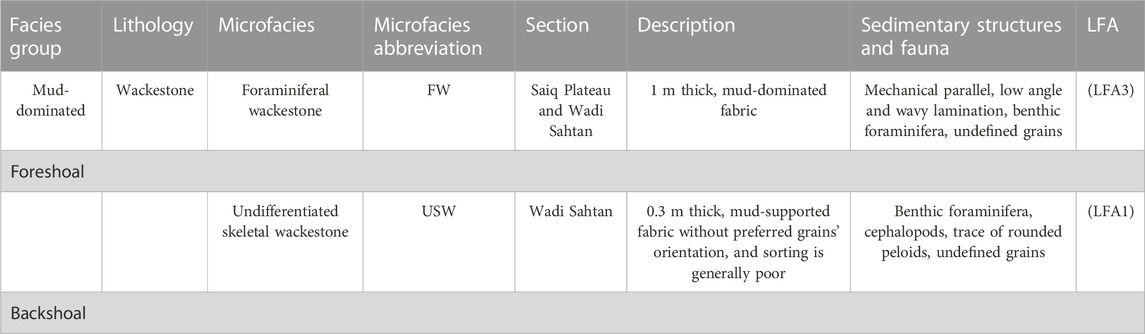
TABLE 3. Presents a concise summary of the mud-dominated lithofacies, microfacies, and their associated lithofacies within the Lower Mahil Formation, which is the equivalent of the Khuff KS-1 formation, as observed in the Jabel Akhdar region.
5 Depositional model
The depositional model of the Lower Mahil Formation depicts a broad epeiric homoclinal carbonate ramp extending from shallow-subtidal to relatively deep-subtidal environments (Figure 9). The microfacies interpretations within this formation are categorized into three primary lithofacies associations, organized in order from proximal to distal according to (Al Raqaishi et al., 2023). These lithofacies association listed below from shallow-subtidal to relatively deep-subtidal environments.
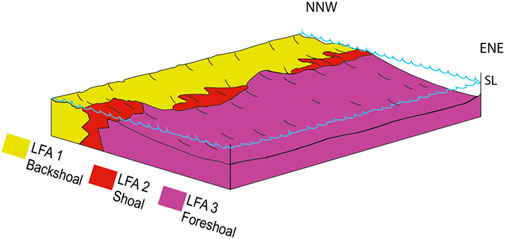
FIGURE 9. Cartoon depicting a 3-D depositional model of the Lower Mahil Formation KS-1 in the Northern Oman Mountains. The model incorporates key features such as sea level (SL) variations.
5.1 Backshoal lithofacies association (LFA1)
The low-energy, shallow subtidal landward side of the shoal’s crest is identifiable by the presence of polymictic breccia floatstone (Figure 10), foraminiferal peloidal grainstones (Figure 7A), and undifferentiated skeletal wackestone (Figure 8C) microfacies. This area is characterized by matrix-supported microfacies, the absence of subaerial exposure features, rare marine biota presence, and weak microbial lamination (Figure 6). The depositional environment suggests limited biological activity and a lack of exposure to air during formation, contributing to the development of specific sedimentary rock types in this geological setting.
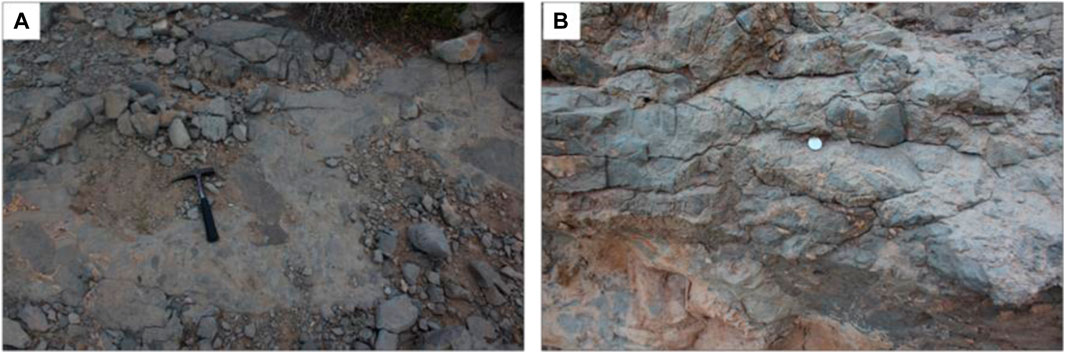
FIGURE 10. Field photographs capturing the breccia floatstone within the backshoal lithofacies association (LFA1) in the upper portion of the (A) Saiq Plateau section and (B) Wadi Sahtan section. The images provide visual evidence of the observed lithofacies.
5.2 Shoal lithofacies association (LFA2)
The weakly developed oolitic shoal was recognized only in the Saiq Plateau, indicating high to moderate energy conditions. This lithofacies association is mainly formed because of the abundance of the well-sorting oolite pack/grainstone and intraclass (Figures 7C–E). Further, it consists of weakly developed crossbedding and well-developed planar lamination (Figure 11).
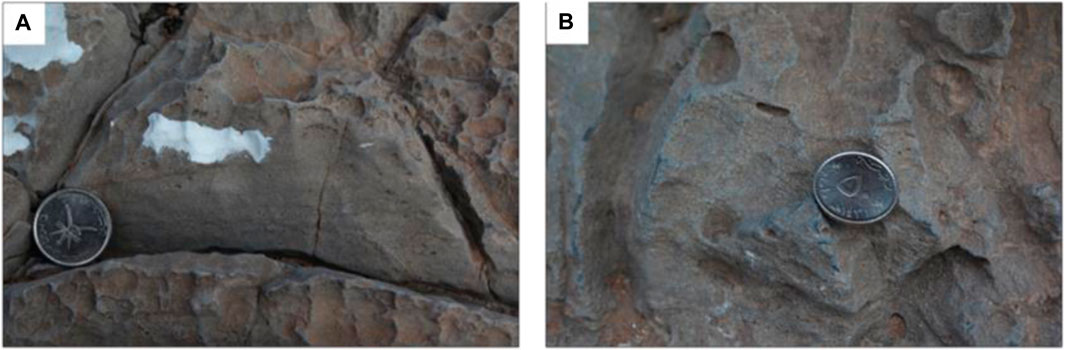
FIGURE 11. Field photographs provide a visual representation of the sedimentary characteristics observed within the shoal lithofacies association (LFA2) in the Saiq Plateau section. Subfigure (A) highlights the presence of local parallel lamination, while subfigure (B) illustrates weakly developed cross-bedding.
5.3 Foreshoal lithofacies association (LFA3)
This LFA is dominant in both studied sections. This association is represented mainly by the foraminiferal packstone to grainstone microfacies abundance and occurrence of the open marine biota such as brachiopods, gastropods, ostracods, bryozoa, and sponges (Figures 7B, F; Figures 8A, B). Furthermore, local hummocky structures and parallel lamination (Figure 12) were observed, which indicate storm waves in the foreshore environment.
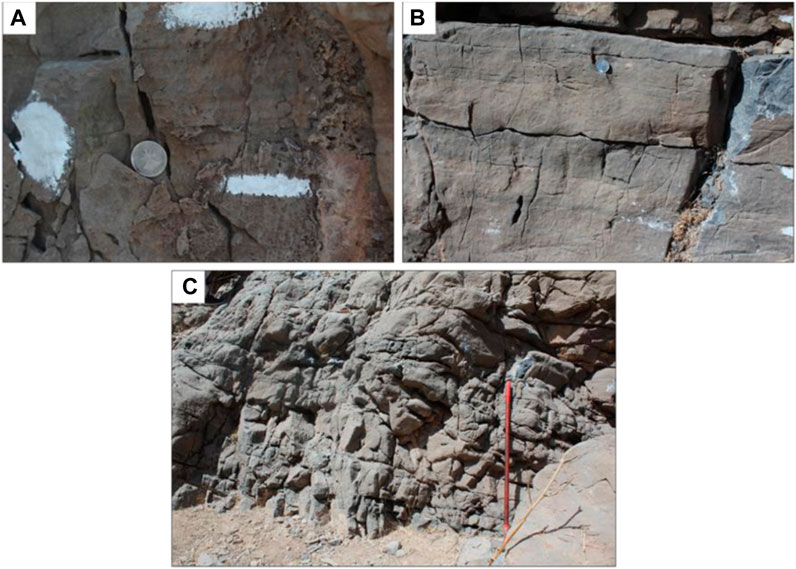
FIGURE 12. Showcases field photographs that visually depict the sedimentary characteristics found within the foreshoal lithofacies association (LFA3) in both the Saiq Plateau and Wadi Sahtan areas. Subfigure (A) reveals local parallel lamination, captured at the Saiq Plateau section at a depth of 8.5 m. Subfigure (B) displays parallel and low angle lamination, observed in the Wadi Sahtan section at a depth of 3.4 m. Lastly, subfigure (C) demonstrates local weakly hummocky structure development, found in the Wadi Sahtan section at a depth of 5 m.
6 Results
6.1 Syntectonic control on Lower Mahil KS-1
The Late Paleozoic-Early Mesozoic series display specific content and layer geometry, including breccias, variations in thickness, and slumps, which offer compelling evidence for the presence of an Early Triassic extensional regime in the hanging wall of an ancient normal fault. Several sealed normal faults are clear indicators of this regime (Figure 13A). To explore the fault-controlled deposits of the Mahil Formation after pre-folding, a comprehensive study was carried out in Wadi Sahtan. The researchers aimed to restore the bedding plane to its original horizontal orientation, which revealed significant sites affected by the faulting. Upon rotation to their original positions, the results demonstrate that these faults were normal before the compressional tilting (Figure 13B). Consequently, the findings from this pre-deformation analysis in the Lower Triassic fault unequivocally indicate normal faulting, thus confirming the presence of an extensional (normal faulting) tectonic regime during that time. Moreover, normal faulting gives rise to growth strata filled with syntectonic sequences linked to typical syntectonic breccias and soft-sediment sequences associated with the ancient normal faulting activity. These normal faults are observed in the Saiq Plateau, particularly concerning Lower Triassic growth strata.
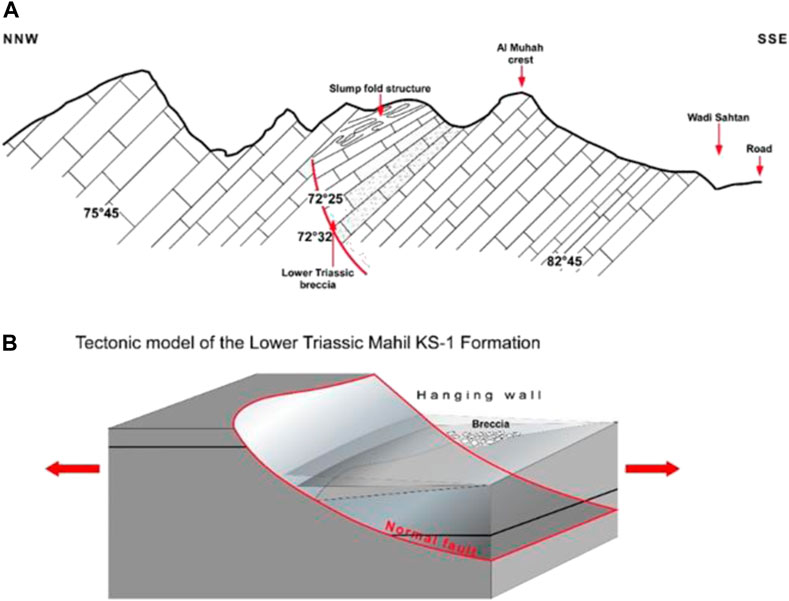
FIGURE 13. (A) The NNW trending field geologic cross-section across the Wadi Sahtan shows the sealed normal fault associated with growth strata filled by syntectonic sequences linked to typical syntectonic breccias and soft-sediment. (B) Tectonic model explains the extensional tectonic activity during the deposit of the Lower Triassic Mahil Formation.
6.2 Carbon and oxygen isotopes
The Bulk-rock carbon and oxygen isotopic values of the Lower Mahil carbonates from Saiq Plateau and Wadi Sahtan are plotted against thickness levels in the measured section, lithology, and microfacies (Figures 14, 15). The δ13C values of the Lower Mahil Formation in the Saiq Plateau section range from +1.5‰ to +3.6‰ VPDB (average 2.1‰). The isotopic trends plotted against height and lithologies in the sedimentological log (Figure 14) show marked variations: the δ13C values show minimum points as well as the highest point at the middle of the section. The δ13C values start with a slightly decreased trend from 2.4‰ to 1.9‰. Then they increase to a distinct peak of 3.1‰ at 10 m before presenting another increase to 3.3‰ at 14.5 m. After a new negative shift at 19 m, the δ13C curve increases until the maximum value of 3.6‰ at 22.5 m. Then the δ13C drops to 1.7‰ at 26.5 m before increasing to 2.5‰ at 31.5 m. Then, the curve exhibits relatively low values of δ13C, and the trend remains almost steady as the δ13C is maintained between 1.5‰ and 2.8‰ to the end of the section.
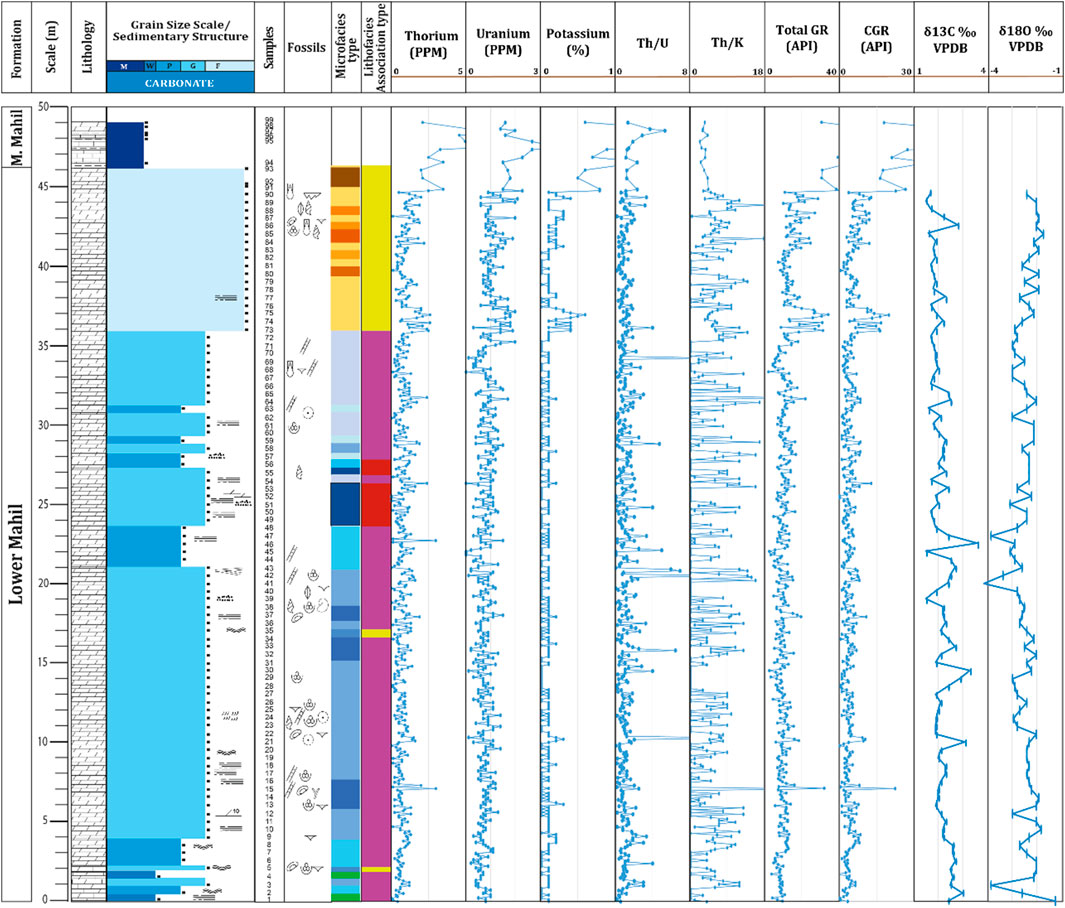
FIGURE 14. Spectral gamma-ray, total gamma-ray, carbon isotope, and oxygen isotope curves plotted against the height, microfacies, and lithofacies associations in the Saiq Plateau section. The figure provides a comprehensive view of the variations in these parameters and their correlations with different microfacies and lithofacies associations in the studied section. This figure complements the legend provided in Figure 5, offering a comprehensive overview of the variations in these parameters and their relationships with different microfacies and lithofacies associations in the studied Saiq Plateau section.
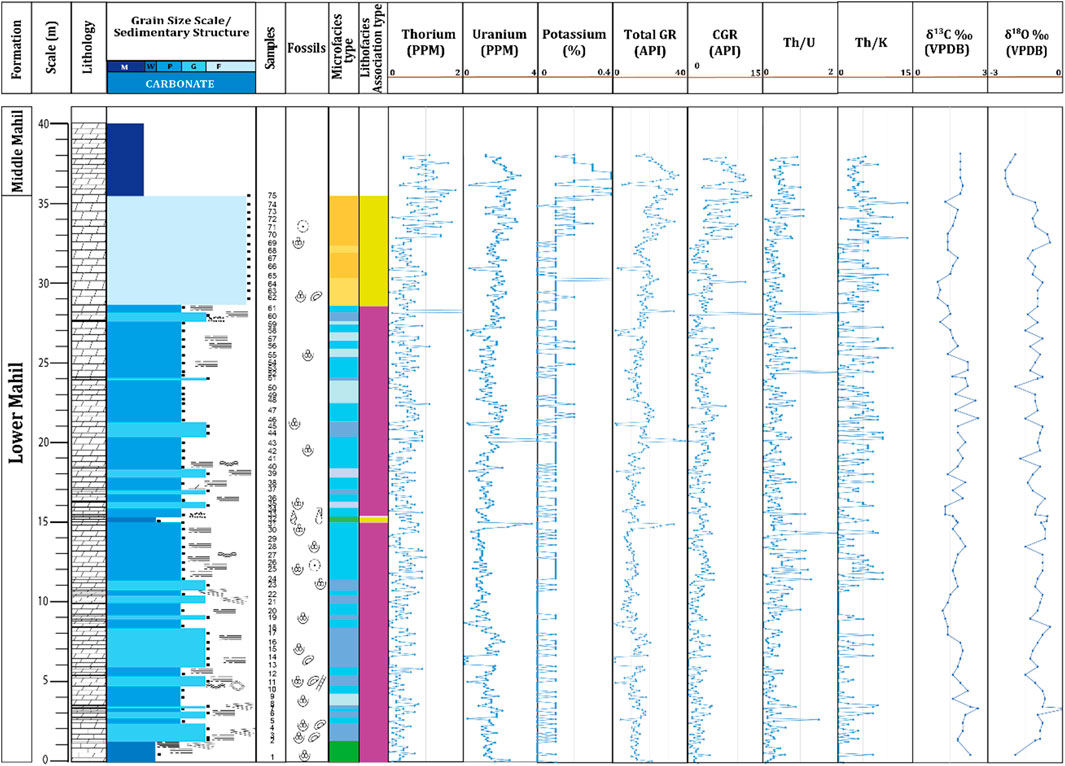
FIGURE 15. Spectral gamma-ray, total gamma-ray, carbon isotope, and oxygen isotope curves plotted against the height, microfacies, and lithofacies associations in the Wadi Sahtan section. This figure complements the legend provided in Figure 5, offering a comprehensive overview of the variations in these parameters and their relationships with different microfacies and lithofacies associations in the studied Wadi Sahtan section.
δ13C values slightly drop from 2.3‰ to 1.2‰ at 0.5–9.5 m, although a spike of the maximum values occurs at 3.5 m. In the following, a rise from 1.4‰ to 2.6‰ before a drop to 1.1‰ are revealed in the curve. Then the trend shows a slight decrease in the δ13C values until a remarkable negative carbon isotope excursion at the end of the section.
The δ18O values are lower than that of δ13C values in both sections. In the Saiq Plateau section, the δ18O range from −4.2‰ to −1.2‰ VPDB (average −2.5‰). All the microfacies generally maintained similar variations in their δ18O average values, ranging from −2.8‰ to −2.2‰. In comparison, the foraminiferal packstone and foraminiferal grainstone show the most depleted values (average −2.8‰ for the first one and −2.7‰ for the last one). When δ18O plotted relative to the height and lithofacies (Figure 14), the most notable feature is that the section begins with the maximum oxygen isotope value of −1.2‰ VPDB, localized in the lower part of the Lower Mahil. A sharp fall in δ18O values from −1.2‰ to −3.9‰ occurred at the height of 1 m and pronounced negative oxygen isotope excursion. After a positive oxygen isotope shift, the relatively steady fluctuation is interrupted by a spiky negative carbon isotope shift to the minimum value of −4.2‰. In the middle part of the section, the δ18O values exhibit a temporary increase and a sudden drop to −3.9‰ is observed before rising again to the second peak of −2.5‰. Afterward, the δ18O values return to −3.0‰ and display a negative shift. Finally, the trend shows a positive excursion to the end of the section. The variation of δ18O is less evident and less consistent than that of δ13C. However, in some intervals approximately correlated with δ13C but not generally correlated, few similar evolutions can be observed with a positive trend at 14.5 and 31.5 m, a negative one at 38 m, and a slightly decreasing trend from 14.5 to 19 m.
6.3 Gamma-ray data
Figures 14, 15 are displayed at 49 and 40 m sections to overview the spectral gamma-ray signatures within the outcrops, including the identified lithologies and the twenty-four microfacies. Spectral gamma-ray data are arranged in Figures 13, 14, including the complete gamma-ray logs, each spectral curve (K, U, and Th), total gamma-ray (total GR), computed gamma-ray (CGR), Th/U ratio, and Th/K ratio for each section.
6.3.1 Potassium (K)
Potassium values are the lowest and most negligible among all the other spectral and total gamma-ray measurements within both sections. In Saiq Plateau, the K span is 0%–0.8% (average of 0.1%), and the most repetitive value is 0.1%. Potassium values in the Wadi Sahtan section range from 0% to 0.7% (0.1% is the average), and 0.1% is the most frequent value. Both section trends against height display almost the same pattern. The K curve in Saiq Plateau has just started and is continuous with values fluctuating between 0% and 1%, slight 0.2% and 0.3% peaks are observed. The trend exhibits an increase to the end of the section. Wadi Sahtan section also begins and keeps the subtle trend of values between 0% and 1%, which is disturbed by the maximum peak at 30.2 m before returning to its subtle condition. At 32.6 m, the trend displays a positive excretion to the end of the section.
6.3.2 Uranium (U)
The Saiq Plateau has uranium values ranging from 0 to 2.3 ppm. The highest reading is again observed in the upper section at 44.7 m within undifferentiated foraminiferal brecciated floatstone microfacies (Figures 5, 13 for legend). Although concentrated more in the foraminiferal packstone, the lowest value is within different microfacies. The U average is 0.8 ppm, and 0.9 ppm is the most repeated value. The Wadi Sahtan section shows uranium range from 0 to 4.4 ppm. A distinctive peak is noticed at the height of 20.1 m, reflecting the maximum point within the foraminiferal packstone microfacies (Figure 15). The lowest U values are observed in the lower part of the section, mainly related to the foraminiferal grainstone microfacies. The average uranium value is 1.4 ppm, and the most frequent value is 1.2 ppm. The U versus height in both sections shows a similar overall trend. Both begin with a subtle range; then an irregularly decreasing trend is developed. After that, a positive shift was noticed before it slightly dropped. Forward, the trends increased again upward to the end of the sections. Some disturbing increasing and decreasing spikes are detected along both sections (Figures 14, 15).
6.3.3 Thorium (Th)
The thorium values within all microfacies in the Saiq Plateau section vary, spanning 0–3.5 ppm (average 0.8 ppm. The maximum reading of 3.5 ppm is observed within the undifferentiated foraminiferal brecciated floatstone microfacies at 44.8 m, briefly above the U maximum peak, while the minimum value is 0, which occurs in various microfacies types. In the Wadi Sahtan section, thorium values display a more comprehensive range than the Saiq section; it is between 0 and 5 ppm, although the Wadi Sahtan section shows a lower thorium value in general as the average is 0.4 ppm, and the most frequent value is 0.3 ppm The Saiq Plateau Th trend continued steadily with some positive spikes until it shifted positively and exhibited a minor increase in their values. The Wadi Sahtan shows oscillation pulses before the trend increases to the end of the section.
6.3.4 Total gamma-ray (total GR)
The total gamma-ray of the Saiq Plateau section ranges between 2 API and 41.2 API with an average of 11.3 API. The undifferentiated foraminiferal brecciated floatstone shows the highest gamma-ray measurements within the Lower Mahil Formation. The lowest total gamma-ray (API) measurements are observed within undifferentiated grainstone at 33.3 m (Figure 14). However, the total gamma-ray in Wadi Sahtan ranges between 0 and 38.8 API with an average of 13.8 API. The most repetitive values are 10, 12, and 15.2 API. The maximum value observed in the foraminiferal packstone microfacies, at level 20.1 m, coincides with the U peak. The lowest total gamma-ray values within foraminiferal grainstone link to the U decreasing spikes (Figure 15). Overall, the total gamma-ray trends versus height are similar to the uranium trends within both sections. The Saiq Plateau section starts with a steady trend with a few increasing spikes. Then the trend exhibits a decreasing deviation before it increases at levels 21.8–22 m.
6.3.5 Computed gamma-ray (CGR)
The computed gamma-ray within the Saiq Plateau fluctuates from −2 API to 26.8 API (average 4 API), and the most frequent value is 3.6 API. The undifferentiated foraminiferal brecciated floatstone shows the maximum value, and the foraminifera wackestone, located in the lower portion of the section, displays the minimum CGR value (Figure 14). A similar observation was made for the Wadi Sahtan section. The CGR ranges from 0 to 20 API with an average of 2.8 API, and the more frequent value that appears is 2.8 AP. The CGR curves are comparable to the total GR curves within the sections, despite the CGR values being much lower than the total GR values. The Saiq Plateau curve started with a steady trend with increasing and decreasing fluctuations and a notable sharp increasing spike of 22.6 API; at level 7.1 m. Then the trend shows a minor decrease before it increases to the end. The Wadi Sahtan curve also starts with a subtle trend disturbed by increasing and decreasing minor shifts, and finally, it displays an apparent increasing deviation. The clear difference between CGR and GR curves is that the sharp peaks in the gamma-ray curve are not observed within the CGR curve except the peak at level 28.2 m (Figure 15).
6.3.6 Th/U ratio
Saiq Plateau manifests a Th/U ratio ranging from 0 to 15, revealing an average of 1.6 with a most frequent value equal to 0.8. The maximum point is associated with the foraminifera grainstone microfacies and appears at 10.3 m. At the same time, the minimum value is occurred within one microfacies. The Th/U ratio in Wadi Sahtan signifies much lower values than the Saiq Plateau. The value span is 0–3.1 (average and mode are 0.3). The foraminiferal grainstone reveals the maximum point, while the minimum one frequently repeats through different microfacies. The most common feature between the Th/U ratio curves is that both show a steady trend and convey three notable sharp positive spikes. In the Saiq Plateau curve, the sharpest ones are with values of 15, 14, and 10 at 10.3, 20.5, and 34.2 m, respectively, even though the curve displays other increasing peaks but are more attenuated (Figure 13). The sharpest peaks in the Wadi Sahtan curve are 2, 2.3, 3.1 at 14.4, 24.5, and 28.2 m, respectively (Figure 15).
6.3.7 Th/K ratio
The Th/K ratio in the Saiq Plateau section ranges from 0 to 30 (average 6.9). The highest point at 7.1 m is related to foraminiferal intraclastic grainstone, whereas the minimum value is associated with various microfacies frequently repeated within different heights. The Th/K ratio in Wadi Sahtan reveals a 0 to 14 values range (average 4.4). The maximum values related to foraminifera undifferentiated brecciated floatstone microfacies were observed at 32.9 and 35.1 m. On the other hand, the zero value is often repeated within foraminifera packstone, undifferentiated packstone, and foraminifera grainstone microfacies. Both sections’ curves illustrate very hesitant and high oscillation trends (Figures 14, 15).
6.4 Sequence stratigraphy
The Lower Mahil Formation (KS-1 Khuff-Equivalent) is categorized based on age, representing a one-third order sequence (third). This third order sequence has distinct phases of sea level transgression and regression. Further subdivisions are made within this third order sequence to identify five fourth-order sequences (fourth) based on factors such as facies, isotope, and gamma-ray analysis. The sequence stratigraphy in this context identifies five fourth-order sequences, namely, 4S1, 4S2, 4S3, 4S4, and one incomplete sequence, 4S5. Furthermore, each of these five fourth-order sequences can be further divided into fifth-order cycles.
Sequence 1 (S1): is located in the lower portion of the Lower Mahil Formation, with its lower boundary at the base of the Mahil KS-1 Formation. The transgressive system tract (TST) of S1 is distinguished by significant increases in carbon isotope, uranium, and total gamma-ray values, indicating an upward trend. Foraminifera wackestone, foraminifera packstone, and foraminifera grainstone microfacies characterize this TST. The maximum flooding surface is identified within a higher positive excursion, specifically within the foraminiferal packstone microfacies. Moving higher in the sequence, the high system tract (HST) of S1 comprises foraminiferal packstone, foraminiferal grainstone, and undifferentiated packstone microfacies. The overall trend within the HST shows a decreasing shift toward the sequence boundary (SB). This implies a gradual shallowing of the environment leading to the eventual termination of the sequence. The interplay of various microfacies and the changes in geochemical values provide valuable insights into the sedimentary processes and depositional history during the formation of Sequence 1 within the Lower Mahil Formation.
Sequence 2 (S2) is characterized by distinct sequence boundaries, which are identified by the most decreasing shifts in the U (uranium), GRtotal (total gamma-ray), and C isotope profiles. Various microfacies were developed within the transgressive system tract (TST) of S2, with foraminiferal grainstone being the most common. Some microfacies pinch out towards other sections, such as foraminiferal intraclastic grainstone and foraminiferal grainstone, which pinch towards the Wadi Sahtan logged section. Additionally, the foraminiferal packstone pinches out towards the Saiq Plateau logged section. The maximum flooding surface is found within the highest positive deviation of the trends passing through the foraminiferal grainstone and undifferentiated grainstone microfacies. During the high system tract (HST), the foraminiferal packstone further pinches towards the Saiq Plateau, while the foraminiferal grainstone remains the dominant microfacies. Notably, Sequence 2 exhibits a thinning trend towards the Wadi Sahtan logged section, indicating a reduction in sediment accumulation in that direction. Identifying different microfacies, pinch-outs, and variations in sediment thickness provide valuable information about the depositional environment and processes that shaped Sequence 2 in the studied area within the Lower Mahil Formation.
Sequence 3 (S3) is defined by its lower and upper boundaries, which are identified based on the lowest points in the selected log profiles (Figure 16). The transgressive system tract (TST) of S3 exhibits a variety of microfacies, with the foraminiferal grainstone being the most predominant. However, some microfacies pinch out towards the Wadi Sahtan logged section, including the foraminiferal intraclastic grainstone, foraminiferal peloidal grainstone, and foraminiferal packstone. Simultaneously, the foraminiferal packstone is prevalent in the Wadi Sahtan section but pinches towards the Saiq Plateau section. The maximum flooding surface (MFS) of S3 coincides with the MFZ (Maximum Flooding Zone) of the third-order sequence, comprising foraminiferal packstone microfacies deposited in the deepest side of the studied area, likely in a foreshore setting. During the high system tract (HST), the foraminiferal packstone and oolitic grainstone are prominent microfacies, and both pinch out towards the Wadi Sahtan section. In contrast, the foraminiferal packstone dominates, and the undifferentiated packstone pinches towards the Saiq Plateau section. The sequence is capped by the sequence boundary (SB), indicated by decreasing trend on the selected profiles. Remarkably, Sequence 3 stands out as the thickest sequence within the studied area, indicating a considerable amount of sediment accumulation during its formation. The diverse microfacies, pinch-outs, and changes in sediment thickness provide valuable insights into the complex depositional processes and environmental changes that influenced the development of Sequence 3 within the Lower Mahil Formation.
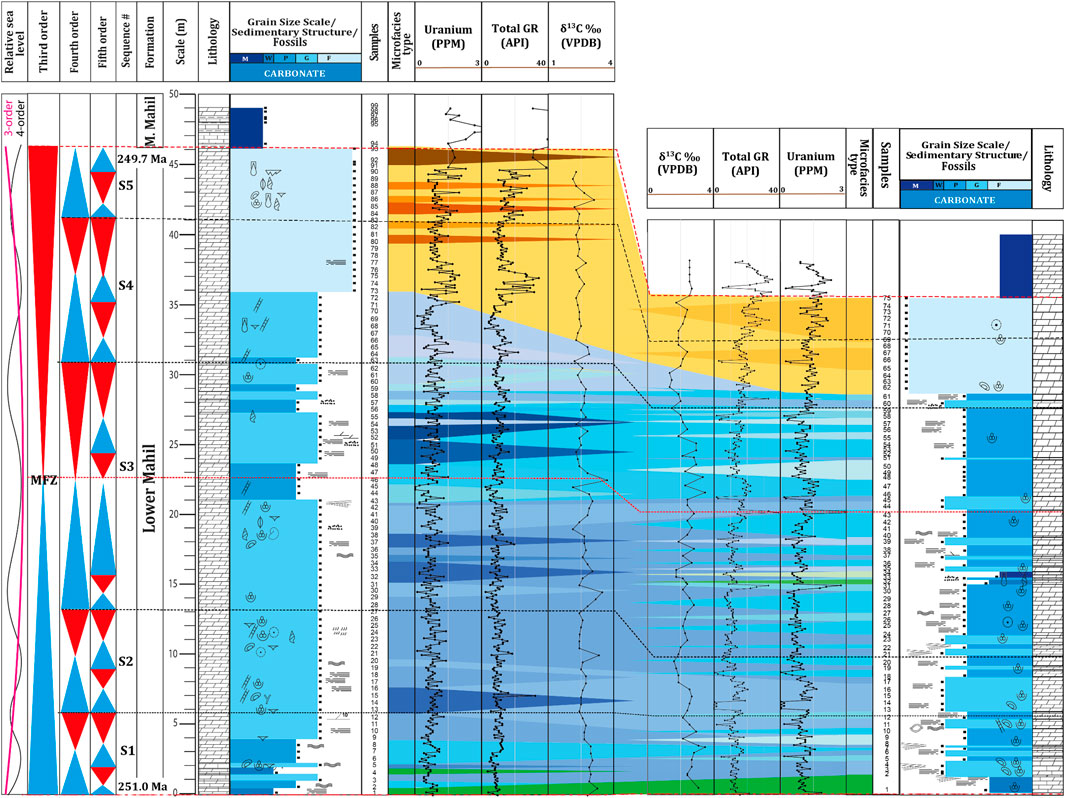
FIGURE 16. Chemostratigraphy correlation between the Saiq Plateau and Wadi Sahtan sections for the Lower Mahil Formation in Northern Oman. The correlation is based on the carbon isotope, uranium, and total gamma-ray profiles. For further details and explanations, refer to the legend provided in Figure 5. The figure provides valuable insights into the chemical variations and their correlation between the two studied sections.
Sequence 4 (S4) commences at the sequence boundary (SB) where Sequence 3 ends. The presence of undifferentiated grainstone, undifferentiated packstone, and undifferentiated foraminiferal brecciated floatstone microfacies characterizes the transgressive system tract (TST) of S4. The deposition of undifferentiated foraminiferal and foraminiferal undifferentiated brecciated floatstone microfacies marks the maximum flooding surface (MFS). During the high system tract (HST) phase of S4, the microfacies assemblage includes undifferentiated foraminiferal, intraclastic peloidal, undifferentiated peloidal, and foraminiferal undifferentiated brecciated floatstone. These microfacies suggest specific depositional environments and sedimentary processes during the HST.
The termination of Sequence 4 is marked by another sequence boundary (SB) located on top of the undifferentiated peloidal and undifferentiated foraminiferal brecciated floatstone microfacies. This sequence boundary indicates a change in depositional conditions, potentially leading to a subsequent depositional sequence in the geological record. Various microfacies and their changes within Sequence 4 provide valuable information about the sedimentary processes and environmental dynamics during its formation within the Lower Mahil Formation. Understanding each sequence’s distinct characteristics helps interpret the studied area’s geological history and paleoenvironmental conditions.
Sequence 5 (S5) represents the last fourth-order sequence in the studied area, but it is incomplete as it comprises only the transgressive system tract (TST). The lower boundary of S5 coincides with the termination of Sequence 4 (S4). The TST of S5 contains various microfacies, with the undifferentiated foraminiferal brecciated floatstone being the most common one. Several microfacies, including peloidal skeletal, foraminiferal skeletal, foraminiferal peloidal, and brecciated floatstone, pinch out towards the Wadi Sahtan section during the TST. Conversely, the foraminiferal undifferentiated brecciated floatstone microfacies pinch out towards the Saiq Plateau section. These variations in microfacies distributions suggest changes in depositional conditions and environmental settings during the TST of Sequence 5.
As Sequence 5 is incomplete and consists only of the TST, it ends in both studied sections with the termination of the brecciated floatstone microfacies. The absence of higher-order system tracts (HST) and the termination of the sequence with the brecciated floatstone suggest a potentially rapid depositional event or environmental change that led to the incomplete formation of this sequence in the Lower Mahil Formation. Studying the characteristics and termination of Sequence 5 provides valuable insights into the sedimentary processes and paleoenvironmental conditions during its formation. It contributes to a comprehensive understanding of the geological history of the studied area.
7 Discussion
7.1 Syn-rift tethyan passive margin geometry
The Middle Permian to Early Triassic period in northern Oman witnessed the opening of the Neo-Tethys Ocean, leading to a significant syn-to post-rift phase (Lee, 1990; Robertson et al., 1990; Pillevuit, 1993; Wender et al., 1998; Alsharhan, 2006; Koehrer et al., 2010; Koehrer et al., 2011; Bendias et al., 2013; Peyravi et al., 2015). Consequently, the passive continental margin of the newly formed Neo-Tethys Ocean experienced the deposition of well-bedded, widespread shallow-water carbonate deposits known as the Khuff Formation (Al-Jallal and Ibrahim, 1991; Al-Aswad, 1997; Maurer et al., 2009; Koehrer et al., 2010; Fontana et al., 2013; Beckert et al., 2015). The presence of abundant breccias at the top of the sections, along with variations in thickness and slumps, provides evidence for the Early Triassic extensional regime in the hanging wall of an ancient normal fault (Figures 13A, B). By restoring the bedding plane to its original horizontal orientation (Gharbi et al., 2022), Mahil Formation’s fault-controlled deposits was observed after pre-folding. This extensional phase occurred concurrently with the rifting in the Arabian plate in the north and the rapid subsidence in the passive margin basin of the Neo-Tethys in the south (Glennie, 2000; Sharland et al., 2001). The interpreted tilted block geometry accounts for the significant Lower Triassic thickening variation, likely associated with substantial volcanic activity (Sharland et al., 2001; Chauvet, 2007; Jabir and Ali, 2023).
7.2 Stable carbon and oxygen isotopes
Isotopic values in the Saiq Plateau and Wadi Sahtan sections are primarily controlled by fluctuations in global seawater geochemistry and diagenesis [80, 81]. The δ13C shows little variation between the two sections, with average values of 2.1‰ for Saiq Plateau and 1.7‰ for Wadi Sahtan, increasing upwards. Lower Mahil KS-1 Formation δ13C values are relatively low, as expected from the Triassic samples (Baud et al., 1996). This depletion is possibly linked to diagenetic activities and the Permian-Triassic boundary mass extinction (Peyravi et al., 2016). The drop in δ13C values indicates a shift in the carbon cycle from organic carbon (reduced phase) in Permian time to dissolved carbonate (oxidized phase) in Triassic time (Gruszczynski et al., 1989; Magaritz and Holser, 1991; Morante, 1996; Horacek et al., 2007a). Enrichment of δ13C could result from local variations in salinity, circulation, and productivity (Grossman et al., 1993; Moustafa et al., 2016). Instead, higher δ13C values may be attributed to aragonite-rich sediments, which have relatively positive δ13C values compared to calcitic sediments (Weber and Schmalz, 1968; Swart et al., 2009; Moustafa et al., 2016). Local minima in δ13C may indicate intervals of subaerial erosion and oxidation (Magaritz and Holser, 1991; Atudorei, 1999; Swart and Kennedy, 2012). The δ13C curves are associated with rising relative sea levels, while negative shifts indicate falling relative sea levels (Immenhauser et al., 2003; Swart and Eberli, 2005; Fanton and Holmden, 2007). The δ13C curves are associated with rising sea levels, while negative shifts indicate falling sea levels (Immenhauser et al., 2003; Swart and Eberli, 2005; Fanton and Holmden, 2007).
Diagenesis significantly affects δ18O values, with low δ18O values possibly resulting from subaerial exposure and interaction with meteoric waters, reducing salinity [(Allan and Matthews, 1990; Grossman et al., 1993; Swart and Kennedy, 2012]. High-temperature water can also shift δ18O values towards negative values (Allan and Richard K, 1990; Popp et al., 1986; Grossman et al., 1993; Grossman et al., 2008). Chemostratigraphic correlation in this study primarily relies on carbon (δ13C) data rather than oxygen (δ18O) to minimize diagenesis-related errors (Figure 16).
7.3 Spectral and total gamma-ray
The interpretation of potassium (K), thorium (Th), and computed gamma-ray logs in carbonate sections reveals relatively low K and Th values in the Saiq and Wadi Sahtan sections, indicating the negligibility of K and Th’s insolubility in carbonates (Glover, 2000; Omidpour et al., 2021). The Th/U ratio suggests oxidizing conditions during regression phases or near sequence boundaries, while the Th/K ratio indicates sudden depositional changes and potential diagenetic alterations (Serra, 1984; Doveton, 1991; Glover, 2000). In both sections, K values are nearly zero due to the absence of evaporative conditions in the Lower Mahil Formation (Al Raqaishi et al., 2023).
The Saiq Plateau section shows some local K and Th peaks within the backshoal lithofacies association, attributed to unobserved features or textures resulting from dolomitization (Figure 14). Additionally, the Th/U ratio confirms intervals of subaerial exposure and high vertical lithofacies variation (Adams and Weaver, 1958; Doveton, 1991; Klaja and Dudek, 2016).
The Wadi Sahtan section exhibits a positive K and Th excursion near the conformity boundary, indicating subaerial exposure and clastic influx (Figure 15). The Th/U ratio in both sections is relatively low, suggesting marine-reducing settings and U enrichments (Adams and Weaver, 1958; Doveton, 1991; Doveton and Prensky, 1992; Klaja and Dudek, 2016). The Th/K ratio varies depending on depositional settings and diagenetic alterations, with high values indicating oxidizing conditions (Serra, 1984; Glover, 2000).
7.4 Uranium and gamma-ray in sequence stratigraphy
Using spectral gamma-ray, specifically uranium (U) and total gamma-ray (total GR), improves chemostratigraphic resolution, aiding in identifying fourth sequences described in Section 6 and more detailed fifth-order cycles. The interpreted uranium and total gamma-ray curves match closely, indicating that the total gamma-ray in the studied sections reflects U values rather than clay minerals. The Lower Mahil mainly consists of radiometric dolomite, making U an inappropriate shale indicator. Uranium and total gamma-ray readings in the Saiq Plateau section range between 0 and 2.3 ppm and 2–41.2 API, respectively, while in the Wadi Sahtan section, they range from 0 to 4.4 ppm for U and 0–38.8 API for total GR (Figures 14–16).
Elevated readings in uranium (U) and total gamma-ray (GR) measurements serve as indicators of maximum flooding surfaces, signifying phases of transgression and increased accommodation space. This phenomenon has been noted in various studies (Davies et al., 1996; Ehrenberg and Svana, 2001; Halgedahl et al., 2009; Farouk et al., 2022; Farouk et al., 2023). The presence of enriched U and total gamma-ray values is linked to the deposition of organic-rich marine sediments in deep-water environments. These conditions correspond to transgressive events and rapid sea-level rises, often accompanied by a landward shift in sedimentary facies.
Conversely, during regression within carbonate systems, carbonate production slows down, leading to an increased proportion of coarser materials. This shift results in negative decreasing deviations in uranium and total gamma-ray logs (Halgedahl et al., 2009; Kalvoda et al., 2011; Tavakoli, 2017; Farouk et al., 2022; Farouk et al., 2023). Consequently, uranium values in the Saiq Plateau section tend to be slightly lower than those in the Wadi Sahtan section. This might be attributed to the shallower location of the Saiq Plateau or the relatively reduced context at greater depths, where uranium values exhibit more variability. Another contributing factor could be the diminished supply of clay detritus to the distal area of the study site, the “Wadi Sahtan section,” resulting in lower sedimentation rates and higher uranium values (Serra, 1984; Klaja and Dudek, 2016; Omidpour et al., 2021).
Spikes in U and total GR readings recognize maximum flooding surfaces, indicating transgressive phases (Davies et al., 1996; Ehrenberg and Svana, 2001; Halgedahl et al., 2009). Enrichment in U and total gamma-ray points to the accumulation of organic-rich marine sediments under deep-water, reducing conditions, corresponding to transgressive events. On the other hand, regressions within carbonate systems result in decelerated carbonate production and increased coarser material, leading to negative excursions in uranium and total gamma-ray logs (Halgedahl et al., 2009; Kalvoda et al., 2011). The U data in the Saiq Plateau section is slightly lower than that of the Wadi Sahtan section, possibly due to the shallower location of the Saiq Plateau, as more variable U values are regularly found in deeper reduced contexts (Serra, 1984; Klaja and Dudek, 2016; Omidpour et al., 2021).
7.5 Uranium (U) and gamma-ray log response to lithofacies
The studied sections exhibit highly variable uranium (U) and total gamma-ray (total GR) data, without any specific trend associated with lithofacies and microfacies textures (Figures 14–16). The dominance of grain-dominated lithofacies in the dolomitized Lower Mahil Formation could explain the variability and lack of clear data for the same textures (Al Raqaishi, 2022).
In the grain-dominated Lower Mahil Formation, the relationship between gamma-activity and grain size is not evident. Previous studies have shown that low gamma-readings are typical of coarse-grained sediments, while high gamma-activity characterizes finer-grained sediments (Berstad and Dypvik, 1981; Dypvik and Eriksen, 1983; Tavakoli, 2017; Farouk et al., 2022; Farouk et al., 2023). However, this pattern is not observed in this formation.
Brecciated floatstone microfacies within thick mud-supported beds with various fossils show some elevated U and total GR readings. This could be attributed to readings from the mud-matrix, unseen fractures filled with “uranium-rich” matter, minor siliciclastic inputs, presence of stylolite, fossils, and the duration of subaerial exposure, which affects U and total GR readings (Luczaj, 1998; Ehrenberg and Svana, 2001; Halgedahl et al., 2009; Tavakoli, 2017; Farouk et al., 2022; Farouk et al., 2023).
7.6 Sequence stratigraphy
7.6.1 Duration of Lower Mahil KS-1
The Lower Mahil Formation, deposited during the Induan stage (251–252.2 million years ago) with a duration of approximately 1.2 million years (Gradstein et al., 2012), constitutes a third-order sequence, as identified by (Sarg et al., 1999). This third-order sequence comprises five sequences, each with a duration of around 240 thousand years, making them fourth-order sequences. During greenhouse times, cycles are likely dominated by high-frequency, low-amplitude sea level changes driven by precession (Read, 1985; 1998) Consequently, one would expect many higher-order cycles in the 1.3 million years Lower Mahil composite sequence due to discontinuities between the vertically stacking cycles.
However, the duration of higher-order cycles in the Lower Mahil Formation is challenging to assess as they are rarely regionally mappable. The maximum number of higher-order cycles observed in the Lower Mahil Formation is ten cycles. Nonetheless, since there are some incomplete cycles exposed, the formation likely has at least 11 higher-order cycles. Given the 1.3 million years duration of the composite sequence, this would suggest that the higher-order cycles have an approximate duration of 109 thousand years, indicating fifth-order cycles. This likely implies that the Lower Mahil Formation contains many missing “beats” due to erosional discontinuity surfaces (Balog et al., 1997; Moustafa et al., 2019).
7.6.2 Third-order sequence
The deposition of the Lower Mahil Formation corresponds to the third-order sequence (KS1), following the framework established (Vail et al., 1977; Haq et al., 1987), who identified third-order durations ranging from 1 to 10 million years. Two distinct patterns of third-order sea-level changes during transgression and regression are revealed through total and spectral gamma-ray analysis. The most comprehensive and precise logs, including U and total GR profiles, were selected for careful spectral and gamma-ray analysis. The maximum flooding surface (MFS/MFZ) is associated with high U, total GR, and carbon isotope values in both sections (Figure 17). Moreover, the lower sequence boundary is identified at the beginning of the section, with no clear indication of a sequence boundary at the outcrop location. However, the upper sequence boundary is marked by the appearance of breccia, which is placed at the end of the breccia facies, signifying the end of the section. As discussed earlier, the breccia’s source is tectonic (see Section 7.1; Figures 13A, B).
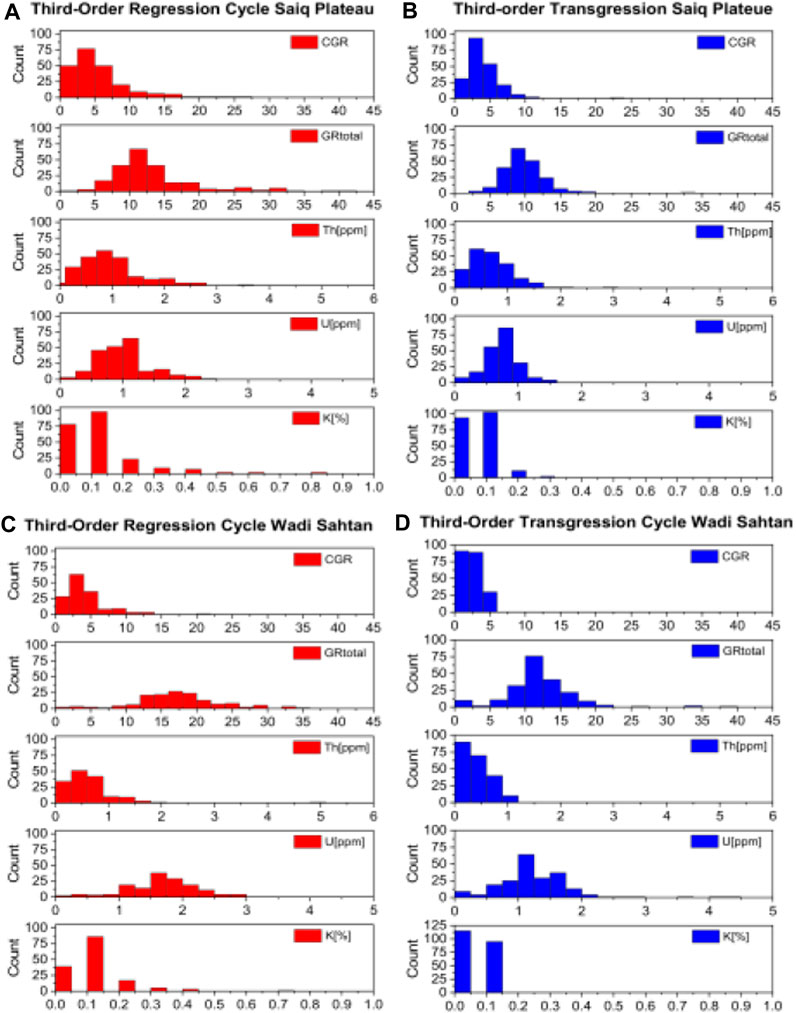
FIGURE 17. (A–D) Provides a visual representation of the third-order sequence stratigraphy signature determined through spectral gamma-ray analysis. This figure specifically emphasizes two distinct phases: transgression [illustrated by blue, (B,D)] and regression [depicted by red, (A,C)].
It is evident from the data that U was higher during the transgression phase compared to the regression phase (Figure 17). This observation of two phases of sea level or one third order sequence has also been noted in different studies (Maurer et al., 2009; Koehrer et al., 2010; Baud and Richoz, 2013; Bendias et al., 2013), albeit with slight differences from the findings of this study. Here, both phases of sea level have similar thicknesses (Figure 17).
7.6.3 Fourth-order sequence
Based on the principles outlined (Vail et al., 1977; Sarg, 1988; Kerans, and Tinker, 1997), the KS1 exhibits five sequences, namely, four complete fourth-order sequences (S1, S2, S3, and S4) and one incomplete sequence (S5). These sequences are identified based on factors such as vertical facies distribution, carbon isotope, U, total GR log variations, stacking patterns, and changes in components in different system tracts within the succession. Sequence boundaries (SB) mark the beginning and end of each sequence without clear evidence of subaerial exposure. Transgressive and regressive trends are observed within each sequence, indicated by maximum flooding surfaces and bounded by sequence boundaries at the top and bottom. Negative peaks correspond to sequence boundaries, while positive peaks correspond to maximum flooding surfaces. As discussed earlier, relative sea level rises are associated with positive shifts in the δ13C curve, while relative sea level falls are linked to negative shifts in the δ13C curve (Immenhauser et al., 2003; Swart et al., 2005; Fanton and Holmden, 2007).
During transgression, there is an increase in carbon isotope, U, and total GR trends in both sections. Conversely, regression is associated with decreased carbon isotope, U, and total GR. This trend is evident in sequences S1 and S4, with clear patterns of transgression and regression reflected in the carbon isotope, U, and total GR profiles (Figure 17). A similar pattern is observed in the other fourth order sequences (S2, S3, and S5). Integrating gamma-ray and isotope data allows for the generation of high-resolution sequence stratigraphy.
Another significant aspect relates to the thickness of the fourth-order sequences, which varies in each sequence. These thickness variations may be attributed to differential syn-rift subsidence during the deposition of the Lower Mahil Formation, indicating that the Lower Mahil Formation was laid down during active tectonics.
7.6.4 Fifth-order cycle
Fifth-order cycles (meter-scale cycles) represent the smallest units of genetically related facies assemblage within each sequence, and they commonly are bounded by local flooding and sequence boundary surfaces (Arnott, 1995; Embry, 2005). Fifth-order cycles in the KS1 (Figure 16) range in thickness from a few meters to up to 7 m. The thickness, geometry, lateral extent, and lithology of fifth-order cycles vary across depositional settings within the ramp. Boundaries of fifth-order cycles in the succession were defined using the U and total GR patterns only. Boundaries cannot be observed in the outcrops. 10 fifth-order cycles and one incomplete fifth-order cycle are delineated within the KS1 third-order sequence. However, no single cycle is traceable throughout the sections (Figure 16). Relying upon the interpretation mentioned above, the higher value of uranium reflects the preservation of organic matter in reduction settings (Luczaj, 1998; Ehrenberg and Svana, 2001; Halgedahl et al., 2009), showing a transgression trend and vice versa is true. In the fifth-order cycles, sequence boundaries (SB) are defined by the low U and total GR values corresponding to the oxidizing and the maximum flooding surfaces (MFS) defined by the U and total GR peaks corresponding to the reduction conditions (Luczaj, 1998; Ehrenberg and Svana, 2001; Halgedahl et al., 2009).
7.7 Sea-level changes in third and fourth-order sequences
The stratigraphic sequences, as determined by (Haq et al., 1987), serve as indicators of relative sea-level fluctuations. Increasing shifts in the U, total GR, and δ13C curves are associated with rising relative sea levels, while negative shifts indicate falling relative sea levels (Immenhauser et al., 2003; Swart and Gregor, 2005 Fanton and Holmden, 2007). In our interpretation of the relative sea-level changes during the Lower Triassic, we have adopted the third-order and fourth-order sequences (Figure 19). Additionally, Figure 19 illustrates the first and second-order relative sea-level variations based on a previous study by (Alsharhan, 2006). The third-order relative sea-level trends identified in this study exhibit distinct patterns. These patterns align transgression with high gamma-ray and carbon isotope levels, while regression corresponds to low gamma-ray and carbon isotope levels. The analysis of spectral gamma-rays and carbon isotopes suggests a believable connection between relative sea levels and the global sea level. Moreover, the variations in relative sea levels are proposed to be linked with tectonic activities, including rifting and drifting (as discussed by Koehrer et al., 2010; Koehrer et al., 2012; Bendias et al., 2013). Consequently, the spectral gamma-ray and carbon isotope data from this study (Figures 16–19) could serve as proxies for monitoring sea level changes, enabling broader global correlations.
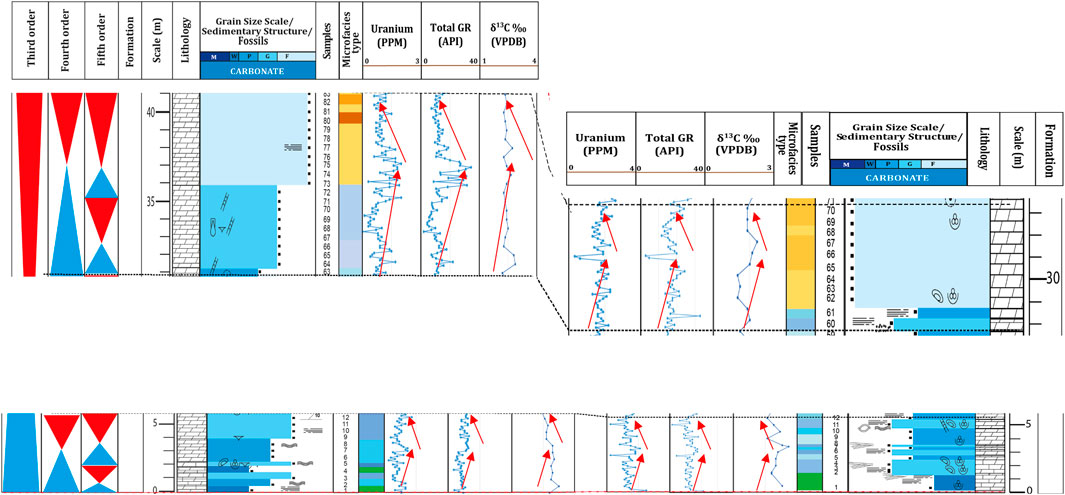
FIGURE 18. Chemostratigraphy correlation between the Saiq Plateau and Wadi Sahtan sections for the Lower Mahil Formation in Northern Oman. The correlation is based on the carbon isotope, uranium, and total gamma-ray profiles. This correlation shows changes in the carbon isotope, uranium, and total gamma-rays of S1 and S4.
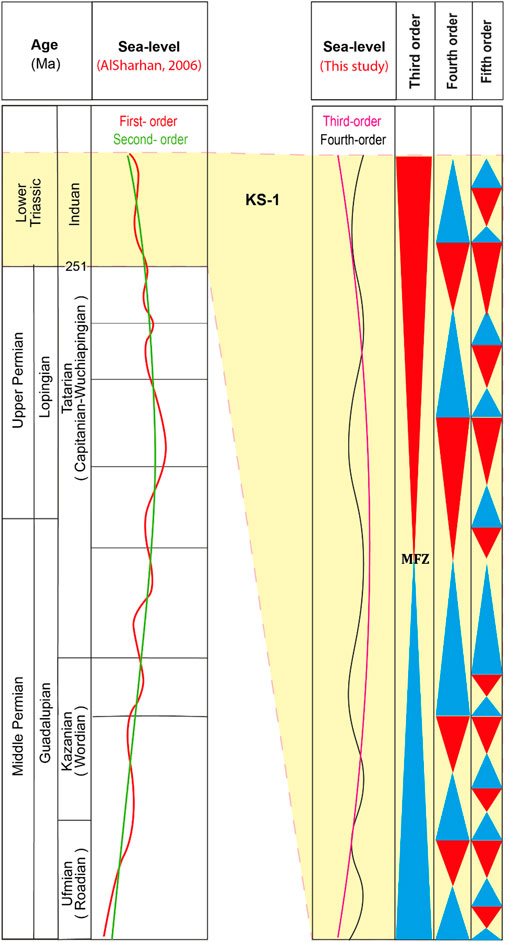
FIGURE 19. Schematic diagram comparing relative sea-level changes for different orders. The figure displays data for the first and second orders relative sea-level variations as documented by [72]. Additionally, it showcases the third and fourth orders relative sea-level changes based on the findings of this current study. This comparison provides valuable insights into sea-level fluctuations at various temporal scales, ranging from higher-order to lower-order changes, as recorded in the geological record.
8 Conclusion
In northern Oman, the Lower Triassic Mahil KS-1 Formation samples from Saiq Plateau and Wadi Sahtan sections underwent chemostratigraphic analysis to interpret sequence stratigraphy. Isotope data were integrated with high-resolution spectral and total gamma-ray measurements to construct a precise stratigraphic model. The Saiq Plateau and Wadi Sahtan sections displayed similar δ13C ranges (1.5‰–3.5‰ and 1‰–2.5‰, respectively), while the Saiq Plateau section exhibited a wider range and lighter δ18O (−4.2 to −1.2‰) compared to the Wadi Sahtan section (−2 to+0.2‰). The Lower Mahil Formation is interpreted to have been deposited during a third-order sequence, and fourth-order sequences were identified based on stable carbon isotopes, uranium, and total gamma-ray variations. Correlation between Saiq Plateau and Wadi Sahtan sections revealed five fourth-order sequences within the Lower Mahil KS-1 Formation, with four complete and one incomplete sequence. Diagenesis is likely to influence oxygen isotopes, particularly during exposure to meteoric water. The presence of potassium and thorium positive peaks (computed gamma-ray peaks) suggests the existence of hidden thin layers of marly carbonate in the grainy-dominated, highly dolomitized Lower Mahil Formation. Rising uranium and total gamma-ray curves indicate the transgression phase, reflecting organic matter preservation in reduction settings during rising sea levels and the finer grain size. Conversely, uranium and total gamma-ray curve reduction signifies the regression phase. High-resolution uranium and total gamma-ray analyses are employed to identify fifth-order cycles. Additional studies on more sections in northern Oman during the Lower Triassic are needed to establish a more robust stratigraphic framework. At the same time, further work is required to construct the global isotopic curve.
Data availability statement
The original contributions presented in the study are included in the article/Supplementary Material, further inquiries can be directed to the corresponding author.
Author contributions
MM: Conceptualization, Data curation, Formal Analysis, Funding acquisition, Investigation, Methodology, Project administration, Resources, Supervision, Validation, Visualization, Writing–original draft, Writing–review and editing. RR: Conceptualization, Data curation, Formal Analysis, Investigation, Methodology, Validation, Visualization, Writing–original draft. ME-G: Conceptualization, Data curation, Formal Analysis, Investigation, Methodology, Validation, Visualization, Writing–original draft, Funding acquisition, Project administration, Resources, Supervision, Writing–review and editing. MG: Conceptualization, Data curation, Formal Analysis, Investigation, Methodology, Project administration, Supervision, Validation, Visualization, Writing–original draft, Writing–review and editing, Software. IA: Conceptualization, Data curation, Formal Analysis, Funding acquisition, Investigation, Methodology, Project administration, Resources, Software, Validation, Visualization, Writing–original draft, Writing–review and editing. AH: Conceptualization, Data curation, Formal Analysis, Investigation, Methodology, Software, Validation, Visualization, Writing–original draft, Writing–review and editing, Resources. NG: Conceptualization, Data curation, Formal Analysis, Investigation, Methodology, Software, Validation, Visualization, Writing–original draft, Writing–review and editing. MA: Conceptualization, Data curation, Formal Analysis, Investigation, Methodology, Software, Validation, Visualization, Writing–original draft, Writing–review and editing. HA-A: Conceptualization, Data curation, Formal Analysis, Investigation, Methodology, Software, Validation, Visualization, Writing–original draft, Writing–review and editing, Funding acquisition, Project administration, Resources, Supervision.
Funding
The author(s) declare financial support was received for the research, authorship, and/or publication of this article. This research was funded by the Research Council (TRC), Sultanate of Oman, under grant RC/RG-DVC/ESRC/18/01.
Acknowledgments
The authors thank the Research Council (TRC) for funding the project under grant RC/RG-DVC/ESRC/18/01. Open Access funding provided by the Qatar National Library. Special acknowledgments are extended to the technicians and staff of the Department of Earth Sciences at SQU, particularly Mr. Said Al-Abri, Mr. Bader Al Waili, Mr. Hilal Al Zeidi, and Mr. Hamdan Al-Zidi, for their invaluable assistance in thin-section preparation. The authors would also like to thank Musaab Shakir Al Sarmi and the Bachelor’s students Najiya, Nawf, Basema, and Nasser for their valuable contributions during the field trips. Finally, the authors thank Texas A and M for calibrating and conducting the isotopic analyses.
Conflict of interest
Author AH was employed by Petrogas Oil Company.
The remaining authors declare that the research was conducted in the absence of any commercial or financial relationships that could be construed as a potential conflict of interest.
Publisher’s note
All claims expressed in this article are solely those of the authors and do not necessarily represent those of their affiliated organizations, or those of the publisher, the editors and the reviewers. Any product that may be evaluated in this article, or claim that may be made by its manufacturer, is not guaranteed or endorsed by the publisher.
References
Abdolmaleki, J., and Tavakoli, V. (2016). Anachronistic facies in the early Triassic successions of the Persian Gulf and its palaeoenvironmental reconstruction. Palaeogeogr. Palaeoclimatol. Palaeoecol. 446, 213–224. doi:10.1016/j.palaeo.2016.01.031
Adams, John A. S., and Weaver, Charles E. (1958). Thorium-to-uranium ratios as indicators of sedimentary processes: example of concept of geochemical facies. AAPG Bull. 42 (2), 387–430. doi:10.1306/0bda5a89-16bd-11d7-8645000102c1865d
Aigner, Thomas, and Bachmann, Gerhard H. (1992). Sequence-stratigraphic framework of the German triassic. Sediment. Geol. 80 (1-2), 115–135. doi:10.1016/0037-0738(92)90035-p
Al Raqaishi, , Ali, Rasha, Sh Moustafa, Mohamed, El-Ghali, Mohamed A. K., Iftikhar Ahmed, Abbasi, Al-Awah, Hezam, et al. (2023). Microfacies and depositional model of the lower Mahil Formation (outcrop khuff-equivalent (KS-1)) in jabal akhdar, northern Oman: implications for reservoir characterization. Mar. Petroleum Geol. 149, 106066. doi:10.1016/j.marpetgeo.2022.106066
Al-Aswad, A. A. (1997). Stratigraphy, sedimentary environment and depositional evolution of the Khuff Formation in south-central Saudi Arabia. J. Petroleum Geol. 20 (3), 307–326. doi:10.1111/j.1747-5457.1997.tb00638.x
Al-Husseini, , Moujahed, I., and Koehrer., Bastian (2013). Chrono-and sequence-stratigraphy of the mid-permian to early triassic Khuff sequences of the Arabian Plate. GeoArabia 18 (3), 103–130. doi:10.2113/geoarabia1803103
Al-Jallal, , and Ibrahim, A. (1991). “Depositional environments, lithofacies types, and reservoir development of the permian Khuff Formation in eastern Saudi arabia,” in AAPG bulletin (Tulsa, Oklahoma, United States: American Association of Petroleum Geologists).
Al-Raqaishi, , Ali, , and Rasha, (2022). Microfacies, depositional model, Chemostratigraphy, and sequence stratigraphy of the lower Mahil FormationFormation (KS-1 Khuff outcrop equivalent). MSc Theses. Muscat OM, Oman: Sultan Qaboos University.
Allan, J. R., and Matthews, Richard K. (1990). Isotope signatures associated with early meteoric diagenesis. Carbonate diagenes., 197–217. doi:10.1002/9781444304510.ch16
Allan, J. R., and Richard K, Matthews (1990). Isotope signatures associated with early meteoric diagenesis. Carbonate diagenes., 197–217. doi:10.1002/9781444304510.ch16
Alqahtani, Najm (2019). “Sedimentology, sequence stratigraphy, and diagenesis of the lower Wuchiapingian Khuff unit in a field in Saudi Arabia,” in Colorado school of mines (Ann Arbor, Michigan, United States: ProQuest).
Alsharhan, Abdulrahman S., Christopher, G., and Kendall., St C. (1986). Precambrian to jurassic rocks of arabian gulf and adjacent areas: their facies, depositional setting, and hydrocarbon habitat. AAPG Bull. 70 (8), 977–1002. doi:10.1306/94886650-1704-11d7-8645000102c1865d
Alsharhan, Abdulrahman S. (2006). Sedimentological character and hydrocarbon parameters of the middle Permian to Early Triassic Khuff Formation, United Arab Emirates. GeoArabia 11 (3), 121–158. doi:10.2113/geoarabia1103121
Arnott, R. W. C. (1995). The parasequence definition; are transgressive deposits inadequately addressed? J. Sediment. Res. 65 (1), 1–6. doi:10.1306/d42681d0-2b26-11d7-8648000102c1865d
Atudorei, Nicu-Viorel (1999). Constraints on the upper permian to upper triassic marine carbon isotope curve PhD thesis. Lausanne, Switzerland: University of Lausanne.
Balog, Anna, Haas, Janos, Fred Read, J., and Coruh, Cahit (1997). Shallow marine record of orbitally forced cyclicity in a Late Triassic carbonate platform, Hungary. J. Sediment. Res. 67 (4), 661–675. doi:10.1306/d426860d-2b26-11d7-8648000102c1865d
Bartley, Julie K., Mikhail, A. Semikhatov, Alan, J. Kaufman, Andrew, H. Knoll, Michael, C. Pope, and Jacobsen, Stein B. (2001). Global events across the mesoproterozoic–neoproterozoic boundary: C and Sr isotopic evidence from siberia. Precambrian Res. 111 (1-4), 165–202. doi:10.1016/s0301-9268(01)00160-7
Baud, Aymon, Atudorei, Viorel, and Sharp, Zachary (1996). Late permian and early triassic evolution of the northern Indian margin: carbon isotope and sequence stratigraphy. Geodin. Acta 9 (2-3), 57–77. doi:10.1080/09853111.1996.11105278
Baud, Aymon, and Richoz, Sylvain (2013). Permian–Triassic transition and the saiq/mahil boundary in the Oman Mountains: proposed correction for lithostratigraphic nomenclature. GeoArabia 18 (3), 87–98. doi:10.2113/geoarabia180387
Baud, Aymon, and Sylvain, Richoz (2013). Permian–Triassic transition and the saiq/mahil boundary in the Oman Mountains: proposed correction for lithostratigraphic nomenclature. GeoArabia 18 (3), 87–98. doi:10.2113/geoarabia180387
Beckert, Julia, Vandeginste, Veerle, and John, Cédric M. (2015). Exploring the geological features and processes that control the shape and internal fabrics of late diagenetic dolomite bodies (Lower Khuff equivalent–Central Oman Mountains). Mar. Petroleum Geol. 68, 325–340. doi:10.1016/j.marpetgeo.2015.08.038
Bendias, Daniel, Koehrer, Bastian, Obermaier, Michael, and Aigner, Thomas (2013). Mid-permian Khuff sequence KS6: paleorelief-influenced facies and sequence patterns in the lower khuff time-equivalent strata, oman mountains, sultanate of oman. GeoArabia 18 (3), 135–178. doi:10.2113/geoarabia1803135
Berstad, S., and Dypvik, H. (1982). Sedimentological evolution and sedimentological evolution and natural radioactivity of tertiary sediments from the Central North Sea. J. Petroleum Geol. 5 (1), 77–88. doi:10.1111/j.1747-5457.1982.tb00561.x
Brachert, T. C., Forst, M. H., Pais, J. J., Legoinha, P., and Reijmer, J. J. G. (2003). Lowstand carbonates, highstand sandstones? Sediment. Geol. 155 (1-2), 1–12. doi:10.1016/s0037-0738(02)00329-9
Brasier, M. D., Shields, G., Kuleshov, V. N., and Zhegallo, E. A. (1996). Integrated chemo-and biostratigraphic calibration of early animal evolution: neoproterozoic–early cambrian of southwest mongolia. Geol. Mag. 133 (4), 445–485. doi:10.1017/s0016756800007603
Buccianti, A., Apollaro, Carmine, Bloise, Andrea, De Rosa, Rosanna, Falcone, G., Scarciglia, Fabio, et al. (2009). Natural radioactivity levels (K, Th, U and Rn) in the cecita lake area (sila massif, calabria, southern Italy): an attempt to discover correlations with soil features on a statistical base. Geoderma 152 (1-2), 145–156. doi:10.1016/j.geoderma.2009.05.027
Catuneanu, Octavian, Abreu, Vitor, Bhattacharya, J. P., Blum, M. D., Dalrymple, R. W., Eriksson, P. G., et al. (2009). Towards the standardization of sequence stratigraphy. Earth-Science Rev. 92 (1-2), 1–33. doi:10.1016/j.earscirev.2008.10.003
Chauvet, François (2007). La marge continentale sud-téthysienne en Oman: structure et volcanisme au permien et au trias PhD diss. Saint-Martin-d'Hères, France: Université Joseph-Fourier-Grenoble I.
Cong, Fuyun, Zhu, Fangbing, Cai, Zhongxian, Chen, Haoru, Li, Jie, Wang, Yuxuan, et al. (2019). Orbitally forced glacio-eustatic origin of third-order sequences and parasequences in the Middle Permian Maokou Formation, South China. Mar. Petroleum Geol. 99, 237–251. doi:10.1016/j.marpetgeo.2018.10.014
Cooper, David J. W., Toland, Christopher, Ali, Mohammed Y., and Owen, Green. (2016). Evolution of the Arabian continental margin of the northern Dibba Zone, eastern United Arab Emirates and Oman. J. Asian Earth Sci. 129, 254–275. doi:10.1016/j.jseaes.2016.08.021
Davies, S. J., and Elliott, T. (1996). Spectral gamma ray characterization of high resolution sequence stratigraphy: Examples from upper carboniferous fluvio-deltaic systems, county clare, Ireland. London: Geological Society, 25–35.
deMenocal, Peter B., William, F. Ruddiman, and Dennis, V. Kent (1990). Depth of post-depositional remanence acquisition in deep-sea sediments: A case study of the brunhes-matuyama reversal and oxygen isotopic stage 19.1. Earth Planet. Sci. Lett. 99 (1-2), 1–13. doi:10.1016/0012-821x(90)90066-7
Dickson, J. A. D. (1965). A modified staining technique for carbonates in thin section. Nature 205, 587. doi:10.1038/205587a0
Doveton, John H. (1991). Lithofacies and geochemical facies profiles from nuclear wire-line logs: new subsurface templates for sedimentary modeling. Bull. Kans. Geol. Surv. 233, 101–110.
Doveton, John H., and Prensky, Stephen E. (1992). Geological applications of wireline logs: A synopsis of developments and trends. Log Analyst 33 (3), 286–303.
Dravis, Jeffrey J. (1996). Rapidity of freshwater calcite cementation—Implications for carbonate diagenesis and sequence stratigraphy. Sediment. Geol. 107 (1-2), 1–10. doi:10.1016/s0037-0738(96)00063-2
Dypvik, H., and Eriksenf, D. Ø. (1983). Natural radioactivity of clastic sediments and the contributions of U, Thand K. J. Petroleum Geol. 5 (4), 409–416. doi:10.1111/j.1747-5457.1983.tb00592.x
Ehrenberg, S. N., and Svana, T. A. (2001). Use of spectral gamma-ray signature to interpret stratigraphic surfaces in carbonate strata: an example from the finnmark carbonate platform (carboniferous-permian), barents sea. AAPG Bull. 85 (2), 295–308. doi:10.1306/8626c7c1-173b-11d7-8645000102c1865d
Embry, A. F. (2006). Episodic global tectonics: sequence stratigraphy meets plate tectonics. GEO Expro 3, 26–30. doi:10.3997/2214-4609-pdb.256.p16
Fanton, K. C., and Holmden, C. (2007). Sea-Level forcing of carbon isotope excursions in epeiric seas: implications for chemostratigraphy. Can. J. Earth Sci. 44 (6), 807–818. doi:10.1139/e06-122
Farouk, S., Ren, C., Abdeldaim, A., Salama, A., Wu, H., El-Kahtany, K., et al. (2022). An astronomical time scale of early Pliocene from the Mediterranean Sea, Egypt. Glob. Planet. change 215, 103869. doi:10.1016/j.gloplacha.2022.103869
Farouk, S., Sen, S., Belal, N., Omran, M. A., Assal, E. M., and Sarhan, M. A. (2023). Assessment of the petrophysical properties and hydrocarbon potential of the lower miocene nukhul Formation in the abu rudeis-sidri field, gulf of suez basin, Egypt. Geomechanics Geophys. Geo-Energy Geo-Resources 9 (1), 36. doi:10.1007/s40948-023-00572-w
Fertl, Walter H., and Rieke, H. H. (1980). Gamma ray spectral evaluation techniques identify fractured shale reservoirs and source-rock characteristics. J. Petroleum Technol. 32 (11), 2053–2062. doi:10.2118/8454-pa
Fontana, Simone, Nader, Fadi H., Morad, Sadoon, Ceriani, Andrea, Ihsan, S., and Al-Aasm, (2013). “Diagenesis of the Khuff Formation (Permian–Triassic), northern United Arab Emirates,” in Lithosphere dynamics and sedimentary basins: The Arabian Plate and analogues (Berlin, Germany: Springer), 203–220.
Gao, Yuan, Fu, Xiugen, Li, Yi, Wan, Youli, Wang, Zhongwei, Song, Chunyan, et al. (2020). Demise of the middle jurassic carbonate platform: responses to sea-level fall in the qiangtang basin, eastern tethys. Geol. J. 55 (12), 7935–7952. doi:10.1002/gj.3923
Garrels, Robert M., and Abraham, Lerman. (1981). Phanerozoic cycles of sedimentary carbon and sulfur. Proc. Natl. Acad. Sci. 78 (8), 4652–4656. doi:10.1073/pnas.78.8.4652
Geert, Konert, Afifi, Abdulkader M., Al-Hajri, Sa’id A., and Droste, Henk J. (2001). Paleozoic stratigraphy and hydrocarbon habitat of the Arabian Plate. GeoArabia 6 (3), 407–442. doi:10.2113/geoarabia0603407
Gharbi, M., Boote, D., Aich, N. S., Moustafa, M. S., and Gabtni, H. (2022). Aptian− Albian extension in Tethyan rifted continental passive margin of Tunisia inferred from sequential restorations of balanced cross-sections and expansion index. Mar. Petroleum Geol. 143, 105818. doi:10.1016/j.marpetgeo.2022.105818
Glennie, Kenneth W. (2000). Cretaceous tectonic evolution of arabia’s eastern Plate margin: A tale of two oceans. McLean, VA, United States: GeoScienceWorld.
Goldhammer, R. K., Oswald, E. J., Dunn, P. A., Franseen, E. K., and Watney, W. L. (1991). “Hierarchy of stratigraphic forcing: example from middle pennsylvanian shelf carbonates of the paradox basin,” in Sedimentary modeling: Computer simulations and methods for improved parameter definition (Lawrence, KS, United States: Kansas Geological Survey), 233, 361–413.
Gradstein, Felix M., James, George Ogg, Mark, D. Schmitz, and Gabi, M. Ogg (2012). The geologic time scale 2012. Amsterdam, Netherlands: Elsevier.
Gröcke, Darren R. (2020). Carbon isotope stratigraphy: principles and applications. Stratigr. Timescales 5, 1–40.
Grossman, E. L., and Joachimski, M. M. (2020). “Oxygen isotope stratigraphy,” in Geologic time scale 2020 (Amsterdam, Netherlands: Elsevier), 279–307.
Grossman, Ethan L., Mii, Horng-Sheng, and Yancey, Thomas E. (1993). Stable isotopes in late pennsylvanian brachiopods from the United States: implications for carboniferous paleoceanography. Geol. Soc. Am. Bull. 105 (10), 1284–1296. doi:10.1130/0016-7606(1993)105<1284:siilpb>2.3.co;2
Grossman, Ethan L., Yancey, Thomas E., Thomas, E. Jones, Bruckschen, Peter, Chuvashov, Boris, Mazzullo, S. J., et al. (2008). Glaciation, aridification, and carbon sequestration in the permo-carboniferous: the isotopic record from low latitudes. Palaeogeogr. Palaeoclimatol. Palaeoecol. 268 (3-4), 222–233. doi:10.1016/j.palaeo.2008.03.053
GruszczyŃski, Michal, HaŁas, StanisŁaw, Hoffman, Antoni, and Małkowski, Krzysztof (1989). A brachiopod calcite record of the oceanic carbon and oxygen isotope shifts at the Permian/Triassic transition. Nature 337, 64–68. doi:10.1038/337064a0
Guagliardi, Ilaria, Zuzolo, Daniela, Albanese, Stefano, Lima, Annamaria, Pellegrino, Cerino, Pizzolante, Antonio, et al. (2020). Uranium, thorium and potassium insights on campania region (Italy) soils: sources patterns based on compositional data analysis and fractal model. J. Geochem. Explor. 212, 106508. doi:10.1016/j.gexplo.2020.106508
Haghighat, N., Hashemi, H., Tavakoli, V., and Nestell, G. P. (2020). Permian–Triassic extinction pattern revealed by foraminifers and geochemical records in the central Persian Gulf, southern Iran. Palaeogeogr. Palaeoclimatol. Palaeoecol. 2020, 543. doi:10.1016/j.palaeo.2020.109588
Halgedahl, S. L., Jarrard, R. D., Brett, C. E., and Allison, P. A. (2009). Geophysical and geological signatures of relative sea level change in the upper wheeler formation, drum Mountains, west-central Utah: A perspective into exceptional preservation of fossils. Palaeogeogr. Palaeoclimatol. Palaeoecol. 277 (1-2), 34–56. doi:10.1016/j.palaeo.2009.02.011
Hamon, Youri, and Merzeraud, Gilles (2007). C and O isotope stratigraphy in shallow-marine carbonate: A tool for sequence stratigraphy (example from the lodève region, peritethian domain). Swiss J. Geosciences 100, 71–84. doi:10.1007/s00015-007-1206-4
Hampson, Gary J., William, Davies, Sarah, J. Davies, Howell, John A., and Adamson, Keith R. (2005). Use of spectral gamma-ray data to refine subsurface fluvial stratigraphy: late cretaceous strata in the book cliffs, utah, usa. J. Geol. Soc. 162 (4), 603–621. doi:10.1144/0016-764904-059
Haq, Bilal U., Hardenbol, J. A. N., and Peter, R. (1987). Chronology of fluctuating sea levels since the Triassic. Science 235, 1156–1167. doi:10.1126/science.235.4793.1156
Horacek, Micha, Brandner, Rainer, and Abart, Rainer (2007a). Carbon isotope record of the P/T boundary and the lower triassic in the southern alps: evidence for rapid changes in storage of organic carbon. Palaeogeogr. Palaeoclimatol. Palaeoecol. 252 (1-2), 347–354. doi:10.1016/j.palaeo.2006.11.049
Hudson, J. D. (1977). Stable isotopes and limestone lithification. J. Geol. Soc. 133 (6), 637–660. doi:10.1144/gsjgs.133.6.0637
Hurst, (1990). Natural gamma-ray spectrometry in hydrocarbon-bearing sandstones from the Norwegian Continental Shelf. London: Geological Society, 211–222.
Immenhauser, Adrian, Della Porta, Giovanna, Jeroen, A. M., and Juan, R. (2003). An alternative model for positive shifts in shallow-marine carbonate δ13C and δ18O: an alternative model for carbon and oxygen isotope shifts. Sedimentology 50 (5), 953–959. doi:10.1046/j.1365-3091.2003.00590.x
Insalaco, Enzo, Virgone, Aurélien, Bruno, Courme, Gaillot, Jérémie, Kamali, Mohammad, Ali, Moallemi, et al. (2006). Upper dalan member and kangan formation between the zagros Mountains and offshore fars, Iran: depositional system, biostratigraphy and stratigraphic architecture. GeoArabia 11 (2), 75–176. doi:10.2113/geoarabia110275
Jabir, Mohammed A., Ali, Mohammed Y., Abdelmaksoud, A., Morad, S., and Decarlis, A. (2023). Silurian-holocene tectonostratigraphy of abu dhabi, United Arab Emirates. Mar. Petroleum Geol. 153, 106279. doi:10.1016/j.marpetgeo.2023.106279
Jenkyns, H. U. G. H. C., and Clayton, C. H. R. I. S. T. O. P. H. E. R. J. (1997). Lower jurassic epicontinental carbonates and mudstones from england and wales: chemostratigraphic signals and the early toarcian anoxic event. Sedimentology 44 (4), 687–706. doi:10.1046/j.1365-3091.1997.d01-43.x
Kalvoda, J. I. Ø. Í., Bábek, O. N. D. Ø. E. J., Devuyst, Francois X., and Sevastopulo, George D. (2011). Biostratigraphy, sequence stratigraphy and gamma-ray spectrometry of the Tournaisian-Viséan boundary interval in the Dublin Basin. Bull. Geosciences 86 (4), 683–706. doi:10.3140/bull.geosci.1265
Kerans, C., and Tinker, S. W. (1997). Sequence stratigraphy and characterization of carbonate reservoirs: sepm-short course notes no. 40. Sepm Short. Course 40. doi:10.2307/3515455
Khalifa, M. Kh, and Mills, K. J. (2020). Facies analysis relationships depositional environments of the subsurface stratigraphy of the snake cave interval in the bancannia trough, western darling basin, new south wales, SE Australia. Mar. Petroleum Geol. 115, 104279. doi:10.1016/j.marpetgeo.2020.104279
Klaja, Jolanta, and Dudek, Lidia (2016). Geological interpretation of spectral gamma ray (SGR) logging in selected boreholes. Nafta-Gaz 72, 3–14. doi:10.18668/ng2016.01.01
Koehrer, Bastian, Aigner, Thomas, Forke, Holger, and Pöppelreiter, Michael (2012). Middle to upper Khuff (sequences KS1 to KS4) outcrop-equivalents in the Oman Mountains: grainstone architecture on a subregional scale. GeoArabia 17 (4), 59–104. doi:10.2113/geoarabia170459
Koehrer, Bastian, Zeller, Michael, Aigner, Thomas, Poeppelreiter, Michael, Paul, Milroy, Forke, Holger, et al. (2010). Facies and stratigraphic framework of a Khuff outcrop equivalent: saiq and mahil formations, al jabal al-akhdar, sultanate of Oman. GeoArabia 15 (2), 91–156. doi:10.2113/geoarabia150291
Krull, Evelyn S., Lehrmann, Daniel J., Druke, Dominic, Kessel, Benjamin, Yu, YouYi, and Li, Rongxi (2004). Stable carbon isotope stratigraphy across the Permian–Triassic boundary in shallow marine carbonate platforms, Nanpanjiang Basin, south China. Palaeogeogr. Palaeoclimatol. Palaeoecol. 204 (3-4), 297–315. doi:10.1016/s0031-0182(03)00732-6
Kump, Lee R., and Arthur, Michael A. (1999). Interpreting carbon-isotope excursions: carbonates and organic matter. Chem. Geol. 161 (1-3), 181–198. doi:10.1016/s0009-2541(99)00086-8
Lee, C. W. (1990). A review of platform sedimentation in the Early and Late Permian of Oman, with particular reference to the Oman Mountains. Geol. Soc. Lond. Spec. Publ. 49 (1), 39–47. doi:10.1144/gsl.sp.1992.049.01.04
Luczaj, John A. (1998). Regional and stratigraphic distribution of uranium in the Lower Permian Chase Group carbonates of southwest Kansas. Log Analyst 39–04.
Magaritz, M. O. R. D. E. C. K. A. I., and Holser, W. I. L. L. I. A. M. T. (1991). The permian-triassic of the gartnerkofel-1 core (carnic alps, Austria): carbon and oxygen isotope variation. Abh. Geol. Bundesanst. 45, 149–163.
Marshall, James D. (1992). Climatic and oceanographic isotopic signals from the carbonate rock record and their preservation. Geol. Mag. 129 (2), 143–160. doi:10.1017/s0016756800008244
Martin, A. Ziegler (2001). Late permian to holocene paleofacies evolution of the Arabian Plate and its hydrocarbon occurrences. GeoArabia 6 (3), 445–504. doi:10.2113/geoarabia0603445
Maurer, Florian, Martini, Rossana, Rettori, Roberto, Hillgärtner, Heiko, and Cirilli, Simonetta (2009). The geology of Khuff outcrop analogues in the Musandam Peninsula, United Arab Emirates and Oman. GeoArabia 14 (3), 125–158. doi:10.2113/geoarabia1403125
McConnaughey, Ted. (1989). 13C and 18O isotopic disequilibrium in biological carbonates: I. Patterns. Geochimica Cosmochimica Acta 53 (1), 151–162. doi:10.1016/0016-7037(89)90282-2
Mitchum, , Robert, M., and Van Wagoner, John C. (1991). High-frequency sequences and their stacking patterns: sequence-stratigraphic evidence of high-frequency eustatic cycles. Sediment. Geol. 70 (2-4), 131–160. doi:10.1016/0037-0738(91)90139-5
Morante, Richard. (1996). Permian and early Triassic isotopic records of carbon and strontium in Australia and a scenario of events about the Permian-Triassic boundary. Hist. Biol. 11 (1-4), 289–310. doi:10.1080/10292389609380546
Moustafa, Mohamed S. H., Pope, Michael C., Grossman, Ethan L., and Mriheel, Ibrahim Y. (2016). Carbon and oxygen isotope variations of the middle–late Triassic Al Aziziyah formation, northwest Libya. J. Afr. Earth Sci. 118, 149–162. doi:10.1016/j.jafrearsci.2016.02.011
Moustafa, M. S., Pope, M. C., and Mriheel, I. Y. (2019). High resolution sequence stratigraphy of the Middle–Late Triassic Al Aziziyah formation, northwest Libya. J. Afr. Earth Sci. 155, 75–89. doi:10.1016/j.jafrearsci.2019.03.009
Myers, K. J., and Bristow, C. S. (1989a). Detailed sedimentology and gamma-ray log characteristics of a Namurian deltaic succession II: Gamma-ray logging. London: Geological Society, 81–88.
Myers, K. J., and Bristow, C. S. (1989b). Detailed sedimentology and gamma-ray log characteristics of a Namurian deltaic succession II: Gamma-ray logging. London: Geological Society, 81–88.
Omidpour, Armin, Moussavi-Harami, Reza, Mahboubi, Asadollah, and Rahimpour-Bonab, Hossain (2021). Application of stable isotopes, trace elements and spectral gamma-ray log in resolving high-frequency stratigraphic sequences of a mixed carbonate-siliciclastic reservoirs. Mar. Petroleum Geol. 125, 104854. doi:10.1016/j.marpetgeo.2020.104854
Patterson, William P., and Walter., Lynn M. (1994). Depletion of 13C in seawater ΣC02 on modern carbonate platforms: significance for the carbon isotopic record of carbonates. Geology 22 (10), 885–888. doi:10.1130/0091-7613(1994)022<0885:docisc>2.3.co;2
Peyravi, Bahman, Jakubavičius, Artūras, Bičkauskas, Rytis, Mazur, Kateryna, and Piven, Alyona (2021). The nexus between human resources practices, intrapreneurship and organizational innovation. Ann Arbor, Michigan, United States: ProQuest.
Peyravi, Maryam, Rahimpour-Bonab, Hossain, Nader, Fadi H., and Reza Kamali, Mohammad (2016). Chemo-stratigraphy as a tool for sequence stratigraphy of the early triassic kangan formation, north of the Persian gulf. Carbonates Evaporites 31, 163–178. doi:10.1007/s13146-015-0253-6
Peyravi, Maryam, Rahimpour-Bonab, Hossain, Nader, Fadi H., and Reza Kamali, Mohammad (2015). Dolomitization and burial history of lower triassic carbonate reservoir-rocks in the Persian Gulf (Salman offshore field). Carbonates Evaporites 30, 25–43. doi:10.1007/s13146-014-0197-2
Pillevuit, Alain (1993). Les blocs exotiques du Sultanat d'Oman: Évolution paléogéographique d'une marge passive flexurale. Lausanne, Switzerland: Université de Lausanne/Faculté des sciences/Institut de géologie et de paléontologie.
Popp, Brian N., Anderson, Thomas F., and Sandberg, Philip A. (1986). Brachiopods as indicators of original isotopic compositions in some Paleozoic limestones. Geol. Soc. Am. Bull. 97 (10), 1262–1269. doi:10.1130/0016-7606(1986)97<1262:baiooi>2.0.co;2
Pöppelreiter, M., and Marshall, E. (2013). The Khuff Formation: play elements and development history of an epicontinental carbonate platform. Permo-Triassic Sequence Arabian Plate, 387–400.
Read, J. Fred (1985). Carbonate platform facies models. AAPG Bull. 69 (1), 1–21. doi:10.1029/sc004p0079
Read, J. Fred (1998). Phanerozoic carbonate ramps from greenhouse, transitional and ice-house worlds: clues from field and modelling studies London: Geological Society, 107–135.
Robertson, A. H. F., Blome, C. D., Cooper, D. W. J., Kemp, A. E. S., and Searle, P. (1990). Evolution of the Arabian continental margin in the Dibba zone, northern Oman Mountains. London: Geological Society, 251–284.
Sarg, J. F. (1988). Carbonate sequence stratigraphy. Tulsa, Oklahoma, United States: American Association of Petroleum Geologists.
Sarg, J. F., Markello, J. R., and Weber, L. J. (1999). The second-order cycle, carbonate-platform growth, and reservoir, source, and trap prediction. McLean, VA, United States: GeoScienceWorld.
Schlager, Wolfgang. (1993). Accommodation and supply—A dual control on stratigraphic sequences. Sediment. Geol. 86 (1-2), 111–136. doi:10.1016/0037-0738(93)90136-s
Scholle, P. A. (1995). “Carbon and sulfur isotope stratigraphy of the Permian and adjacent intervals,” in The permian of northern Pangea: Volume 1: Paleogeography, paleoclimates, stratigraphy (Berlin, Germany: Springer), 133–149.
Scholle, Peter A., and Arthur, Michael A. (1980). Carbon isotope fluctuations in cretaceous pelagic limestones: potential stratigraphic and petroleum exploration tool. Aapg Bull. 64 (1), 67–87. doi:10.1306/2f91892d-16ce-11d7-8645000102c1865d
Serra, Oberto, Baldwin, J., and Quirein, J. (1980). “Theory, Interpretation, and practical applicatons of natural gamma ray spectroscopy,” in SPWLA annual logging symposium (Houston, TX, United States: SPWLA).
Sharifi-Yazdi, M., Rahimpour-Bonab, H., Tavakoli, V., Nazemi, M., and Kamali, M. R. (2019). Linking diagenetic history to depositional attributes in a high-frequency sequence stratigraphic framework: A case from upper jurassic arab Formation in the central Persian gulf. J. Afr. Earth Sci. 153, 91–110. doi:10.1016/j.jafrearsci.2019.02.006
Sharland, P. R., Archer, R., Casey, D. M., Davies, R. B., Hall, S. H., Heward, A. P., et al. (2001). Arabian plate sequence stratigraphy. Al Khobar , Saudi Arabia: GeoArabia.
Swart, Peter K., and Gregor, Eberli. (2005). The nature of the δ13C of periplatform sediments: implications for stratigraphy and the global carbon cycle. Sediment. Geol. 175 (1-4), 115–129. doi:10.1016/j.sedgeo.2004.12.029
Swart, Peter K., Reijmer, John J. G., and Otto, Robert (2009). A re-evaluation of facies on great bahama bank II: variations in the δ13c, δ18o and mineralogy of surface sediments. Perspect. carbonate Geol. A tribute career Robert Nathan Ginsburg, 47–59.
Swart, P. K., and Kennedy, M. J. (2012). Does the global stratigraphic reproducibility of δ13C in neoproterozoic carbonates require a marine origin? A pliocene–pleistocene comparison. Geology 40 (1), 87–90. doi:10.1130/g32538.1
Tavakoli, V. (2017). Application of gamma deviation log (GDL) in sequence stratigraphy of carbonate strata, an example from offshore Persian Gulf, Iran. J. Petroleum Sci. Eng. 156, 868–876. doi:10.1016/j.petrol.2017.06.069
Vahrenkamp, Volker C. (1996). Carbon isotope stratigraphy of the upper kharaib and shuaiba formations: implications for the early cretaceous evolution of the arabian gulf region. AAPG Bull. 80 (5), 647–661. doi:10.1306/64ed8868-1724-11d7-8645000102c1865d
Vail, Peter R., Mitchum, R. M., and Thompson, Sam (1977). Seismic stratigraphy and global changes of sea level: Part 4. Global cycles of relative changes of sea level. McLean, VA, United States: GeoScienceWorld, 83–97.
Vail, Peter R. (1987). Seismic stratigraphy interpretation using sequence stratigraphy: part 1: seismic stratigraphy interpretation procedure. AAPG Stud. Geol. 1, 1–10.
Van Wagoner, , John, C., Posamentier, H. W., Mitchum, R. M. J., Vail, P. R., Sarg, J. F., et al. (1988). An overview of the fundamentals of sequence stratigraphy and key definitions. McLean, VA, United States: GeoScienceWorld.
Vaslet, Denis, Yves-Michel, Le Nindre, Vachard, Daniel, Jean, Broutin, Crasquin-Soleau, Sylvie, Berthelin, Martine, et al. (2005). The permian-triassic Khuff Formation of central Saudi Arabia. GeoArabia 10 (4), 77–134. doi:10.2113/geoarabia100477
Veizer, Jan, Ala, Davin, Azmy, Karem, Bruckschen, Peter, Buhl, Dieter, Frank, Bruhn, et al. (1999). 87Sr/86Sr, δ13C and δ18O evolution of Phanerozoic seawater. Chem. Geol. 161 (1-3), 59–88. doi:10.1016/s0009-2541(99)00081-9
Walz, Lisa, Aigner, Thomas, and Koehrer, Bastian (2013). Khuff sequence KS5 outcrop-equivalents in the Oman Mountains, sultanate of Oman: variations to the simple “layer-cake” stratigraphy. GeoArabia 18 (4), 179–218. doi:10.2113/geoarabia1804179
Weber, Jon N., and Schmalz, R. F. (1968). Factors affecting the carbon and oxygen isotopic composition of marine carbonate sediments; Part III, Eniwetok Atoll. J. Sediment. Res. 38 (4), 1270–1279. doi:10.1306/74d71b4f-2b21-11d7-8648000102c1865d
Keywords: carbon isotope, oxygen isotope, uranium, total gamma-ray, Mahil Formation, Khuff Formation
Citation: Moustafa MSH, Al Raqaishi R, El-Ghali MAK, Gharbi M, Abbasi IA, Al Humaidi A, Al Ghafri N, Alshukaili MM and Al-Awah H (2023) Gamma-ray, stable carbon and oxygen isotope chemostratigraphy and sequence stratigraphy of the Lower Mahil Formation (KS-1 Khuff-Equivalent), Northern Oman. Front. Earth Sci. 11:1270795. doi: 10.3389/feart.2023.1270795
Received: 01 August 2023; Accepted: 07 September 2023;
Published: 28 September 2023.
Edited by:
Yadong Sun, University of Erlangen Nuremberg, GermanyReviewed by:
Vahid Tavakoli, University of Tehran, IranSherif Farouk, Egyptian Petroleum Research Institute, Egypt
Copyright © 2023 Moustafa, Al Raqaishi, El-Ghali, Gharbi, Abbasi, Al Humaidi, Al Ghafri, Alshukaili and Al-Awah. This is an open-access article distributed under the terms of the Creative Commons Attribution License (CC BY). The use, distribution or reproduction in other forums is permitted, provided the original author(s) and the copyright owner(s) are credited and that the original publication in this journal is cited, in accordance with accepted academic practice. No use, distribution or reproduction is permitted which does not comply with these terms.
*Correspondence: Hezam Al-Awah, hezam@qu.edu.qa