Diversity of Mesopelagic Fishes in the Southern Ocean - A Phylogeographic Perspective Using DNA Barcoding
 Henrik Christiansen1*
  Agnès Dettai2
  Franz M. Heindler1
  Martin A. Collins3
  Guy Duhamel4
  Mélyne Hautecoeur4
  Dirk Steinke5,6
  Filip A. M. Volckaert1
  Anton P. Van de Putte1,7
- 1Laboratory of Biodiversity and Evolutionary Genomics, KU Leuven, Leuven, Belgium
- 2UMR 7205 ISYEB CNRS-MNHN-Sorbonne Universite-EPHE, Département Systématique et Évolution, Muséum National d'Histoire Naturelle, Paris, France
- 3Centre for Environment, Fisheries and Aquaculture Science, Lowestoft, United Kingdom
- 4UMR 7208 BOREA, Département Milieux et Peuplements Aquatiques, Muséum National d'Histoire Naturelle, Paris, France
- 5Centre for Biodiversity Genomics, University of Guelph, Guelph, ON, Canada
- 6Department of Integrative Biology, University of Guelph, Guelph, ON, Canada
- 7OD Nature, Royal Belgian Institute of Natural Sciences, Brussels, Belgium
Small mesopelagic fish are ubiquitous in the ocean, representing an important trophic link between zooplankton and tertiary consumers such as larger fish, marine mammals and birds. Lanternfishes (Myctophidae) are common worldwide as well as in the Southern Ocean. However, only 17 of the approximately 250 myctophid species occur exclusively in sub-Antarctic or Antarctic waters. It is unclear whether they colonized these latitudes once and diversified from there, or whether multiple colonization events took place in which multiple ancestral phenotypes entered the Southern Ocean at various times. Phylogeographic patterns have been investigated for individual myctophid species, but so far no study has compared species across the Southern Ocean. Here, we present a dataset with previously unpublished cytochrome c oxidase I (COI; n = 299) and rhodopsin (rh1; n = 87) gene sequences from specimens collected at various locations in the Southern Ocean. Our data extend the DNA barcode library of Antarctic mesopelagic fish substantially. Combined morphological and molecular taxonomy lead to confident species level identification in 271 out of 299 cases, providing a robust reference dataset for specimen identification, independently of incomplete morphological characters. This is highly topical in light of prospective ecological metabarcoding studies. Unambiguous sequences were subsequently combined with publicly available sequences of the global DNA barcode library yielding a dataset of over 1,000 individuals for phylogenetic and phylogeographic inference. Maximum likelihood trees were compared with results of recent studies and with the geographical origin of the samples. As expected for these markers, deep phylogenetic relationships remain partially unclear. However, COI offers unmatched sample and taxon coverage and our results at the subfamily to genus level concur to a large extent with other studies. Southern Ocean myctophids are from at least three distant subfamilies suggesting that colonization has occurred repeatedly. Overall, spatial divergence of myctophids is rare, potentially due to their enormous abundance and the homogenizing force of ocean currents. However, we highlight potential (pseudo-)cryptic or unrecognized species in Gymnoscopelus bolini, Lampanyctus achirus, and the non-myctophid genus Bathylagus.
Introduction
The mesopelagic fauna of the world's oceans is dominated by ubiquitous small filter feeding fish. These fishes likely represent a total biomass of up to 10 billion tons and include the perhaps most abundant vertebrate species on earth, Cyclothone sp. (Irigoien et al., 2014; Proud et al., 2018). Approximately 90% of all small mesopelagic fishes belong to the bristlemouths (Gonostomatidae) and lanternfishes (Myctophidae). They form an important trophic link between primary consumers (predominantly mesozooplankton) and higher trophic levels such as large fish, squid, marine mammals, and birds (Smith et al., 2011a). Most small mesopelagic fish, which are generally found in the zone between approximately 200 and 1,000 m, undertake a diurnal vertical migration following their prey into the epipelagic zone to feed at night (Isaacs et al., 1974). During daytime they retreat into the deep again, where they digest and excrete, which likely results in a substantial vertical carbon flux (Irigoien et al., 2014). Sonar reflections of their swim bladders cause the oceanic deep scattering layer (Barham, 1966). However, despite their importance for marine food webs and organic carbon cycling, small mesopelagic fish are largely understudied.
The sub-Antarctic and Antarctic waters of the Southern Ocean are of particular importance both for global climate through ocean circulation and as a relatively pristine sanctuary for marine biodiversity. The Southern Ocean harbors considerable biodiversity (Brandt et al., 2007; Griffiths, 2010), although species richness of fish is low compared to temperate and tropical seas with 322 currently recognized species from 19 families (Eastman, 2005). Nevertheless, the Southern Ocean has been identified as an evolutionary hotspot, particularly because of the morphological and ecological diversity of species and a high degree of endemism, which amounts to 88% in fish (Eastman, 1991, 2005). It is believed that a key factor for such evolutionary uniqueness is the relative isolation of the Southern Ocean fauna, initiated approximately 24–25 mya by the formation of the Antarctic Circumpolar Current (ACC), a system of ocean currents flowing around Antarctica from West to East between 50° and 60° South (Eastman, 1991; Rintoul et al., 2001; Lyle et al., 2007). The ACC is the dominant hydrographic feature in the Southern Ocean (Orsi et al., 1995), and by providing a continuous, strong flow it forms a variable, but permanent boundary between Antarctic waters and water masses of lower latitudes (Rintoul et al., 2001). This greatly hampers any possible north-south (or south-north) migration of organisms. However, Saunders et al. (2017) recently showed that lanternfish biomass in the Scotia and Weddell Sea must be supported by mass immigration from lower latitudes. The mesopelagic zone in temperate regions is generally strongly stratified and includes a distinct thermocline. Temperatures tend to range between 2° and 15°C with the upper layer being warmer and well mixed, followed by a sharp decrease in temperature at the thermocline (at around 50–400 m) and a gradual decrease of temperature with increasing depth. In contrast, the Southern Ocean is relatively well-mixed with temperatures ranging between −0.5 and 2.0°C (Ikeda, 1988). Temperatures at 1,000 m depth are therefore similar in temperate and Antarctic regions, whereas temperatures of upper water masses are very different.
Although less abundant than at lower latitudes, mesopelagic fish are still numerous in Antarctic and sub-Antarctic waters and represent a major part of the biomass (Eastman, 1993). In terms of species richness, abundance, and biomass, the mesopelagic zone there is dominated by lanternfishes (Myctophidae) (Donnelly et al., 1990; Kock, 1992). Myctophids are common in oceanic waters north of the Antarctic Slope Front (ASF; near the Antarctic continental shelf break), where they act as largely opportunistic mesozooplankton feeders with some interspecific dietary variation (Pakhomov et al., 1996; Pusch et al., 2004; Connan et al., 2010; Saunders et al., 2014, 2015). Charismatic Antarctic top predators such as king penguin (Cherel et al., 2009), Antarctic fur seals (Casaux et al., 2011; Santora, 2013), and seabirds (Connan et al., 2007) heavily rely on myctophids as a food source. Despite their small size some myctophid species (Gymnoscopelus spp., Electrona carlsbergi) were commercially exploited in the 1980s (Hulley, 1990; Kock, 1992). Of the approximately 240 myctophid species recognized worldwide, 68 have been recorded south of the Sub-Tropical Front, 15 of which have a Sub-Antarctic and two an Antarctic distribution pattern (Duhamel et al., 2014). The remaining species exhibit widespread distribution patterns and only sporadically occur in the Southern Ocean.
Ecological studies are dependent on accurate biological identification to a level of taxonomic resolution appropriate for the study goal (Tautz et al., 2003). In myctophids, photophore patterns are mainly used to distinguish species. However, accurate identification can be impeded, because myctophids tend to lose scales during capture and are easily damaged in the net. The identification of early life stages may also be challenging. DNA barcoding is a molecular technique that uses the mitochondrial cytochrome c oxidase I gene (COI) as a genetic marker to provide biological identifications (Hebert et al., 2003). The system is now widely accepted and many taxa, including teleosts, have been successfully integrated in barcoding initiatives and data systems (Ratnasingham and Hebert, 2007, 2013; Ward et al., 2009). A sufficiently complete reference dataset of DNA barcodes thus enables fast and efficient verifications for morphologically identified specimens as long as COI exhibits levels of interspecific divergence that are higher than the intraspecific divergence of a given group. Furthermore, it can assist with the discovery of misidentified specimens, cryptic or simply not yet identified new species, help settle synonymies, or hint at intraspecific genetic structuring (Hajibabaei et al., 2007; see Bucklin et al., 2011 for an extended overview of marine barcoding applications). The latter can be used in phylogeography, a discipline concerned with phylogenetic relatedness and connectivity of species or populations with respect to geographic distribution. Genetic distance, derived from markers such as COI, is used to study the historical processes that may be responsible for the contemporary geographic distribution of individuals. In order to increase robustness of results derived from COI data, it can be useful to include an additional genetic marker, particularly nuclear and thus biparentally inherited (Cao et al., 2016; Thiel and Knebelsberger, 2016). Rhodopsin belongs to a family of genes, the so called G-protein-coupled receptors, that are involved in translating external information (e.g., light, molecules) into internal signals that can be processed by organisms. Rhodopsin encodes a protein that is involved in photoreception (Palczewski et al., 2000). It occurs on the rod cells and is extremely light sensitive enabling vision under low-light conditions (Yokoyama and Yokoyama, 1996). In Actinopterygians, the rhodopsin gene generally occurs in two copies, homologous to other vertebrates. One copy, rh1, is an intronless retrogene that does not recombine anymore with other opsins and has proven useful for fish identification and phylogeny (Fitzgibbon et al., 1995; Chen et al., 2003; Lin et al., 2017; Morrow et al., 2017).
Less than a decade ago Grant and Linse (2009) recognized a lack of Antarctic barcoding studies. The Census of Antarctic Marine Life (CAML) set an explicit focus on DNA barcoding, resulting in many studies making significant progress in addressing this gap (Schiaparelli et al., 2013 and references therein). Over the past few years, Antarctic barcoding demonstrated the usefulness of COI sequencing e.g., to identify Trematomus fishes (Lautredou et al., 2010), and showcased the presence of cryptic species in various groups, e.g., pycnogonids (Krabbe et al., 2010), amphipods (Havermans et al., 2011), octopuses (Allcock et al., 2011), skates (Smith et al., 2008), and grenadier fishes (Smith et al., 2011b; McMillan et al., 2012). These examples clearly demonstrate that despite the fact that Antarctic biodiversity is still underexplored (Grant et al., 2010; Griffiths, 2010), molecular techniques can enhance our understanding of contemporary diversity patterns and the processes that shaped these (Allcock and Strugnell, 2012). Fish communities of the Southern Ocean have been studied using DNA barcoding, but these studies primarily focused on benthic fish in the Scotia Sea (Rock et al., 2008), Dumont D'Urville Sea (Dettaï et al., 2011), and Ross Sea (Smith et al., 2012). Phylogeographic patterns of myctophids have been investigated for a few species (e.g., Electrona antarctica, Van de Putte et al., 2012), but to date no study has compared species across the Southern Ocean. Here, we present an extensive DNA barcoding approach to investigate the ecologically relevant community of Antarctic mesopelagic fish.
Our objectives were, (1) to extend the DNA barcode library of Antarctic mesopelagic fish, (2) to assess the success of specimen identification using this system, (3) to discover potential mismatches between taxonomy and genetic identification, (4) to compare our Antarctic myctophid phylogenetic data with recent myctophid phylogenies, and (5) to investigate phylogeographic patterns of common Antarctic myctophids. To achieve these objectives, we used a large-scale dataset of mesopelagic Antarctic fish, covering over 1,000 specimens from a circum-Antarctic sampling range. This dataset includes 386 new samples and combines these with publicly available sequences found on the Barcode of Life Data Systems, BOLD (Ratnasingham and Hebert, 2007). We focused on the analysis of COI, but extended our results by incorporating an additional nuclear marker (rh1). Thus, a comprehensive picture on the inter- and intraspecific diversity of mesopelagic fishes occurring in the Southern Ocean was drawn.
Materials and Methods
Sampling and Identification
Mesopelagic fish were captured in the Southern Ocean and sub-Antarctic waters during various expeditions. The sampling effort comprised cruise 200 with RV James Clark Ross (see Collins et al., 2012b), cruises PS65 and PS69 with RV Polarstern, BROKE-West with RV Aurora Australis and additional Atlantic samples collected with RV G.O. Sars (BOLD project FISCO); the POKER sampling campaign 2010 off Kerguelen and additional Pacific samples from the JAMSTEC survey with RV Hakuho Maru (BOLD project MYCSO); cruises JR100 (Collins et al., 2008), JR161 and JR177 (Collins et al., 2012b) with RV James Clark Ross and few specimens from commercial vessels (BOLD project BASMF); and finally 23 myctophid specimens collected off South Africa (BOLD project DSSAU). Samples from the Atlantic and Pacific Oceans were included to provide an outgroup framework. Overall, these sampling efforts yielded a total of 386 previously unpublished specimens (Table 1). All specimens were identified morphologically aboard the research vessels or, in absence of a taxonomic expert, immediately frozen or preserved whole in high-grade ethanol or formalin and identified at the respective institutions. Muscle tissue or fin biopsies were excised using sterile tools and stored in ethanol. In most cases identifications were carried out to species level and only in some instances to family or genus level (juvenile/larval or severely damaged specimens). The majority of specimens are stored at the Muséum National d'Histoire Naturelle (MNHN, Paris), KU Leuven (Belgium), the British Antarctic Survey (BAS, Cambridge) or the National History Museum (NHM, London), and the South African Institute for Aquatic Biodiversity (Grahamstown), respectively. Detailed collection data of all specimens are shown in Supplementary Table S1.
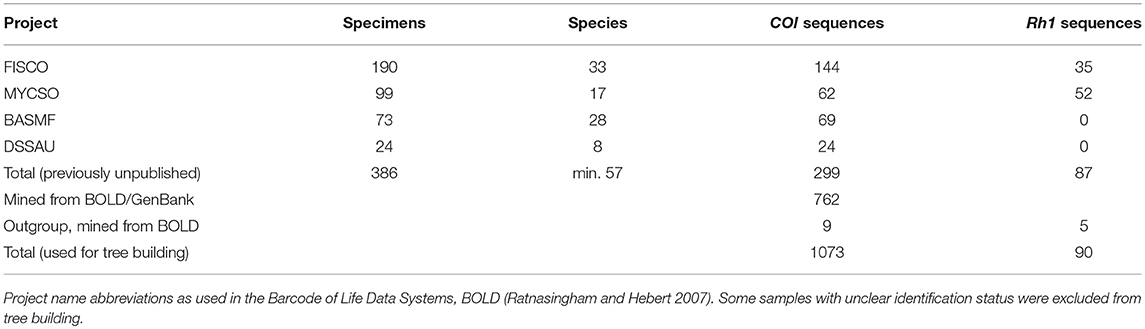
Table 1. Overview of fish specimens and species and the respective numbers of DNA sequences that were successfully obtained for the cytochrome c oxidase I (COI) and rhodopsin (rh1) gene.
DNA Extraction, PCR and Sequencing
DNA was extracted from the tissue sample using a modified standard salting-out protocol (Cruz et al., 2016). Extracts from the datasets FISCO, BASMF, and DSSAU were subsequently shipped to the University of Guelph, Canada, for COI amplification and sequencing following protocols described in Steinke and Hanner (2011). Primers used for COI were the cocktails C FishF1t1-C FishR1t1 as described in Ivanova et al. (2007). Rhodopsin gene fragments (rh1) were amplified using Rh193-5′CNTATGAATAYCCTCAGTACTACC3′ and Rh1039r-5′ TGCTTGTTCATGCAGATGTAGA3′ primers (Chen et al., 2003). Amplification was conducted in 25 μl volume with 0.2 mM dNTP's, 2.5 mM MgO2, 20 μM primer mix, and conventional PCR buffer and Taq polymerase. PCR conditions were 2 min initial denaturation at 94°C, followed by 30–40 cycles of 20 s at 94°C, 30 s at 50–60°C, 70 s at 72°C, and a final 3 min elongation at 72°C. The MYCSO COI and rh1 dataset was generated at MNHN (France) following Dettaï et al. (2011) for extraction, PCR, and sequencing using standard automatic capillary sequencers. Additional rh1 sequences were generated at KU Leuven (Belgium) for the FISCO samples following the same protocol.
Dataset Augmentation and Trimming and Phylogenetic Statistics
We were able to retrieve 299 COI and 87 rh1 sequences of 308 specimens from 16 locations (Table 1, Figure 1). These sequences were deposited in the BOLD datasets: “Fishes of the Scotia Sea” (FISCO), “Myctophids of the Southern Ocean” (MYCSO), “BASMF,” and “DSSAU.” To increase taxonomic and spatio-temporal coverage our unpublished dataset was extended with publicly available data from BOLD/GenBank including some previously published Antarctic COI barcode sets: Rock et al. (2008) (samples from the Scotia Sea, South Orkney Islands, and Elephant Island), Mabragaña et al. (2011) (Argentina), Smith et al. (2012) (Ross Sea, Heard and McDonald Islands and more). Altogether, sequences cover an unprecedented area of the Southern Ocean, although many regions remain underrepresented (Figure 1). This can be attributed to the enormous logistic and financial challenges posed by Antarctic exploration. Species identity of all previously unpublished specimens from the Southern Ocean dataset was confirmed using internal tools of BOLD (Ratnasingham and Hebert, 2007) using all available COI sequences > 500 bp with species level identification on 15th December 2017. If molecular and morphological identification did not match, a second morphological examination was performed and only specimens that were attributed to the species identified by BOLD were kept as such. In addition, in case of any doubt, e.g., the absence of crucial morphological characters, the specimen was excluded from further analysis.
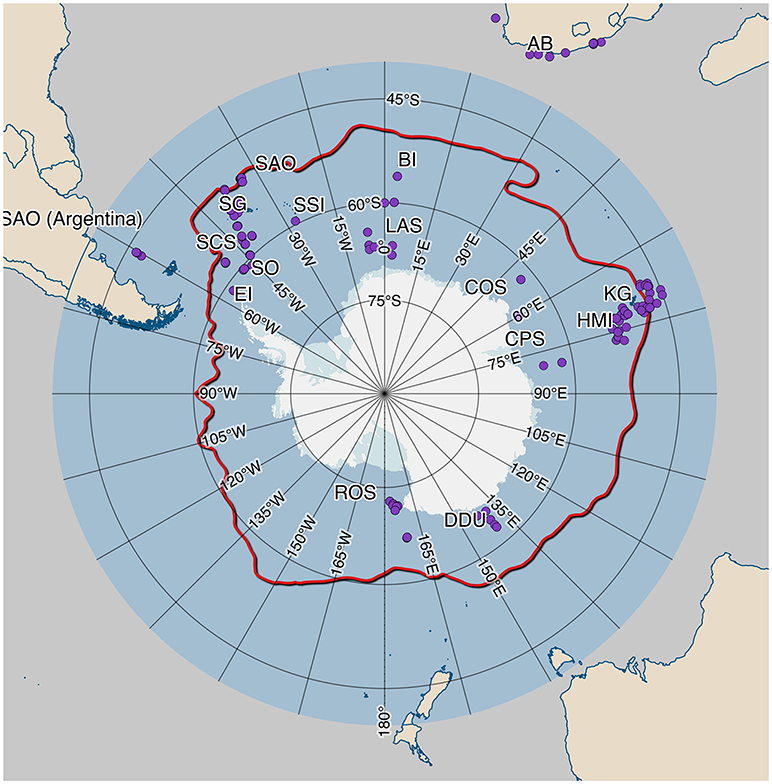
Figure 1. Locations of mesopelagic fish sampled in the Southern Ocean and subsequently used for DNA barcoding. The bold, red line marks the approximate position of the Antarctic Polar Front. Location codes are (approx. clockwise from West to East Antarctic): SAO, South Atlantic Ocean; SCS, Scotia Sea; EI, Elephant Island; SO, South Orkney Islands; SG, South Georgia Islands; SSI, South Sandwich Islands; BI, Bouvet Island; LAS, Lazarev Sea; AB, Agulhas Bank (off South Africa); COS, Cosmonauts Sea; CPS, Cooperation Sea; KG, Kerguelen Islands; HMI, Heard and McDonald Islands; DDU, Dumont d'Urville Sea; ROS, Ross Sea.
Sequences from five Synodotus binotatus (two-spot lizardfish) specimens curated on BOLD were included for both COI and rh1. Synodus binotatus is an aulopiform fish, the order with closest common ancestor to myctophiform fishes (Betancur et al., 2017). These sequences were used as outgroup for phylogenetic tree rooting. Two COI sequences each of Neoscopelus macrolepidotus and N. microchir (Neoscopelidae (blackchins), the other family in Myctophiformes, next to Myctophidae) were also included. No rh1 sequences of Neoscopelidae were available. Three different datasets were used for phylogenetic reconstruction: (1) all available COI sequences (new sequences, published myctophid sequences, and outgroup; total N = 1073); (2) all available rh1 sequences (new sequences and outgroup; N = 90); and (3) a concatenated dataset consisting of specimens from (1) and (2) for which good quality sequences of COI and rh1 were available (N = 68, including outgroup). Sequences were aligned via MUSCLE (Edgar, 2004) within Geneious v.8.1.5 (Biomatters Ltd) using a maximum of eight iterations and standard preset values. Tree building was performed in R v3.1.2 (R Core Team, 2016) using the packages “ape” (Paradis et al., 2004; Popescu et al., 2012) and “phangorn” (Schliep, 2011). Kimura's two-parameter substitution model (Kimura, 1980) is commonly used in DNA barcoding studies to construct genetic distance matrices, although the fit might be poor (Collins et al., 2012a). We decided to assess a variety of nucleotide substitution models with phangorn's “modelTest” function. The most appropriate model for all three datasets as determined by Akaike's information criterion (AIC) was the general time reversible model with gamma distributed rate variation among sites and a proportion of invariable sites (“GTR+G+I”). This substitution model was used as initial fit and for subsequent maximum likelihood (ML) optimization using a stochastic algorithm instead of nearest-neighbor-interchange to avoid local maxima. Edge support was evaluated with 10,000 randomly seeded bootstraps. Consensus trees were created in Geneious with a support threshold of 70% (Hillis and Bull, 1993) and were subsequently manually checked and annotated using MEGA7 v7.0.26 (Kumar et al., 2016). COI haplotype networks were created by median joining (Bandelt et al., 1999) in popART v.1.7 (Leigh and Bryant, 2015).
Results
Extension of the DNA Barcode Library
Mesopelagic fish of various research expeditions were identified, cataloged, and when possible sequenced for COI and/or rh1. In some cases (not listed here) sequencing was impossible due to DNA degradation or amplification failure. Overall, 297 reliable COI sequences were added to BOLD after rigorous validation and exclusion of doubtful samples (two samples excluded, see below). Some of these sequences belong to larval, juvenile or incidentally caught fishes whose adult stages are generally not mesopelagic (notothenioids, grenadiers), leaving 264 Antarctic meso- or bathypelagic specimens from 35 different species with validated identification and COI sequences—a biogeographic assemblage that was previously almost absent in the database. The worldwide database for myctophids was extended by 23.7% to a total of 1,021 sequences. Furthermore, 87 validated rh1 sequences were added to BOLD. All samples and sequence IDs and associated metadata can be found in Supplementary Table S1.
Specimen Identification
All 299 previously unpublished COI sequences were identified using BOLD data and tools (using only species level barcode records). In some instances this revealed most likely misidentified or mislabeled sequences in BOLD. If only one COI sequence of a given species on BOLD was misidentified, the identification engine will declare there was no species level match. For instance, at time of study BOLD contained 68 sequences with the Barcode Index Number (BIN; Ratnasingham and Hebert, 2013) corresponding to Electrona antarctica (Antarctic lanternfish; BOLD: AAB3737), all with low pairwise distance (average: 0.08%, maximum: 0.78%). The nearest neighbor of this BIN is Symbolophorus veranyi (large-scale lanternfish; BOLD: AAC4870; pairwise distance: 2.39%). Yet, one of the specimens in AAB3737 (E. antarctica) is labeled Nannobrachium achirus—a more distant species well represented by 27 other sequences in the clearly distinct BIN BOLD: AAB3778. In these cases we highlighted the likely misidentified or mislabeled sequences present in the database (Supplementary Table S2). Five such sequences were accessible to us and are now flagged in BOLD to avoid future misidentifications when using the database.
Using this procedure, morphological and molecular identification showed high levels of congruence (97.65%). In eleven cases the morphological identification could be confidently improved using the BOLD identification engine, as specimens were attributed at least to genus level; which was confirmed through the placement of the specimen in the phylogenetic trees. In seven further cases a mismatch between morphological and molecular identification was detected. After detailed inspection the identification was revised (Table 2). Five specimens with unclear species or genus level identification could not be matched to any available COI sequence in BOLD. However, they could be attributed to genus level based on the phylogenetic tree (highlighted in bold italics in Figure 1). Two specimens were excluded from further analysis, because COI and rh1 gave conflicting results, likely indicating contamination or similar error in the laboratory. Lastly, nine specimens had matching morphological and molecular identification, although only uni-directional sequences were obtained. These were included in phylogenetic analyses, but flagged as non-barcode compliant on BOLD.
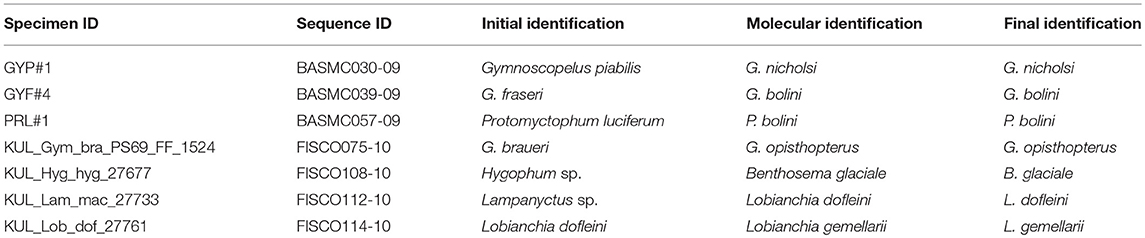
Table 2. Antarctic mesopelagic fish specimens where mismatch between morphological and molecular identification led to re-identification after detailed inspection.
Phylogeny
The curated datasets were used to produce three phylogenetic ML consensus trees: one for COI, one for rh1, and one for both combined. Sequence alignment was not problematic, as these are coding sequences without gaps. In each case “GTR+G+I” was identified as the most appropriate nucleotide substitution model. Clades with bootstrap support below 70% after consensus tree building were collapsed, i.e., these splits were not retained or displayed in the figures.
The Cytochrome C Oxidase I Gene
The dataset includes 1,073 sequences of 539 bp length with 337 variable sites. Myctophidae are not resolved as monophyletic, because the aulopiform species Notolepis coatsi (Antarctic jonasfish) and Lagiacrusichthys macropinna (previously Benthalbella macropinna, see Davis, 2015) are placed within a Lampanyctinae clade and the neoscopelid species Neoscopelus macrolepidotus and N. microchir are placed next to Notolychnus valdiviae (topside lanternfish; Figure 2). Other outgroup taxa are placed outside of Myctophidae, but their exact position is not well resolved (i.e., often <70% bootstrap support and thus displayed as polytomic). Within Myctophidae the tribe Electronini (sensu Paxton, 1972) and subfamily Gymnoscopelinae (sensu Martin et al., 2017) are monophyletic with medium bootstrap support (BS = 78 and 79%, respectively). Diaphinae (sensu Martin et al., 2017) is monophyletic as well (BS = 89%), with the exception of the inclusion of Symbolophorus boops (bogue lanternfish). The placement of these three subfamilies/tribes and the remaining genera within the Myctophidae is less clear, with bootstrap support at times below the applied cut-off threshold. Myctophid species with their main distribution range in Sub-Antarctic or Antarctic waters all belong to the three groups mentioned above, except for S. boops and Lampanyctus achirus (previously Nannobrachium achirus, see Martin et al., 2017), a bathypelagic species that was placed within a clade of Lampanyctus spp., sister group of Parvilux ingens. As the focus of this study is on (sub-)Antarctic mesopelagics, further description and discussion is restricted to these species and their position in the phylogenetic trees.
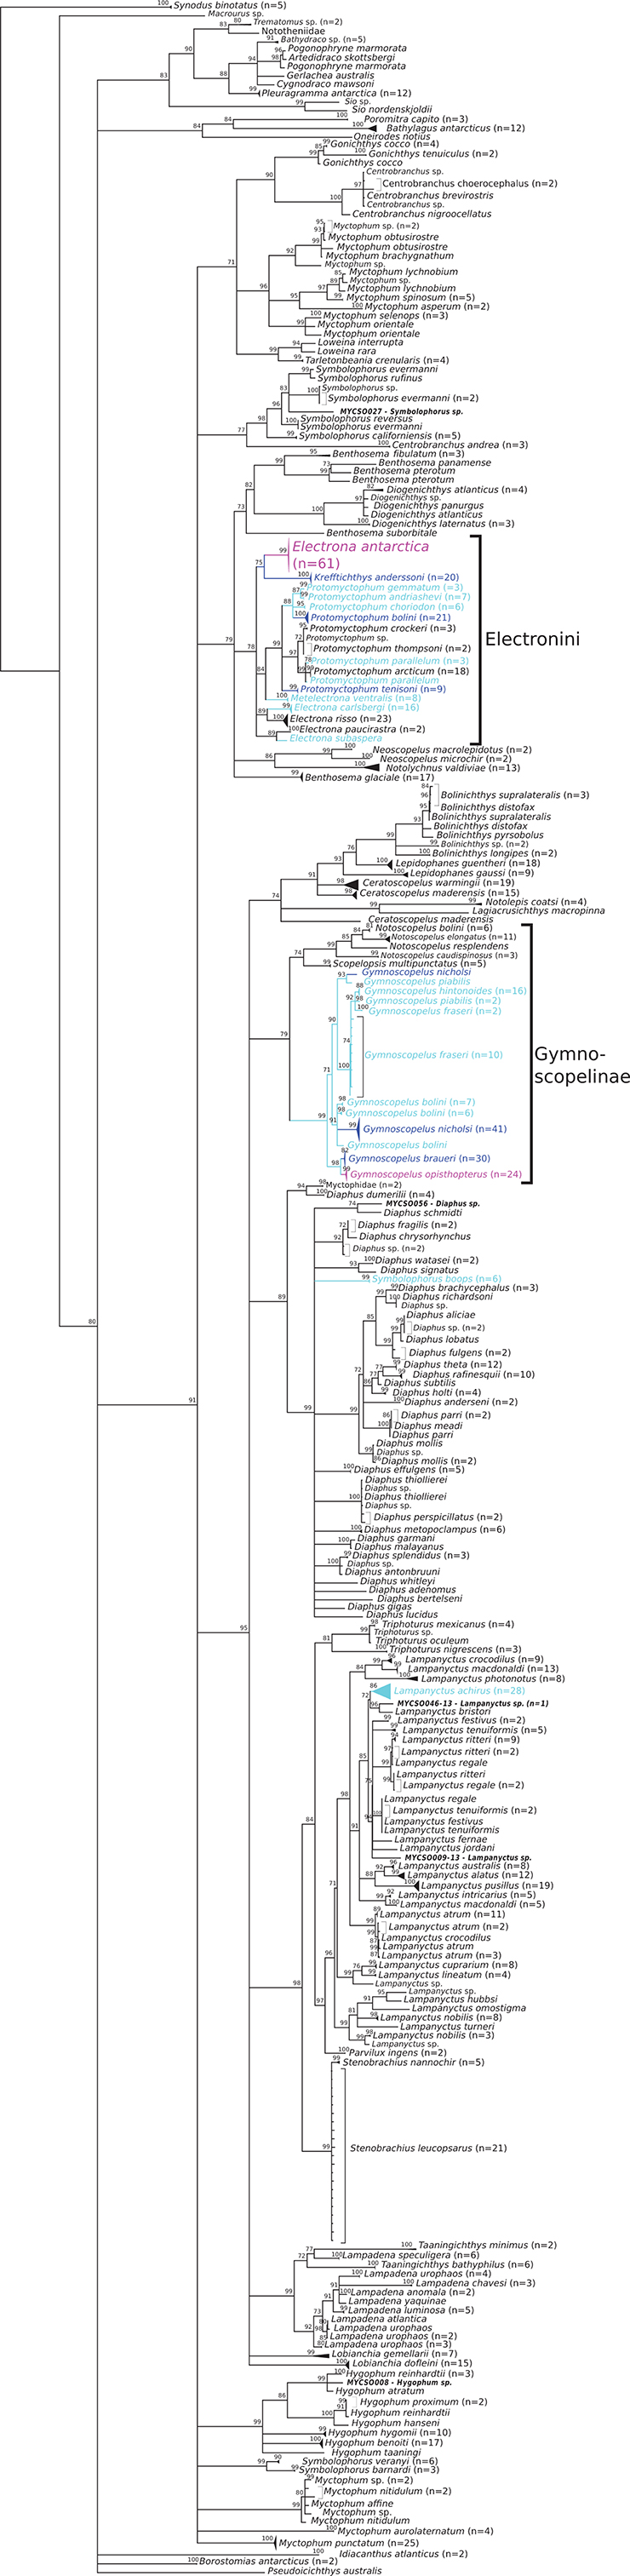
Figure 2. Phylogenetic consensus tree of myctophid fishes based on cytochrome c oxidase I (COI) gene variation using a maximum likelihood analysis with 10,000 bootstrap permutations. Bootstrap support> 70 is shown above the branches; branches with lower support are collapsed to polytomies; species with Antarctic, broadly Antarctic, and sub-Antarctic distribution pattern following Duhamel et al. (2014) are depicted in purple, dark blue, and light blue, respectively (please see online version of the article for full-scale, color figure). Number of collapsed samples noted in brackets. Samples where genus level identity was added a posteriori based on position in the tree are noted in bold italics.
Within Electronini, the position of the genera Metelectrona, Electrona, Krefftichthys, and Protomyctophum is unclear. Electrona antarctica forms a clade with K. anderssoni (BS = 75%). Metelectrona ventralis (flaccid lanternfish) is resolved as sister group (BS = 84%) to Protomyctophum, the only monophyletic genus (BS = 99%). Electrona subaspera (rough lanternfish) and E. paucirastra (belted lanternfish), and E. risso (electric lanternfish) and E. carlsbergi (electron subantarctic lanternfish), respectively, appear to be closely related (BS = 89% in both cases). Within Protomyctophum, the split into the subgenera Hierops and Protomyctophum is supported except for P. tenisoni, which is placed next to these subgenera (BS = 99%). Hierops contains P. parallelum (parallel lanternfish), P. thompsoni (bigeye lanternfish), P. arcticum (Arctic telescope), and P. crockeri (California flashlightfish) (BS = 97%) and the subgenus Protomyctophum contains P. bolini, P. choriodon, P. andriashevi, and P. gemmatum (BS = 88%).
In Gymnoscopelinae (sensu Martin et al., 2017), Gymnoscopelus is monophyletic (BS = 99%) and sister group to a clade with medium support (BS = 74%) containing Scopelopsis multipunctatus and the also monophyletic Notoscopelus (BS = 99%). Within Gymnoscopelus, two single specimens identified as G. piabilis (Southern blacktip lanternfish) and G. nicholsi (Nichol's lanternfish) form their own clade apart from all other specimens with the same identification (BS = 93%). Sister group to these is a clade comprised of G. hintonoides (false-midas lanternfish), G. piabilis, and G. fraseri (BS = 100%), in which G. hintonoides and G. piabilis are resolved as monophyletic (BS = 88 and 98%), but G. fraseri not. Gymnoscopelus bolini and G. nicholsi form a clade (BS = 91%), in which G. nicholsi is placed as one group (BS = 99%), but G. bolini as three. Lastly, G. braueri and G. opisthopterus are monophyletic sister group to all others (BS = 98%) and also monophyletic within each species (BS = 82% for G. braueri and 99% for G. opisthopterus).
The Rhodopsin Gene
The compiled rhodopsin dataset includes 90 sequences of 820 bp length including 511 variable sites. The Myctophidae are monophyletic with 100% bootstrap support (Figure 3). Diaphinae and Gymnoscopelinae are resolved as monophyletic similarly to the COI tree, but Electronini are not. However, the taxonomic sampling is much smaller than for the COI dataset and covers 21 myctophid species, whereas Duhamel et al. (2014) report 66 species that are at least occasionally recorded south of the Sub-Tropical Front.
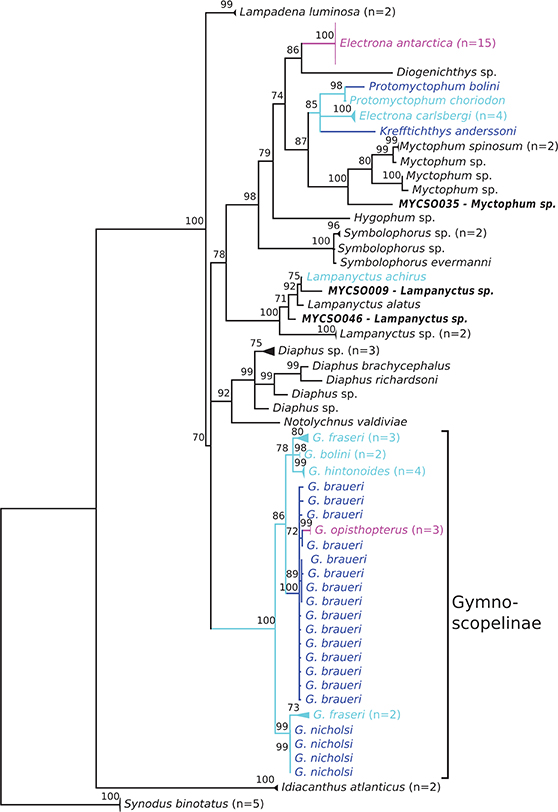
Figure 3. Phylogenetic consensus tree of myctophid fishes based rhodopsin (rh1) gene variation using a maximum likelihood analysis with 10,000 bootstrap permutations. Bootstrap support> 70 is shown above the branches; branches with lower support are collapsed to polytomies; species with Antarctic, broadly Antarctic, and sub-Antarctic distribution pattern following Duhamel et al. (2014) are depicted in purple, dark blue, and light blue, respectively (color figure available online). Number of collapsed samples noted in brackets.
Electronini are paraphyletic with the inclusion of Diogenichthys sp. and Myctophum species. Electrona antarctica is placed outside the remaining Electronini and and Myctophum spp. as sister group to Diogenichthys sp. (BS = 86%). Within the other Electronini, Kreffthichtys anderssoni, and E. carlsbergi diverge first from the monophyletic Protomyctophum (BS = 98%), represented by P. bolini and P. choriodon.
The genus Gymnoscopelus (no other Gymnoscopelinae were available for rh1) forms a monophyletic group with high bootstrap support (100%), with two G. fraseri and four G. nicholsi diverging first from all other specimens (BS = 99%). Three further G. fraseri are resolved within the remaining clade, next to G. bolini and G. hintonoides (BS = 78%) and another clade that comprises G. braueri and G. opisthopterus (BS = 100%). However, the resolved topology differs from the COI tree, although G. braueri and G. opisthopterus are resolved as sister taxa in both analyses. Lampanyctus achirus—the only other myctophid common in sub-Antarctic waters in this dataset—clusters with a clade of Lampanyctus spp. similarly to COI.
Both Markers Combined
The concatenated dataset comprises 68 specimens. In total this dataset has 795 variable sites. As expected the concatenation of both markers reduced the size of the dataset, but provided at times higher confidence in the resolved consensus topology. The Myctophidae are monophyletic with 100% bootstrap support (Figure 4). The tribe Electronini is monophyletic except for the inclusion of a Diogenichthys sp. and placed within a clade also containing Symbolophorus spp., Hygophum spp., and Myctophum species. This entire clade is a sister group of a clade containing Notolychnus valdiviae, Lampadena luminosa (luminous lanternfish), a Diaphinae clade, and a clade of Gymnoscopelus and Lampanyctus. The latter are both monophyletic with 100% bootstrap support.
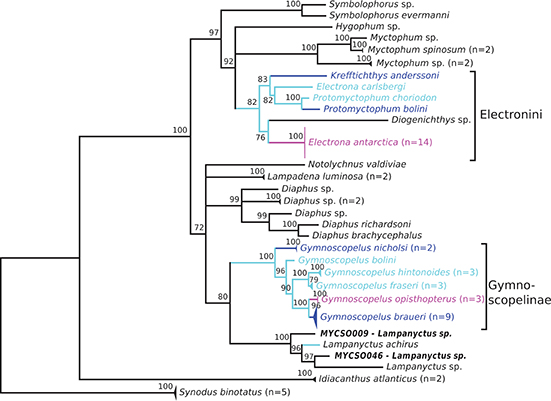
Figure 4. Phylogenetic consensus tree of myctophid fishes based on cytochrome c oxidase I (COI) and rhodopsin (rh1) gene variation using a maximum likelihood analysis with 10,000 bootstrap permutations. Bootstrap support> 70 is shown above the branches; branches with lower support are collapsed to polytomies; species with Antarctic, broadly Antarctic, and sub-Antarctic distribution pattern following Duhamel et al. (2014) are depicted in purple, dark blue, and light blue, respectively (color figure available online). Number of collapsed samples noted in brackets.
Within the Electronini a clade comprising E. antarctica and the single Diogenichthys sample diverges first from the remaining samples. Krefftichthys anderssoni is sister group to a clade with E. carlsbergi and the remaining Protomyctophum (P. bolini and P. choriodon). Hence, Protomyctophum is monophyletic (BS = 100%), but Electrona and Krefftichthys are not. Diaphinae are monophyletic, but only D. richardsoni, D. brachycephalus (short-headed lanternfish), and unidentified Diaphus spp. are included; therefore, further inferences are impossible.
Gymnoscopelinae (although only Gymnoscopelus is present in this dataset, neither Scopelopsis nor Notoscopelus) is resolved as monophyletic with 100% bootstrap support. Within Gymnoscopelus, G. nicholsi diverges first from other taxa, with high support (BS = 100%). Gymnoscopelus bolini is sister group (BS = 96%) to a clade that contains two other clades, with G. fraseri and G. hintonoides (BS = 100%) and G. braueri and G. opisthopterus (BS = 100%), respectively. Lampanyctus achirus is again placed inside a clade of Lampanyctus spp., here sister group of the Gymnoscopelus clade (BS = 80%). Sister to these two clades are the Diaphinae, Notolychnus valdivae, and two samples of Lampadena luminosa.
Phylogeography and Cryptic Species
In addition to further parameterizing the BOLD database and investigating phylogenetic relationships of particularly sub-Antarctic and Antarctic myctophids, our data was used to identify phylogeographic diversity patterns of Southern Ocean myctophids. These analyses focused on the largest dataset, COI, and mainly on species of the tribe Electronini and the subfamily Gymnoscopelinae, comprising 203 specimens from 16 species and 167 specimens from 12 species, respectively. They were plotted as sub-trees of the COI tree (Figure 2) with all (sub-) Antarctic species coded corresponding to sampling locality and associated haplotype networks (Figures 5, 6; codes as in Figure 1). The geographical coverage within species varies from circum-Antarctic to only a few single sites. In general, these data cover specimens of most waters around Antarctica, as well as more northerly areas (Scotia Sea, South Atlantic Ocean north of the Scotia Sea and off Argentina, waters around Bouvet Island, and the Kerguelen and Heard and McDonald Islands plateaus, and off South Africa; Figure 1). Lampanyctus achirus is not resolved as a single clade, but rather two groups – one with seven individuals caught off South Africa, and one with 21 individuals from the Ross Sea, Dumont d'Urville Sea, Scotia Sea, Kerguelen Islands, and also one individual from South Africa (Supplementary Figure S1). Symbolophorus boops is resolved as group of six individuals with low COI variation. Phylogeographic patterns of the other (sub-) Antarctic myctophids are discussed by tribe/subfamily below.
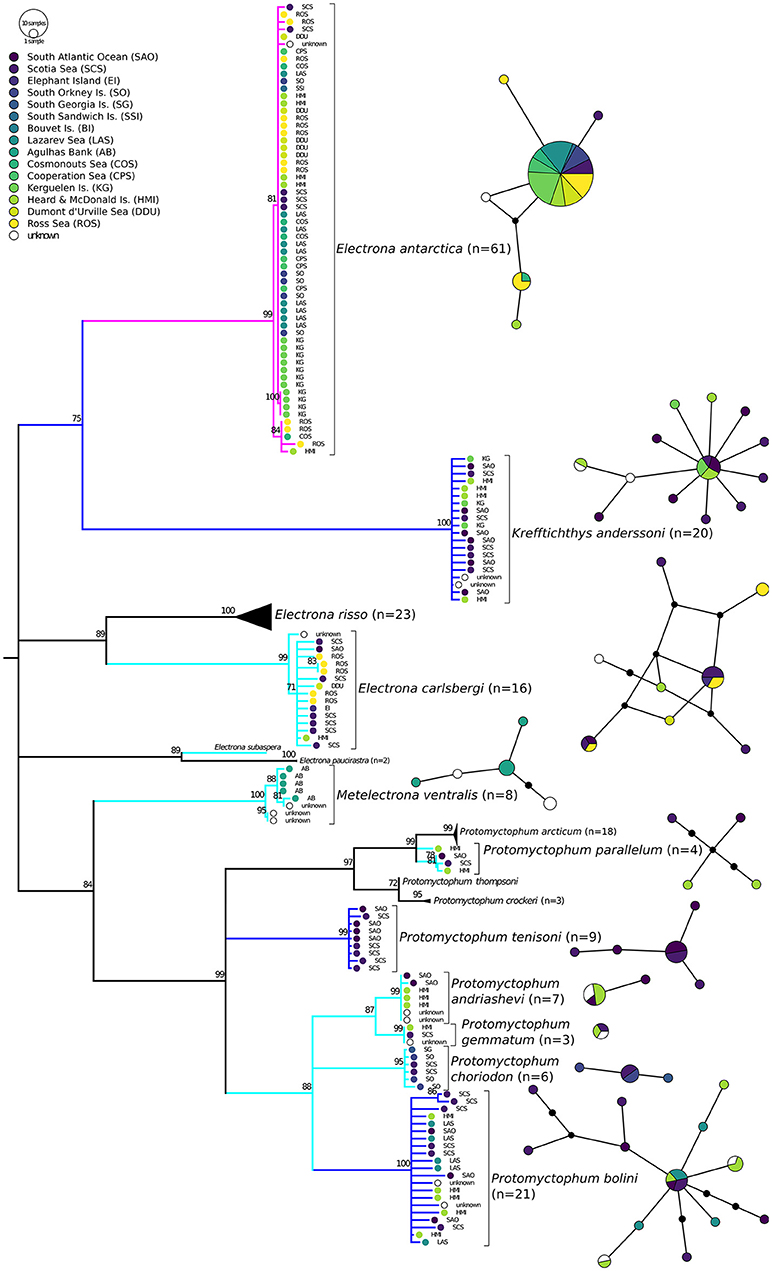
Figure 5. Haplotype networks and phylogenetic consensus tree of myctophid fishes of the tribe Electronini (sensu Paxton, 1972) based on cytochrome c oxidase I (COI) gene variation using a maximum likelihood analysis with 10,000 bootstrap permutations. Bootstrap support> 70 is shown above the branches; branches with lower support are collapsed to polytomies. Branches of species with Antarctic, broadly Antarctic, and sub-Antarctic distribution pattern following Duhamel et al. (2014) are depicted in purple, dark blue, and light blue, respectively (color figure available online). Geographic origin is reflected by colored circles in the tree and networks, approx. clockwise from West (dark) to East Antarctic (light). In the haplotype networks one branch represents one mutation. Additional mutation steps between samples are indicated with small black circles.
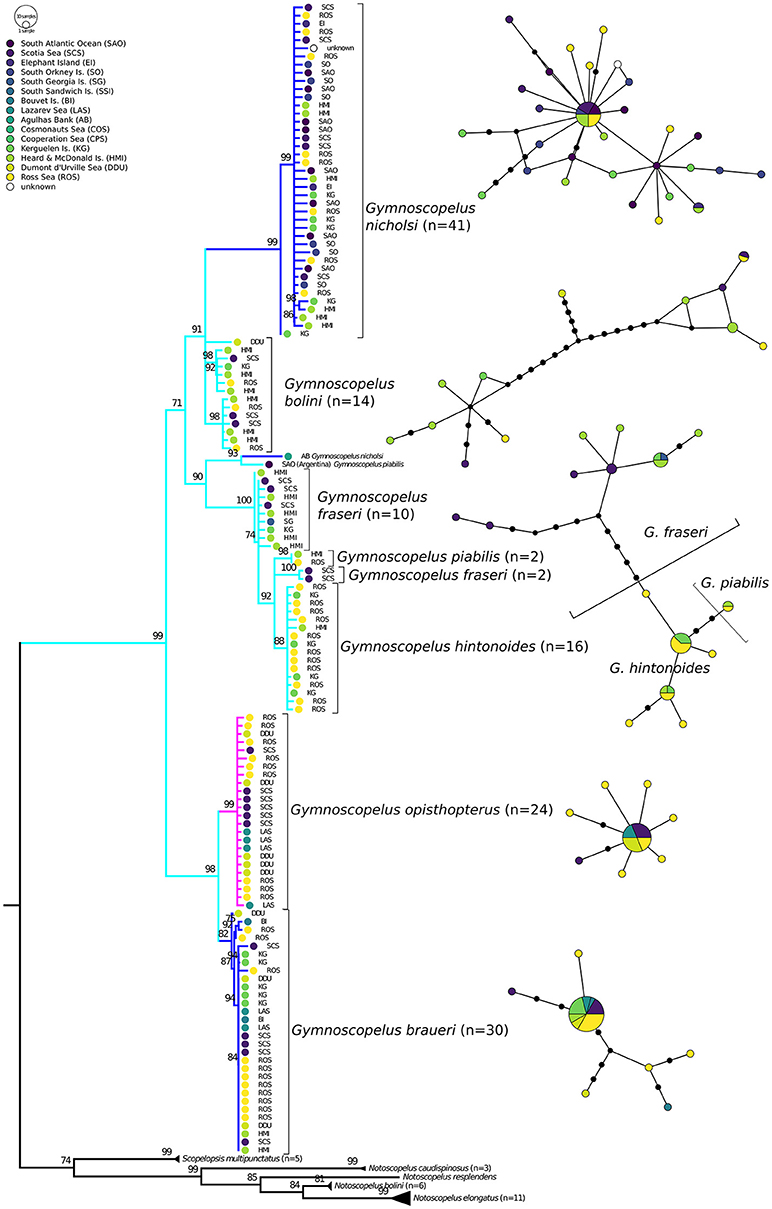
Figure 6. Haplotype networks and phylogenetic consensus tree of myctophid fishes of the subfamily Gymnoscopelinae (sensu Martin et al., 2017) based on cytochrome c oxidase I (COI) gene variation using a maximum likelihood analysis with 10,000 bootstrap permutations. Bootstrap support> 70 is shown above the branches; branches with lower support are collapsed to polytomies. Branches of species with Antarctic, broadly Antarctic, and sub-Antarctic distribution pattern following Duhamel et al. (2014) are depicted in purple, dark blue, and light blue, respectively (color figure available online). Geographic origin is reflected by colored circles in the tree and networks, approx. clockwise from West (dark) to East Antarctic (light). In the haplotype networks one branch represents one mutation. Additional mutation steps between samples are indicated with small black circles.
Electronini
Electrona antarctica is the most common species in available COI sequences (N = 61). Nonetheless, intraspecific variation appears to be minimal, with only one small group of five individuals clustering apart with moderate support (BS = 84%) and the vast majority of specimens showing one identical haplotype (Figure 5). The group that clusters apart comprises samples from the Ross Sea, Heard and McDonald Islands, and Cosmonauts Sea, all locations also present in the other group. The intraspecific diversity is low and appears not to be related to geography. Krefftichthys anderssoni is present in sufficient numbers (N = 20) and with relatively broad geographical coverage, but no structure is apparent, although haplotype diversity is a little higher compared to E. antarctica. The sub-Antarctic Electrona carlsbergi features one sample of unknown origin that is separated with moderate support (BS = 71%). The remaining samples show some haplotype diversity, but no phylogeographic pattern. Electrona subaspera as well as Protomyctophum parallelum are only present in small numbers (N = 1 and 4, respectively). Metelectrona ventralis is represented by only eight samples, five of which come from Agulhas Bank off South Africa (Figure 5). The remaining three samples have no public locality information. However, two of these build a distinct cluster divergent from all others (BS = 95%). All nine P. tenisoni are from the Scotia Sea or the South Atlantic Ocean, showing no signs of phylogeographic diversity. The remaining Protomyctophum, i.e., P. bolini, P. choriodon, P. andriashevi, and P. gemmatum, also show no sign of elevated intraspecific variability or clustering by location.
Gymnoscopelinae
In Gymnoscopelus (Figure 6), G. nicholsi shows moderate diversity with all but one specimen represented in one clade, but more different haplotypes than E. antarctica. The only outlier here is a specimen from the Kerguelen Island plateau (BS = 99%), although the remaining samples include individuals from the Kerguelen area as well. In contrast, G. bolini is split into three groups with high support: (1) one group with two samples each from the Ross Sea, Heard and McDonald Island, and Scotia Sea (BS = 98%); (2) one group (including a sub-split) with samples from Heard and McDonald as well as Kerguelen Islands, but also Ross and Scotia Sea (BS = 92%); and (3) one individual from off Dumont d'Urville Sea (DDU). East Antarctic coastal waters seem to stand out, but the sampling density is too low for solid inferences. Two other individuals, one nominal G. piabilis caught off Argentina and one nominal G. nicholsi collected off South Africa, appear as sister group to a clade of G. fraseri, remaining G. piabilis, and G. hintonoides (BS = 93%). The latter form a polyphyletic group with only G. hintonoides monophyletic in the tree (BS = 88%), but all three species separated in the haplotype network. All 24 individuals of G. opisthopterus form one group with low COI variation. Gymnoscopelus braueri in turn exhibits more divergence, with one DDU individual clustering as sister to a group of two Ross Sea and one Bouvet Island samples (BS = 92%), which diverge from the 26 remaining individuals. However, the haplotype network of G. opisthopterus and G. braueri rather resembles the pattern of E. antarctica (Figure 5) with one very common shared haplotype.
Discussion
Our study adds to the increasing knowledge and baseline data of Antarctic marine biodiversity as envisioned by the Census of Antarctic Marine Life and associated initiatives (Schiaparelli et al., 2013). It successfully uses the BOLD database to uncover mismatches between morphological and molecular specimen identification and highlights targets for deeper phylogenetic study to ascertain the position of some species and specimens in the lanternfish family. Lastly, we discuss phylogeographic patterns and the evolution of the family Myctophidae in the Southern Ocean in general and hypothesize that the presence of myctophids in the high polar seas is the result of multiple colonization events.
Extending and Using the DNA Barcode Library for Specimen Identification
The newly added sequences expand the public DNA barcoding database of Myctophidae to more than 1000 individual sequences. Of these, 263 belonged to specimens captured in the Southern Ocean, which represents a substantial increase of the barcode library of Antarctic mesopelagic fish. This will be of major importance for future ecological studies that intend to use the library for specimen identification. The value of the BOLD database is likely to increase even further with the development of metabarcoding studies. Recent approaches include for example the detection of tropical sharks (Bakker et al., 2017), large-scale larval fish ecology through efficient identification of thousands of larvae (Kimmerling et al., 2018), as well as Antarctic studies characterizing notothenioid fish assemblages (Cowart et al., 2017) and toothfish diet (Yoon et al., 2017). All these examples are fully dependent on a high quality reference database to match metabarcoding sequences, as the lack of identification can lead to reduced or biased results and interpretations. Good coverage of the (sub-)Antarctic teleost fauna, which now includes demersal fishes (Rock et al., 2008; Dettaï et al., 2011; Smith et al., 2011b, 2012; Mabragaña et al., 2016) and large parts of the meso- and bathy-pelagic fish fauna (this study), will likely be highly valuable for future metabarcoding studies investigating for example the diet and trophic position of top predators. Species that are quickly digested can be detected with this molecular approach, although quantification remains challenging. Such studies can contribute to refine our understanding of food webs in Antarctic and sub-Antarctic waters (Cornejo-Donoso and Antezana, 2008; Pinkerton and Bradford-Grieve, 2014), a task of high relevance with regard to the ecosystem approach of the Commission for the Conservation of Antarctic Marine Living Resources (CCAMLR; Kock et al., 2007; Constable, 2011).
Morphological specimen characterizations were verified with DNA barcoding. Generally, the success of specimen identification using the BOLD database (Ratnasingham and Hebert, 2007) was very high. Where morphological identification is challenging because discriminating characters are frequently lost during sampling, such as in the Myctophidae, DNA barcoding represents a useful complement to traditional identification. In eleven cases we were able to improve the initial identification and in seven further cases, we discovered mismatches between taxonomy and genetic signature, which were attributed to initial misidentification or mislabeling. Without DNA barcoding these would likely have retained an erroneous identification, which in turn poses problems for further ecological analysis and interpretation. As other studies have shown, DNA barcoding of Antarctic vertebrates is a useful molecular taxonomic approach (Rock et al., 2008; Smith et al., 2008, 2011b, 2012; Duhamel et al., 2010; Lautredou et al., 2010; Dettaï et al., 2011; Rey et al., 2011). Furthermore, it may also serve as a starting point for phylogenetic and phylogeographic investigations (Duhamel et al., 2014; Mabragaña et al., 2016). Such help for taxonomy is highly needed in times where classical taxonomic expertise has become rare (Cao et al., 2016). At least some myctophids, however, may be particularly prone to DNA degradation problems. Some of the authors observed that samples from non-myctophid fishes collected during the same expeditions and processed in the same way had much higher amplification success rates. This might be linked to (taxon-)specific degradation processes and we therefore recommend that myctophids are processed first when treating a fish catch for scientific purposes.
Phylogeny and Phylogeography of Southern Ocean Mesopelagic Fishes
The topology of phylogenetic trees constructed using COI and rh1 concur to a great extent with recent multi-marker phylogenies (Poulsen et al., 2013; Davis et al., 2014; Denton, 2014; Martin et al., 2017). However, our data cannot be used to discuss the relationship between myctophid tribes. The elsewhere well-supported monophyly of Myctophidae is not resolved in our full COI data set with some aulopiform and neoscopelid species placed within Myctophidae. In addition, the first split of Myctophidae showed polytomy with nine branches; in other words, the placement of these clades is unclear (Figure 2). The rh1 tree spans fewer taxa and resolved Lampadena as sister group to all other Myctophidae, which is not supported by other studies. COI and rh1 alone are clearly not sufficient to accurately resolve deeper phylogenetic relationships of Myctophidae. However, these markers offer the most comprehensive datasets, which are important for a holistic understanding of the approximately 395 currently described Myctophidae (Eschmeyer and Fong, 2018). High taxon density can positively affect tree topology through breaking down of otherwise very long branches. COI in particular is unmatched regarding coverage with more than 700 sequences from 149 species already previously available in BOLD for our analysis. At the subfamily to genus level our results indeed match better with recent hypotheses of myctophid intrarelationships. For example, within Lampanyctinae (sensu Martin et al., 2017) the COI tree shows that the genera Lampadena and Taaningichthys are related, as are Bolinichthys, Lepidophanes, and Ceratoscopelus and, lastly, Stenobrachius, Triphoturus, Parvilux, and Lampanyctus. This concurs with the multi-marker results of Denton (2014) and Martin et al. (2017). The concatenated dataset even resolves an initial split into a clade with Diaphinae, Lampanyctinae, Gymnoscopelinae, and Notolychninae and another clade with Electronini and Myctophini (Figure 4). This pattern matches the analyses of Poulsen et al. (2013), Davis et al. (2014), Denton (2014), and of Martin et al. (2017), with the exception that the latter find Diaphinae closer related to Myctophinae. Ultimately, the deep phylogenetic hypotheses of Myctophidae still need further work. With respect to phylogeny our data can serve as starting point to highlight genera or species that are of particular interest for further analysis, such as studies analyzing entire mitogenomes or large numbers of single nucleotide polymorphisms. We restrict this discussion here to species common in the Southern Ocean but extend it toward intraspecific genetic diversity by analyzing phylograms and haplotype networks in relation to geography. Such phylogeographic patterns are important to understand the distribution of biodiversity in the mesopelagic zone of the Southern Ocean and to plan conservation and management actions accordingly in light of climatic changes. We discuss specific phylogenetic and phylogeographic implications and recommendations of our study as compared to other recent phylogenies for: (1) Electronini, (2) Gymnoscopelinae (sensu Martin et al., 2017); (3) other Southern Ocean myctophids, and (4) other Southern Ocean mesopelagic, non-myctophids fishes.
The tribe Electronini is monophyletic within our COI analysis, but not in the rh1 tree, where Diogenichthys appears related to Electrona antarctica (Figure 3). This signal is likely the reason that Diogenichthys is also placed within Electronini in the concatenated analysis (Figure 4). Other recent studies have all corroborated the monophyly of Electronini (Poulsen et al., 2013; Davis et al., 2014; Denton, 2014; Martin et al., 2017). It is possible that the accuracy of the rh1 marker here is affected by a bias in base composition across taxa (Chen et al., 2003). Inferences from rh1 alone as well as results from the concatenated dataset that may stem primarily from the rh1 signal as is the case here must therefore be interpreted with caution. The relationships within Electronini are still somewhat obscure (Denton, 2014). All our trees support the monophyly of Protomyctophum, but the placement of Protomyctophum and the other genera, Metelectrona, Electrona, and Krefftichthys remains unclear. In the COI dataset, E. antarctica and K. anderssoni cluster together and apart from remaining Electrona spp. With rh1 and the concatenated dataset K. anderssoni rather appears to be a sister group of all other species, except E. antarctica, somewhat similar to Martin et al. (2017). However, Denton (2014) resolved Krefftichthys as sister group of only Protomyctophum. These contradictory results are evidence that more detailed studies are needed to clarify relationships within this tribe. Within Protomyctophum and using COI, where more than two Protomyctophum species were included, the split between the subgenera Protomyctophum and Hierops is supported except for P. tenisoni which diverges first (Figure 2; Gordeeva, 2013; Denton, 2014). With some additional support a revision of Protomyctophum as suggested by Denton (2014) appears sensible.
All Electronini species are recovered as single clusters, with low to moderate intraspecific levels of diversity (Figure 5). They show no divergent groups that might point to undescribed or cryptic species. The striking example of this is E. antarctica, where the majority of individuals belong to the same haplotype despite the distant locations. A dominant, widespread haplotype may indicate reduced genetic diversity due to for example a recent bottleneck. However, more variable markers show high levels of genetic diversity in this species (Van de Putte et al., 2012). Electrona antarctica is arguably the most common myctophid in Antarctic waters with a circum-Antarctic distribution and preference for water temperatures below 2.5°C (Hulley, 1990; Duhamel et al., 2014). Similar to Antarctic krill (Deagle et al., 2015), its enormous abundance may be the key factor leading to virtual panmixia, i.e., genetic homogeneity across the entire distribution range (Van de Putte et al., 2012). Other Electronini species, in particular Protomyctophum bolini and Electrona carlsbergi, show more variability in their COI haplotypes, but no relation to geography was detectable. It seems that in addition to high effective population size, the strong force of the Antarctic Circumpolar Current causes high connectivity, resulting in at most subtle spatial genetic structure, but clearly no pronounced phylogeographic structure of fishes in the tribe Electronini.
The subfamily Gymnoscopelinae is well supported as monophyletic group in all our analyses confirming findings of other phylogenetic studies (Poulsen et al., 2013; Davis et al., 2014; Denton, 2014; Martin et al., 2017). We therefore adopted the taxonomic revision of Martin et al. (2017), who promoted the former lampanyctine tribe of Gymnoscopelini to Gymnoscopelinae. The genus Gymnoscopelus appears clearly monophyletic. Our concatenated dataset resolves G. nicholsi as sister group to all other species (BS = 100%; Figure 4), as suggested by Denton (2014), the only other study that included more than two Gymnoscopelus species. In the individual COI and rh1 datasets the placement of G. nicholsi was not apparent (Figures 2, 3), highlighting the value of an additional nuclear marker to increase confidence in phylogenetic positioning. There are examples where rhodopsin can distinguish fish species, where COI fails (Thiel and Knebelsberger, 2016), such as in the present case. In our case all Gymnoscopelus spp. can be delineated using COI, but the exact position within the tree remains to be evaluated, except where they are corroborated by Denton's (2014) results.
With respect to phylogeography, the Gymnoscopelinae show a different pattern from the Electronini (Figure 6). G. nicholsi features various COI haplotypes, but only one individual, collected off the Kerguelen Islands, stands out in the phylogenetic tree (Figure 6). This is similar to the pattern of P. bolini within the Electronini. Gymnoscopelus bolini on the other hand splits into three groups based on COI variation (Figure 6). This pattern might hint at genetic structuring, but this needs to be investigated further, as the single sample from East Antarctica (DDU) is divergent, while samples from Ross and Scotia Sea, and Heard and McDonald, and Kerguelen Islands group together. Other factors than circumpolar position may be at play here, for instance trophic niche partitioning, sexual selection, or simply increased levels of genetic variability. The other species show relatively low variability and no pattern related to sampling locality, with two exceptions, both samples collected in lower latitudes (off South Africa and Argentina, respectively). These two samples were identified as G. piabilis and G. nicholsi. Given their very high COI sequence divergence (23 mutations apart from the nearest neighbor in median joining networks, not shown in figure), we recommend re-examination of the specimens, if feasible, to investigate whether they possibly belong to different (cryptic) species or sub-species.
The available sequences identified as Symbolophorus boops (BOLD references DSFSE476-08 to DSFSE480-08 and DSFSG260-10) cluster apart from the two other Symbolophorus clades resolved in our COI tree (one composed of S. californiensis, S. reversus, S. evermanni, Symbolophorus sp., and S. rufinus and the other composed of S. barnardi and S. veranyi; Figure 2). Instead these sequences settle within the Diaphinae (sensu Martin et al., 2017). Unfortunately we discovered a posteriori that the COI sequences included here as S. boops were likely misidentified on BOLD. These sequences are probably from a Diaphus species (P. A. Hulley, pers. comm.) currently also not present on BOLD, but the specimens are in poor condition, preventing definite identification. The correction has been transmitted to the BOLD database. Other studies that included genetic data proposed that Symbolophorus is closer related to Myctophum, Hygophum, and other genera, as opposed to Diaphinae, but they all lacked specimens of S. boops (Poulsen et al., 2013; Denton, 2014; Martin et al., 2017). Therefore, we highly recommend the collection of further samples/sequences in order to resolve the phylogenetic position of S. boops, and to re-identify the specimens erroneously labeled as Symbolophorus boops. In fact, the entire genus would benefit from a detailed systematic revision as already noted by Wisner (1976).
The genus Nannobrachium was recently placed into synonymy with Lampanyctus (Martin et al., 2017). Our results fully support this across all datasets and all former Nannobrachium were therefore labeled as Lampanyctus. Interestingly, Lampanyctus achirus is the only species of the Lampanyctinae with a sub-Antarctic distribution (sensu Martin et al., 2017). Based on COI the species also splits into two divergent clades with 99 and 100% bootstrap support, respectively (Figure S1). One clade consists entirely of specimens caught off South Africa and the other clade of specimens from around Antarctica. These results, however, need to be corroborated with nuclear and morphological data. This again underscores the importance of specimen vouchers for groups with difficult morphological characters and uncertain species delineation. Nevertheless, recent studies have shown that undescribed species abound even in groups that were thought well known (Geiger et al., 2014). The pattern observed for L. achirus might be indicative of cryptic or undescribed species as found before in Myctophidae, for example in Benthosema pterotum (skinnycheek lanternfish; Zahuranec et al., 2012). Currently, there are two specimens of B. pterotum with COI sequences in BOLD (from Poulsen et al., 2013 and Denton, 2014) and they also show a deep split. Additional COI sequencing of the specimens used by Zahuranec et al. (2012) could therefore enable fast, cost-efficient, and confident discrimination between the two cryptic species with COI in the future.
According to Duhamel et al. (2014) the most abundant non-myctophid mesopelagic fish families in the Southern Ocean are Bathylagidae (deep-sea smelts; 5 species), Gonostomatidae (bristlemouths; 4 spp.), Notosudidae (waryfishes; 2 spp.), Paralepididae (barracudinas; 4 spp.), and 5 species of Stomiidae (barbeled dragonfishes). We found COI sequences for only four (Notolepis coatsi, Bathylagus antarcticus, Idiacanthus atlanticus, and Borostomias antarcticus), plus five bathypelagic species (Icichthys australis, Lagiacrusichthys macropinna, Poromitra capito, Sio nordensjkoldii, and Oneirodes notius). Apart from Myctophidae and Nototheniidae, and from species only occasionally recorded south of the Sub-Tropical Convergence, Duhamel et al. (2014) list 51 species for the whole Southern Ocean pelagic zone. Thirty-four of those are present with COI in BOLD (January 2018). Many less abundant species remain to be sequenced in order to complete the reference database. Intraspecific variability is difficult to assess for the available species due to the limited number of samples. Poromitra capito (N = 3) showed two haplotypes, Notolepis coatsi (N = 4) showed three haplotypes. The genus Bathylagus is believed to comprise at least three species in the Southern Ocean, although morphological discrimination is very difficult. Preliminary evidence suggests that four species with distinct COI signature are present in the Scotia Sea (Collins et al., unpublished). In this study twelve Bathylagus antarcticus (Antarctic deep-sea smelt), all collected in the Lazarev Sea, were included, which had twelve unique haplotypes and showed at least two divergent clades in our COI tree (BS = 97 and 84%). Dettaï et al. (2011) also found diverging clades of B. antarcticus in the Dumont d'Urville Sea. We recommend a detailed integrative taxonomic investigation of all available Bathylagus specimens using morphology and several genetic markers to clarify the status of this genus. The other species mentioned above were only available in low numbers (N ≤ 2), which does not permit an examination of intraspecific variation.
Evolution of Myctophidae in the Southern Ocean
Overall, intraspecific genetic divergences are very low with only one case where COI variation clearly relates to sampling locality (Lampanyctus achirus). This may be expected, because large abundance promotes gene flow and homogenization (Hauser and Carvalho, 2008), especially in conjunction with the strong oceanographic connectivity enforced by the ACC (Orsi et al., 1995; Young et al., 2015). Another key contributing factor is the pelagic lifestyle of myctophids, characterized by seemingly free dispersal and the lack of a connection to a specific benthic habitat. Recent analyses suggesting that myctophid biomass in Antarctic waters is dependent on mass immigration from lower latitudes (except for E. antarctica and K. anderssoni) may support the idea of high connectivity (Saunders et al., 2017). However, examples of extended geographic structure despite high dispersal capabilities have been found in the Antarctic (Havermans et al., 2011; Damerau et al., 2014). In addition, weak genetic structuring has been observed for myctophids, although this was between the Mediterranean Sea and the Atlantic Ocean (Pappalardo et al., 2015). Circumpolar connectivity patterns in the sub-Antarctic and Antarctic are complex and variable, largely depending on the interplay of oceanography and life history traits (Moon et al., 2017 and references therein). For myctophids the combination of large abundance and a free-roaming, pelagic life style seems to cause a lack of genetic structuring. Our analysis is only a preliminary attempt to characterize such structure and is inherently biased toward common species, for which sufficient numbers of samples were available. If abundance indeed has a strong effect on population genetic or phylogeographic structure of lanternfishes, especially rare species should be investigated in detail. So far, only one study has investigated genetic structure of an Antarctic myctophid with multiple, variable markers (Van de Putte et al., 2012). Insights into the genetics of myctophid populations would be useful in order to optimize current modeling efforts (Koubbi et al., 2011; Freer et al., 2018), which in turn are important for conservation planning in the Southern Ocean (Hill et al., 2017). Attempts to explain and forecast mesopelagic fish distribution ranges typically use oceanographic parameters, particularly temperature and salinity (Koubbi et al., 2011; Duhamel et al., 2014; Olivar et al., 2017). Non-surprisingly, characteristics of deep water masses better explain myctophid species occurrence than surface water properties (Olivar et al., 2017). For both the characterization of current distribution and for future predictions questions arise, such as what temperatures can Southern Ocean myctophids physiologically sustain? To what level have they already adapted to colder waters and can they adapt to current rates of environmental change?
Benthic biodiversity in the Southern Ocean is comparably high, including many endemic species (Brandt et al., 2007). This is not the case for the mesopelagic fauna, mostly because it is not as isolated as Antarctic shallow water systems. However, it appears that only a few myctophid species adapted to permanently thrive under the prevailing environmental conditions. Hence, only 17 of 68 species ever recorded in the Southern Ocean are truly (sub-)Antarctic and endemic to these waters. This corresponds to 7.1% of all described myctophids, probably an underestimate considering the deep molecular divergences within the non-Antarctic species in the group, as e.g., in the supposedly monotypic genus Notolychnus. In contrast, equatorial and tropical fish communities feature high myctophid species richness (Olivar et al., 2017). Compared to for example pycnogonids, where 17.3% of all species are endemic to (sub-) Antarctic waters (Krabbe et al., 2010), myctophids seem to have diversified less in the Southern Ocean. In fact, just two species (E. antarctica and G. opisthopterus) exhibit what is described as an Antarctic distribution pattern (Duhamel et al., 2014). Looking at the phylogenetic trees, it becomes even clearer that adaptation to Southern Ocean conditions must have occurred repeatedly. There is no single species flock of Southern Ocean myctophids, but species from at least three subfamilies sensu Martin et al. (2017) are in fact true Southern Ocean species, although the vast majority belongs either to the Electronini or Gymnoscopelus. This suggests parallel evolution within similar environments based on similar genomic architecture. Denton (2018) recently showed that lanternfishes experienced elevated diversification rates initiated around the Eocene-Oligocene transition, which on the other hand could indicate that the formation of the ACC was an important evolutionary trigger for mesopelagic fish species. Southern Ocean lanternfishes are an interesting model to study evolution and speciation in the deep sea (de Busserolles et al., 2013; Denton, 2014). The diversification of Electronini (especially Protomyctophum, see also Denton, 2018) seems particularly intriguing, as it might represent an example of a (relatively small scale) marine adaptive radiation.
Conclusions
With this study we substantially extend the DNA barcode library of Antarctic mesopelagic fish, particularly lanternfishes. The combination of morphological and molecular identification led to confident species level identification in 281 out of 299 cases. Several misidentifications or otherwise uncertain samples were identified in the database. Overall, DNA barcode libraries provide a robust reference dataset for specimen identification, especially to the rescue of fragile morphological characters. As expected, the mitochondrial COI and nuclear rh1 genetic markers were not sufficient to resolve deep phylogenetic relationships. However, our results are largely congruent with recent phylogenetic studies of the family. Some of our findings suggest the importance of further study or re-identification, e.g., of Symbolophorus boops. In addition, we highlight potential (pseudo-)cryptic or unrecognized species and recommend further investigation of Gymnoscopelus bolini, two specific Gymnoscopelus specimens (nominally identified as G. piabilis and G. nicholsi), Lampanyctus achirus and the non- myctophid genus Bathylagus. The fact that myctophid species from at least three subfamilies are Southern Ocean species suggests that colonization and adaptation to this environment has occurred repeatedly. Overall, spatial divergence of species is rare in this family, potentially due to the enormous abundance of many myctophids and the homogenizing force of ocean currents. Finally, this study provides an overview of currently available Antarctic samples and associated levels of intraspecific diversity, which both may facilitate future ecological, phylogenetic, and evolutionary investigations of Southern Ocean myctophids, a fish family that surely warrants increased scientific attention.
Ethics Statement
All procedures involving the capture of fish followed internationally recognized CCAMLR CEMP standard methods and were permitted under the Antarctic Marine Living Resources Act.
Author Contributions
AVdP conceived the study with input from AD, HC, FH, MC, and FV. AVdP, AD, MC, GD, and MH were involved in sample collection. AVdP, AD, MC, DS, and HC contributed to sequencing and compiled BOLD datasets. HC and FH analyzed the data with help of AD and wrote the manuscript with help of AD, DS, MC, AVdP, and FV. All authors read and approved the manuscript.
Funding
Molecular work including sequencing was supported by the governments of France and Canada. The former through the Service de Systematique Moleculaire of the Muséum National d'Histoire Naturelle (MNHN; UMS2700), supported by the network Bibliothèque du Vivant funded by the CNRS, the MNHN, the INRA, and the CEA (Centre Nacional de Séquençage). The latter through Genome Canada and the Ontario Genomics Institute for the International Barcode of Life Project. This work was further supported by the Belgian projects vERSO and RECTO (http://rectoversoprojects.be). This is contribution no. 25 to the vERSO project, funded by the Belgian Science Policy Office (BELSPO, Contract no. BR/132/A1/vERSO). The first author was funded by a grant from the former Flemish agency for Innovation by Science and Technology, now Flanders Innovation and Entrepreneurship (VLAIO, grant no. 141328). DS was supported by the Alfred P. Sloan Foundation and the Food From Thought research program funded by the Canada First Research Excellence Fund.
Conflict of Interest Statement
The authors declare that the research was conducted in the absence of any commercial or financial relationships that could be construed as a potential conflict of interest.
Acknowledgments
We thank the officers, crew, and scientists of the cruises involved in the capture of the samples. The cruises with RV James Clark Ross were supported by British Antarctic Survey (BAS) and its Discovery 2010 project. The RV Polarstern cruises were supported by the Alfred Wegener Institute, Helmholtz Centre for Polar and Marine Research (AWI). The CAML-CEAMARC cruises of RV Aurora Australis and RV Umitaka Maru (IPY project no. 53) were supported by the Australian Antarctic Division (AAD), the Japanese Science Foundation, the French polar institute IPEV, the CNRS, the MNHN, and the ANR (White project ANTFLOCKs USAR n07-BLAN-0213-01). The Austral cruise POKER 2 was supported by specific grants of the Ministry of Alimentation, Agriculture and Fisheries (MAAP), the Marine Reserve of TAAF and the contributions of French ship owners involved in the Kerguelen Islands fisheries, with the logistic help of SAPMER and TAAF. We thank F. Busson and the 2013 JAMSTEC RV Hakuho Maru campaign led by K. Tsukamoto. We thank the editor and reviewers for constructive comments.
Supplementary Material
The Supplementary Material for this article can be found online at: https://www.frontiersin.org/articles/10.3389/fevo.2018.00120/full#supplementary-material
References
Allcock, A. L., Barratt, I., Eléaume, M., Linse, K., Norman, M. D., Smith, P. J., et al. (2011). Cryptic speciation and the circumpolarity debate: a case study on endemic Southern Ocean octopuses using the COI barcode of life. Deep Sea Res. Part II Top. Stud. Oceanogr. 58, 242–249. doi: 10.1016/j.dsr2.2010.05.016
Allcock, A. L., and Strugnell, J. M. (2012). Southern ocean diversity: new paradigms from molecular ecology. Trends Ecol. Evol. 27, 520–528. doi: 10.1016/j.tree.2012.05.009
Bakker, J., Wangensteen, O. S., Chapman, D. D., Boussarie, G., Buddo, D., Guttridge, T. L., et al. (2017). Environmental DNA reveals tropical shark diversity and abundance in contrasting levels of anthropogenic impact. Sci. Rep. 7:16886. doi: 10.1038/s41598-017-17150-2
Bandelt, H., Forster, P., and Röhl, A. (1999). Median-joining networks for inferring intraspecific phylogenies. Mol. Biol. Evol. 16, 37–48. doi: 10.1093/oxfordjournals.molbev.a026036
Barham, E. G. (1966). Deep scattering layer migration and composition: observations from a diving saucer. Science 151, 1399–1403. doi: 10.1126/science.151.3716.1399
Betancur, -R. R., Wiley, E. O., Arratia, G., Acero, A., Bailly, N., Miya, M., et al. (2017). Phylogenetic classification of bony fishes. BMC Evol. Biol. 17:40. doi: 10.1186/s12862-017-0958-3
Brandt, A., Gooday, A. J., Brandão, S. N., Brix, S., Brökeland, W., Cedhagen, T., et al. (2007). First insights into the biodiversity and biogeography of the Southern Ocean deep sea. Nature 447, 307–311. doi: 10.1038/nature05827
Bucklin, A., Steinke, D., and Blanco-Bercial, L. (2011). DNA barcoding of marine metazoa. Ann. Rev. Mar. Sci. 3, 471–508. doi: 10.1146/annurev-marine-120308-080950
Cao, X., Liu, J., Chen, J., Zheng, G., Kuntner, M., and Agnarsson, I. (2016). Rapid dissemination of taxonomic discoveries based on DNA barcoding and morphology. Sci. Rep. 6:37066. doi: 10.1038/srep37066
Casaux, R., Bertolin, M. L., and Carlini, A. (2011). Feeding habits of three seal species at the Danco Coast, Antarctica: a re-assessment. Polar Biol. 34, 1615–1620. doi: 10.1007/s00300-011-0994-1
Chen, W., Bonillo, C., and Lecointre, G. (2003). Repeatability of clades as a criterion of reliability: a case study for molecular phylogeny of Acanthomorpha (Teleostei) with larger number of taxa. Mol. Phylogenet. Evol. 26, 262–288. doi: 10.1016/S1055-7903(02)00371-8
Cherel, Y., Fontaine, C., Richard, P., and Labat, J. (2009). Isotopic niches and trophic levels of myctophid fishes and their predators in the Southern Ocean. Limnol. Oceanogr. 55, 324–332. doi: 10.4319/lo.2010.55.1.0324
Collins, M. A., Stowasser, G., Fielding, S., Shreeve, R., Xavier, J. C., Venables, H. J., et al. (2012b). Latitudinal and bathymetric patterns in the distribution and abundance of mesopelagic fish in the Scotia Sea. Deep Sea Res. Part II Top. Stud. Oceanogr. 59–60, 189–198. doi: 10.1016/j.dsr2.2011.07.003
Collins, M. A., Xavier, J. C., Johnston, N. M., North, A. W., Enderlein, P., and Tarling, G. A., et al. (2008). Patterns in the distribution of myctophid fish in the northern Scotia Sea ecosystem. Polar Biol. 31, 837–851. doi: 10.1007/s00300-008-0423-2
Collins, R. A., Boykin, L. M., Cruickshank, R. H., and Armstrong, K. F. (2012a). Barcoding's next top model: an evaluation of nucleotide substitution models for specimen identification. Methods Ecol. Evol. 3, 457–465. doi: 10.1111/j.2041-210X.2011.00176.x
Connan, M., Cherel, Y., and Mayzaud, P. (2007). Lipids from stomach oil of procellariiform seabirds document the importance of myctophid fish in the Southern Ocean. Limnol. Oceanogr. 52, 2445–2455. doi: 10.4319/lo.2007.52.6.2445
Connan, M., Mayzaud, P., Duhamel, G., Bonnevie, B. T., and Cherel, Y. (2010). Fatty acid signature analysis documents the diet of five myctophid fish from the Southern Ocean. Mar. Biol. 157, 2303–2316. doi: 10.1007/s00227-010-1497-2
Constable, A. J. (2011). Lessons from CCAMLR on the implementation of the ecosystem approach to managing fisheries. Fish Fish. 12, 138–151. doi: 10.1111/j.1467-2979.2011.00410.x
Cornejo-Donoso, J., and Antezana, T. (2008). Preliminary trophic model of the Antarctic Peninsula ecosystem (Sub-area CCAMLR 48.1). Ecol. Modell. 218, 1–17. doi: 10.1016/j.ecolmodel.2008.06.011
Cowart, D. A., Murphy, K. R., and Cheng, C. C. (2017). Metagenomic sequencing of environmental DNA reveals marine faunal assemblages from the West Antarctic Peninsula. Mar. Genomics 37, 148–160. doi: 10.1016/j.margen.2017.11.003
Cruz, V. P., Vera, M., Pardo, B. G., Taggart, J., Martinez, P., Oliveira, C., et al. (2016). Identification and validation of single nucleotide polymorphisms as tools to detect hybridization and population structure in freshwater stingrays. Mol. Ecol. Resour. 17, 550–556. doi: 10.1111/1755-0998.12564
Damerau, M., Matschiner, M., Salzburger, W., and Hanel, R. (2014). Population divergences despite long pelagic larval stages: lessons from crocodile icefishes (Channichthyidae). Mol. Ecol. 23, 284–299. doi: 10.1111/mec.12612
Davis, M. P. (2015). Evolutionary relationships of the deep-sea pearleyes (Aulopiformes: Scopelarchidae) and a new genus of pearleye from Antarctic waters. Copeia 103, 64–71. doi: 10.1643/CI-14-139
Davis, M. P., Holcroft, N. I., Wiley, E. O., Sparks, J. S., and Leo Smith, W. (2014). Species-specific bioluminescence facilitates speciation in the deep sea. Mar. Biol. 161, 1139–1148. doi: 10.1007/s00227-014-2406-x
de Busserolles, F., Fitzpatrick, J. L., Paxton, J. R., Marshall, N. J., and Collin, S. P. (2013). Eye-size variability in deep-sea lanternfishes (Myctophidae): an ecological and phylogenetic study. PLoS ONE 8:e58519. doi: 10.1371/journal.pone.0058519
Deagle, B. E., Faux, C., Kawaguchi, S., Meyer, B., and Jarman, S. N. (2015). Antarctic krill population genomics: apparent panmixia, but genome complexity and large population size muddy the water. Mol. Ecol. 24, 4943–4959. doi: 10.1111/mec.13370
Denton, J. S. (2014). Seven-locus molecular phylogeny of Myctophiformes (Teleostei; Scopelomorpha) highlights the utility of the order for studies of deep-sea evolution. Mol. Phylogenet. Evol. 76, 270–292. doi: 10.1016/j.ympev.2014.02.009
Denton, J. S. S. (2018). Diversification patterns of lanternfishes reveal multiple rate shifts in a critical mesopelagic clade targeted for human exploitation. Curr. Biol. 28, 933–940.e4. doi: 10.1016/j.cub.2018.01.082
Dettaï, A., Lautredou, A. C., Bonillo, C., Goimbault, E., Busson, F., Causse, R., et al. (2011). The actinopterygian diversity of the CEAMARC cruises: barcoding and molecular taxonomy as a multi-level tool for new findings. Deep. Res. Part II Top. Stud. Oceanogr. 58, 250–263. doi: 10.1016/j.dsr2.2010.05.021
Donnelly, J., Torres, J. J., Hopkins, T. L., and Lancraft, T. M. (1990). Proximate composition of Antarctic mesopelagic fishes. Mar. Biol. 106, 13–23. doi: 10.1007/BF02114670
Duhamel, G., Hautecoeur, M., Dettaï, A., Causse, R., Pruvost, P., Busson, F., et al. (2010). Liparids from the Eastern sector of Southern Ocean and first information from molecular studies. Cybium 34, 319–343. Available online at: http://sfi-cybium.fr/en/liparids-eastern-sector-southern-ocean-and-first-information-molecular-studies
Duhamel, G., Hulley, P.-A., Causse, R., Koubbi, P., Vacchi, M., Pruvost, P., et al. (2014). “Chapter 7. Biogeographic patterns of fish,” in Biogeographic Atlas of the Southern Ocean, eds C. De Broyer, P. Koubbi, H. Griffiths, B. Raymond, C. d'Udekem d'Acoz, A. Van de Putte, et al. (Cambridge: Scientific Committee on Antarctic Research), 327–362.
Eastman, J. T. (1991). Evolution and diversification of Antarctic notothenioid fishes. Am. Zool. 31, 93–109. doi: 10.1093/icb/31.1.93
Eastman, J. T. (1993). Antarctic Fish Biology - Evolution in a Unique Environment. San Diego, CA: Academic Press.
Eastman, J. T. (2005). The nature of the diversity of Antarctic fishes. Polar Biol. 28, 93–107. doi: 10.1007/s00300-004-0667-4
Edgar, R. C. (2004). MUSCLE: a multiple sequence alignment method with reduced time and space complexity. BMC Bioinformatics 5:113. doi: 10.1186/1471-2105-5-113
Eschmeyer, W. N., and Fong, J. D. (2018). Species by Family/Subfamily. Available online at: http://researcharchive.calacademy.org/research/ichthyology/catalog/SpeciesByFamily.asp. Electronic version (Accessed 14 January, 2018).
Fitzgibbon, J., Hope, A., Slobodyanyuk, S. J., Bellingham, J., Bowmaker, J. K., and Hunt, D. M. (1995). The rhodopsin-encoding gene of bony fish lacks introns. Gene 164, 273–277. doi: 10.1016/0378-1119(95)00458-I
Freer, J. J., Partridge, J. C., Tarling, G. A., Collins, M. A., and Genner, M. J. (2018). Predicting ecological responses in a changing ocean: the effects of future climate uncertainty. Mar. Biol. 165:7. doi: 10.1007/s00227-017-3239-1
Geiger, M. F., Herder, F., Monaghan, M. T., Almada, V., Barbieri, R., Bariche, M., et al. (2014). Spatial heterogeneity in the mediterranean biodiversity hotspot affects barcoding accuracy of its freshwater fishes. Mol. Ecol. Resour. 14, 1210–1221. doi: 10.1111/1755-0998.12257
Gordeeva, N. V. (2013). Genetic divergence in the tribe Electronini (Myctophidae). J. Ichthyol. 53, 575–584. doi: 10.1134/S0032945213050044
Grant, R. A., Griffiths, H. J., Steinke, D., Wadley, V., and Linse, K. (2010). Antarctic DNA barcoding; a drop in the ocean?. Polar Biol. 34, 775–780. doi: 10.1007/s00300-010-0932-7
Grant, R. A., and Linse, K. (2009). Barcoding antarctic biodiversity: current status and the CAML initiative, a case study of Marine invertebrates. Polar Biol. 32, 1629–1637. doi: 10.1007/s00300-009-0662-x
Griffiths, H. J. (2010). Antarctic marine biodiversity–what do we know about the distribution of life in the Southern Ocean? PLoS ONE 5:e11683. doi: 10.1371/journal.pone.0011683
Hajibabaei, M., Singer, G. A. C., Hebert, P. D. N., and Hickey, D. A. (2007). DNA barcoding: how it complements taxonomy, molecular phylogenetics and population genetics. Trends Genet. 23, 167–172. doi: 10.1016/j.tig.2007.02.001
Hauser, L., and Carvalho, G. R. (2008). Paradigm shifts in marine fisheries genetics: ugly hypotheses slain by beautiful facts. Fish Fish. 9, 333–362. doi: 10.1111/j.1467-2979.2008.00299.x
Havermans, C., Nagy, Z. T., Sonet, G., De Broyer, C., and Martin, P. (2011). DNA barcoding reveals new insights into the diversity of Antarctic species of Orchomene sensu lato (Crustacea: Amphipoda: Lysianassoidea). Deep Sea Res. Part II Top. Stud. Oceanogr. 58, 230–241. doi: 10.1016/j.dsr2.2010.09.028
Hebert, P. D. N., Cywinska, A., Ball, S. L., and DeWaard, J. R. (2003). Biological identifications through DNA barcodes. Proc. R. Soc. B Biol. Sci. 270, 313–321. doi: 10.1098/rspb.2002.2218
Hill, N. A., Foster, S. D., Duhamel, G., Welsford, D., Koubbi, P., and Johnson, C. R. (2017). Model-based mapping of assemblages for ecology and conservation management: a case study of demersal fish on the Kerguelen Plateau. Divers. Distrib. 23, 1216–1230. doi: 10.1111/ddi.12613
Hillis, D. M., and Bull, J. J. (1993). An empirical test of bootstrapping as a method for assessing confidence in phylogenetic analysis. Syst. Biol. 42, 182–192. doi: 10.1093/sysbio/42.2.182
Hulley, P. (1990). “Family myctophidae,” in Fishes of the Southern Ocean, eds O. Gon and P. Heemstra (Grahamstown: J. L. B. Smith Institute of Ichthyology), 146–178.
Ikeda, T. (1988). Metabolism and chemical composition of crustaceans from the Antarctic mesopelagic zone. Deep Sea Res. Part A Oceanogr. Res. Pap. 35, 1991–2002. doi: 10.1016/0198-0149(88)90121-5
Irigoien, X., Klevjer, T. A., Røstad, A., Martinez, U., Boyra, G., Acuña, J. L., et al. (2014). Large mesopelagic fishes biomass and trophic efficiency in the open ocean. Nat. Commun. 5:3271. doi: 10.1038/ncomms4271
Isaacs, J. D., Tont, S. A., and Wick, G. L. (1974). Deep scattering layers: vertical migration as a tactic for finding food. Deep. Res. Oceanogr. Abstr. 21, 651–656. doi: 10.1016/0011-7471(74)90049-7
Ivanova, N. V., Zemlak, T. S., Hanner, R. H., and Hebert, P. D. N. (2007). Universal primer cocktails for fish DNA barcoding. Mol. Ecol. Notes 7, 544–548. doi: 10.1111/j.1471-8286.2007.01748.x
Kimmerling, N., Zuqert, O., Amitai, G., Gurevich, T., Armoza-Zvuloni, R., Kolesnikov, I., et al. (2018). Quantitative, species-level ecology of reef fish larvae via metabarcoding. Nat. Ecol. Evol. 2, 306–316. doi: 10.1038/s41559-017-0413-2
Kimura, M. (1980). A simple method for estimating evolutionary rates of base substitutions through comparative studies of nucleotide sequences. J. Mol. Evol. 16, 111–120. doi: 10.1007/BF01731581
Kock, K. H., Reid, K., Croxall, J., and Nicol, S. (2007). Fisheries in the Southern Ocean: an ecosystem approach. Philos. Trans. R. Soc. B Biol. Sci. 362, 2333–2349. doi: 10.1098/rstb.2006.1954
Koubbi, P., Moteki, M., Duhamel, G., Goarant, A., Hulley, P.-A., O'Driscoll, R., et al. (2011). Ecoregionalization of myctophid fish in the Indian sector of the Southern Ocean: results from generalized dissimilarity models. Deep Sea Res. Part II Top. Stud. Oceanogr. 58, 170–180. doi: 10.1016/j.dsr2.2010.09.007
Krabbe, K., Leese, F., Mayer, C., Tollrian, R., and Held, C. (2010). Cryptic mitochondrial lineages in the widespread pycnogonid Colossendeis megalonyx Hoek, 1881 from Antarctic and Subantarctic waters. Polar Biol. 33, 281–292. doi: 10.1007/s00300-009-0703-5
Kumar, S., Stecher, G., and Tamura, K. (2016). MEGA7: molecular evolutionary genetics analysis version 7.0 for bigger datasets. Mol. Biol. Evol. 33, 1870–1874. doi: 10.1093/molbev/msw054
Lautredou, A. C., Bonillo, C., Denys, G., Cruaud, C., Ozouf-Costaz, C., Lecointre, G., et al. (2010). Molecular taxonomy and identification within the Antarctic genus Trematomus (Notothenioidei, Teleostei): how valuable is barcoding with COI?. Polar Sci. 4, 333–352. doi: 10.1016/j.polar.2010.04.006
Leigh, J. W., and Bryant, D. (2015). PopART: full-feature software for haplotype network construction. Methods Ecol. Evol. 6, 1110–1116. doi: 10.1111/2041-210X.12410
Lin, J. J., Wang, F. Y., Li, W. H., and Wang, T. Y. (2017). The rises and falls of opsin genes in 59 ray-finned fish genomes and their implications for environmental adaptation. Sci. Rep. 7:15568. doi: 10.1038/s41598-017-15868-7
Lyle, M., Gibbs, S., Moore, T. C., and Rea, D. K. (2007). Late oligocene initiation of the Antarctic circumpolar current: evidence from the South Pacific. Geology 35, 691–694. doi: 10.1130/G23806A.1
Mabragaña, E., Delpiani, S. M., Rosso, J. J., González-Castro, M., Deli Antoni, M., Hanner, R., et al. (2016). “Barcoding Antarctic fishes: species discrimination and contribution to elucidate ontogenetic changes in Nototheniidae,” in DNA Barcoding in Marine Perspectives, eds S. Trivedi, A. A. Ansari, S. K. Ghosh, and H. Rehman (Springer International Publishing), 213–242.
Mabragaña, E., Díaz de Astarloa, J. M., Hanner, R., Zhang, J., and González Castro, M. (2011). DNA barcoding identifies argentine fishes from marine and brackish waters. PLoS ONE 6:e28655. doi: 10.1371/journal.pone.0028655
Martin, R. P., Olson, E. E., Girard, M. G., Smith, W. L., and Davis, M. P. (2017). Light in the darkness: new perspective on lanternfish relationships and classification using genomic and morphological data. Mol. Phylogenet. Evol. 121, 71–85. doi: 10.1016/j.ympev.2017.12.029
McMillan, P., Iwamoto, T., Stewart, A., and Smith, P. J. (2012). A new species of grenadier, genus Macrourus (Teleostei, Gadiformes, Macrouridae) from the southern hemisphere and a revision of the genus. Zootaxa 3165, 1–24. doi: 10.5281/zenodo.279731
Moon, K. L., Chown, S. L., and Fraser, C. I. (2017). Reconsidering connectivity in the sub-Antarctic. Biol. Rev. 92, 2164–2181. doi: 10.1111/brv.12327
Morrow, J. M., Lazic, S., Dixon Fox, M., Kuo, C., Schott, R. K., de A Gutierrez, E., et al. (2017). A second visual rhodopsin gene, rh1-2 , is expressed in zebrafish photoreceptors and found in other ray-finned fishes. J. Exp. Biol. 220, 294–303. doi: 10.1242/jeb.145953
Olivar, M. P., Hulley, P. A., Castellón, A., Emelianov, M., López, C., Tuset, V. M., et al. (2017). Mesopelagic fishes across the tropical and equatorial Atlantic: biogeographical and vertical patterns. Prog. Oceanogr. 151, 116–137. doi: 10.1016/j.pocean.2016.12.001
Orsi, A. H., Whitworth, T., and Nowlin Jr., W. D. (1995). On the meridional extent and fronts of the Antarctic circumpolar current. Deep Sea Res. Part I Oceanogr. Res. Pap. 42, 641–673. doi: 10.1016/0967-0637(95)00021-W
Pakhomov, E. A. E., Perissinotto, R., and McQuaid, C. D. C. (1996). Prey composition and daily rations of myctophid fishes in the Southern Ocean. Mar. Ecol. Prog. Ser. 134, 1–14. doi: 10.3354/meps134001
Palczewski, K., Kumasaka, T., Hori, T., Behnke, C. A., Motoshima, H., and Fox, B. A. (2000). Crystal structure of rhodopsin : a G protein – coupled receptor. Science 289, 739–745. doi: 10.1126/science.289.5480.739
Pappalardo, A. M., Cuttitta, A., Sardella, A., Musco, M., Maggio, T., Patti, B., et al. (2015). DNA barcoding and COI sequence variation in Mediterranean lanternfishes larvae. Hydrobiologia 749, 155–167. doi: 10.1007/s10750-014-2161-5
Paradis, E., Claude, J., and Strimmer, K. (2004). APE: analyses of phylogenetics and evolution in R language. Bioinformatics 20, 289–290. doi: 10.1093/bioinformatics/btg412
Paxton, J. R. (1972). Osteology and relationships of the lanternfishes (family Myctophidae). Bull. Nat. Hist. Museum Los Angeles City 13, 1–81.
Pinkerton, M. H., and Bradford-Grieve, J. M. (2014). Characterizing foodweb structure to identify potential ecosystem effects of fishing in the Ross Sea, Antarctica. ICES J. Mar. Sci. 71, 1542–1553. doi: 10.1093/icesjms/fst230
Popescu, A. A., Huber, K. T., and Paradis, E. (2012). Ape 3.0: new tools for distance-based phylogenetics and evolutionary analysis in R. Bioinformatics 28, 1536–1537. doi: 10.1093/bioinformatics/bts184
Poulsen, J. Y., Byrkjedal, I., Willassen, E., Rees, D., Takeshima, H., Satoh, T. P., et al. (2013). Mitogenomic sequences and evidence from unique gene rearrangements corroborate evolutionary relationships of myctophiformes (Neoteleostei). BMC Evol. Biol. 13:111. doi: 10.1186/1471-2148-13-111
Proud, R., Cox, M. J., Handegard, N. O., Kloser, R. J., and Brierley, A. S. (2018). From siphonophores to deep scattering layers: an estimation of global mesopelagic fish biomass. ICES J. Mar. Sci. doi: 10.1093/icesjms/fsy037. [Epub ahead of print].
Pusch, C., Hulley, P. A., and Kock, K. H. (2004). Community structure and feeding ecology of mesopelagic fishes in the slope waters of King George Island (South Shetland Islands, Antarctica). Deep. Res. Part I Oceanogr. Res. Pap. 51, 1685–1708. doi: 10.1016/j.dsr.2004.06.008
R Core Team (2016). R: A Language and Environment for Statistical Computing. R Foundation for Statistical Computing.
Ratnasingham, S., and Hebert, P. D. (2013). A DNA-based registry for all animal species: the barcode index number (BIN) system. PLoS ONE 8:e66213. doi: 10.1371/journal.pone.0066213
Ratnasingham, S., and Hebert, P. D. N. (2007). BOLD: the barcode of life data system (http://www.barcodinglife.org). Mol. Ecol. Notes 7, 355–364. doi: 10.1111/j.1471-8286.2007.01678.x
Rey, O., Bonillo, C., Gallut, C., Cruaud, C., Dettaï, A., Ozouf-Costaz, C., et al. (2011). Naked dragonfishes Gymnodraco acuticeps and G. victori (Bathydraconidae, Notothenioidei) off Terre Adélie are a single species. Cybium 35, 111–119. Available online at: http://sfi-cybium.fr/en/naked-dragonfishes-gymnodraco-acuticeps-and-g-victori-bathydraconidae-notothenioidei-terre-ad?lie
Rintoul, S. R., Hughes, C., and Olbers, D. (2001). “The Antarctic circumpolar current system,” in Ocean Circulation and Climate (New York, NY: Academic Press), 271–302.
Rock, J., Costa, F. O., Walker, D. I., North, A. W., Hutchinson, W. F., and Carvalho, G. R. (2008). DNA barcodes of fish of the Scotia Sea, Antarctica indicate priority groups for taxonomic and systematics focus. Antarct. Sci. 20, 253–262. doi: 10.1017/S0954102008001120
Santora, J. A. (2013). Dynamic intra-seasonal habitat use by Antarctic fur seals suggests migratory hotspots near the Antarctic Peninsula. Mar. Biol. 160, 1383–1393. doi: 10.1007/s00227-013-2190-z
Saunders, R. A., Collins, M. A., Foster, E., Shreeve, R., Stowasser, G., Ward, P., et al. (2014). The trophodynamics of Southern Ocean Electrona (Myctophidae) in the Scotia Sea. Polar Biol. 37, 789–807. doi: 10.1007/s00300-014-1480-3
Saunders, R. A., Collins, M. A., Stowasser, G., and Tarling, G. A. (2017). Southern Ocean mesopelagic fish communities in the Scotia Sea are sustained by mass immigration. Mar. Ecol. Prog. Ser. 569, 173–185. doi: 10.3354/meps12093
Saunders, R. A., Collins, M. A., Ward, P., Stowasser, G., Shreeve, R., and Tarling, G. A. (2015). Distribution, population structure and trophodynamics of Southern Ocean Gymnoscopelus (Myctophidae) in the Scotia Sea. Polar Biol. 38, 287–308. doi: 10.1007/s00300-014-1584-9
Schiaparelli, S., Danis, B., Wadley, V., and Stoddart, D. M. (2013). “The census of Antarctic marine life: the first available baseline for Antarctic marine biodiversity,” in Adaptation and Evolution in Marine Environments, Vol. 2, eds C. Verde and G. di Prisco (Berlin; Heidelberg: Springer-Verlag), 3–19.
Schliep, K. P. (2011). Phangorn: phylogenetic analysis in R. Bioinformatics 27, 592–593. doi: 10.1093/bioinformatics/btq706
Smith, A. D., Brown, C. J., Bulman, C. M., Fulton, E. A., Johnson, P., and Kaplan, I. C. (2011a). Impacts of fishing low-trophic level species on marine ecosystems. Science 333, 1147–1150. doi: 10.1126/science.1209395
Smith, P. J., Steinke, D., Dettai, A., McMillan, P., Welsford, D., Stewart, A., et al. (2012). DNA barcodes and species identifications in Ross Sea and Southern Ocean fishes. Polar Biol. 35, 1297–1310. doi: 10.1007/s00300-012-1173-8
Smith, P. J., Steinke, D., McMillan, P. J., Stewart, A. L., McVeagh, S. M., Diaz De Astarloa, J. M., et al. (2011b). DNA barcoding highlights a cryptic species of grenadier Macrourus in the Southern Ocean. J. Fish Biol. 78, 355–365. doi: 10.1111/j.1095-8649.2010.02846.x
Smith, P. J., Steinke, D., Mcveagh, S. M., Stewart, A. L., Struthers, C. D., and Roberts, C. D. (2008). Molecular analysis of Southern Ocean skates (Bathyraja) reveals a new species of Antarctic skate. J. Fish Biol. 73, 1170–1182. doi: 10.1111/j.1095-8649.2008.01957.x
Steinke, D., and Hanner, R. (2011). The FISH-BOL collaborators protocol. Mitochondr. DNA 22, 10–14. doi: 10.3109/19401736.2010.536538
Tautz, D., Arctander, P., Minelli, A., Thomas, R. H., and Vogler, A. P. (2003). A plea for DNA taxonomy. Trends Ecol. Evol. 18, 70–74. doi: 10.1016/S0169-5347(02)00041-1
Thiel, R., and Knebelsberger, T. (2016). How reliably can northeast Atlantic sand lances of the genera Ammodytes and Hyperoplus be distinguished? A comparative application of morphological and molecular methods. Zookeys 2016, 139–164. doi: 10.3897/zookeys.617.8866
Van de Putte, A. P., Van Houdt, J. K. J., Maes, G. E., Hellemans, B., Collins, M. A., and Volckaert, F. A. M. (2012). High genetic diversity and connectivity in a common mesopelagic fish of the Southern Ocean: the myctophid Electrona antarctica. Deep Sea Res. Part II Top. Stud. Oceanogr. 59–60, 199–207. doi: 10.1016/j.dsr2.2011.05.011
Ward, R. D., Hanner, R., and Hebert, P. D. (2009). The campaign to DNA barcode all fishes, FISH-BOL. J. Fish Biol. 74, 329–356. doi: 10.1111/j.1095-8649.2008.02080.x
Wisner, R. (1976). The Taxonomy and Distribution of Lanternfishes (family Myctophidae) of the Eastern Pacific Ocean - NORDA-Report 3. Bay St. Louis, MS.
Yokoyama, S., and Yokoyama, R. (1996). Adaptive evolution of photoreceptors and visual pigments in vertebrates. Annu. Rev. Ecol. Syst. 27, 543–567. doi: 10.1146/annurev.ecolsys.27.1.543
Yoon, T. H., Kang, H. E., Lee, S. R., Lee, J. B., Baeck, G. W., Park, H., et al. (2017). Metabarcoding analysis of the stomach contents of the Antarctic toothfish (Dissostichus mawsoni) collected in the Antarctic Ocean. PeerJ 5:e3977. doi: 10.7717/peerj.3977
Young, E. F., Belchier, M., Hauser, L., Horsburgh, G. J., Meredith, M. P., Murphy, E. J., et al. (2015). Oceanography and life history predict contrasting genetic population structure in two Antarctic fish species. Evol. Appl. 8, 486–509. doi: 10.1111/eva.12259
Keywords: marine biodiversity, adaptation, Antarctic, COI, Myctophidae, phylogeny, rhodopsin
Citation: Christiansen H, Dettai A, Heindler FM, Collins MA, Duhamel G, Hautecoeur M, Steinke D, Volckaert FAM and Van de Putte AP (2018) Diversity of Mesopelagic Fishes in the Southern Ocean - A Phylogeographic Perspective Using DNA Barcoding. Front. Ecol. Evol. 6:120. doi: 10.3389/fevo.2018.00120
Received: 21 February 2018; Accepted: 24 July 2018;
Published: 05 September 2018.
Edited by:
Oana Moldovan, Emil Racovita Institute of Speleology, RomaniaReviewed by:
Peter John Unmack, University of Canberra, AustraliaAnna Maria Pappalardo, Università degli Studi di Catania, Italy
Copyright © 2018 Christiansen, Dettai, Heindler, Collins, Duhamel, Hautecoeur, Steinke, Volckaert and Van de Putte. This is an open-access article distributed under the terms of the Creative Commons Attribution License (CC BY). The use, distribution or reproduction in other forums is permitted, provided the original author(s) and the copyright owner(s) are credited and that the original publication in this journal is cited, in accordance with accepted academic practice. No use, distribution or reproduction is permitted which does not comply with these terms.
*Correspondence: Henrik Christiansen, henrik.christiansen@kuleuven.be orcid.org/0000-0001-7114-5854