Phylogenetic Systematics of the Water Toad (Bufo stejnegeri) Elucidates the Evolution of Semi-aquatic Toad Ecology and Pleistocene Glacial Refugia
 Jonathan J. Fong
 Bao-Tian Yang2
  Bruce Waldman
 Mi-Sook Min
- 1Science Unit, Lingnan University, Tuen Mun, Hong Kong
- 2Center for Chinese Endemic Herp-Breeding and Conservation Research and Liaoning Key Laboratory of Evolution and Biodiversity, Shenyang Normal University, Shenyang, China
- 3School of Biological Sciences, Seoul National University, Seoul, South Korea
- 4Department of Integrative Biology, Oklahoma State University, Stillwater, OK, United States
- 5Conservation Genome Resource Bank for Korean Wildlife (CGRB), Research Institute for Veterinary Science and College of Veterinary Medicine, Seoul National University, Seoul, South Korea
The water toad (Bufo stejnegeri) is endemic to Northeastern Asia (South Korea, North Korea, and China) and has unique ecology for a toad by being semi-aquatic and breeding in lotic environments. We use a suite of phylogenetic analyses to understand the evolution of B. stejnegeri's distinctive ecology and the impact of Pleistocene glacial cycles on the biodiversity of Northeast Asia. For the evolution of a semi-aquatic lifestyle, although B. stejnegeri is relatively closely related to two other semi-aquatic Bufo species (B. torrenticola and B. andrewsi), ancestral state reconstruction analysis infers an independent evolution in all three species. Upon closer inspection, B. stejnegeri exhibits major differences in amplexus and egg-laying behavior compared to the other two species, supporting independent evolution. Divergence dating analyses infer B. stejnegeri to have originated during the Late Miocene-Early Pliocene (4.3 Ma, 2.7–6.2 Ma). This species does not exhibit population differentiation with respect to mountain range, but shows a preliminary genetic pattern of southern richness and northern purity supporting a single refugium in Korea during Pleistocene glacial cycles. The Bayesian skyline plot supports this inference, suggesting a population decline followed by expansion during the Pleistocene. Although not as species rich as the tropics, we hope this study helps spark interest in Northeast Asian biodiversity.
Introduction
The discipline of phylogenetic systematics, and its goal to understand character evolution and speciation, has shaped our understanding of the patterns and processes of evolution (Wiley and Lieberman, 2011). Inter- and intra-specific phylogenies have been applied to elucidate several aspects of species evolution, such as adaptation, biogeography, and diversification. What begins as a simple study to understand the evolutionary genetics of a species can provide insight into broader evolutionary questions. Such is the case with our study of the water toad (Bufo stejnegeri).
The water toad (B. stejnegeri) is endemic to Northeastern Asia (South Korea, North Korea, and China). As the common name implies, B. stejnegeri has unique ecology for a toad by being semi-aquatic and breeding in lotic environments. Between November and January, males and females enter streams, immediately begin amplexus, and stay in amplexus for 3–6 months in frozen-over streams until spring spawning (March–April) (Kang and Yoon, 1975; Lee and Park, 2009; pers. obs.). Besides these basics, much of the biology of B. stejnegeri remains a mystery. Studying the genetics of B. stejnegeri provides a unique opportunity to understand the evolution of semi-aquatic toad ecology.
A majority of true toads in the family Bufonidae are terrestrial and characterized by dry, leathery skin, short legs, and parotoid glands (Pough et al., 2004). There are several exceptions to this (see Van Bocxlaer et al., 2010), with one being semi-aquatic stream species in the genus Ansonia, and three species in the genus Bufo (B. stejnegeri, B. andrewsi, B. torrenticola). All Ansonia species have similar adult (slender body, long legs) and tadpole (streamlined, sucker-type oral disk) morphologies, which are clear adaptations of this genus to live in fast-flowing, rocky streams (Inger, 1960). The other stream-dwelling toad species, however, are members of the largely terrestrial Bufo genus. It is unclear whether a semi-aquatic, stream lifestyle has independently evolved in these three species or was influenced by their phylogenetic relationships. Inferring the phylogenetic placement of B. stejnegeri and the relationship between these three species can provide insight into the evolution of a semi-aquatic lifestyle in Bufo.
This study also allows us to investigate the impact of Pleistocene glacial cycles on the biodiversity of Northeast Asia. The Pleistocene was a period characterized by climatic oscillations (glacial-interglacial cycles) that impacted the living organisms on Earth (Hewitt, 1996, 2004). In extreme cases, the glacial cycles caused species extinction (e.g., Picea critchfieldii; Jackson and Weng, 1999), while in other cases species ranges contracted to glacial refugia (e.g., Chorthippus parallelus, Erinaceus europaeus/concolor, Ursus arctos; Hewitt, 1999). In the latter case, the range of a species (in the Northern hemisphere) would retreat southward during a glacial period followed by expanding northward during an interglacial period. Genetically, what results is a pattern of southern richness and northern purity (Hewitt, 2004). One region with a controversial Pleistocene history is Northeast Asia (northeastern China, the Korean Peninsula, Japan, and Russian Far East). At least six glacial advances occurred during the Pleistocene (Hewitt, 1996, 1999; Avise, 2000), and it is unclear how biodiversity in the area responded.
Two hypotheses have been proposed for Northeast Asia–a multiple refugia hypothesis and a Korea refugium hypothesis. The multiple refugia hypothesis suggests that ≥2 refugia existed during the Last Glacial Maximum, preserving and promoting species diversity through allopatry (Qian and Ricklefs, 2000). Phylogeographic studies on several species support this multiple refugia hypothesis: Manchurian walnut (Juglans mandshurica, Bai et al., 2010), Asian spruce (Picea jezoensis, Aizawa et al., 2007), Siberian chipmunk (Tamias sibericus, Lee et al., 2008), Korean field mouse (Apodemus peninsulae, Serizawa et al., 2002), and Japanese treefrog (Dryophytes japonicus, Dufresnes et al., 2016). In contrast, the Korea refugium hypothesis posits that glaciation pushed temperate forests below 30°N, resulting in a single refugium on the Korean Peninsula (Kong, 2000; Harrison et al., 2001). Studies supporting this hypothesis were conducted on the Chinese black-spotted frog (Rana nigromaculata, Zhang et al., 2008) and short-tailed pit viper (Gloydius brevicaudus, Ding et al., 2011). A phylogeographic study of B. stejnegeri, restricted to Northeast Asia, provides another opportunity to evaluate these hypotheses and understand how glacial cycles impacted the biodiversity of Northeast Asia.
In this study, we use a suite of genetic analyses to infer the phylogenetic placement, phylogeography, and population genetics of B. stejnegeri. We apply these results to understand the evolution of a semi-aquatic lifestyle in Bufo and the impact of Pleistocene glacial cycles on the biodiversity of Northeast Asia.
Materials and Methods
Sampling
We collected genetic data from 43 individuals across the range of B. stejnegeri in northeastern China and South Korea. Although B. stejnegeri is distributed in North Korea, we were unable to obtain samples from the region. Tissue samples (liver or toe clips) for genetic work were preserved in 95% ethanol.
Laboratory Protocols
We extracted genomic DNA from tissues using a standard salt extraction protocol (Sambrook and Russell, 2001). A total of 12 loci were targeted for PCR and DNA sequencing (four mitochondrial DNA [mtDNA] loci, eight nuclear DNA [nuDNA] loci). The four mtDNA loci are 12S ribosomal RNA + 16S ribosomal RNA (12S-16S), cytochrome b (cytb), NADH dehydrogenase subunit 2 (ND2), and NADH dehydrogenase subunit 3 and associated tRNAs (ND3), while the eight nuDNA loci are 28S ribosomal RNA (28S), C-X-C chemokine receptor type 4 (CXCR-4), histone 3A (H3A), pro-opiomelanocortin (POMC), recombination activating gene 1 (RAG-1), rhodopsin (RHO), activity-dependent neuroprotector homeobox (ADNP), and neurotrophin 3 (NTF3). The primers used for each locus are listed in Table S1. All PCR products were purified and sequenced in both directions using the PCR primers on an ABI3730XL machine (Applied Biosystems, USA) at the National Instrument Center for Environmental Management (Seoul National University). Owing to the length of PCR products, additional internal primers were used to sequence 12S-16S (12S-7, 2571H) and cytb (Bufo3Inner1) (Table S1).
Phylogenetic Analyses
Sequences for each locus of each individual were assembled and checked by eye in Geneious 11.1.5 (Biomatters, Auckland, New Zealand). Consensus sequences for each locus were aligned using MUSCLE (Edgar, 2004). These multiple sequences alignments were checked manually, and sequences of protein coding genes were translated into amino acids to check for erroneous stop codons.
We performed phylogenetic analyses to (1) determine the phylogenetic placement of B. stejnegeri amongst other Bufo species, and (2) uncover phylogeographic patterns for B. stejnegeri. Different datasets and taxon sampling were used for each goal. For the phylogenetic placement of B. stejnegeri, three loci were used (12S-16S, CXCR-4, POMC), chosen based on the available data on GenBank. The taxon sampling consisted of 19 individuals in the genus Bufo (one B. stejnegeri, 18 individuals of 13 Bufo species from GenBank). Four extant Bufo taxa were not included as their data were not available on GenBank. Three taxa were included as outgroups (Incilius alvarius, Rhinella marina, Duttaphrynus himalayanus). We performed separate analyses for the individual loci, as well as for a concatenated dataset. For the phylogeography analyses, 10 loci were used (12S-16S, cytb, ND2, ND3, ADNP, CXCR-4, H3A, NTF3, POMC, RAG-1). Taxon sampling for these analyses was 46 B. stejnegeri across its geographic range [43 new, three GenBank (Jeong et al., 2013; Dong and Yang, 2016)] and two B. gargarizans outgroups. Collection localities are plotted on the map in Figure 1, grouped geographically by mountain range (Qian, Hwaak, Taebaek, Chiak, Jiri). Analyses were performed on two datasets: concatenated mtDNA (12S-16S, cytb, ND2, ND3) and concatenated data of all 10 loci. Both datasets included the complete taxon sampling of 46 B. stejnegeri and two B. gargarizans outgroups.
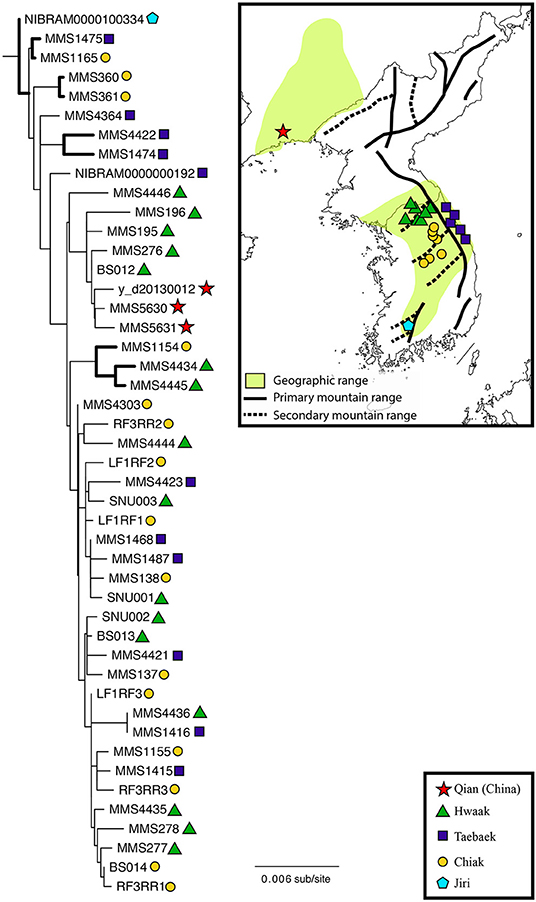
Figure 1. Maximum likelihood phylogeny of Bufo stejnegeri inferred from a concatenated dataset of 10 loci (12S-16S, cytb, ND2, ND3, ADNP, CXCR-4, H3A, NTF3, POMC, RAG-1). Thicker branches indicate a bootstrap support value ≥ 85. The shapes next to each individual correspond to the geographic locations on the map to the right. Geographic locations have been grouped into five populations based on the mountain range. The geographic range of B. stegnegeri is indicated by the light-green shading, based on the Map of Life (Jetz et al., 2012). Although this species is expected to occur in North Korea, no data are available. Darker lines on the map (solid and dotted) indicate the location of the major mountain ranges (adapted from Park and Son, 2008).
We performed maximum likelihood (ML) analyses in RAxML v.8.2.4 (Stamatakis, 2014) and Bayesian (BI) analyses in MrBayes v.3.2.5 (Ronquist et al., 2012). Datasets were first partitioned by locus and codon (for protein-coding genes), whenever applicable, followed by finding the best partitioning scheme in PartitionFinder 2.1.1 (Lanfear et al., 2016) using the greedy algorithm (Lanfear et al., 2012). Each ML analysis was performed using the combined rapid bootstrap and search for the best-scoring tree, 1,000 bootstrap replicates, and the GTR+G model of nucleotide substitution for each partition. For BI analyses, the substitution model for each partition was selected in MrBayes using the reversible jumping model choice, with both rate variation and invariable sites. Two BI searches with random starting trees were run and compared using four Markov Chain Monte Carlo (MCMC chains), 10 million generations, and sampled every 1,000 generations. Stationarity was evaluated by ensuring the average standard deviation of split frequencies was low (<0.01) and checking to see the plot log-likelihood scores had plateaued in Tracer v.1.7 (Rambaut et al., 2018). Burn-in data were discarded before building the consensus tree.
We did a post hoc analysis of phylogenetic informativeness for each of the 10 molecular markers using the online program PhyDesign (http://phydesign.townsend.yale.edu; Townsend, 2007). The ML tree was converted to an ultrametric tree using FigTree v.1.3.1 (Rambaut, 2010), and HyPhy (Pond et al., 2005) was used to calculate the substitution rates.
Ancestral State Reconstruction
We performed ancestral state reconstruction analyses to understand the evolution of a semi-aquatic lifestyle in Bufo using the packages phytools (Revell, 2012) and ape (Paradis and Schliep, 2018) in R 3.5.3 (R Core Team, 2019). The ML tree resulting from the Bufo phylogeny was used, which was topologically identical to the BI tree. Lifestyle was coded for all 17 Bufo as a discrete character–semi-aquatic for B. stejnegeri, B. torrenticola, and B. andrewsi; and terrestrial for all other species/individuals. The equal rates [ER] model of evolution was implemented in the “ace” function, which implicitly assumes a flat prior probability distribution at the global root of the tree. We used stochastic character mapping (Huelsenbeck et al., 2003) to sample character histories from their posterior probability distribution and 1,000 simulation replicates, and “countSimmap” to count the number of character changes in the simulated trees. We use the “densityMap” method to visualize the posterior probability of each state at all points along the tree.
Divergence Dating Analyses
A 114-sample, 7-locus (12S-16S, 28S, CXCR-4, H3A, POMC, RAG-1, RHO) Bufonidae dataset (primarily from Frost et al., 2006; Pramuk, 2006; Pramuk et al., 2008) was used for the divergence dating analyses. These loci were chosen based on the available data in GenBank. The amount of missing data varied for each taxon, with some taxa represented by data from a single locus. As missing data have been shown to have minor impacts on the accuracy of divergence dating (Zheng and Wiens, 2015), we proceeded with the analysis. Analyses were performed in BEAST 2.5.2 (Bouckaert et al., 2014) and run on the CIPRES Science Gateway (Miller et al., 2010). Analyses were run for 100 million generations, sampling every 10 thousand generations, with a Yule model of speciation as a tree prior. Although using a relaxed clock can accommodate the more restrictive case of a strict clock (Drummond et al., 2006), we check for the best clock model by comparing marginal likelihoods under an uncorrelated relaxed lognormal clock and a strict clock. We estimate marginal likelihoods using path sampling/stepping-stone sampling with 1 path, 100 million generations, sampling every 10 thousand generations. The marginal likelihoods of each model were compared with Bayes factors, interpreting the results following Kass and Raftery (1995).
The substitution models determined in PartitionFinder were GTR + G + I for 12S-16S, 28S, CXCR-4, H3A, POMC, and RAG-1, and HKY + G for RHO. Three calibration points were used, following Pramuk et al. (2008) and Portik and Papenfuss (2015): (1) oldest bufonid (Baez and Gasparini, 1979) exponential distribution, mean = 20, log(SD) = 1, offset = 57, producing a credibility interval of 58.03–116.9; (2) Central-North American split based on the fossil of B. praevis (Tihen, 1951), lognormal distribution, mean in real space = 10, log(SD) = 1, offset = 19, producing a credibility interval of 20.17–50.42; and (3) Origin of Rhinella marina group (Sanchíz, 1998), lognormal distribution, mean in real space = 10, log(SD) = 1, offset = 10, producing a credibility interval of 11.17–41.42. We used Tracer 1.7.1 (Rambaut et al., 2018) to determine if runs had reached stationarity, and a burn-in of 25% was discarded.
Population Genetic Analyses
All population genetics analyses were performed on a concatenated ND2-ND3 dataset, as this dataset had the least missing data. A total 42 of 46 individuals were retained for these analyses. Individuals were grouped into populations based on mountain range: Qian (3 individuals), Hwaak (16 individuals), Taebaek (10 individuals), and Chiak (13 individuals). Unfortunately, the single sample from Jiri (downloaded from GenBank) did not have available sequence for ND2-ND3 and therefore was not included. We attempted to analyse datasets including this sample, but theses analyses were not informative since the sequences were either short (568 bp of 16S) or had low taxon sampling (9 individuals for cytb).
We used PopART (Leigh and Bryant, 2015) to infer a haplotype network using the median-joining network algorithm (Bandelt et al., 1999), setting epsilon to zero. Additionally, with PopART, we performed an AMOVA to compare the variation among and within populations and calculated ΦST. As we are dealing with mtDNA sequences, we chose ΦST as the appropriate fixation index to calculate. DnaSP 6.11.01 (Librado and Rozas, 2009) was used to calculate genetic diversity indices for each population (number of haplotypes [Nh], haplotype diversity [h], and nucleotide diversity [π]).
Inferring Demographic History
We inferred the effective population size of B. stejnegeri using BEAST 2.5.2, using the same ND2-ND3 dataset as the population genetic analyses. Substitution models were set based on results from PartitionFinder. The tree prior was set as coalescent Bayesian skyline tree, while the prior for the root height was based on the result of the divergence dating analysis. MCMC chains were run for 500 million generations, sampling every 10 thousand generations. In Tracer 1.7.1, the plot of the posterior score was viewed to determine burn-in, followed by construction of the Bayesian skyline plot.
Results
Phylogenetic Analyses
All new sequences were deposited in GenBank (Table S2). The ML phylogenetic tree inferring the phylogenetic placement of B. stejnegeri within the genus Bufo is shown in Figure 2. The BI phylogeny only differed in the branch lengths and support values of nodes, with BI posterior probabilities generally higher. Bufo stejnegeri is inferred to be the sister species of a group including B. japonicus, and B. torrenticola (ML bootstrap: 44, BI posterior probability: 0.96). All analyses of the individual locus datasets had lower resolution compared to the concatenated dataset (not shown), but B. stejnegeri always clustered with the same Bufo species listed above.
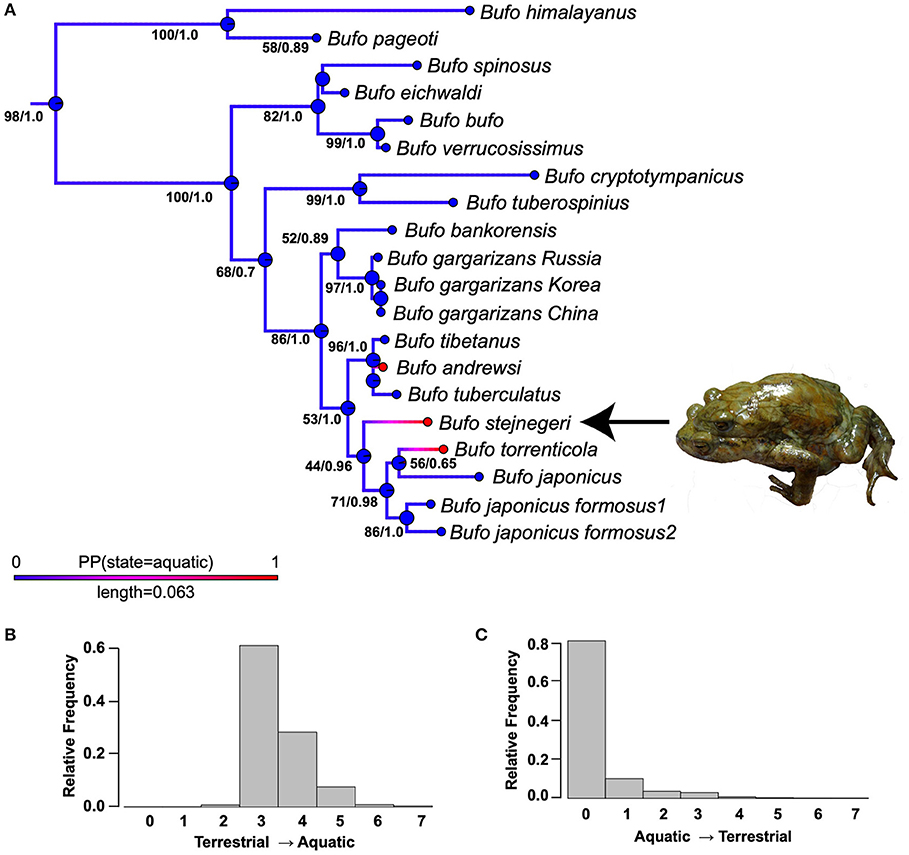
Figure 2. (A) The phylogenetic placement of Bufo stejnegeri within the genus Bufo and ancestral state reconstruction of a semi-aquatic lifestyle. This phylogeny is from the partitioned maximum likelihood (ML) phylogenetic analysis performed on a concatenated dataset of three loci (12S-16S, CXCR-4, POMC). Numbers at nodes represent (ML bootstrap/Bayesian posterior probability). The Bayesian inference phylogeny only differed in branch lengths and support values of nodes. Colors of the branches represent the results from the ancestral state reconstruction analysis, while circles at the nodes represent inferred ancestor states nodes present the lifestyle state of each species. For branches, red represents a semi-aquatic lifestyle, blue represents a terrestrial lifestyle, while magenta-purple represent intermediate posterior probabilities. Plot probability distributions of the number of reconstructed changes across all simulated histories (B) terrestrial → aquatic and (C) aquatic → terrestrial.
The ML tree used for understanding B. stejnegeri phylogeography is shown in Figure 1, and the BI tree in Figure S1. Both phylogenies were largely concordant, with minor differences in support values and the presence of more polytomies in the BI tree. Results from the concatenated mtDNA dataset (not shown) were also largely concordant to the 10-locus dataset. Bufo stejnegeri is monophyletic and exhibits genetic variation. It is noteworthy that the single Jiri sample was the most basal on the tree, while the three Qian samples were monophyletic and in a nested position. However, it is unclear if these are true patterns or an artifact due to small samples sizes. Of the three remaining populations (Hwaak, Taebaek, and Chiak) there is no clear pattern relating this genetic variation to geography–individuals from each population are relatively evenly dispersed across the phylogeny.
For the phylogenetic informativeness analysis. A majority of the markers reached maximum phylogenetic informativeness closer to the base of the tree (Figure S2). The only exception was H3A, which showed to be maximally informative closer to the tips of the tree.
Ancestral State Reconstruction Analyses
Figure 2A depicts the results of the ancestral state reconstruction simulations on the ML tree The posterior probability of being in each state is illustrated by the colors of branches, with red being a 1.0 posterior probability of being semi-aquatic, blue being a zero posterior probability of being terrestrial, and purple-magenta representing intermediate posterior probabilities. For clarity, the true states of the tips were included. Figures 2B,C plot probability distributions of the number of reconstructed terrestrial-aquatic and aquatic-terrestrial changes across all simulated histories; our simulations most frequently inferred three terrestrial-aquatic and zero aquatic-terrestrial changes. The semi-aquatic ecology of B. stejnegeri, B. torrenticola, and B. andrewsi are inferred to have evolved independently of each other.
Divergence Dating Analyses
The marginal likelihoods of the analysis were compared under an uncorrelated relaxed lognormal (−68379.725) and strict (−68858.507) molecular clock. With 2loge(B10) = 12.46 Kass and Raftery (1995) interpret this to be very strong evidence to support the use of an uncorrelated relaxed lognormal molecular clock. All subsequent results are from the analysis using the relaxed clock model.
The results from the divergence dating analysis are found in Figure S3. Effective sample sizes of the majority of parameters were >200, providing us with confidence that analyses reached stationarity. The two divergence dates of interest for our study were (mean, 95% confidence interval): between the two Korean Bufo species (B. stejnegeri and B. gargarizans) (7.3 Ma [mega-annum], 4.9–10.2 Ma), and the origin of Bufo stejnegeri (4.3 Ma, 2.7–6.2 Ma). The relationships within the genus Bufo were largely consistent to the RAxML analysis, but with stronger posterior probability support. The two differences in topology were the placement of B. torrenticola (sister species to B. japonicus [RAxML] vs. sister species to B. j. formosus [BEAST]) and B. bufo (sister species to B. verrucosissimus [RAxML] vs. sister species to all other Bufo species [BEAST]).
Population Genetics Analyses
All population genetics analyses excluded the Jiri population (see explanation in the “Materials and Methods” section). The population genetics summary statistics for each of the remaining populations (separated by mountain range) are in Table 1. The three different population genetics analyses yielded similar results–populations designated a priori based on mountain range are not distinct and likely retain ancestral polymorphism and/or experience gene flow. First, the median-joining haplotype network recovers genetic clusters, but these clusters do not correspond to populations (Figure 3). Second, the AMOVA found the majority of variation to be within populations (81.5%; d.f = 38; sum of squares = 2394.265; σ2 = 63.007) as opposed to among populations (18.5%; d.f = 3; sum of squares = 789.854; σ2 = 14.306). Third, the fixation index value (ΦST = 0.185; p < 0.001), indicates there is significant genetic variation between populations, but the variation is not large.
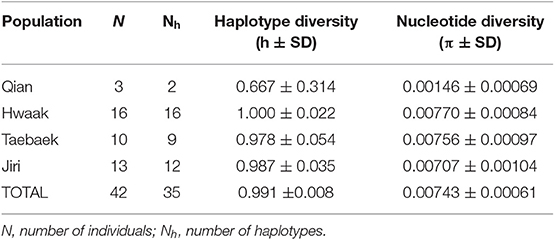
Table 1. Population genetics summary statistics for populations of Bufo stejnegeri designated based on mountain range, based on a concatenated ND2-ND3 dataset.
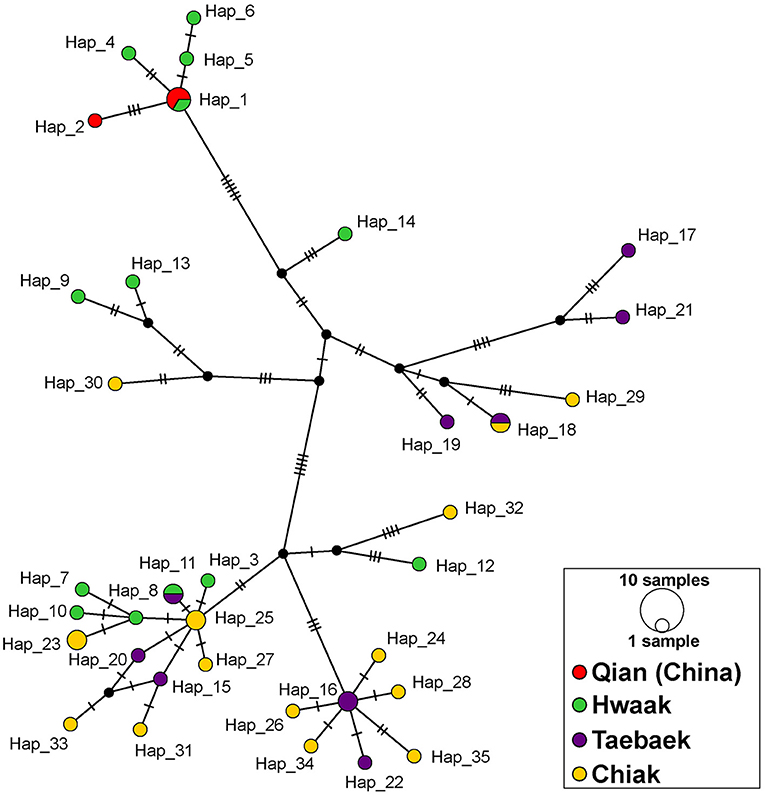
Figure 3. Median-joining network of Bufo stejnegeri haplotypes based on a concatenated ND2-ND3 dataset constructed in PopART. Haplotypes are represented by circles, whose sizes are proportional to the number of individuals. Different colors represent different mountain ranges, and potentially different populations. The color scheme is the same as in Figure 1. Hatch marks correspond to nucleotide substitutions, while missing haplotypes are indicated by small black circles.
Demographic History
Figure 4 shows the Bayesian skyline graph inferring the effective population size of B. stejnegeri over time. Effective population size began to decrease during the Pliocene (~3.5 Ma) and continued to decline through the Pleistocene, reaching the lowest point at ~0.4 Ma. After this point, B. stejnegeri experienced a population expansion, where the population size recovered to or exceeded Pliocene levels.
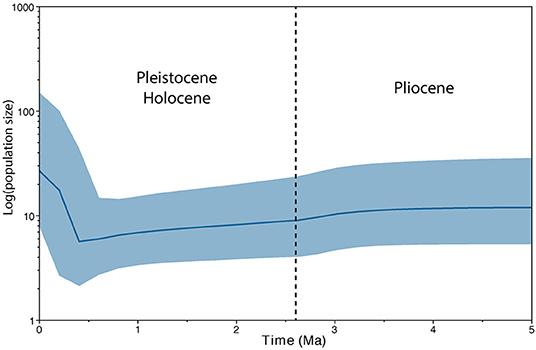
Figure 4. Bayesian skyline plot inferring the effective population size of Bufo stejnegeri.
Discussion
Bufo stejnegeri is a toad species endemic to Northeastern Asia (China, South Korea, and North Korea) with a unique ecology in that it is semi-aquatic and breeds in lotic environments. Males and females enter streams in autumn and begin amplexus, and remain in amplexus during winter in frozen streams until spring spawning in March–April (Kang and Yoon, 1975; Lee and Park, 2009; pers. obs.). We undertook this study to understand both the higher-level and population-level genetic relationships of B. stejnegeri to gain insight into the evolution of B. stejnegeri's distinctive ecology and the impact of Pleistocene glacial cycles on the biodiversity of Northeast Asia.
Evolution of Semi-aquatic, Lotic Lifestyle
In the Bufo phylogeny, B. stejnegeri is relatively closely related to B. torrenticola and B. andrewsi, two species that have some similarities in ecology and reproductive biology. Bufo species are largely terrestrial and breed in lentic environments (Duellman and Trueb, 1994), but B. stejnegeri, B. torrenticola, and B. andrewsi are semi-aquatic and breed in lotic environments (Matsui, 1980; Tsuji and Kawamichi, 1996; Lee and Park, 2009). These three species have similar morphological characters that are likely adaptations to life in mountainous streams–indistinct or small tympanums, long and slender limbs, and less divergent short parotoids (Matsui, 1980). Additionally, the skin of B. stejnegeri and B. torrenticola becomes smooth during the breeding season (Tsuji and Kawamichi, 1998a; pers. obs.), and spawning pairs mate submerged underwater (Tsuji and Kawamichi, 1998a,b; pers. obs.).
These similar characters could be a result of convergent evolution to lotic environments, due to phylogenetic relatedness, or a combination of both. Our ancestral state reconstruction analyses infer independent evolution of this unique ecology in the three Bufo species (Figure 2). Upon closer investigation of the features in these three species, we find differences that support independent evolution of a semi-aquatic lifestyle. In terms of amplexus and egg-laying strategy, B. torrenticola and B. andrewsi exhibit behavior more typical Bufonidae species; amplexus occurs immediately before laying eggs, and eggs are laid in pools along the streams where the water flow is slower (Liu and Hiu, 1961; Matsui, 1976; Tsuji and Kawamichi, 1996, 1998a). In contrast, B. stejnegeri has extended amplexus that lasts 3–6 months, and eggs are primarily laid in fast-flowing streams under rocks (Matsui, 1980; Lee and Park, 2009; pers. obs.). These additional characters support the inference that B. stejnegeri has independently evolved a semi-aquatic, lotic-breeding lifestyle.
Phylogeography and Population Genetics of B. stejnegeri
Bufo stejnegeri lives in the riparian zone of mountainous forests (200–700 asl), coming down to streams and rivers to breed (Matsui and Zhao, 2004). For phylogeographic and population genetics analyses, individuals were grouped into a priori populations to test whether population structure corresponds to mountain range (Qian, Hwaak, Taebaek, Chiak, Jiri). Population structure may result from either geography acting as barriers to gene flow or B. stejnegeri exhibiting site fidelity. Site fidelity (returning to natal pond to breed) has been observed in several Bufonid species (e.g., Heusser, 1969; Sinsch, 2010).
For B. stejnegeri, phylogeographic structure does not correspond to mountain range, as individuals from Hwaak, Taebaek, and Chiak populations are interspersed across the phylogeny (Figure 1). However, when the two populations of B. stejnegeri at the northernmost (Qian) and southernmost (Jiri) extremes of the distribution are considered, a preliminary pattern appears. The southern Jiri sample is the most ancestral, while the northern Qian samples cluster in a nested position. This needs to be tested with additional sampling from the extremes of the distribution, but if the pattern holds, it would be similar to the “southern richness and northern purity” pattern seen in the northern hemisphere resulting from glacial-interglacial cycles of the Quaternary–contraction southward followed by northward expansion (Hewitt, 2004; Clark et al., 2009). If this is the case for B. stejnegeri, the population would have retreated to a single glacial refugium in the Jiri Mountain Range, followed by a northward population expansion along associated mountain ranges, supporting the Korea refugium hypothesis. Further studies are needed to make a conclusion, with denser sampling from the extremes of the distribution, and (based on our analysis of phylogenetic informativeness) more quickly-evolving markers to resolve shallower nodes in the phylogeny.
The geology of the Korean Peninsula and northeastern China would have facilitated population expansion because all of the mountain ranges in the region are connected and part of the larger Baekdudaegan Mountain Range. The Baekdudaegan is often referred to as the “spine” of the Korean Peninsula, running 1,625 km from Jiri Mountain in southern South Korea up to Baekdu Mountain at the China-North Korea border. The China portion of the mountain range is called the Changbai Mountains, extending across Heilongjang, Jilin, and Liaoning Provinces (where the Qian population is located). The formation of these mountain ranges began with volcanism in the Oligocene (28.4 Ma) and lasted until the Pleistocene (1.2 Ma), with most activity during the Miocene and Pliocene (Wang et al., 1989; Wan, 2012). Results from divergence dating and estimation of demographic history are consistent with the proposed scenario.
The date inferred for the origin of B. stejnegeri (4.3 Ma, 2.7–6.2 Ma) places the origin of B. stejnegeri after the majority of the Baekdudaegan had already formed and before glacial cycles of the Pleistocene. Consistent with this scenario, the Bayesian skyline plot infers that B. stejnegeri experienced a decrease in effective population size during the Pliocene-Pleistocene, followed by an expansion (Figure 4). We use these results to infer the demographic history of B. stejnegeri, although we recognize that effective population size is almost always smaller than census population size, and changes in effective population size do not necessarily indicate a corresponding change in census population size. Additionally, this scenario should be viewed as a hypothesis, as the sample sizes for Qian (n = 3) and Jiri (n = 1) were small in our study. Additional samples from these two regions are needed to verify whether there is a true pattern of southern richness and northern purity.
Korean Bufo
Two Bufo species are found on the Korean Peninsula: B. stejnegeri and B. gargarizans. Two previous studies based on mtDNA (Lee and Park, 1992) and allozymes (Yang et al., 2000) looked at intra- and inter-species relationships. Studying the divergence time between the two species, they inferred an age of 3.6 or 2.8 Ma, respectively. This corresponds to a Pliocene divergence. Our results imply a much older divergence date (7.3 Ma, 4.9–10.2 Ma), pushing the divergence back into the Late Miocene-Early Pliocene. The disparity between the results is likely due to the difference in analytical methods; Lee and Park (1992) and Yang et al. (2000) used a fixed divergence rate (2%/million years [mtDNA] and 20%/million years [allozymes]), while we used a relaxed clock and several fossil calibration points. We believe our methods, taking into account uncertainty in historical events and potential differences in evolutionary rates of lineages, provide a more realistic representation of the biological process and therefore a better estimation of the true divergence time.
Our results push back the timing of the split between Korean Bufo species closer to the age of another Korean frog, Bombina orientalis (14.80 Ma, 6.50–23.52 Ma) and its four subclades across Northeast Asia (mean ages 3.12–9.20 Ma) (Fong et al., 2016). These studies of frog species in Korea point toward the Late Miocene-Early Pliocene as being an important period of diversification. This was a period inferred to be climatically warm and stable (Liu and Leopold, 1994; Kong, 1996), but a time of major geologic events such as forming the major mountain ranges in the area (Wang et al., 1989; Park and Son, 2005, 2008; Wan, 2012) and opening of the East Sea/Sea of Japan (Otofuji et al., 1985, 2003). Comparative phylogeographic studies testing for simultaneous divergence of animal and plant species (Hickerson et al., 2006) will be helpful to identify the key geologic events influencing diversification on the Korean Peninsula.
Conclusion
In our study, genetic data of B. stejnegeri helped us understand the inter- and intra-specific relationships of this species. From a broader evolutionary view, these data suggest an independent evolution of a semi-aquatic, lotic lifestyle in Bufo, as well as support the presence of a single refugium in Northeast Asia during the Last Glacial Maximum.
Data Availability Statement
The datasets generated for this study can be found in GenBank with the following accession numbers: MK031411–MK031654.
Ethics Statement
The animal study was reviewed and approved by Seoul National University Ethics Committee.
Author Contributions
JF, B-TY, P-PL, BW, and M-SM designed the study and wrote the manuscript. JF, B-TY, and M-SM collected samples. JF and B-TY analyzed the data.
Funding
This research was supported by grants from the National Research Foundation of Korea (2012K1A2B1A03000496) funded by the Government of the Republic of Korea (MSIP), and the Research Institute of Basic Sciences, Seoul National University (to BW), and from the National Natural Science Foundation of China (31211140342) (to P-PL). We thank Profs. Wenbo Liao and Jinzhong Fu for information on the reproductive biology of B. andrewsi. We would like to thank members of the Min and Waldman labs for help with fieldwork, and thank Adam Leache for help with divergence dating analyses.
Conflict of Interest
The authors declare that the research was conducted in the absence of any commercial or financial relationships that could be construed as a potential conflict of interest.
Supplementary Material
The Supplementary Material for this article can be found online at: https://www.frontiersin.org/articles/10.3389/fevo.2019.00523/full#supplementary-material
Figure S1. Bayesian inference phylogeny of Bufo stejnegeri inferred from a concatenated dataset of 10 loci (12S-16S, cytb, ND2, ND3, ADNP, CXCR-4, H3A, NTF3, POMC, RAG-1). Thicker branches indicate a bootstrap support value ≥0.95. The shapes next to each individual correspond to the geographic locations on the map from Figure 1.
Figure S2. Calculation of phylogenetic informativeness of the 10 markers using PhyDesign.
Figure S3. Phylogeny and divergence dates inferred using BEAST. Numbers at nodes represent the mean divergence date (in Ma [mega-annum]), while bars at nodes represent the 95% confidence interval of the divergence date. Nodes with high support (posterior probability ≥ 0.95) are denoted with black, bold branches, while nodes with low support (posterior probability <0.95) are denoted with red, thin branches.
Table S1. Primers used in this study.
Table S2. Geographic localities and GenBank numbers of new sequences used in this study.
References
Aizawa, M., Yoshimaru, H., Saito, H., Katsuki, T., Kawahara, T., Kitamura, K., et al. (2007). Phylogeography of a northeast Asian spruce, Picea jezoensis, inferred from genetic variation observed in organelle DNA markers. Mol. Ecol. 16, 3393–3405. doi: 10.1111/j.1365-294X.2007.03391.x
Avise, J. C. (2000). Phylogeography: The History and Formation of Species. Cambridge, MA: Harvard University Press.
Baez, A. M., and Gasparini, Z. B. (1979). “The South American herpetofauna: an evaluation of the fossil record,” in The South American Herpetofauna: Its Origin, Evolution and Dispersal, Monograph of the Museum of Natural History, ed W. E. Duellman (Lawrence: The University of Kansas), 29–55.
Bai, W., Liao, W., and Zhang, D. (2010). Nuclear and chloroplast DNA phylogeography reveal two refuge areas with asymmetrical gene flow in a temperate walnut tree from East Asia. New Phytol. 188, 892–901. doi: 10.1111/j.1469-8137.2010.03407.x
Bandelt, H., Forster, P., and Rohl, A. (1999). Median-joining networks for inferring intraspecific phylogenies. Mol. Biol. Evol. 16, 37–48. doi: 10.1093/oxfordjournals.molbev.a026036
Bouckaert, R., Heled, J., Kuhnert, D., Vaughan, T., Wu, C.-H., Xie, D., et al. (2014). BEAST 2: a software platform for Bayesian evolutionary analysis. PLoS Comput. Biol. 10:e1003537. doi: 10.1371/journal.pcbi.1003537
Clark, P. U., Dykes, A. S., Shakun, J. D., Carlson, A. E., Clark, J., Wohlfarth, B., et al. (2009). The last glacial maximum. Science 325, 710–714. doi: 10.1126/science.1172873
Ding, L., Gan, X.-N., He, S.-P., and Zhao, E.-M. (2011). A phylogeographic, demographic and historical analysis of the short-tailed pit viper (Gloydius brevicaudus): evidence for early divergence and late expansion during the Pleistocene. Mol. Ecol. 20, 1905–1922. doi: 10.1111/j.1365-294X.2011.05060.x
Dong, B., and Yang, B. (2016). The complete mitochondrial genome of the Bufo stejnegeri (Anura: Bufonidae). Mitochondrial DNA Part A DNA Mapp. Seq. Anal. 27, 2885–2886. doi: 10.3109/19401736.2015.1101558
Drummond, A. J., Ho, S. Y. W., Philllips, M. J., and Rambaut, A. (2006). Relaxed phylogenetics and dating with confidence. PLOS Biol. 4:e88. doi: 10.1371/journal.pbio.0040088
Duellman, W. W. E., and Trueb, L. (1994). Biology of Amphibians. Baltimore, MA: Johns Hopkins University Press.
Dufresnes, C., Litvinchuk, S. N., Borzee, A., Jang, Y., Li, J.-T., Miua, I., et al. (2016). Phylogengraphy reveals an ancient cryptic radition in East-Asian tree frogs (Hyla japonica group) and complex relationships between continental and island lineages. BMC Evol. Biol. 16:253. doi: 10.1186/s12862-016-0814-x
Edgar, R. C. (2004). MUSCLE: multiple sequence alignment with high accuracy and high throughput. Nucleic Acids Res. 32, 1792–1797. doi: 10.1093/nar/gkh340
Fong, J. J., Li, P., Yang, B., Zhou, Z., Leache, A. D., Min, M. S., et al. (2016). Influence of geology and human activity on the genetic structure and demography of the Oriental fire-bellied toad (Bombina orientalis). Mol. Phylogenet. Evol. 97, 69–75. doi: 10.1016/j.ympev.2015.12.019
Frost, D. R., Grant, T., Faivovich, J., Bain, R. H., Haas, A., Haddad, C. F. B., et al. (2006). The amphibian tree of life. Bull. Am. Mus. Nat. Hist. 297, 1–370. doi: 10.1206/0003-0090(2006)297[0001:TATOL]2.0.CO;2
Harrison, S. P., Yu, G., Takahara, H., and Prentice, I. C. (2001). Diversity of temperate plants in East Asia. Nature 413, 129–130. doi: 10.1038/35093166
Heusser, H. (1969). Die Lebensweise der Erdkröte, Bufo bufo (L.); Das Orientierungsproblem. Rev. Suisse Zool. 76, 443–518.
Hewitt, G. M. (1996). Some genetic consequences of ice ages, and their role in divergence and speciation. Biol. J. Linnean Soc. 58, 247–276. doi: 10.1006/bijl.1996.0035
Hewitt, G. M. (1999). Post-glacial re-colonization of European biota. Biol. J. Linnean Soc. 68, 78–112. doi: 10.1111/j.1095-8312.1999.tb01160.x
Hewitt, G. M. (2004). Genetic consequences of climatic oscillations in the Quaternary. Philos. Transac. R. Soc. B Biol. Sci. 359, 183–195. doi: 10.1098/rstb.2003.1388
Hickerson, M. J., Stahl, E. A., and Lessios, H. A. (2006). Test for simultaneous divergence using approximate Bayesian computation. Evolution 60, 2435–2453. doi: 10.1111/j.0014-3820.2006.tb01880.x
Huelsenbeck, J. P., Nielsen, R., and Bollback, J. P. (2003). Stochastic mapping of morphological characters. Syst. Biol. 52, 131–158. doi: 10.1080/10635150390192780
Inger, R. F. (1960). A review of the Oriental toads of the genus Ansonia Stoliczka. Fieldiana Zool. 39, 473–503. doi: 10.5962/bhl.title.2697
Jackson, S. T., and Weng, C. (1999). Late quaternary extinction of a tree species in eastern North America. Proc. Natl. Acad. Sci. U.S.A. 96. 13847–13852. doi: 10.1073/pnas.96.24.13847
Jeong, T. J., Jun, J., Han, S., Kim, H. T., Oh, K., and Kwak, M. (2013). DNA barcode reference data for the Korean herpetofauna and their applications. Mol. Ecol. Resour. 13, 1019–1032. doi: 10.1111/1755-0998.12055
Jetz, W., McPherson, J. M., and Guralnick, R. P. (2012). Integrating biodiversity distribution knowledge: toward a global map of life. Trends Ecol. Evol. 27, 151–159 doi: 10.1016/j.tree.2011.09.007
Kang, Y. S., and Yoon, I. B. (1975). Illustrated Encyclopedia of Fauna and Flora of Korea. 17. Amphibia and Reptilia. Seoul: Sam Hwa Publishers.
Kass, R. E., and Raftery, A. E. (1995). Bayes factors. J. Am. Stat. Assoc. 90, 773–795. doi: 10.1080/01621459.1995.10476572
Kong, W. S. (1996). The distribution of dicotyledons in time and space in the Korean Peninsula. Kor. J. Quarter. Res. 10, 1–18.
Kong, W. S. (2000). Vegetational history of the Korean Peninsula. Glob. Ecol. Biogeogr. 9, 391–402. doi: 10.1046/j.1365-2699.2000.00203.x
Lanfear, R., Calcott, B., Ho, S. Y. W., and Guindon, S. (2012). PartitionFinder: combined selection of partitioning schemes and substitution models for phylogenetic analyses. Mol. Biol. Evol. 29, 1695–1701. doi: 10.1093/molbev/mss020
Lanfear, R., Frandsen, P. B., Wright, A. M., Senfeld, T., and Calcott, B. (2016). PartitionFinder 2: new methods for selecting partitioned models of evolution for molecular and morphological phylogenetic analyses. Mol. Biol. Evol. 34, 772–773. doi: 10.1093/molbev/msw260
Lee, H. Y., and Park, C. S. (1992). Genetic studies on Korean anurans: mitochondrial DNA variation of Asian toad (Bufo bufo) and water toad (B. stejnegeri). Kor. J. Genet. 14–3, 247–255.
Lee, J., and Park, D. (2009). Effects of body size, operational sex ratio, and age on pairing by the Asian toad, Bufo stejnegeri. Zool. Stud. 48, 334–342.
Lee, M. Y., Lissovsky, A. A., Park, S. K., Obolenskaya, E. V., Dokuchaev, N. E., Zhang, Y. P., et al. (2008). Mitochondrial cytochrome b sequence variations and population structure of Siberian chipmunk (Tamias sibiricus) in Northeastern Asia and population substructure in South Korea. Mol. Cells 26, 566–575.
Leigh, J. W., and Bryant, D. (2015). PopART: full-feature software for haplotype network construction. Methods Ecol. Evol. 6, 1110–1116. doi: 10.1111/2041-210X.12410
Librado, P., and Rozas, J. (2009). DnaSP v5: a software for comprehensive analysis of DNA polymorphism data. Bioinformatics 25, 1451–1452. doi: 10.1093/bioinformatics/btp187
Liu, G. W., and Leopold, E. B. (1994). Climatic comparison of Miocene pollen floras from northern East-China and south-central Alaska, USA. Palaeogeogr. Palaeoclimatol. Palaeoecol. 108, 217–228. doi: 10.1016/0031-0182(94)90235-6
Matsui, M. (1976). A New Toad From Japan. Contributions from the Biological Laboratory, Kyoto University, 1–10.
Matsui, M. (1980). The status and relationship of the Korean toad, Bufo stejnegeri Schmidt. Herpetologica 36, 37–41.
Matsui, M., and Zhao, W. (2004). Bufo stejnegeri. The IUCN Red List of Threatened Species 2004:e.T54766A11200818.
Miller, M. A., Pfeiffer, W., and Schwartz, T. (2010). “Creating the CIPRES Science Gateway for inference of large phylogenetic trees,” in Proceedings of the Gateway Computing Environments Workshop (GCE) (New Orleans, LA), 1–8.
Otofuji, Y., Matsuda, T., Enami, R., Uno, K., Nishihama, K., Halim, N., et al. (2003). Late Cretaceous palaeogmagnetic results from Sikhote Alin, far eastern Russia: tectonic implications for eastern margin of the Mongolia Block. Geophys. J. Int. 152, 202–214. doi: 10.1046/j.1365-246X.2003.01842.x
Otofuji, Y., Matsuda, T., and Nohda, S. (1985). Opening mode of the Japan Sea inferred from the palaeomagnetism of the Japan Arc. Nature 317, 603–604. doi: 10.1038/317603a0
Paradis, E., and Schliep, K. (2018). ape 5.0: an environment for modern phylognetics and evolutionary analyses in R. Bioinformatics 35, 526–528. doi: 10.1093/bioinformatics/bty633
Park, S. J., and Son, I. (2005). Discussions on the distribution and genesis of mountain ranges in the Korean Peninsular (I): the identification mountain ranges using a dEM and reconsideration of current issues on mountain range maps. Kor. Geogr. Soc. J. 1, 126–152.
Park, S. J., and Son, I. (2008). Discussion on the distribution and genesis of mountain ranges in the Korean Peninsular (III): proposing a new mountain range map. Kor. Geogr. Soc. J. 3, 276–295.
Pond, S. L., Frost, S. D., and Muse, S. V. (2005). HyPhy: hypothesis testing using phylogenies. Bioinformatics 21, 676–679. doi: 10.1093/bioinformatics/bti079
Portik, D. M., and Papenfuss, T. J. (2015). Historical biogeography resolves the origins of the endemic Arabian toad lineages (Anura: Bufonidae): evidence for ancient vicariance and dispersal events with the Horn of Africa and South Asia. BMC Evol. Biol. 15:152. doi: 10.1186/s12862-015-0417-y
Pough, F. H., Andrews, R. M., Cadle, J. E., Crump, M. L., Savitszky, A. H., and Wells, K. D. (2004). Herpetology, 3rd Edn. Upper Saddle River, NJ: Pearson Prentice Hall.
Pramuk, J. B. (2006). Phylogeny of South American Bufo (Anura: Bufonidae) inferred from combined evidence. Zool. J. Linn. Soc. 146, 407–452. doi: 10.1111/j.1096-3642.2006.00212.x
Pramuk, J. B., Robertson, T., Sites, J. W., and Noonan, B. P. (2008). Around the world in 10 million years: biogeography of the nearly cosmopolitan true toads (Anura: Bufonidae). Glob. Ecol. Biogeogr. 17, 72–83. doi: 10.1111/j.1466-8238.2007.00348.x
Qian, H., and Ricklefs, R. E. (2000). Large-scale processes and the Asian bias in species diversity of temperate plants. Nature 407, 180–182. doi: 10.1038/35025052
R Core Team (2019). R: A Language and Environment for Statistical Computing. R Foundation for Statistical Computing, Vienna. Available online at: https://www.R-project.org/ (accessed May 20, 2019).
Rambaut, A. (2010). FigTree v1.3.1. Institute of Evolutionary Biology, University of Edinburgh, Edinburgh. Available online at: http://tree.bio.ed.ac.uk/software/figtree/ (accessed May 20, 2019).
Rambaut, A., Drummond, A. J., Xie, D., Baele, G., and Suchard, M. A. (2018). Posterior summarization in Bayesian phylogenetics using Tracer 1.7. Syst. Biol. 67, 901–904. doi: 10.1093/sysbio/syy032
Revell, L. J. (2012). phytools: an R package for phylogenetic comparative biology (and other things). Methods Ecol. Evol. 3, 217–223. doi: 10.1111/j.2041-210X.2011.00169.x
Ronquist, F., Teslenko, M., van der Mark, P., Ayres, D. L., Darling, A., Höhna, S., et al. (2012). MrBayes 3.2: efficientBayesian phylogenetic inference and model choice across a large model space. Syst. Biol. 61, 539–542. doi: 10.1093/sysbio/sys029
Sambrook, J., and Russell, D. W. (2001). Molecular Cloning: A Laboratory Manual, 3rd Edn. Cold Springs Harbor, NY: Cold Springs Harbor Laboratory Press.
Sanchíz, B. (1998). “Salientia,” in Handbuch der Paläoherpetologie, Vol. 4, eds P. Wellnhofer (Munich: Verlag Dr. Friedrich Pfeil), 1–275.
Serizawa, K., Suzuki, H., Iwasa, M. A., Tsuchiya, K., Pavlenko, M. V., Kartavtseva, I. V., et al. (2002). A spatial aspect on mitochondrial DNA genealogy in Apodemus peninsulae from East Asia. Biochem. Genet. 40, 149–161. doi: 10.1023/A:1015841424598
Sinsch, U. (2010). Sex-biased site fidelity and orientation behaviour in reproductive natterjack toads (Bufo calamita). Ethol. Ecol. Evol. 4, 15–32. doi: 10.1080/08927014.1992.9525347
Stamatakis, A. (2014). RAxML version 8: a tool for phylogenetic analysis and post- analysis of large phylogenies. Bioinformatics 30, 1312–1313. doi: 10.1093/bioinformatics/btu033
Tihen, J. A. (1951). Anuran remains from the Miocene of Florida, with the description of a new species of Bufo. Copeia 3, 230–235. doi: 10.2307/1439102
Townsend, J. P. (2007). Profiling phylogenetic informativeness. Syst. Biol. 56, 2223–2231. doi: 10.1080/10635150701311362
Tsuji, H., and Kawamichi, T. (1996). Breeding habitats of a stream-breeding toad, Bufo torrenticola, in an Asian mountain torrent. J. Herpetol. 30, 451–454. doi: 10.2307/1565194
Tsuji, H., and Kawamichi, T. (1998a). Field observations of the spawning behavior of stream toads, Bufo torrenticola. J. Herpetol. 32, 34–40. doi: 10.2307/1565476
Tsuji, H., and Kawamichi, T. (1998b). Underwater breeding behavior of the Japanese stream toad (Bufo torrenticola). Herpetol. Rev. 29, 144–146.
Van Bocxlaer, I., Loader, S. P., Roleants, K., Biju, S. D., Menegon, M., and Bossuyt, F. (2010). Gradual adaptation toward a range-expansion phenotype initiated the global radiation of toads. Science 327, 679–682. doi: 10.1126/science.1181707
Wan, F. (2012). Geological and geomorphological evolution history of Changbai Mountain of Jilin Province. Jilin Geol. 3, 21–22.
Wang, H., Yang, X., Zhu, B., Fan, S., and Dai, T. (1989). K-Ar geochronology and evolution of Cenozoic volcanic rocks in eastern China. China J. Geochem. 8, 1–14. doi: 10.1007/BF02842210
Wiley, E. O., and Lieberman, B. S. (2011). Phylogenetics: Theory and Practice of Phylogenetic Systematics, 2nd Edn. Hoboken, NJ: John Wiley and Sons, Inc.
Yang, S. Y., Suh, J. H., Min, M. S., Kang, Y. J., and Kim, J. B. (2000). Genetic variation and divergence in two Korean Bufo species, Bufo gargarizans and B. stejnegeri (Anura, Bufonidae). Kor. J. Genet. 22, 209–221.
Zhang, H., Yan, J., Zhang, G., and Zhou, K. (2008). Phylogeography and demographic history of Chinese black-spotted frog populations (Pelophylax nigromaculata): evidence for independent refugia expansion and secondary contact. BMC Evol. Biol. 8:21. doi: 10.1186/1471-2148-8-21
Keywords: ancestral state reconstruction, Bayesian skyline, Baekdudaegan Mountain Range, divergence dating, Korea, Northeast Asia
Citation: Fong JJ, Yang B-T, Li P-P, Waldman B and Min M-S (2020) Phylogenetic Systematics of the Water Toad (Bufo stejnegeri) Elucidates the Evolution of Semi-aquatic Toad Ecology and Pleistocene Glacial Refugia. Front. Ecol. Evol. 7:523. doi: 10.3389/fevo.2019.00523
Received: 27 May 2019; Accepted: 27 December 2019;
Published: 22 January 2020.
Edited by:
Jeffrey Peter Townsend, Yale University, United StatesReviewed by:
Richard Glor, University of Kansas, United StatesIñigo Martínez-Solano, National Museum of Natural Sciences (MNCN), Spain
Copyright © 2020 Fong, Yang, Li, Waldman and Min. This is an open-access article distributed under the terms of the Creative Commons Attribution License (CC BY). The use, distribution or reproduction in other forums is permitted, provided the original author(s) and the copyright owner(s) are credited and that the original publication in this journal is cited, in accordance with accepted academic practice. No use, distribution or reproduction is permitted which does not comply with these terms.
*Correspondence: Mi-Sook Min, minbio@yahoo.co.kr