Evidence for morphological and genetic structuring of Plebeia flavocincta (Apidae: Meliponini) populations in Northeast Brazil
 Ulysses Madureira Maia1,2*†
  José Eustáquio dos Santos Júnior3†
  Michele Molina2,4† Juliana Stephanie Galaschi-Teixeira3† Airton Torres Carvalho5†
  Leonardo de Sousa Miranda2,6†
  Vera Lucia Imperatriz-Fonseca7†
  Guilherme Oliveira2,4†
  Tereza Cristina Giannini1,2†
- 1Instituto de Ciências Biológicas, Universidade Federal do Pará, Belém, Brazil
- 2Instituto Tecnológico Vale, Belém, Brazil
- 3Instituto de Genética e Bologia Molecular, Universidade Federal do Pará, Belém, Brazil
- 4Departamento de Genética, Ecologia e Evolução, Instituto de Ciências Biológicas, Universidade Federal de Minas Gerais, Belo Horizonte, Brazil
- 5Departamento de Ciência Animal, Universidade Federal Rural do Semi-Árido, Mossoró, Brazil
- 6Lancaster Environment Centre, Lancaster University, Lancaster, United Kingdom
- 7Instituto de Biociências, Universidade de São Paulo, São Paulo, Brazil
Tropical dry forests are increasingly threatened by human activities. In Northeast Brazil, the Caatinga, an area of tropical dry forests surrounded by wetlands, is considered globally unique among these habitats. In this region, the stingless bee Plebeia flavocincta is found in a variety of environmental, ecological, and demographic conditions. We aimed to characterize P. flavocincta populations within its natural range through wing geometric morphometrics and mitochondrial DNA (mtDNA) analyses. The characterization of population variability can clarify whether the species is morphologically and genetically diverse and whether populations are morphologically and genetically structured. We analyzed 673 samples by wing morphometry and 75 by cytochrome-b assays. Our results revealed P. flavocincta is genetically and morphologically diverse and populations are morphologically and genetically structured. Despite the differentiation between the two most morphologically distant populations, we verified a large overlap of morphological variation between all populations. The genetic analysis showed that the haplotypes were geographically structured into six clusters, four of which were located in coastal areas, and the remaining two in the drier inland region. The characterization of P. flavocincta populations is an important step toward decision-making in programs for the protection, management, and sustainable use of this stingless bee in local breeding efforts.
Introduction
Arid and semiarid regions cover more than 30% of Earth’s land surface (Okin et al., 2006). Within these regions, tropical dry forests are estimated to cover more than one million square kilometers, with more than half in South America (54%), but most are under threat (Miles et al., 2006). In Northeast Brazil, tropical dry forests, locally known as the “Caatinga,” are globally unique, presenting high levels of endemism (Silva et al., 2017; Fernandes et al., 2020). In this region, the local biota is subjected to long periods of high heat and irregular water availability for several months each year. In recent decades, this region of Brazil has undergone a rapid and extensive environmental change caused by the over exploitation of its natural resources (Silva et al., 2017), which are naturally limited due to the region’s climatic conditions (Krol and Bronstert, 2007). Furthermore, future climate projections show large temperature increases and rainfall reductions, suggesting the occurrence of more frequent and intense droughts and a tendency toward desertification in this region (Marengo et al., 2017). Studies aiming to analyze the genetic and phenotypic variability of populations are urgently needed as they can assess the degree of inbreeding, gene flow, and genetic diversity among and within populations (Keyghobadi et al., 2005; Wagner, 2012; Carvalho et al., 2019). Given the increasing loss and modification of natural habitats, in the long term, loss of genetic variation is expected to affect the ability of populations to respond to changing selection pressures (Cheptou et al., 2017).
Changes in natural habitats and species composition can impact ecosystem services and compromise their long-term continuity (González-Varo et al., 2013). One important ecosystem service is pollination, as this service facilitates reproduction in the vast majority of flowering plant species (Potts et al., 2016). Pollination success is closely related to the presence and availability of pollinators (Campbell et al., 2018). Most species of tropical flowering plants depend on insects and other animals as pollinators (Ollerton et al., 2011). Among pollinating animals, bees are considered the most important (Freitas et al., 2009; Ollerton, 2017). Many bee species native to the seasonally dry tropical forests of northeast Brazil, notably species of stingless bees (Meliponini tribe) (Michener, 2013), are exploited for honey production by local beekeepers (Jaffé et al., 2015).
Plebeia flavocincta (Cockerell 1912) is a small (∼4.5 mm) stingless bee with a distribution that is restricted to Northeast Brazil. Its distribution covers both coastal areas and seasonally dry tropical forests (Maia et al., 2020). In this region, the species occurs in a variety of environmental, ecological, and climatic conditions. P. flavocincta can nest in exotic trees and urban areas (Ribeiro and Taura, 2019) and is also considered a docile species, which facilitates its rearing in hives for honey, geopropolis, and pollen (Maia et al., 2015). In addition, it can be used as a pollinator in greenhouses to increase crop production (Imperatriz-Fonseca et al., 2017).
Several studies on pollinators such as bees have demonstrated that tools such as geometric morphometrics and mitochondrial DNA (mtDNA) analysis are robust for detecting subtle variations in populations (Bonatti et al., 2014; Rattanawannee et al., 2017). The geometric morphometry of the wings is useful for detecting small morphological variations that are imperceptible by traditional morphometry (Francoy et al., 2011; Nogueira et al., 2019). The CytB mtDNA gene is useful not only in identifying cryptic bee species but also in assessing intraspecific distribution patterns (Françoso and Arias, 2013; Santos-Júnior et al., 2015, 2019). The application of complementary methods to analyze population variability has shown promising results in understanding the distribution of species and in resolving taxonomic problems (Bonatti et al., 2014; Francoy et al., 2016; Galaschi-Teixeira et al., 2018).
Considering that organisms living in regions with high ecological variation tend to present corresponding levels of biological variation, we aimed to characterize P. flavocincta populations within their natural range through wing geometric morphometry and mtDNA analysis. The characterization of population variability can clarify whether the species is morphologically and genetically diverse and whether populations are morphologically and genetically structured.
Materials and methods
Study area
Within its extension, Northeast Brazil is divided into four biomes (Amazon, Cerrado, Caatinga, and Atlantic Forest). The annual accumulated precipitation does not exceed 700 mm in some areas of the seasonally dry tropical forest, which is frequently affected by long periods of drought (Alvares et al., 2013). In contrast, there are areas in the coastal region where the annual rainfall is more than 1500 mm, and the climate is predominantly a tropical humid climate (Awange et al., 2016; Oliveira et al., 2017).
We collected samples in coastal areas and areas of seasonally dry tropical forest (Caatinga) (Figure 1). The coastal areas contain a wide variety of vegetation native to the coastal region, including deciduous seasonal forest, semideciduous seasonal forest, dense ombrophilous forest, open ombrophilous forest, mixed ombrophilous forest, and associated ecosystems such as sandbanks (restingas), mangroves, and altitude fields (Oliveira-Souza et al., 2018). The Caatinga areas include species typical of shrub communities, with vegetation approximately 8 m in height and predominantly consisting of sparsely distributed small trees and shrubs, in addition to herbaceous patches that develop only during the rainy season (Tavares-Dasmasceno et al., 2017).
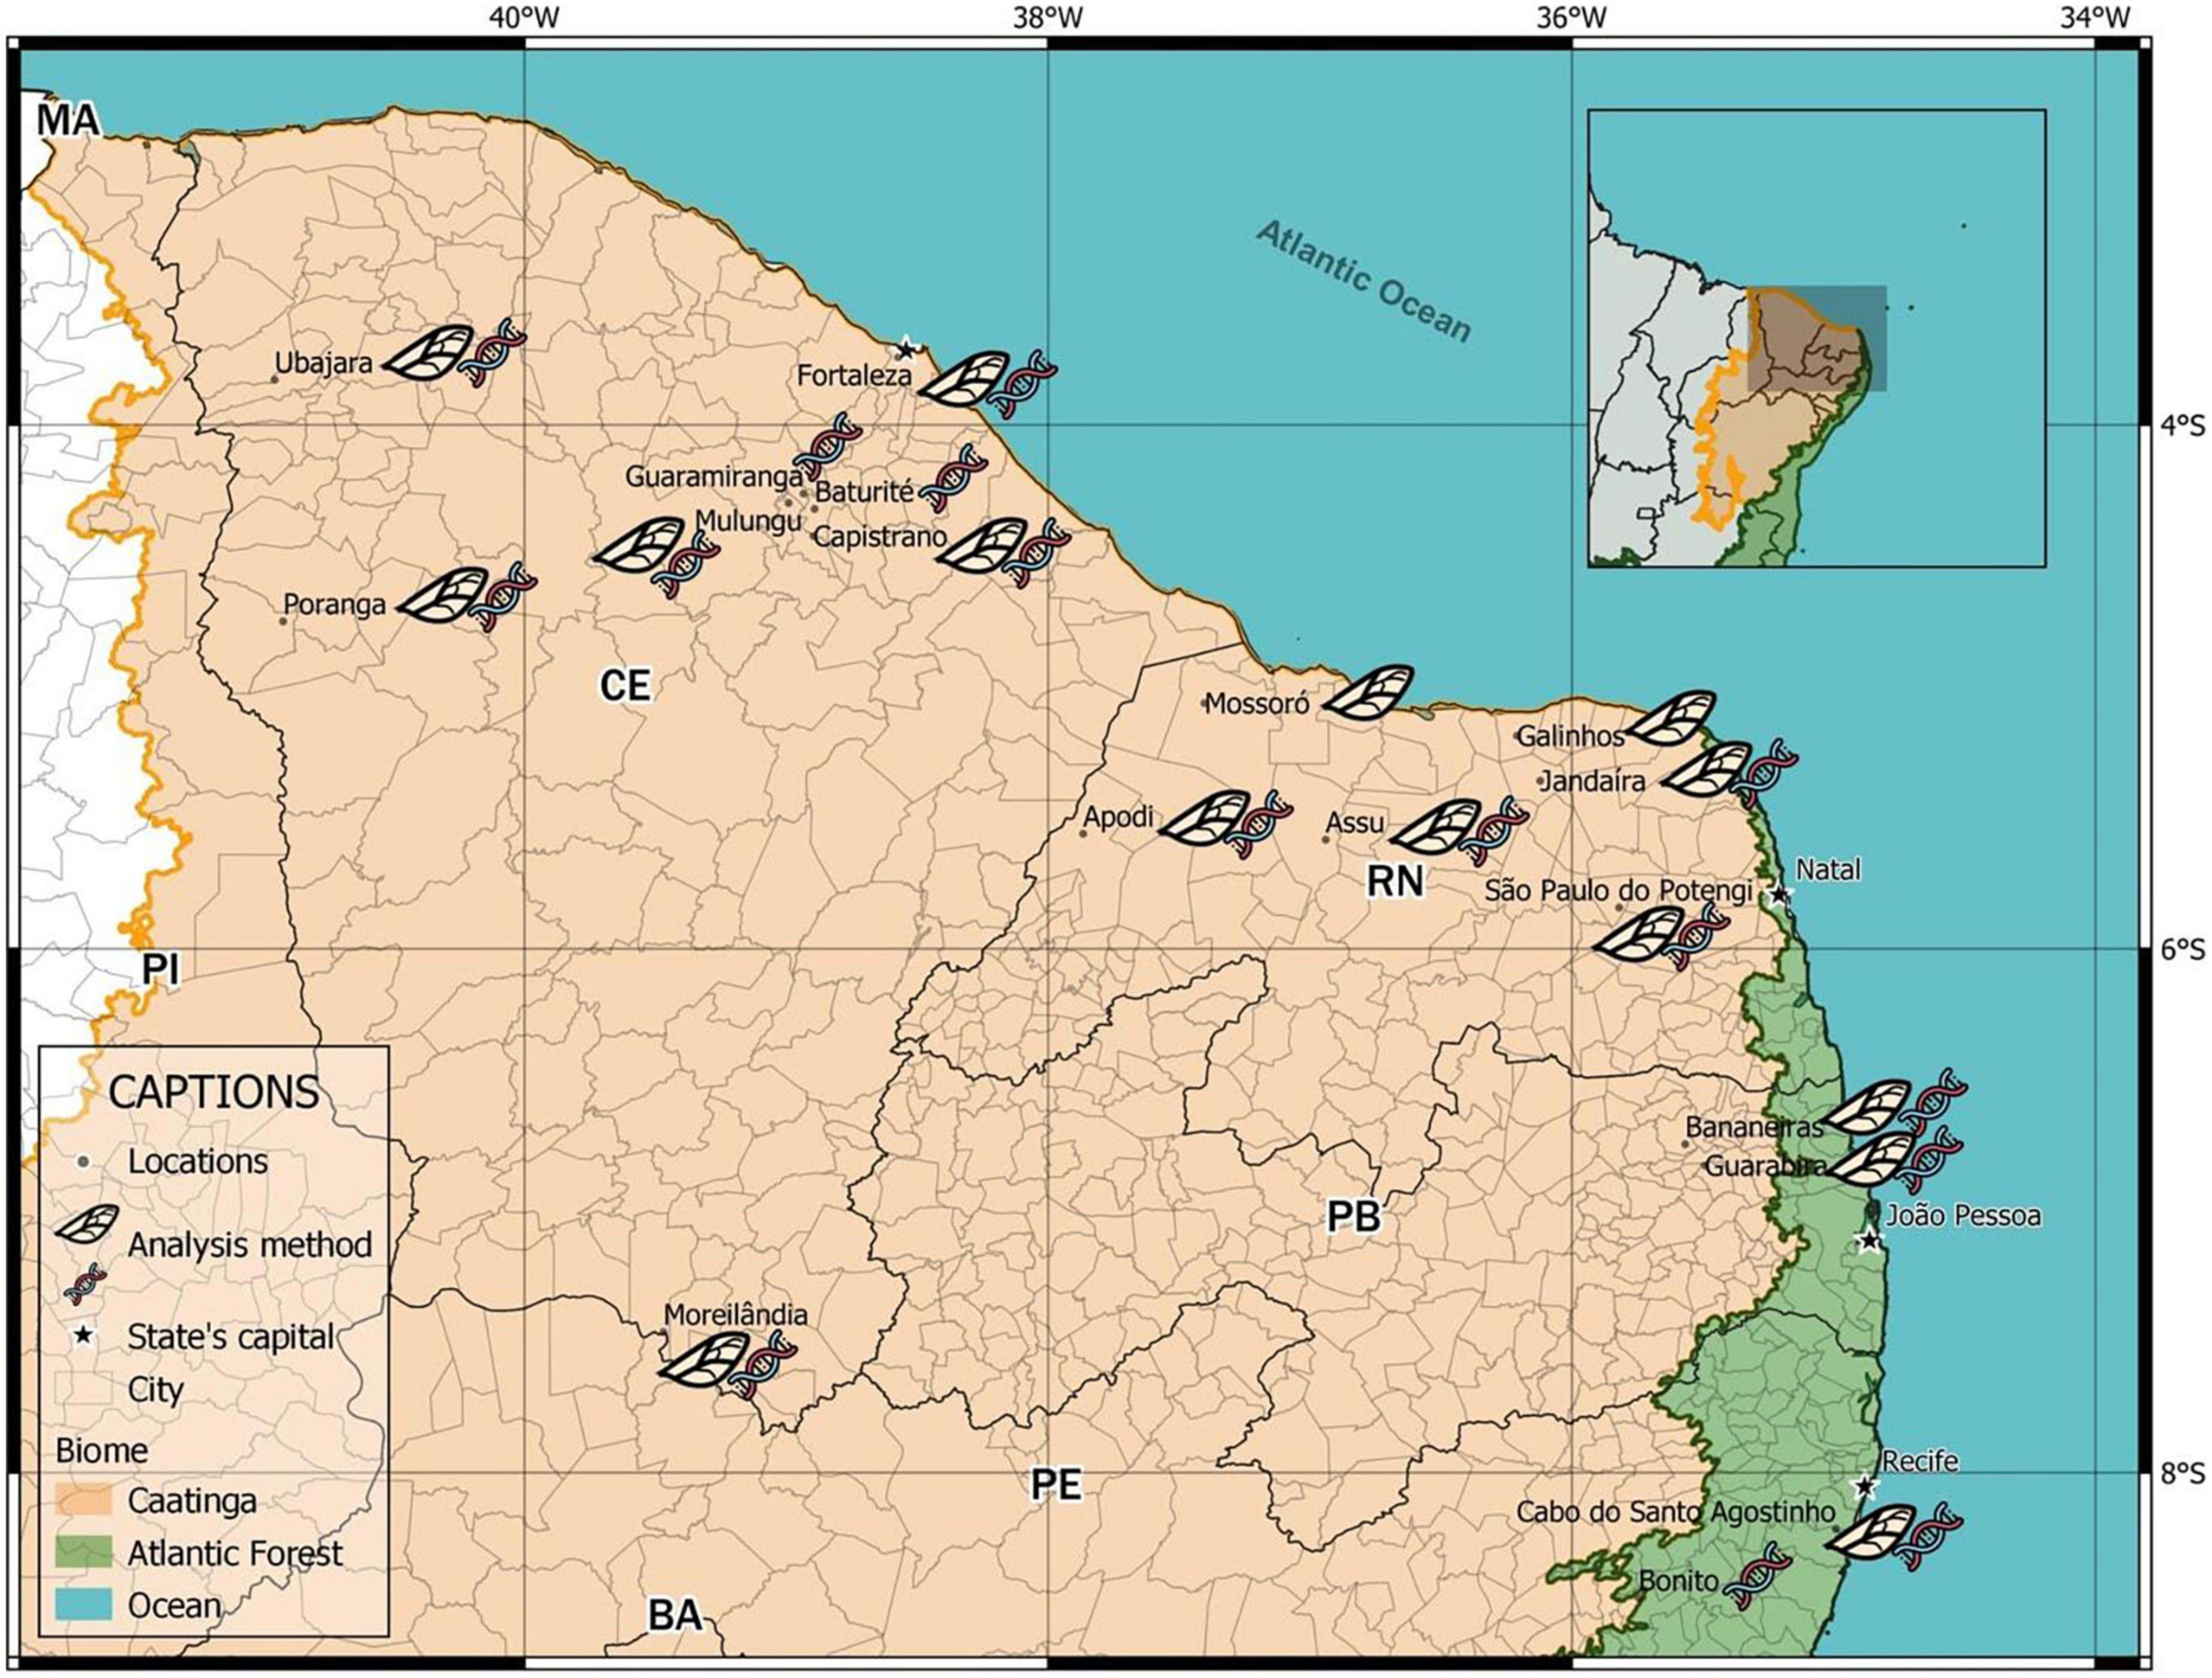
Figure 1. Plebeia flavocincta sampling locations across Northeast Brazil over a map with the two main biomes of the region (Caatinga and Atlantic Forest) showing the two methods used (wing morphometry and molecular analysis). Only one type of analysis was used in some locations.
We collected workers of P. flavocincta from natural nests in 18 locations within their natural range. For the study of the geometric morphometry of the wings, due to differences in the number of nests studied between the localities, we grouped some nearby localities (∼100 km) into microregions (Table 1) according to the Instituto Brasileiro de Geografia e Estatística (IBGE) (Instituto Brasileiro de Geografia e Estatística, 2017). This also reduced the quantity of localities and increased the number of samples per region, increasing the robustness of the analyses.
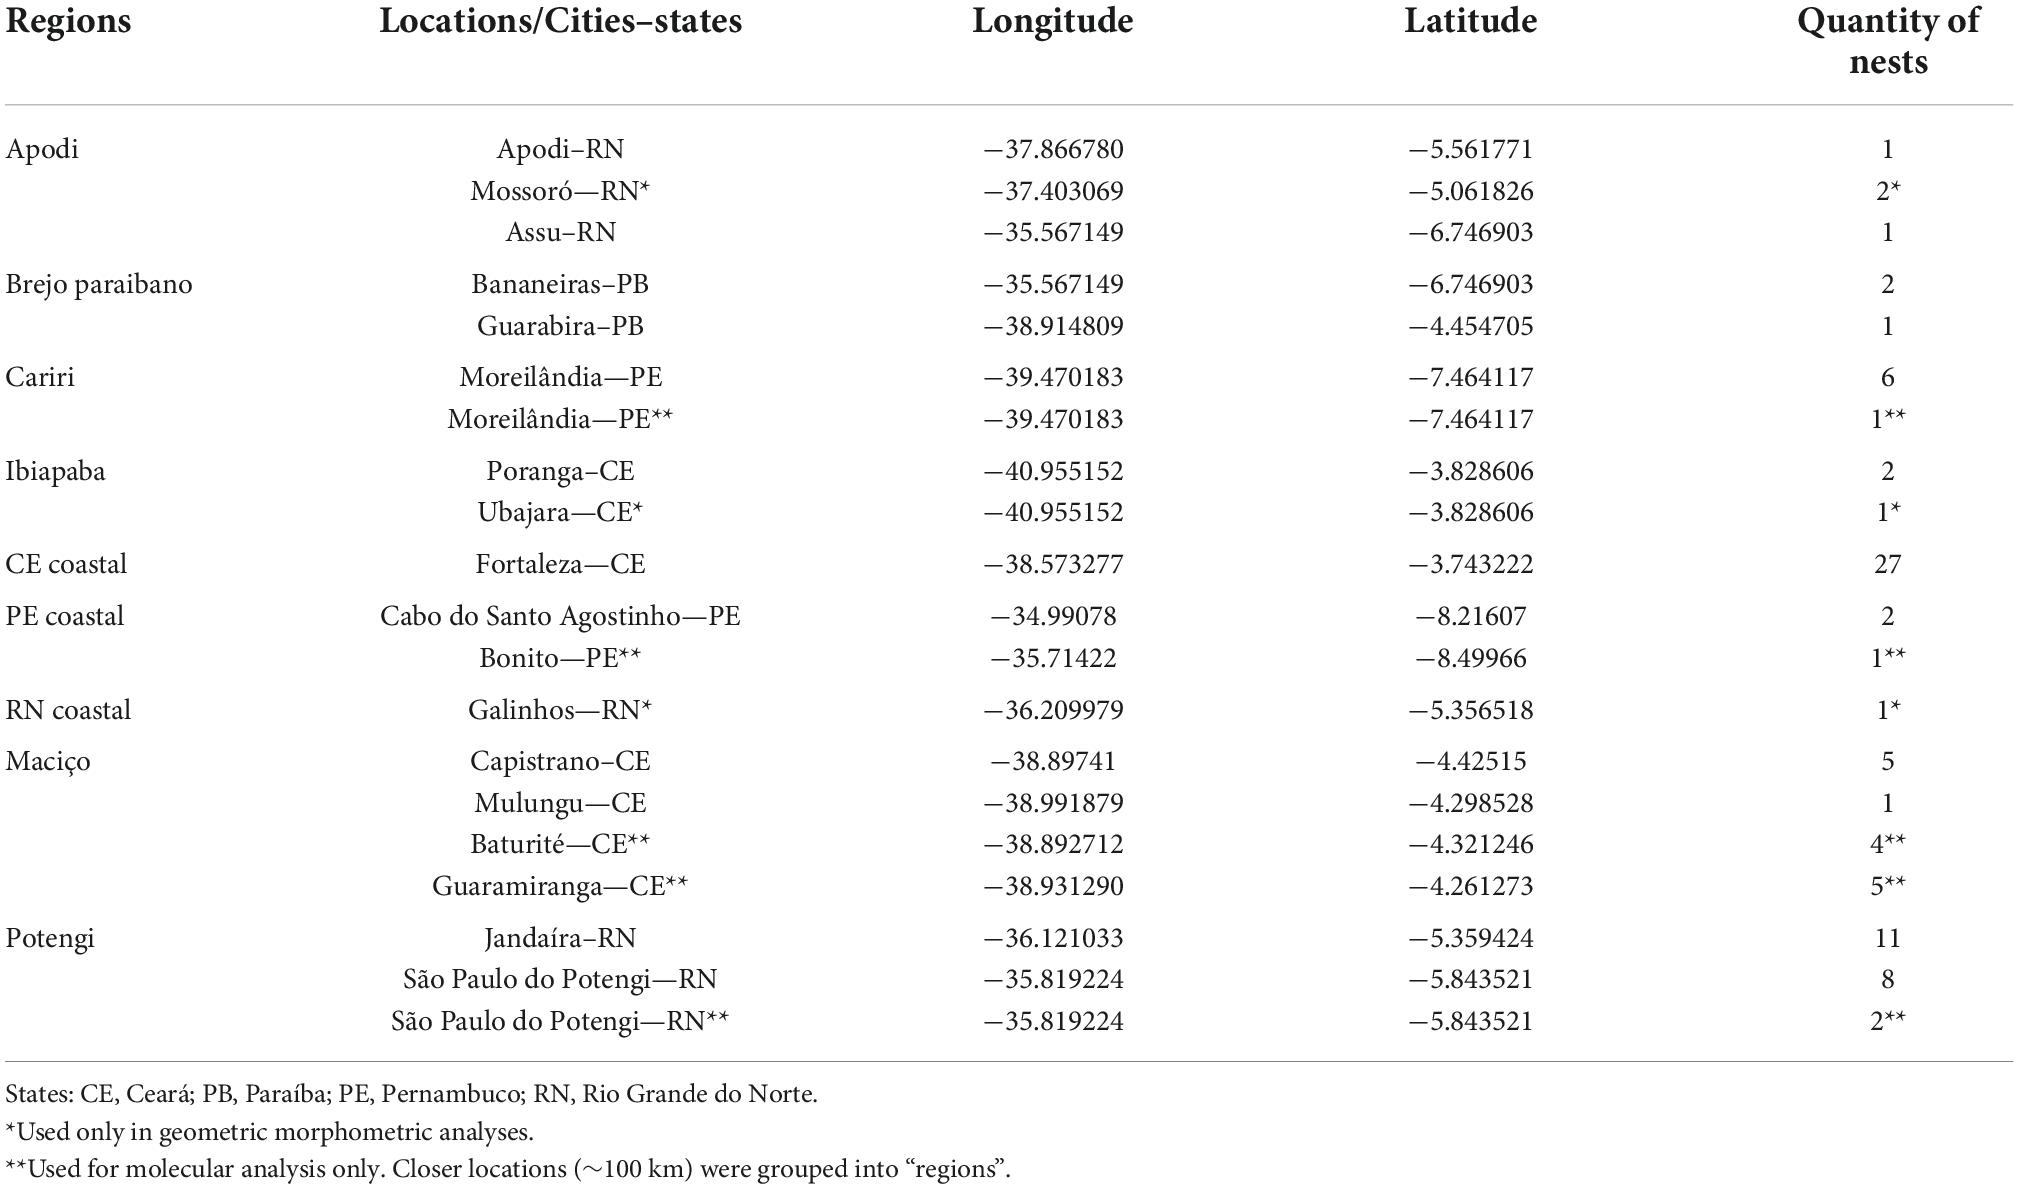
Table 1. Quantity of studied nests of Plebeia flavocincta (Apidae: Meliponini) at 18 locations (15 nests wing geometric morphometry analysis and 16 nests for mitochondrial DNA analysis).
Morphometric analysis of wings
We collected at least 10 workers of P. flavocincta from 71 nests. To analyze the venation pattern of the wings, the right forewing was removed with the aid of tweezers and later mounted between the blade and a coverslip with a brush. Images of these wings were captured by a digital camera attached to a stereomicroscope (Olympus) and stored on a computer. Subsequently, a “.tps” file was created with the images of the wings using tpsUtil software version 1.40 (Rohlf, 2008b), and 13 anatomical landmarks were manually marked at the vein junctions of the cells of each wing using tpsDig software version 2.12 (Rohlf, 2008a) (Figure 2). The images were aligned by Procrustes (Bookstein, 1992) and the average configuration of the wings of bees from the same nest were used as a comparative parameter. We performed principal component analysis (PCA) as an exploratory analysis to characterize shape variation using the relative Cartesian coordinates of each landmark after alignment. Next, we performed canonical variate analysis (CVA) to determine the characteristic structure that best distinguished the groups. We analyzed groups by assigning colonies to geographic origins (Table 1). These analyses were performed using the program MorphoJ version 2.0 (Klingenberg, 2011). To verify if the most morphologically similar populations were also the closest geographically, we also calculated the Mahalanobis distances for all pairs using the pooled within-group covariance matrix for all the groups jointly and correlated them with the geographical distances between the populations using a Mantel test. To graphically visualize the morphological proximities between populations, we created a morphological proximity dendrogram using MEGA version 5 (Tamura et al., 2011).
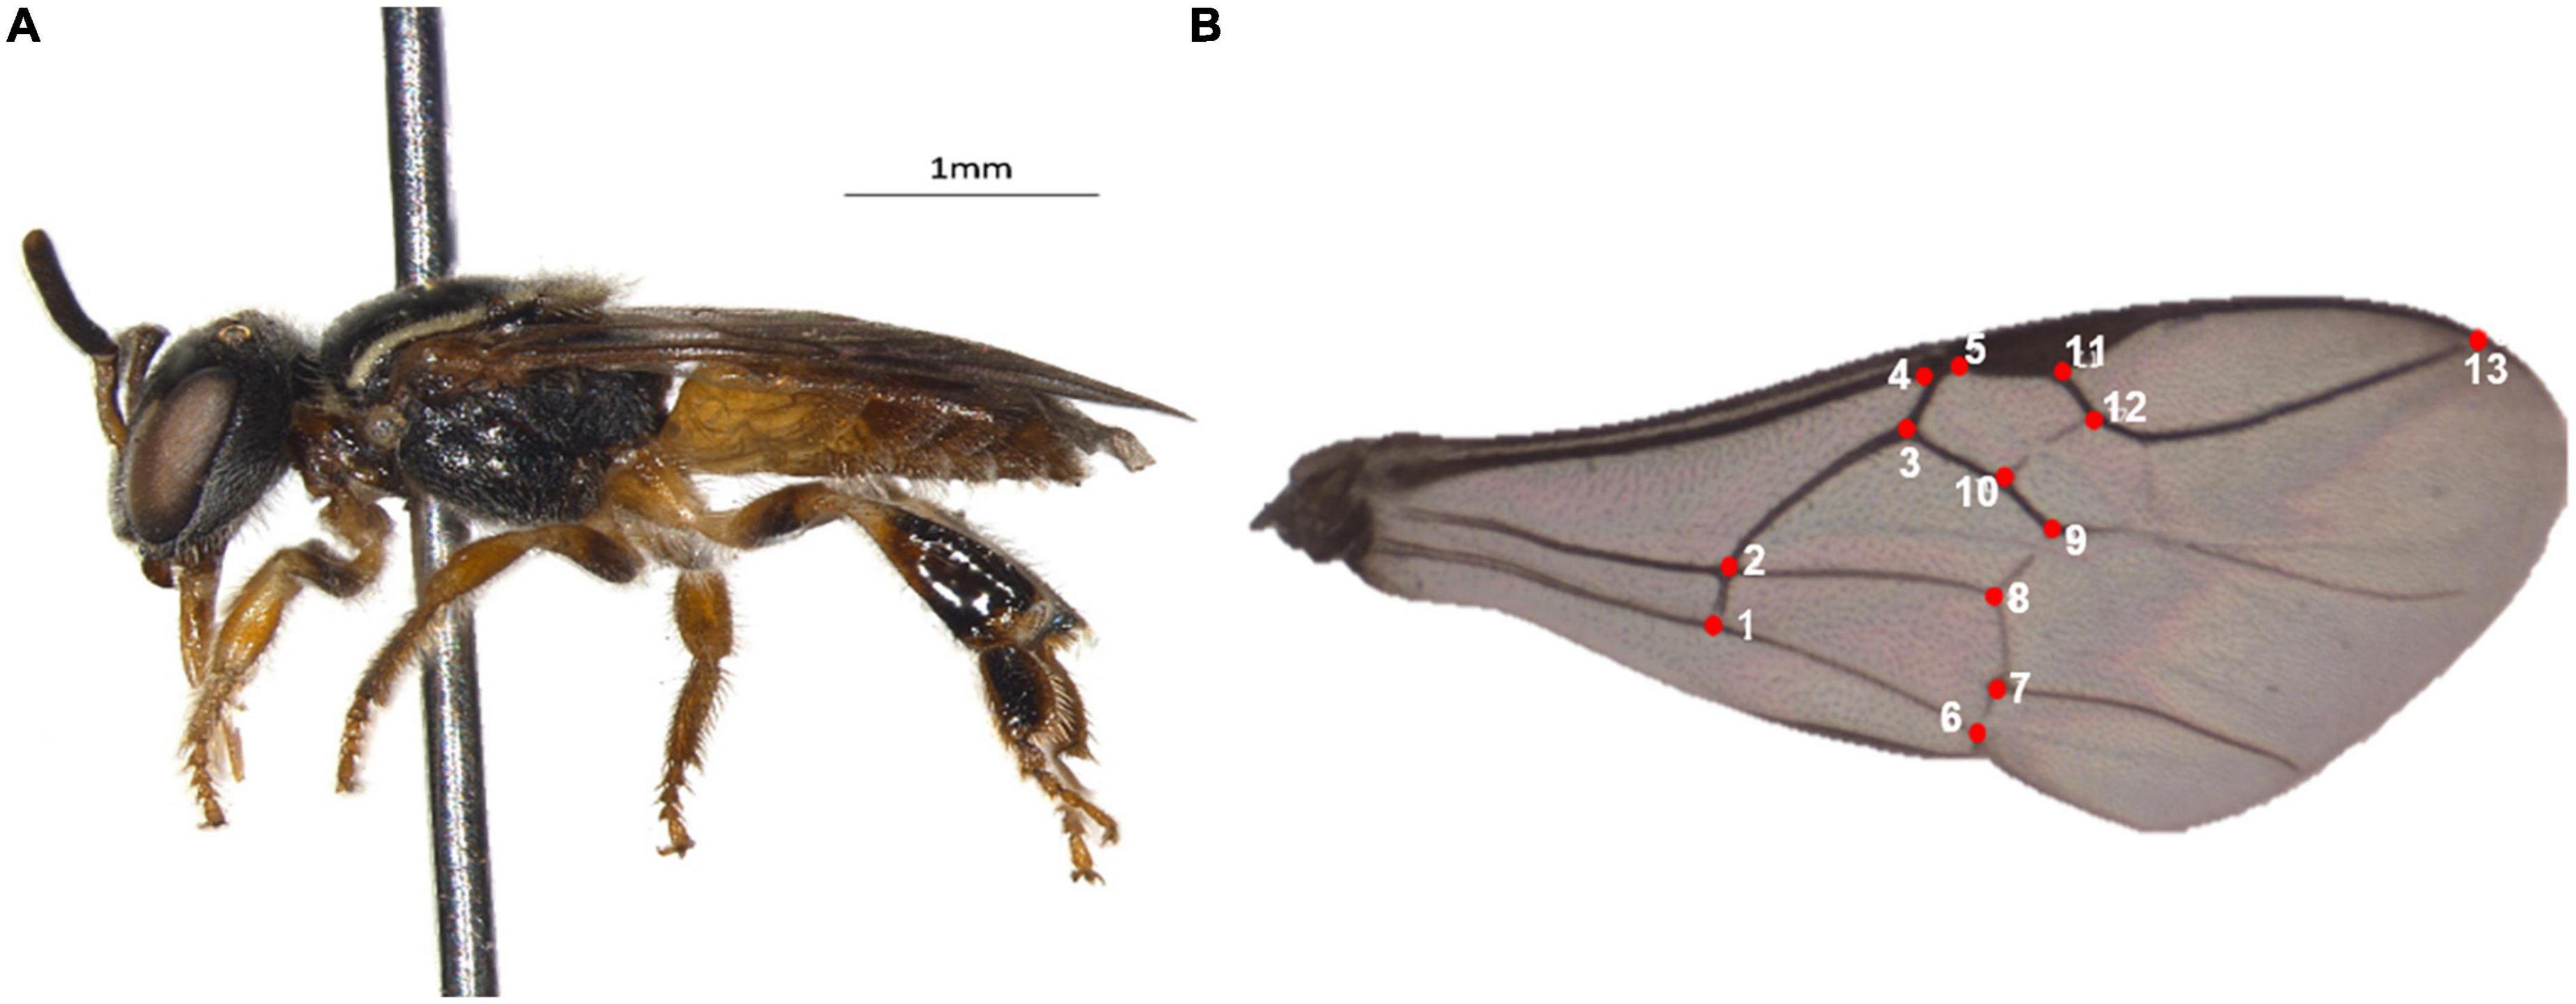
Figure 2. Plebeia flavocincta (A) and its wing (B) showing the 13 anatomical landmarks used (Photos: UMM).
Molecular analyses
For mtDNA analysis, we used P. flavocincta individuals from 75 nests (one individual per nest) from 16 locations within the natural range (Table 1). The laboratory procedures described below were carried out at the Instituto Tecnológico Vale Desenvolvimento Sustentável, Belém, Brazil.
Deoxyribonucleic acid extraction, amplification, and sequencing
Genomic DNA was extracted from one worker per colony using the DNeasy Blood & Tissue Kit (Qiagen) following the manufacturer’s instructions. The Cytochrome B (CytB) region of mtDNA was amplified using the MtD26/MtD28 primer pair (Simon et al., 1994). PCR was performed with a final reaction volume of 25 μl comprising 5–7 μl of template DNA, 5 μl of PCR buffer (5 ×), 2 μl of dNTPs (2 mM), 2.4 μl of MgCl2 (25 mM), 0.5 μl of each primer (10 mM), 2 μl of TBT (trehalose, bovine serum albumin, and polysorbate-20), and 0.2 μl of Go Taq Flex Polymerase (Promega 5 U/μl). Ultrapure water q.s.p. was used to reach a final volume of 25 μl. All PCR amplifications were performed according to Françoso et al. (2016) on a Mastercycler Pro. For amplification with the primers described by Simon et al. (1994), we used the same PCR cycling conditions for the barcode region of DNA. The PCR products were run on a 1.2% agarose gel and visualized with a UV light transilluminator. Subsequently, the amplicons were purified as described in Vasconcelos et al. (2021), and the sequencing reactions were performed with the same primers (forward and reverse) used in the amplification and the amplicons and the reagents of the BigDye Terminator v3.1 Cycle Sequencing Kit (Applied Biosystems) according to the manufacturer’s instructions. Sequencing was performed with an ABI3730 DNA Analyzer (Applied Biosystem).
The sequences obtained were analyzed using the SeqA 6 program (Applied Biosystems) and later edited, checked, and aligned using Geneious Prime 2019.2.3 software (Biomatters). For alignment, MUSCLE (Edgar, 2004) was used. DnaSP v.5.10 software (Librado and Rozas, 2009) was used to separate the haplotypes into their respective groups and determine the number of haplotypes (h) and haplotypic diversity (Hd). The haplotype network was built using NETWORK v. 4.6 (Polzin and Daneshmand, 2003), using the median joining algorithm (Bandelt et al., 1999). The mean number of inter- and intrapopulation variable sites was calculated using the MEGA program version 5 (Tamura et al., 2011). To verify significant correlations between the genetic distances and geographic distances of the studied locations, a Mantel test was performed with the aid of TFPGA software (Miller, 1997).
Population differentiation was detected using Bayesian clustering algorithms in the program GENELAND ver. 4.0.0 (Guillot et al., 2005). First, we performed two runs of 1,000,000 Markov chain Monte Carlo (MCMC) iterations with a thinning interval of 100 and a maximum number of populations of 10 (K = 10). We used correlated allele frequencies and geographic coordinates to parameterize all runs. We inferred K as the modal number of genetic groups estimated among the best of the 1,000,000 iterations for the two runs. Then, we performed two independent runs with K fixed to the number of populations previously inferred.
Demographic inference
A Bayesian Skyline Plot (BSP) reconstruction was implemented to evaluate population size dynamics over time using the BEAST 2.6.6 program (Bouckaert et al., 2014). A CytB substitution rate of 1.9% per lineage per million years per generation (1 year) was adopted [see (Miranda et al., 2017)]. The evolutionary model was inferred by BEAST Model Test (all reversible). The following parameters were employed: a strict clock, 20 million generations, parameter sampling every 1,000 generations of the MCMC analysis, and a 10% burn-in. Convergence between runs and the performance of the analysis were checked using Tracer 1.7.1 and the plots were constructed with the aid of the same program (Rambaut et al., 2018).
Results
Morphological characterization of populations through geometric morphometry
Our data revealed at least 22 measurements of relative deformations in the geometric morphometry of the wings, according to the Procrustes residuals generated for PCA (Figure 3). Among such measures, the first 14 explained 91.46% of the variability in the entire data set, with PC1 and PC2 explaining 22.15 and 13.92% of the variation in the sample, respectively. In the scatter plot of PCA results (Figure 3), the horizontal axis (PC1) shows differentiation with large overlapped variation space among these groups. Axis 2 (PC2) showed that there are no differences between the pairs of populations since they completely overlapped.
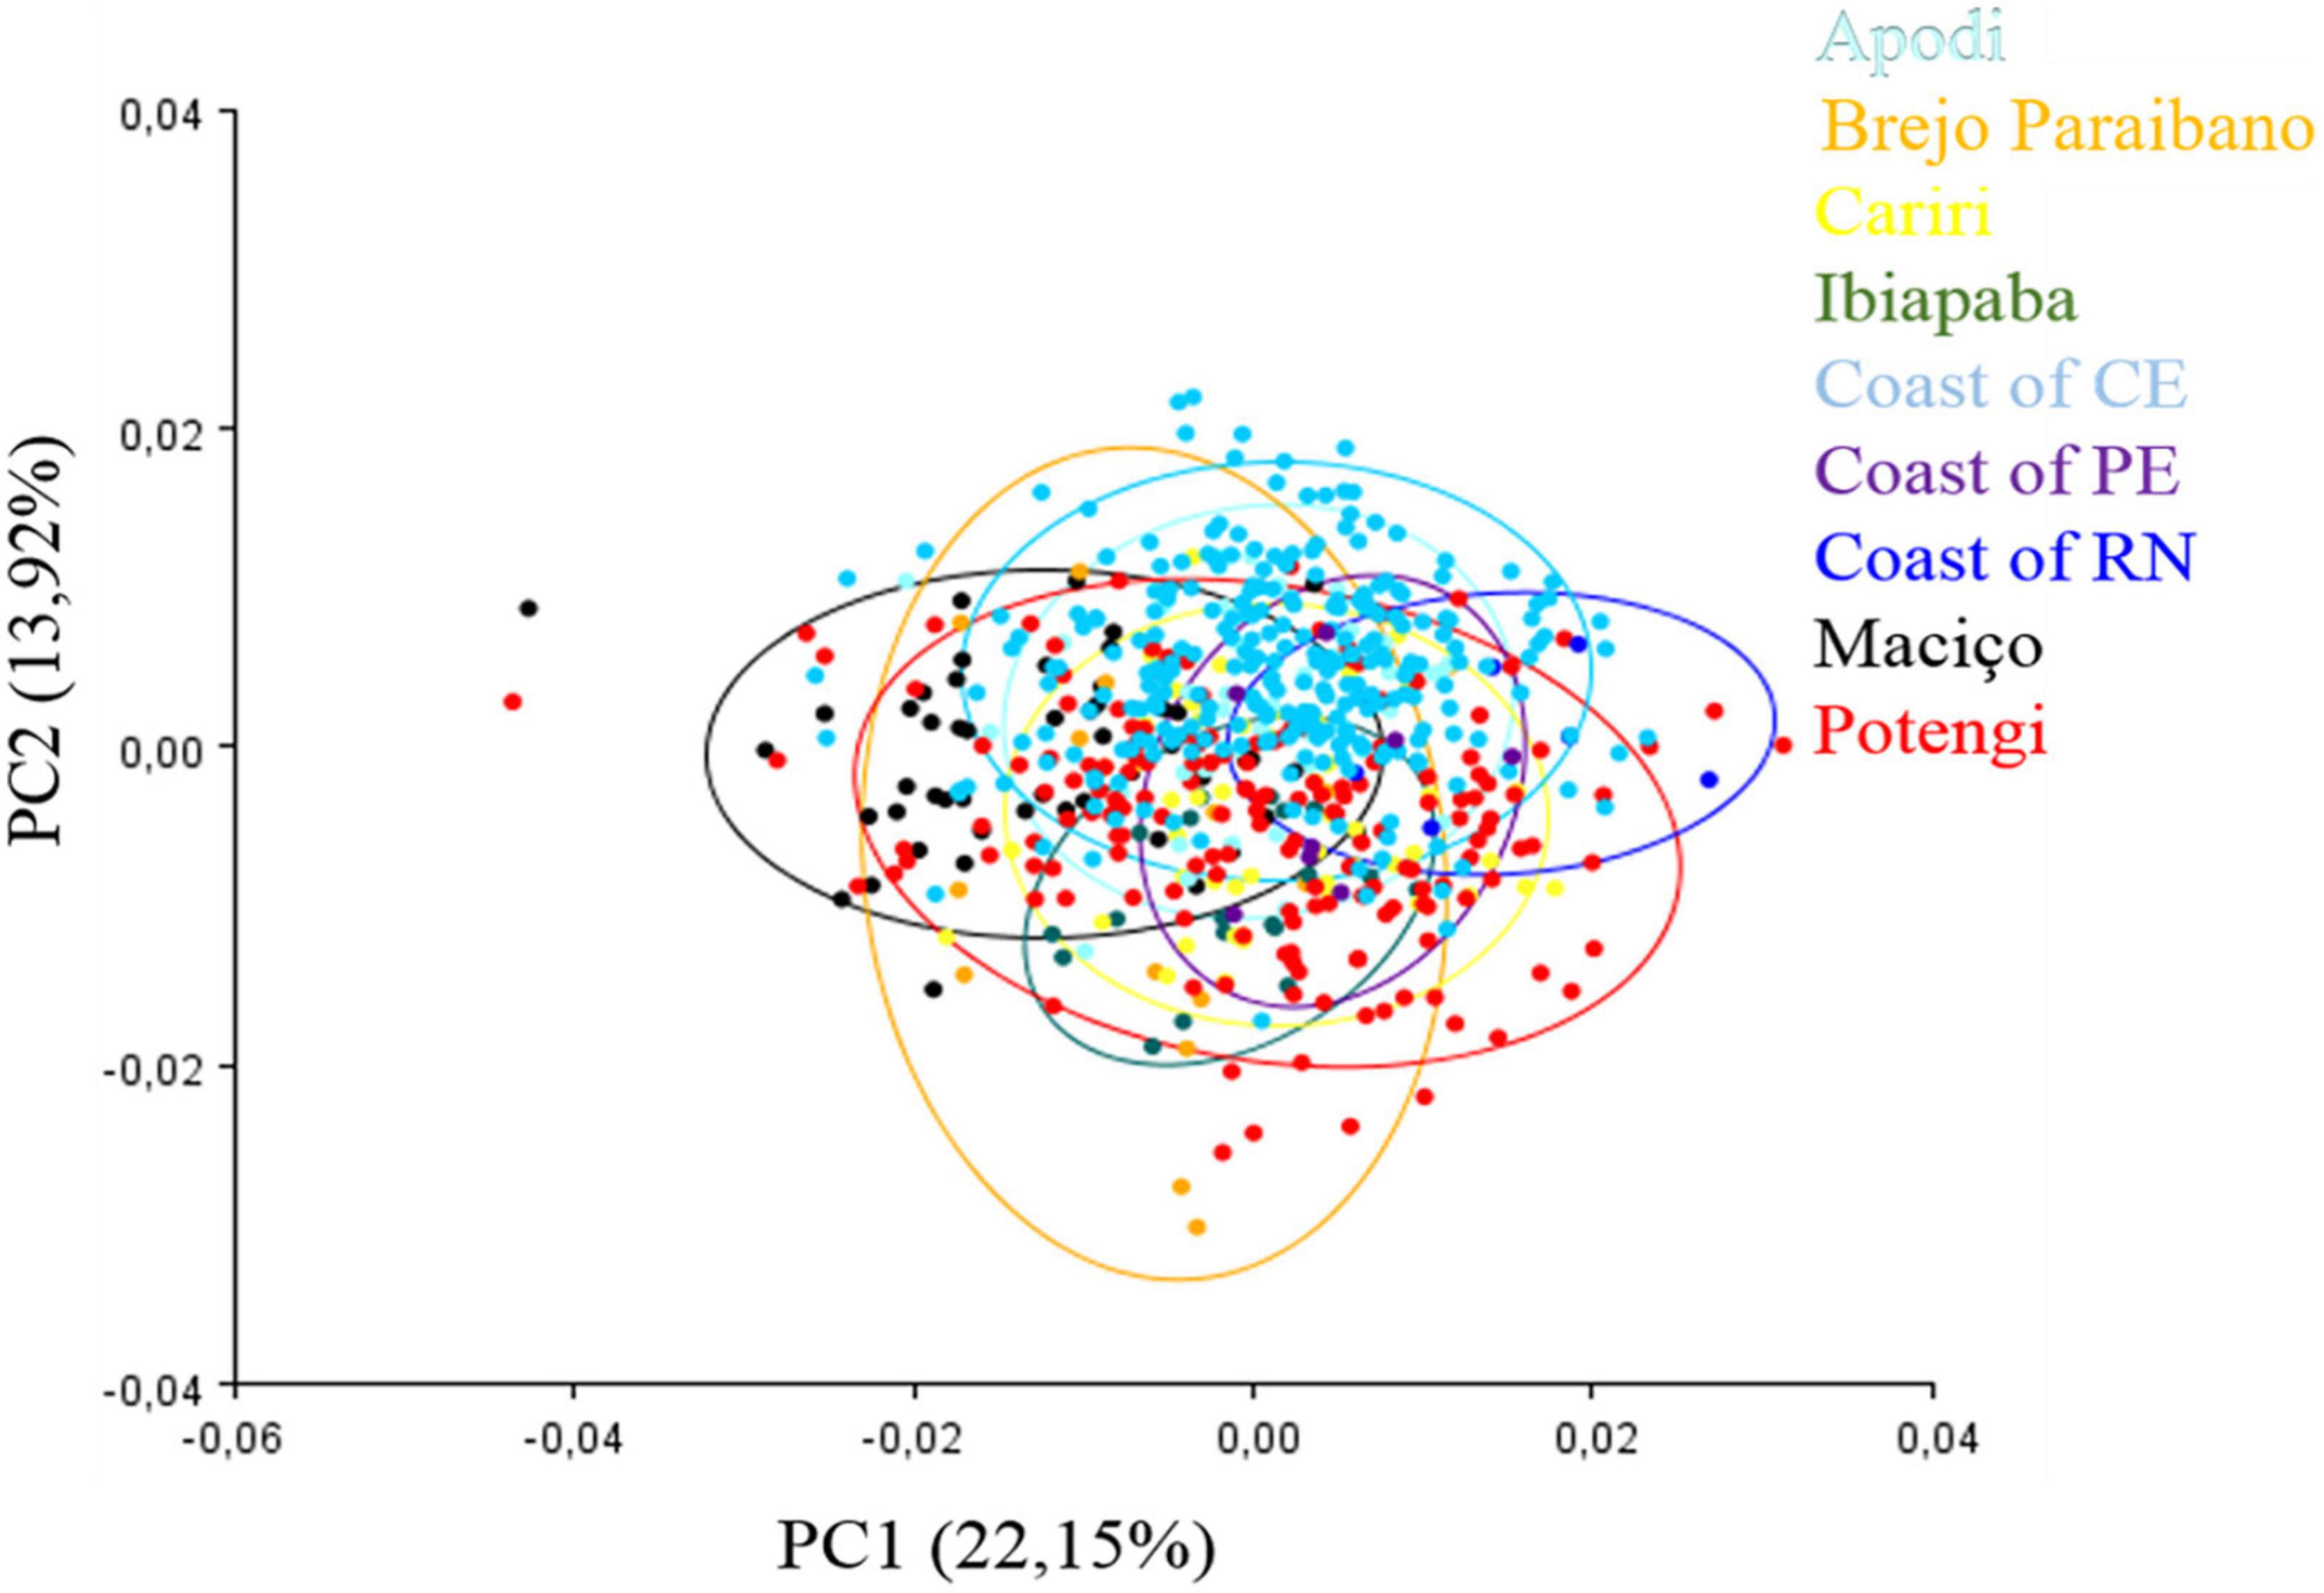
Figure 3. Principal component analysis of the 13 anatomical landmarks marked at the wing rib junctions of Plebeia flavocincta.
Canonical variate analysis using the covariance matrix of all groups showed eight axes that maximized the separation of these populations (Table 2). Among the eight axes, the first two axes (CV1 and CV2) explained 55.71% of the variation in the data set. The characteristic distribution of points that best showed the separation of P. flavocincta groups can be seen in the scatter plot (Figure 4). Although separation was found between the RN coastal, Ibiapaba, and Maciço, there was an overlap of morphological variation of the other pairs between them.
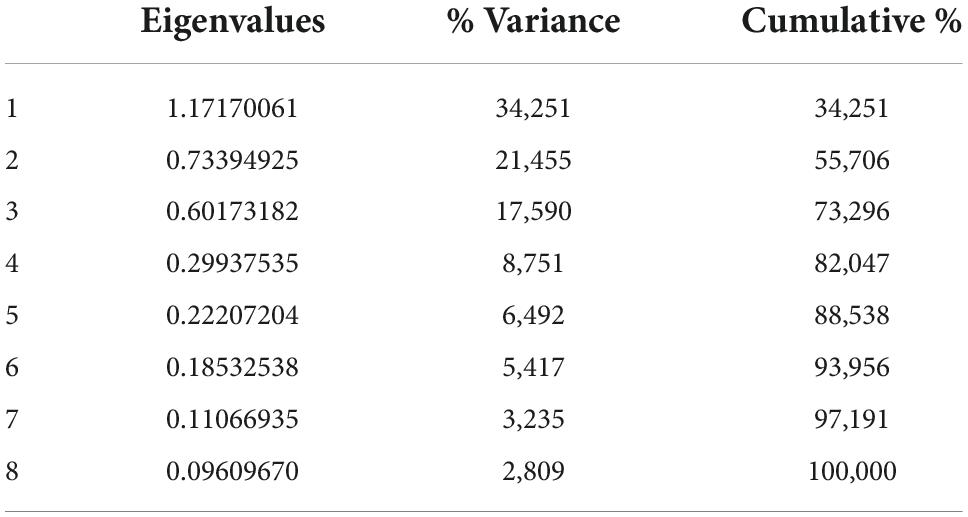
Table 2. Variation of the axes of canonical variables.
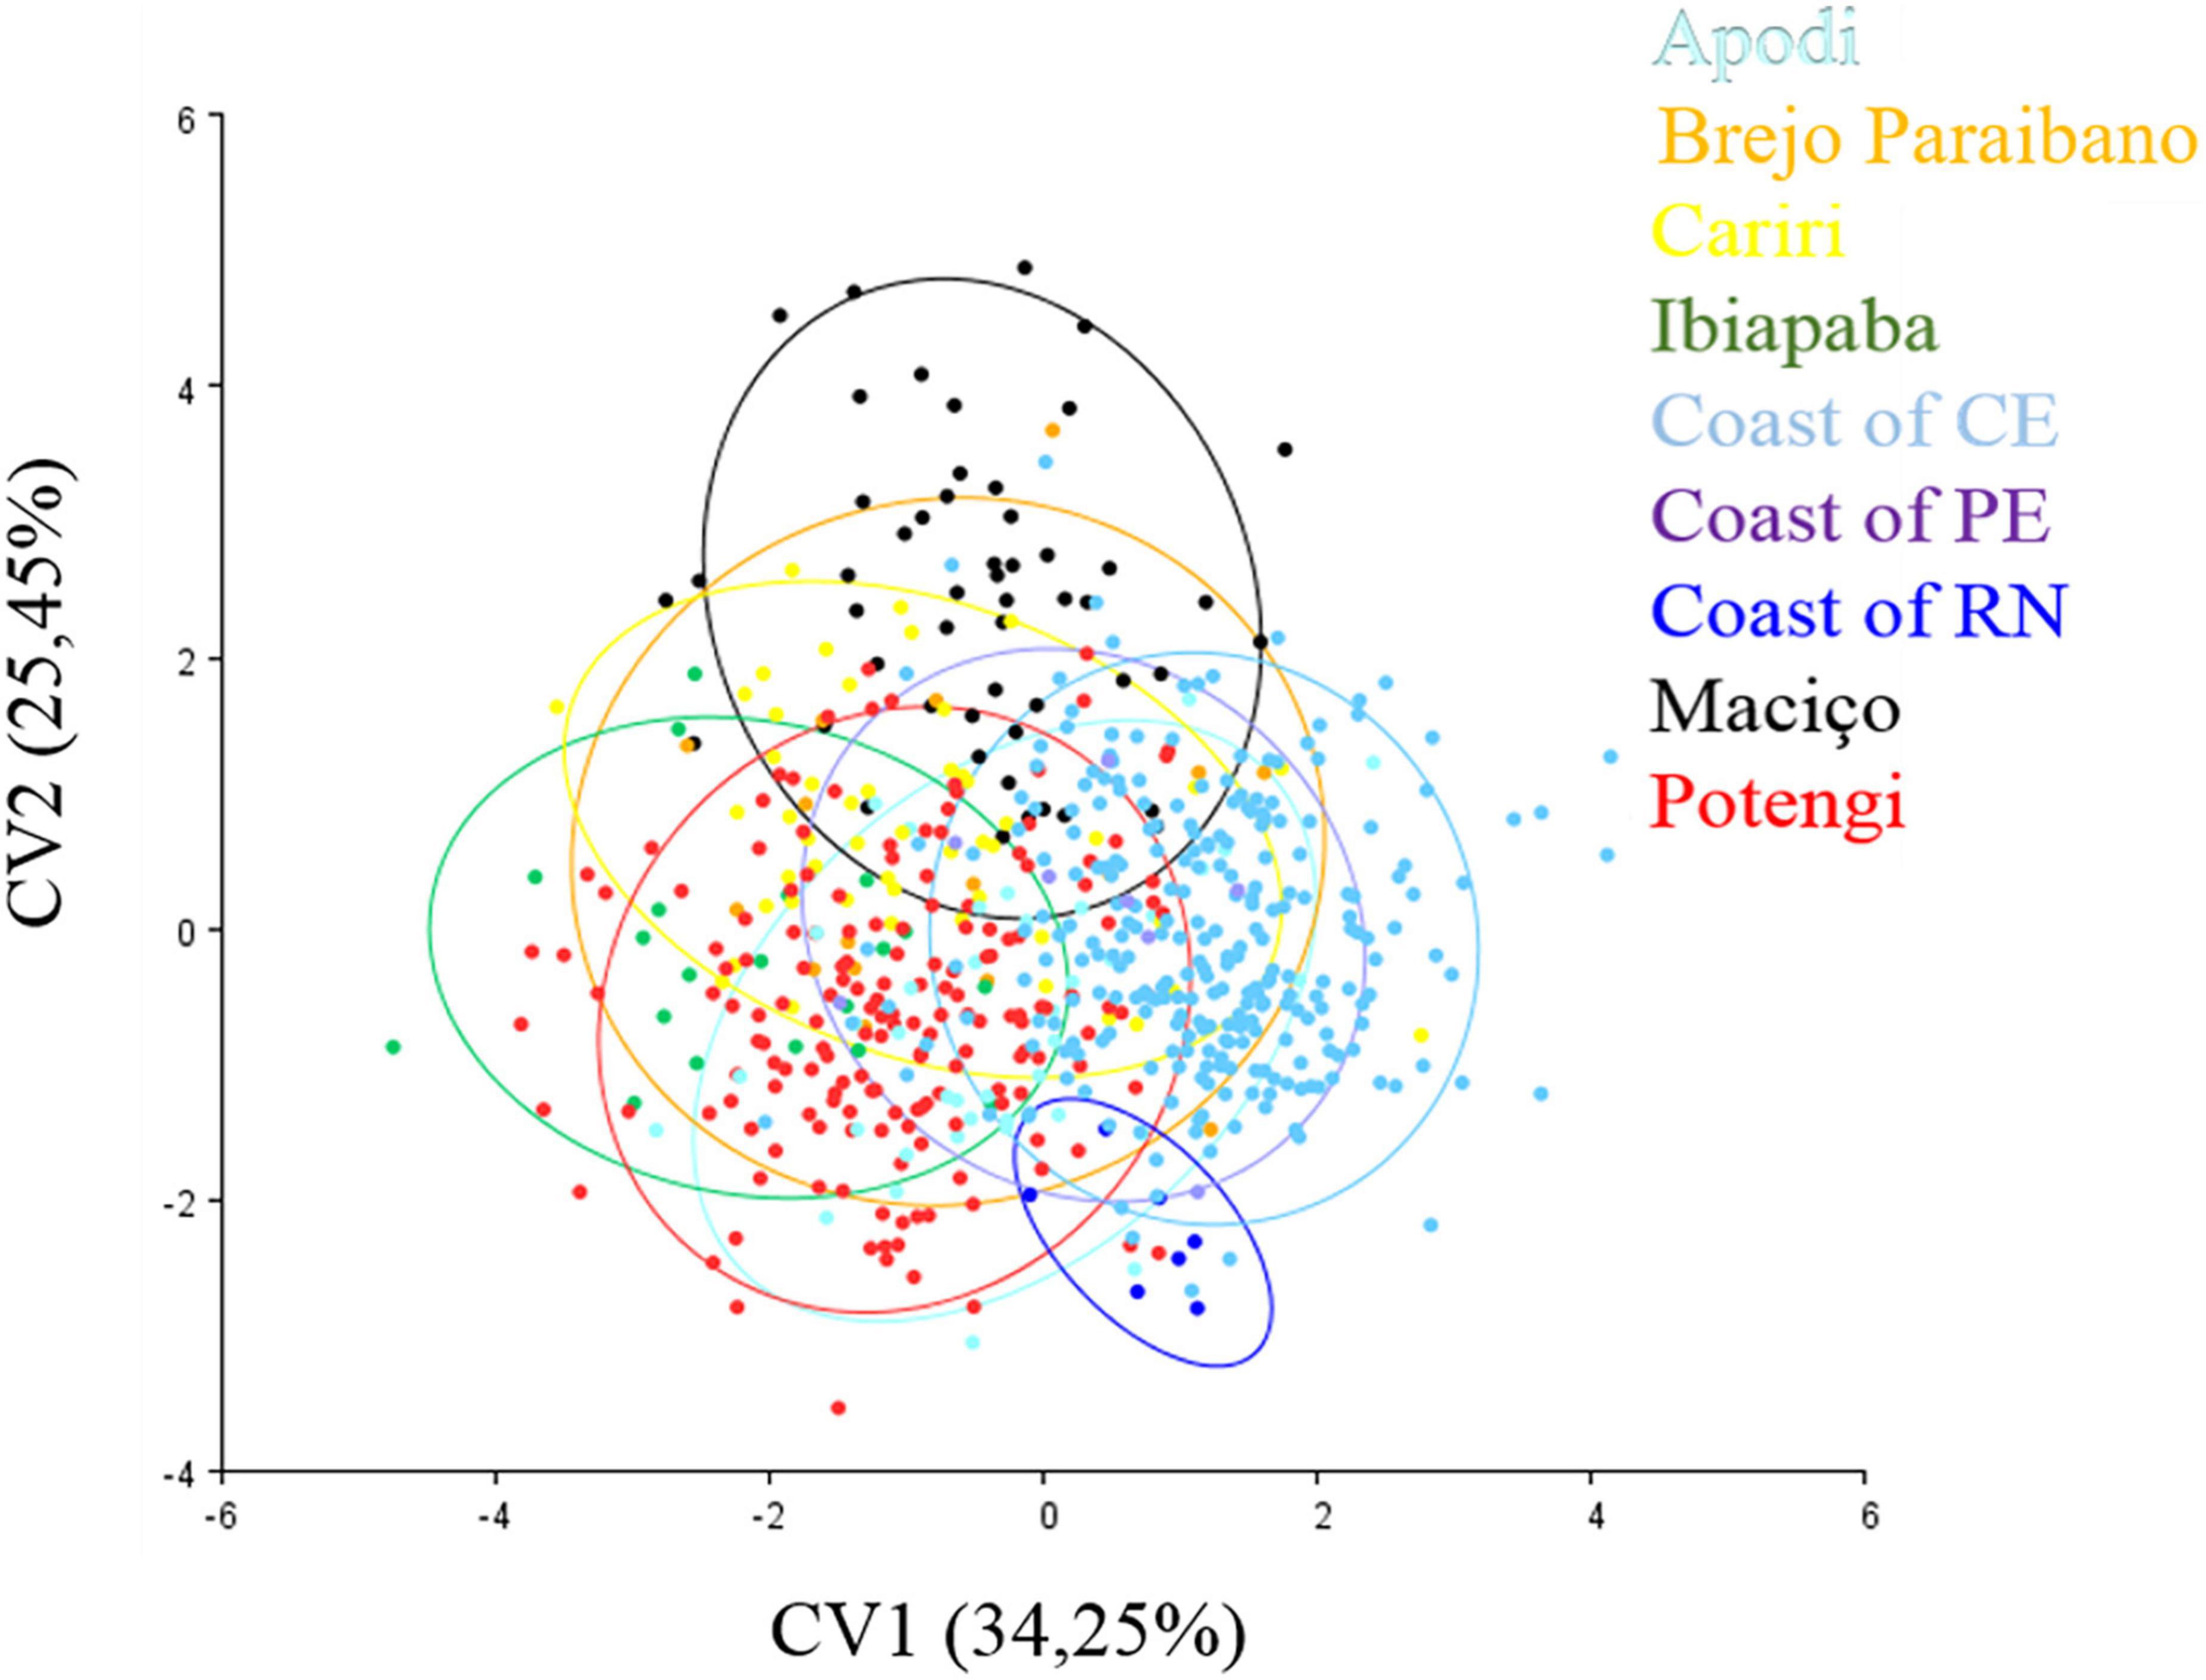
Figure 4. Canonical variate analysis of the 13 anatomical landmarks marked at the wing rib junctions of Plebeia flavocincta.
Considering the squared Mahalanobis distances (Table 3) and Procrustes distances between populations (Table 4), the greatest morphological proximity (shortest distance) occurred between the Cariri and Potengi populations, while the greatest distance was observed between the RN coastal and PE coastal populations. The RN coastal population and, primarily, PE coastal population showed the greatest distances from the populations of all other locations (Table 3). The Mantel test based on the Mahalanobis distances and geographic distances showed no correlation between morphological and geographic distances (r = 0.060, p = 0.321).
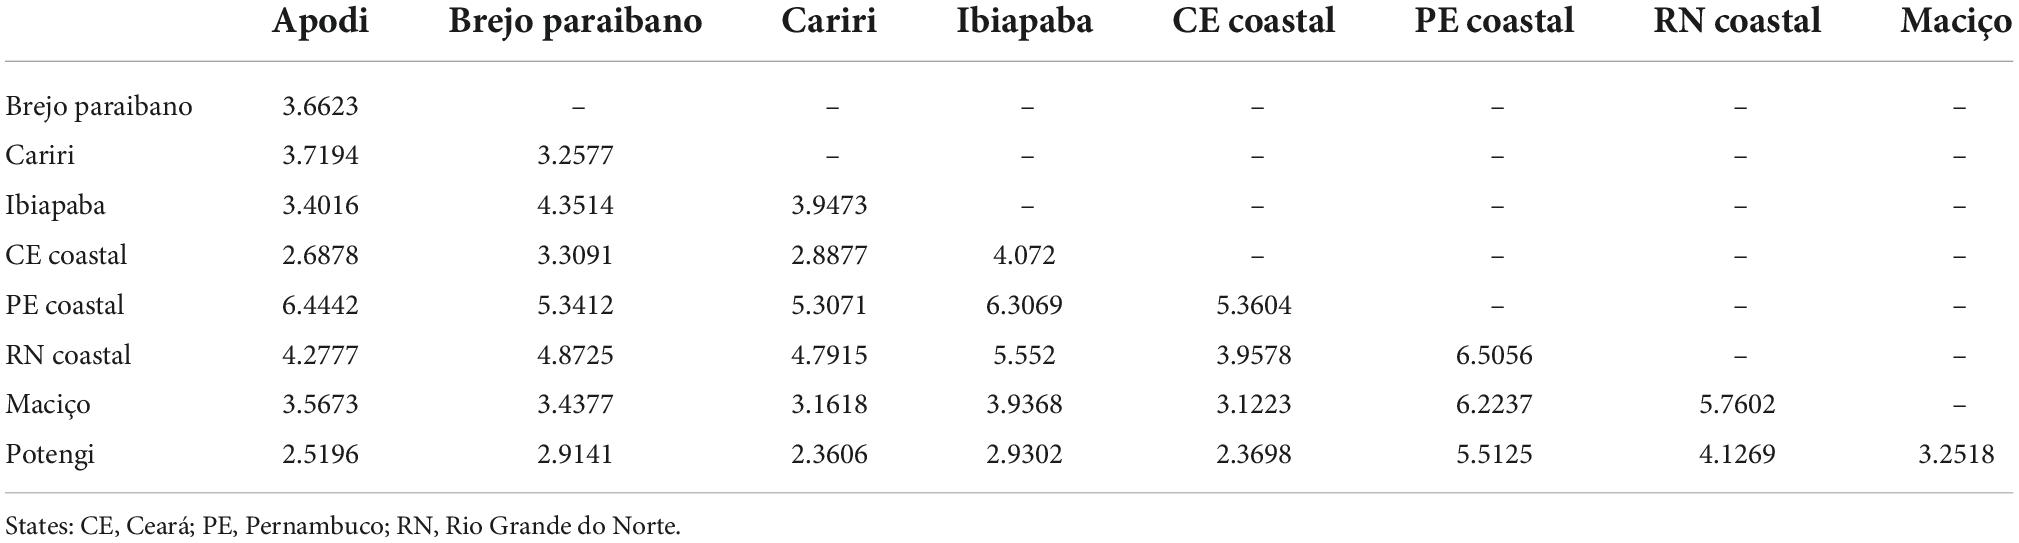
Table 3. Squared Mahalanobis distances between the centroids of the analyzed regions.
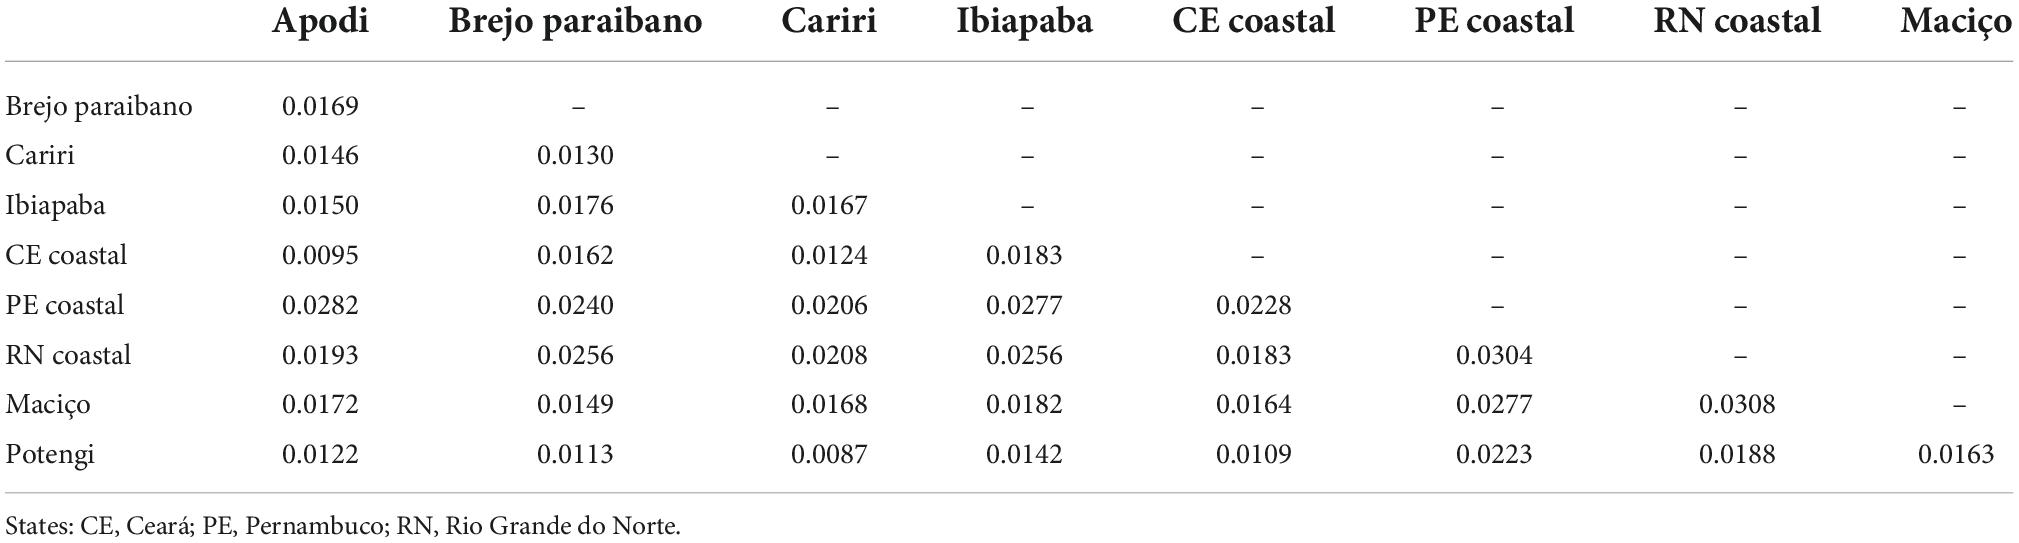
Table 4. Procrustes distances between regions obtained from the anatomical landmarks of the wings of Plebeia flavocincta.
Based on the squared Mahalanobis distances, a dendrogram of morphological proximity between the studied groups was constructed (Figure 5), in which the coastal populations were morphologically farther apart and formed groups that were more external and isolated from each other than populations from inland areas.
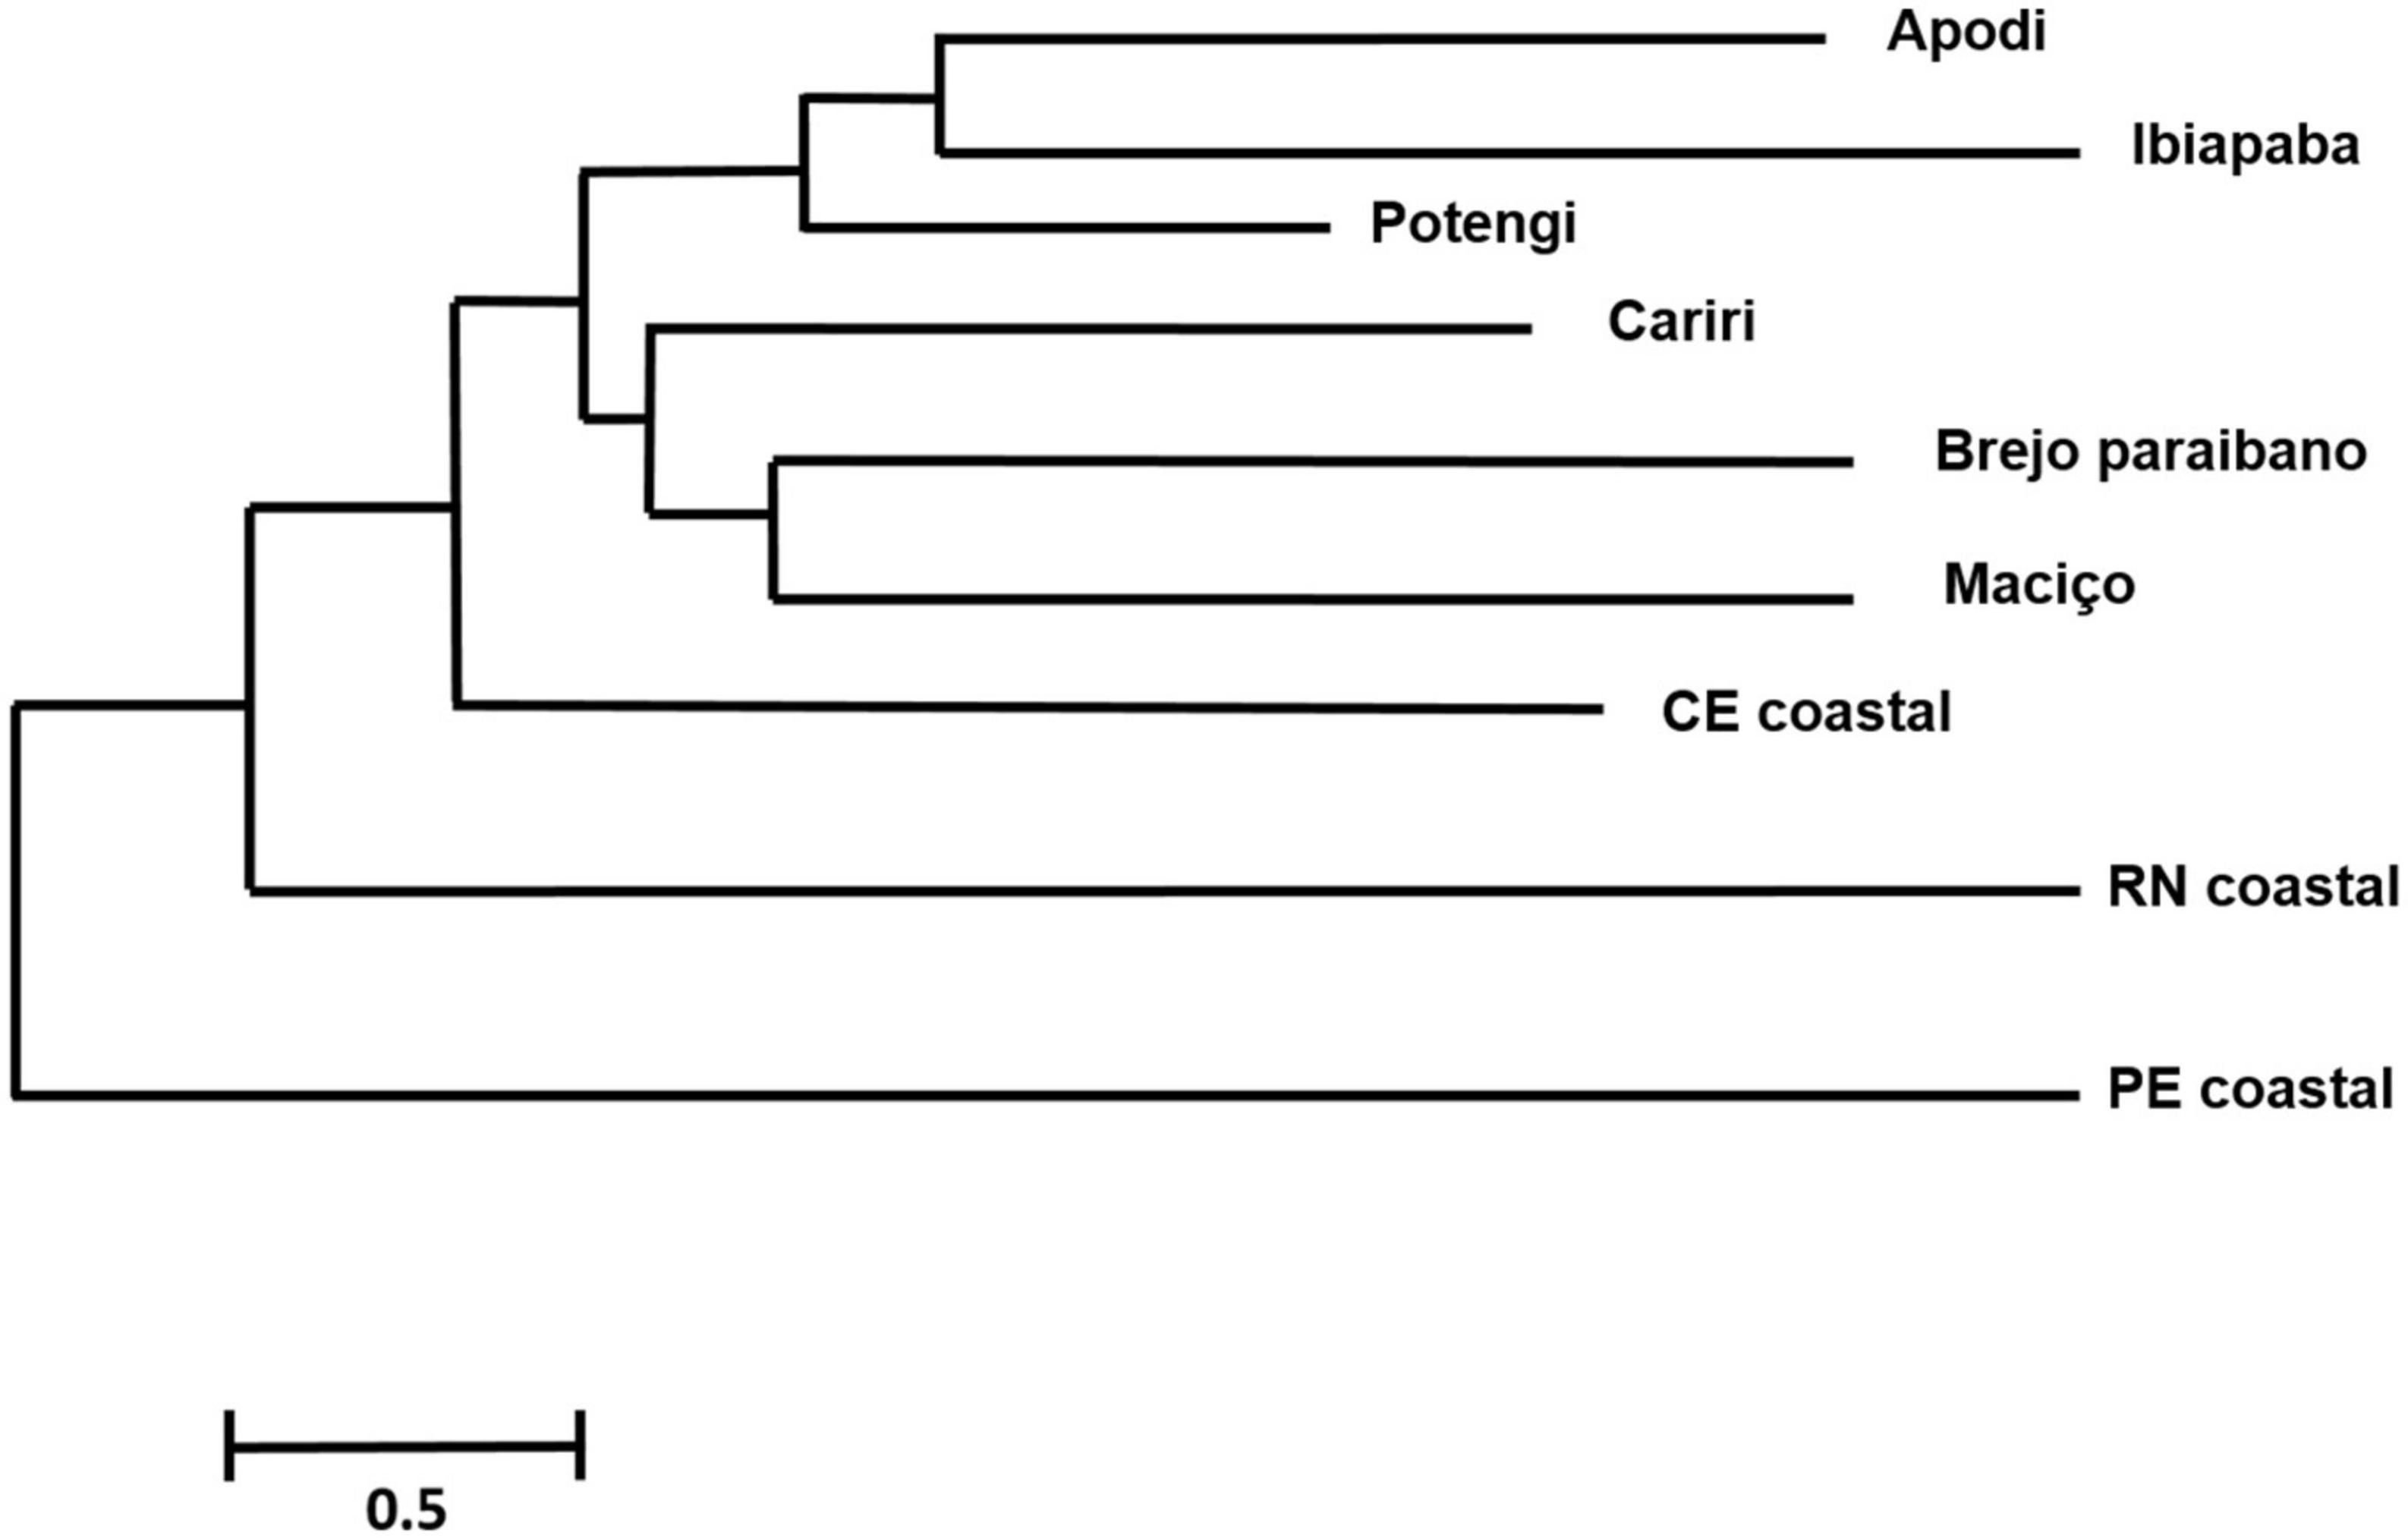
Figure 5. Morphological proximity dendrogram based on the neighbor-joining method calculated from the Mahalanobis distances between the groups (regions) studied.
Genetic characterization of populations through mitochondrial DNA
Eighteen haplotypes were found (Figure 6 and Table 5), with Hap-15 being the most frequent (23 colonies). Haplotypes Hap-01, Hap-02, Hap-04, Hap-06, Hap-10, Hap-12, Hap-14, and Hap-18 were less frequent, occurring in only one colony each. Hap-3 was shared by four locations. The haplotype diversity index (Hd) was 0.85. Some localities had a single haplotype that was not shared with any other locality. The clustering approach implemented in Geneland consistently detected six genetic clusters (subpopulations) (Figure 7). These results suggest separation of the four populations along the coast and two other populations in inland areas of Northeast Brazil.
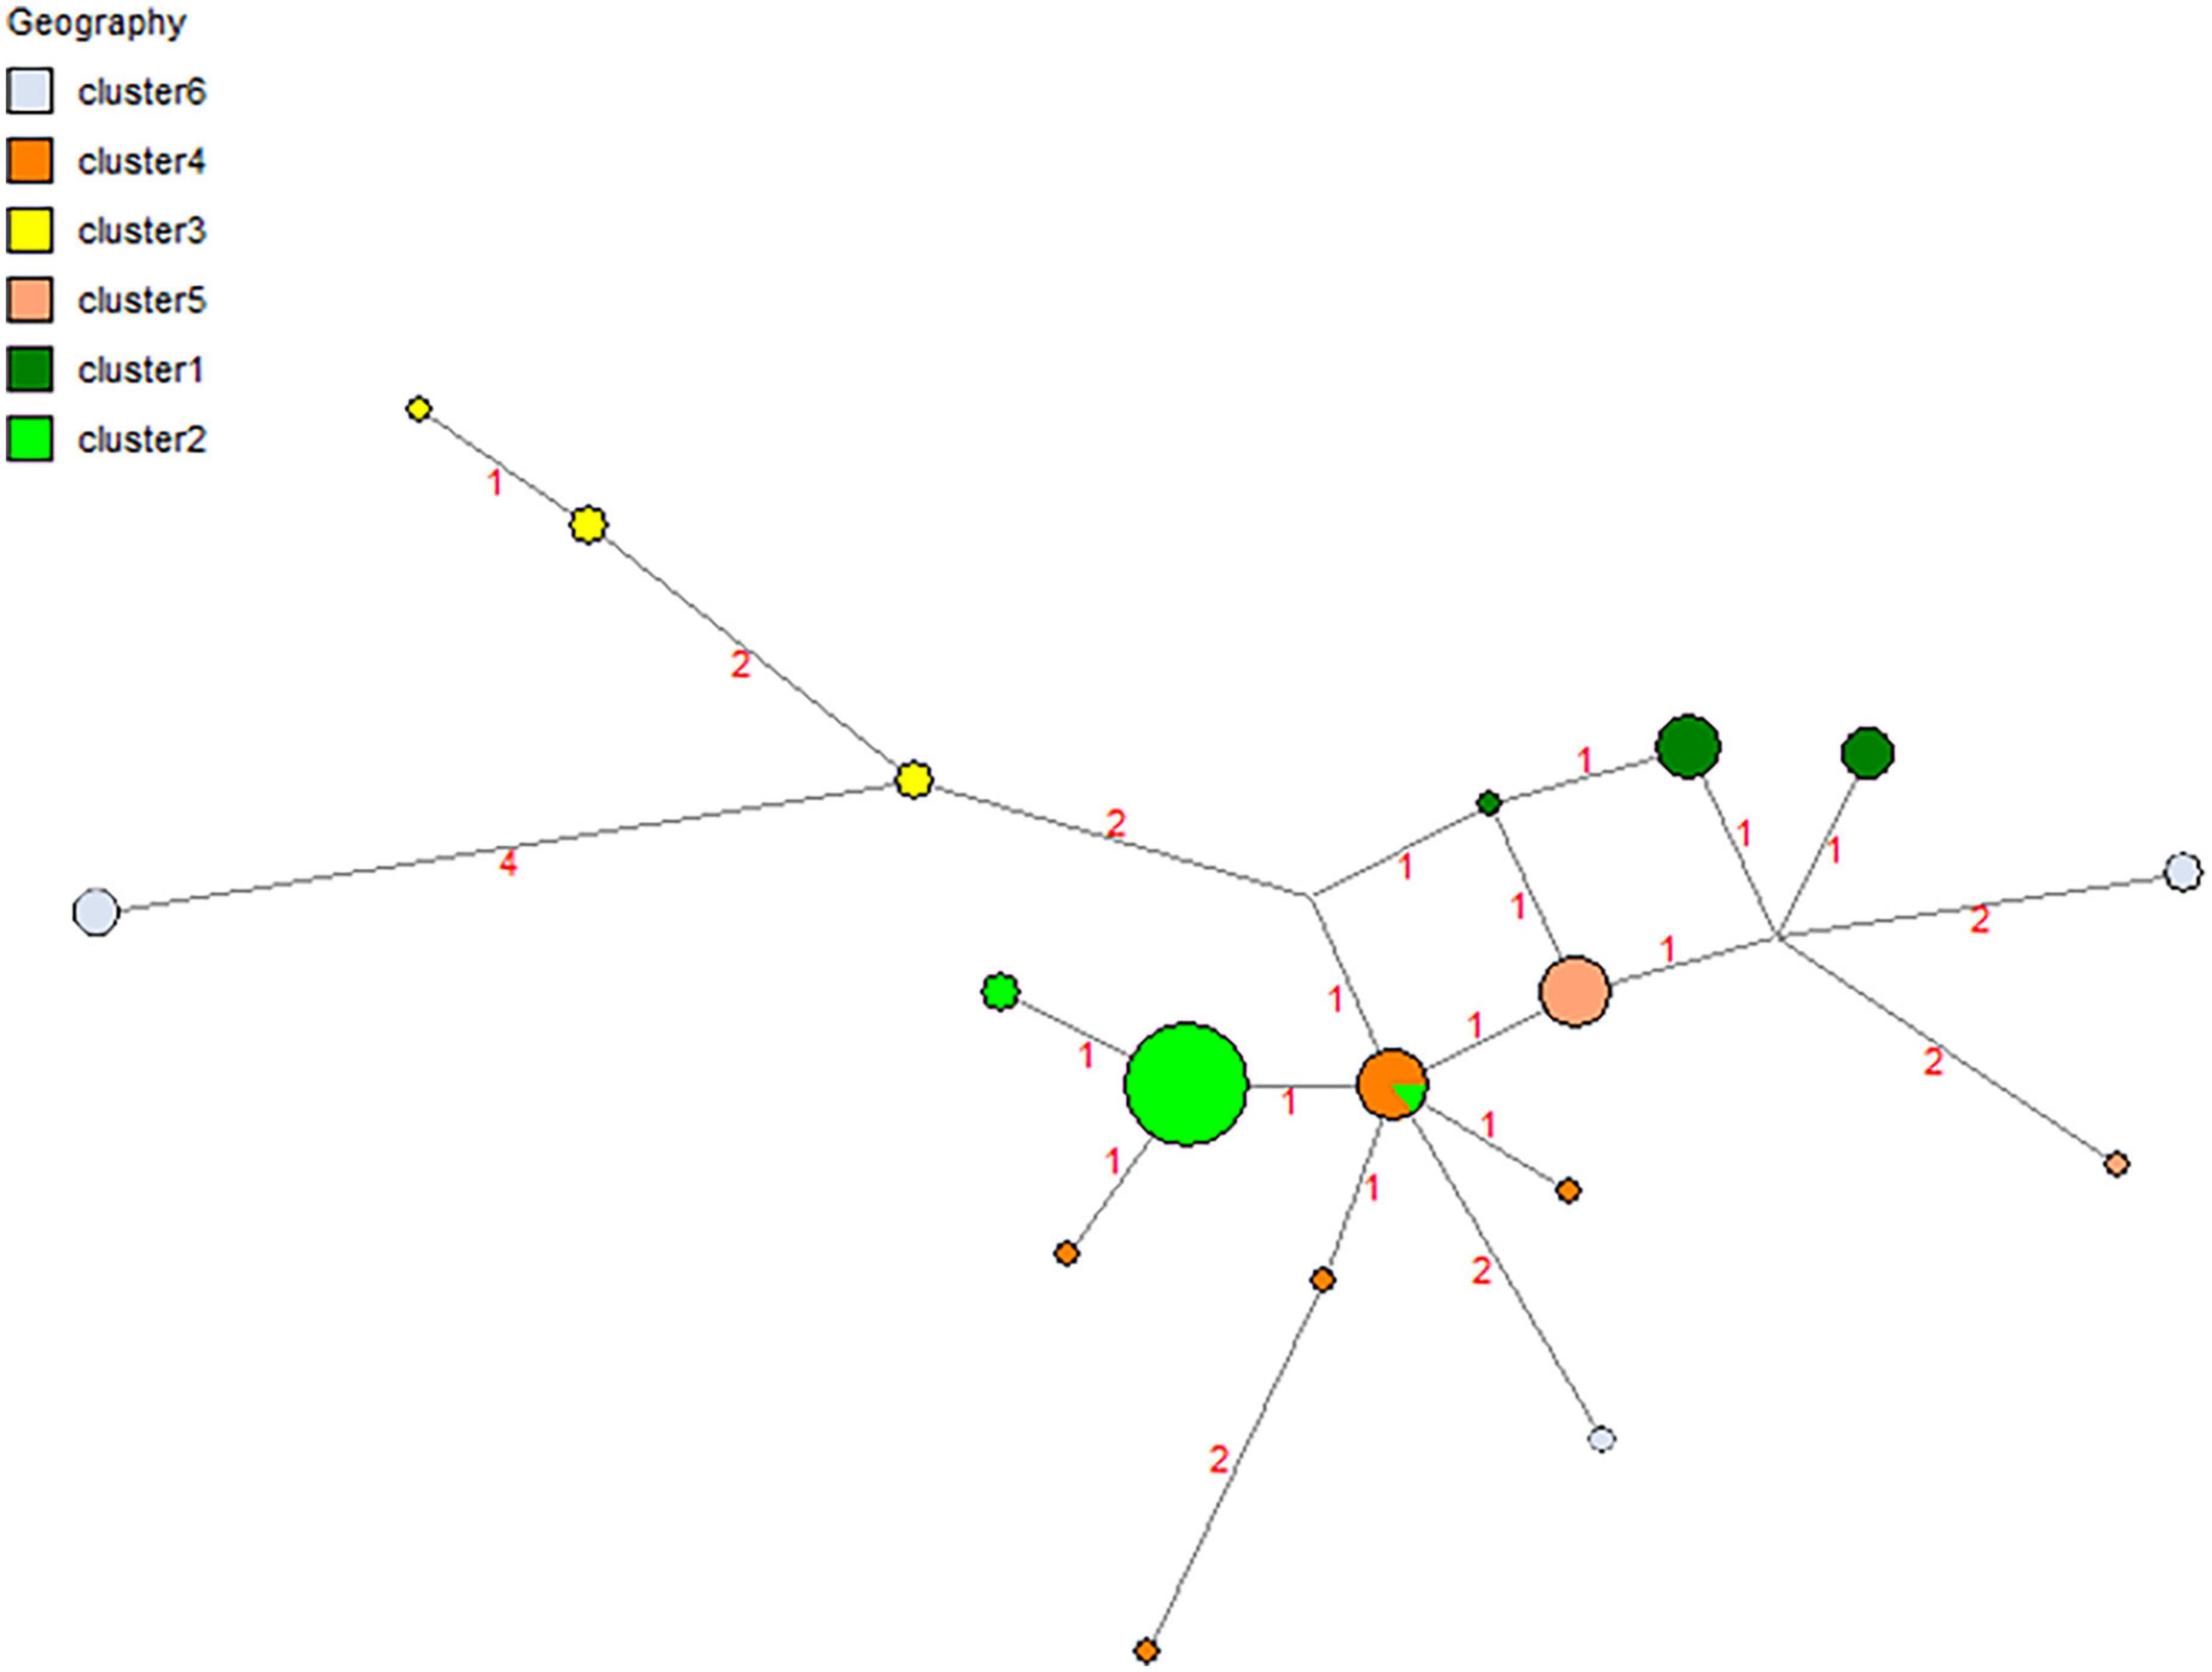
Figure 6. Haplotype network showing shared haplotypes of the observed populations obtained using the Median Joining algorithm.
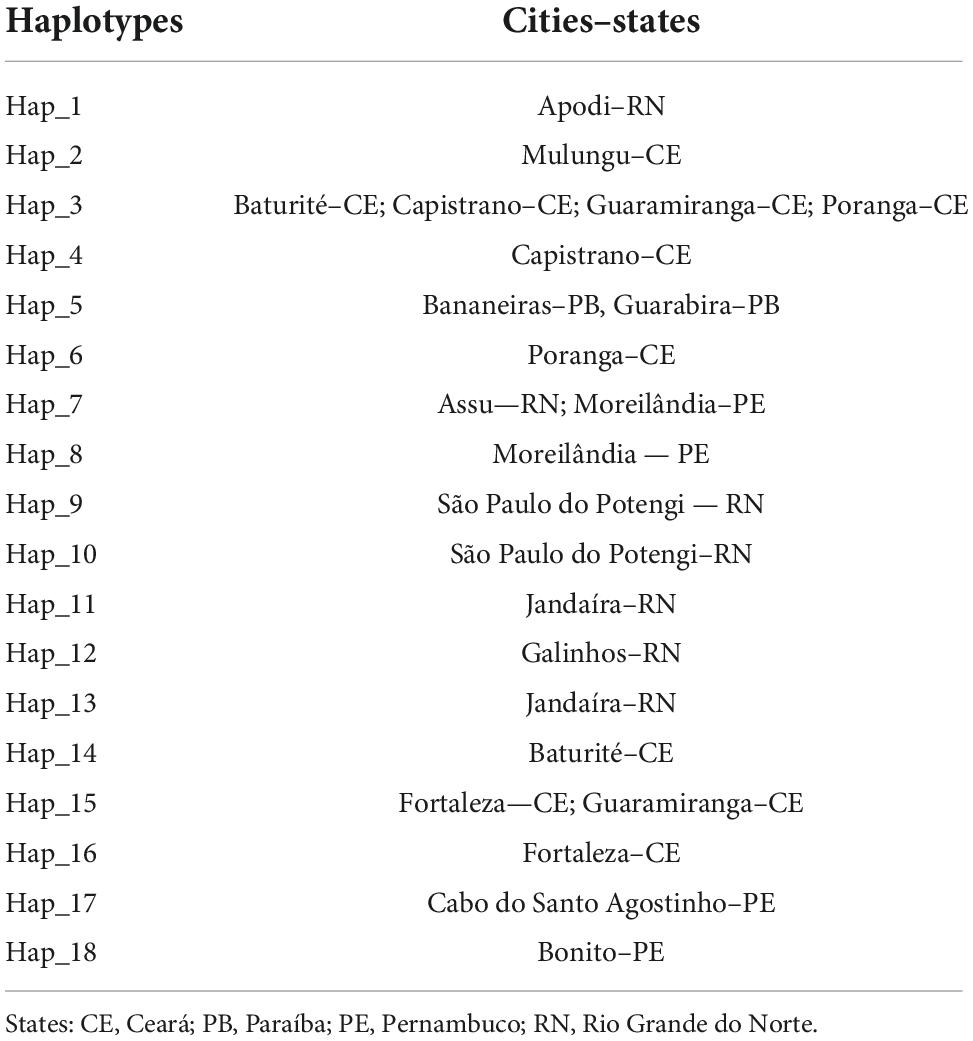
Table 5. Locations where each haplotype of Plebeia flavocincta was originally found.
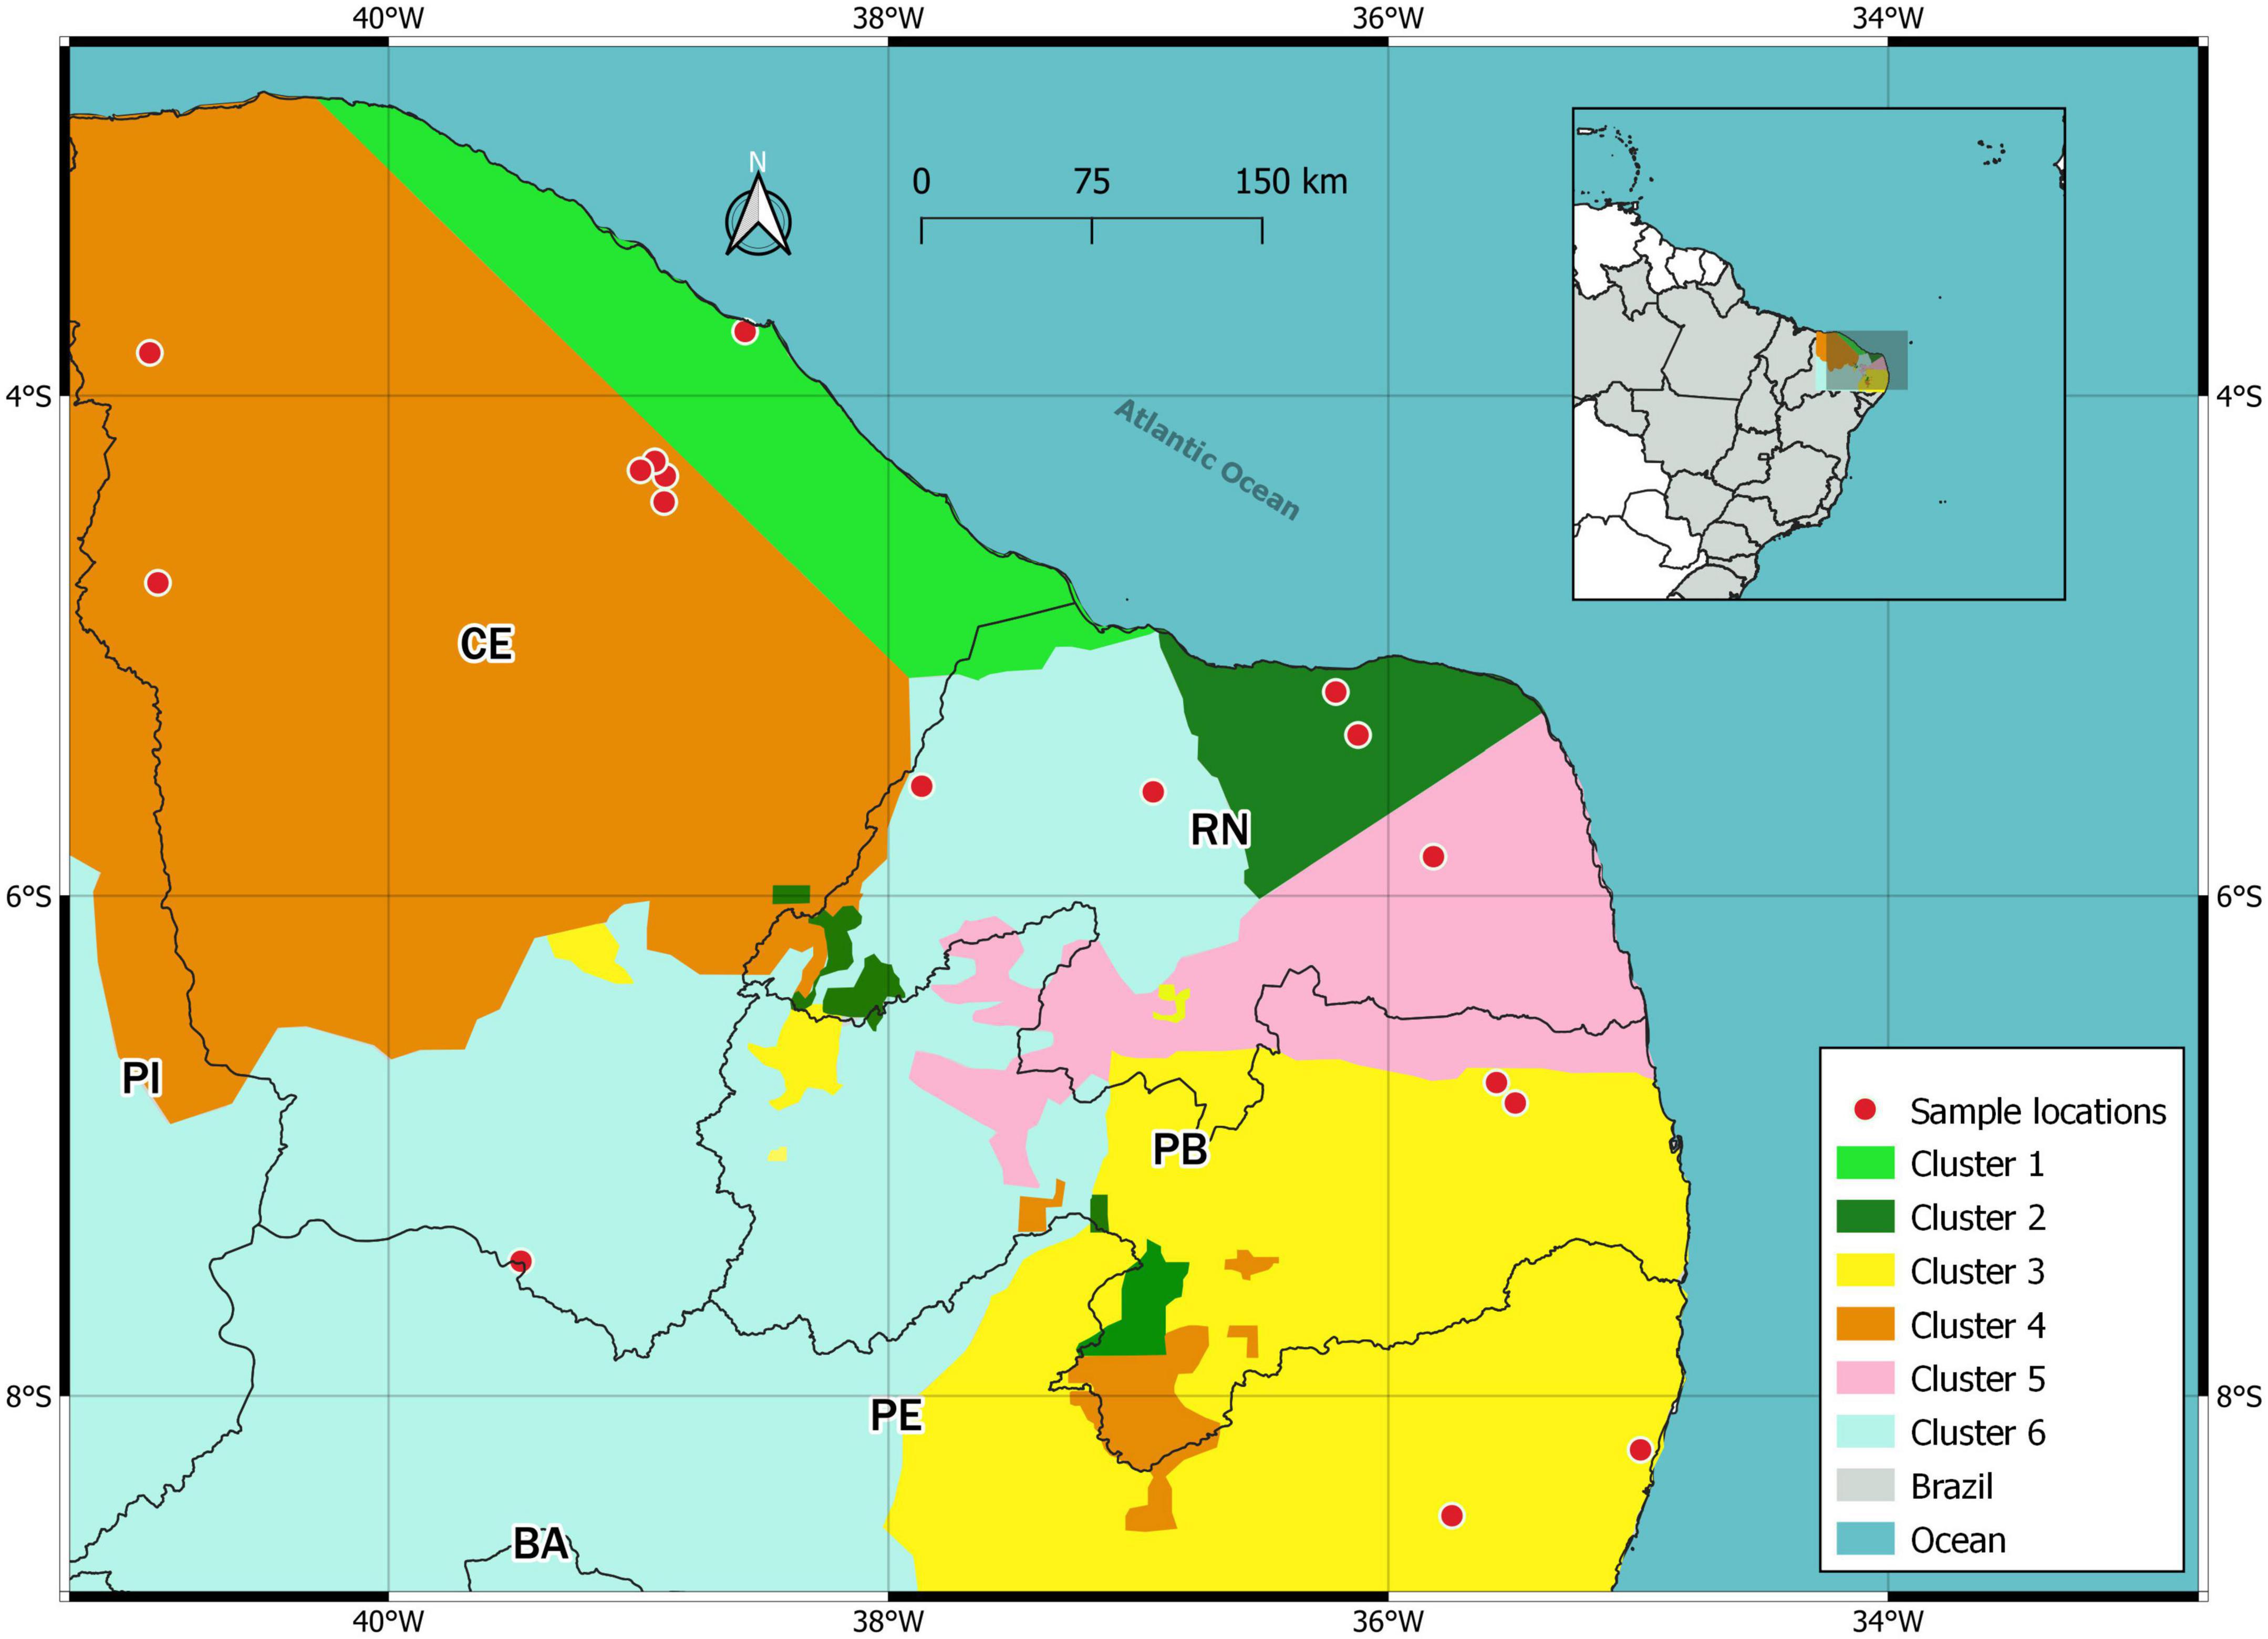
Figure 7. Map of the locations where P. flavocincta samples were collected in Northeast Brazil for genetic analysis. The colors indicate the six different populations identified by Geneland software (K = 6).
Population size dynamics over time
The BSP did not reveal any substantial fluctuations in the effective population size (Ne) in P. flavocincta in the last 200,000 years (Figure 8).
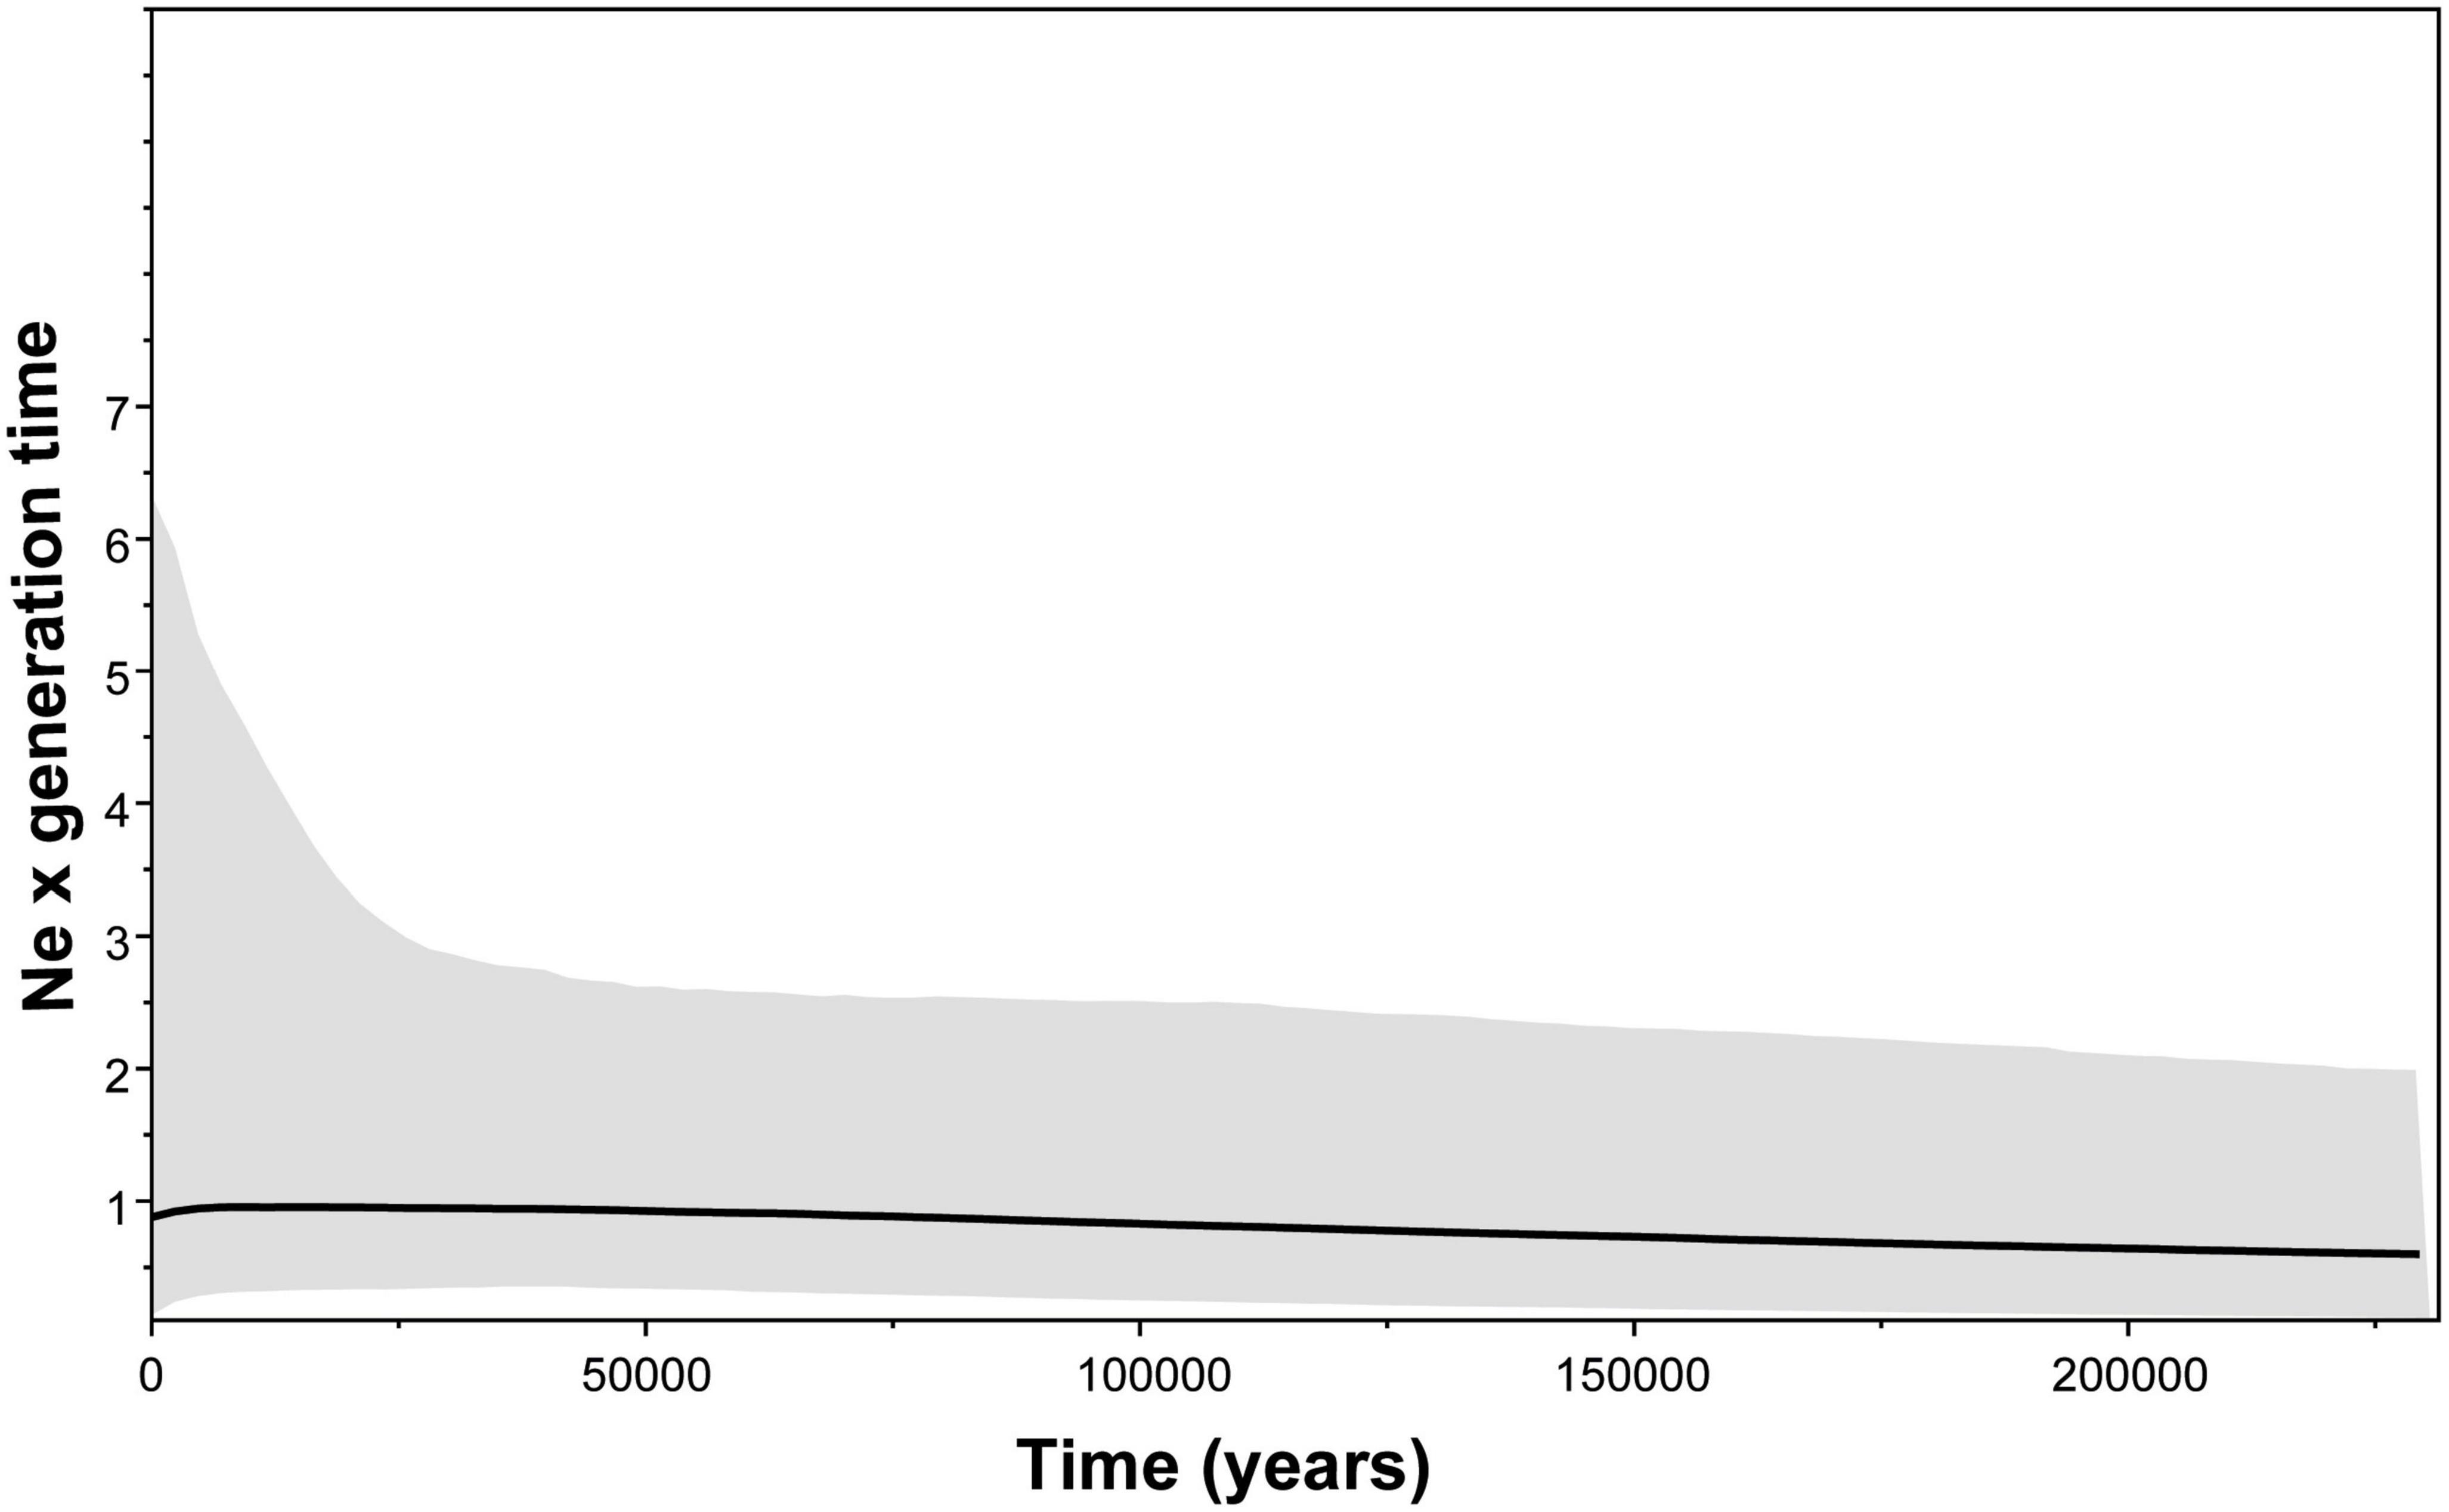
Figure 8. Coalescent Bayesian Skyline Plot (BSP) used to infer demographic history of Plebeia flavocincta population. Black horizontal line shows median BSP estimate and gray area shows upper and lower 95% highest posterior density limits.
Discussion
Both the morphometric and molecular analyses were useful for inferring structure among the studied populations. Although there was substantial overlap between methods, results from the morphometric analysis showed that the most geographically distant population, on the coast of PE coastal, corresponded to the most differentiated population. Despite the discrimination between the two most geographically distant populations (in this case, PE coastal and Ibiapaba), we could verify the occurrence of an overlap of morphological variation between them, formed by the other populations. Moreover, the genetic analysis showed that the haplotypes were geographically structured in six clusters, with four of them located in coastal areas and two others in inland areas.
Geographically closer populations, such as those on the coast, were more morphologically distinct from each other. On the other hand, some more geographically distant populations within the Caatinga areas were morphologically similar. An explanation for this finding may be the large extent of the northeast, with areas of large thermal fluctuations, variability in vegetation cover, with deforested areas and mountain ranges acting as dispersion barriers (Jaffé et al., 2019). Isolated mountain ranges and high plateaus (up to 1000 m) are spread across the Caatinga areas. On the borders of the State of Ceará, for example, there are mountain ranges that can prevent dispersion and promote local adaptation of populations. In addition, coastal areas have variable amounts of forest cover that extends over a wide latitudinal and longitudinal strip, which has favored high levels of diversity and endemism of both the fauna and flora (Ribeiro et al., 2009). A latitudinal effect on the distribution of genetic variation has already been observed for Melipona subnitida Ducke, 1910, a species of stingless bee that has an area of occurrence similar to that of P. flavocincta (Jaffé et al., 2019). Still, the isolation of populations in the coastal region of the Northeast may be a reflection of the fragmentation of the Atlantic Forest. Another plausible explanation is that gene flow was facilitated in Caatinga areas, probably by the transport of colonies originating from meliponiculture practices (Jaffé et al., 2016). Many species of stingless bees are commercially reared for multiple purposes, such as honey production, crop pollination and recreation. However, due to this process, hives can be moved for great distances (Santos et al., 2022). In this sense, the differentiation of the coastal population of the Northeast may be related to the fact that these bees are less intensively managed than those in the Caatinga areas, since beekeeping practices can play an important role in the formation of genetic differentiation between bee species (Jaffé et al., 2016).
The number of haplotypes and haplotype diversity index (Hd) obtained for P. flavocincta were higher than those observed for other stingless bees, such as Mourella caerulea (Friese 1900) (Hd = 0.74) with six haplotypes (Galaschi-Teixeira et al., 2018); M. subnitida (Hd = 0.79) 11 haplotypes (Bonatti et al., 2014); Partamona helleri (Friese, 1900) (Hd = 0.55) with 10 haplotypes (Brito and Arias, 2010); and P. remota (Holmberg, 1903) (Hd = 0.54) with 15 haplotypes (Francisco and Arias, 2010). The presence of unique mitochondrial haplotypes may be associated with the process of colonization of new areas by one or a few colonies of stingless bees (Miranda et al., 2016). This pattern of unique haplotypes has already been observed in M. subnitida (Bonatti et al., 2014; Barbosa et al., 2019). Moreover, a study using thousands of genetic markers of M. subnitida showed two very distinct populations at the extremes of its distribution area and two populations with greater variability in the central region, suggesting that the species colonized the peripheral regions more recently, while the populations from the central region had more time to develop greater genetic variability (Jaffé et al., 2019). The low dispersal capacity of daughter colonies during the swarming process due to dependence on the mother colony, as well as the queen’s philopatry, may help explain these patterns in stingless bees (Engels and Imperatriz-Fonseca, 1990; Nogueira-Neto, 1997). Other studies using population genetic approaches with different species of stingless bees also found similar results (Tavares et al., 2007; Francisco et al., 2008; Batalha-Filho et al., 2010; Brito et al., 2013; Galaschi-Teixeira et al., 2018). Thus, the presence of common haplotypes of P. flavocincta in different and distant locations cannot be explained by current gene flow via females, and the exclusivity of several observed haplotypes can be considered an indicator of population structure. For P. remota, the hypothesis of long-distance migration based on queen philopatry was discarded in favor of human-mediated “colony migration” as a leisure activity (Francisco and Arias, 2010).
Pleistocene climatic instability drove the historical distribution of forest islands in the northeastern Brazilian Atlantic Forest (Silveira et al., 2019). In the wetter areas on the northeast coast, P. flavocincta was likely isolated in the remnants of the Atlantic Forest for long periods, which limited gene flow and allowed the independent accumulation of base substitutions in mtDNA, which may have led to the current differentiation of the populations in these areas. Additionally, according to paleodistribution and palynological validation models, the potential historical distribution of the Caatinga areas was much smaller during the driest and coldest period of the Maximum Glacial, with subsequent expansion with small fluctuations until reaching the current area (Werneck et al., 2011). These fluctuations in suitable habitats may have promoted some isolation among populations. Similarly, models have suggested that P. flavocincta followed these distributional dynamics in the past, and an increase in climatically suitable areas on the northeast coast is expected in the future (Maia et al., 2020).
Our results also revealed patches of other populations within the area attributed to the coastal population of Paraíba and Pernambuco states, a result very similar to that found in areas of climatic refuge (Maia et al., 2020). These areas can be considered the ancestral areas of the populations located in the northern portion of Northeast Brazil (states of Ceará and Rio Grande do Norte). Therefore, this dynamic of expansion of vegetation cover and areas of occurrence seems to explain the current morphological and genetic patterns of the species. However, the Pleistocene climatic changes do not seem to have had a substantial influence on the demographic patterns of the P. flavocincta, since the BSP did not reveal any substantial fluctuations in the effective size of the populations. Although there has been a fluctuation in the climatically suitable areas, this does not have drastically affected the population dynamics. Based on the already demonstrated climatic niche distribution models (Maia et al., 2020), the populations of P. flavocincta probably remained stable even with the decrease in their climatically stable areas. This finding agrees with other studies with stingless bees in the same region (Miranda et al., 2016, 2017).
Here we do not disregard the existence of sampling bias caused by the difficulty in searching for natural nests. In addition to sampling bias, the molecular marker used here only tells the matrilineal history (CytB). However, the present work is an important contribution considering the few studies of population variability with stingless bees in tropical dry forests and aims to help pave the way for a deeper understanding of the evolutionary processes that occur in semi-arid areas. Given its importance as a visitor to native flora and the fact that it is an endemic bee of a threatened dry forest, the present findings may be useful for the development of conservation strategies aimed at P. flavocincta populations. Future studies should prioritize new collections in locations not yet sampled and test how the landscape influences genetic diversity. They must also deepen their ecological knowledge of the species to design conservation programs. Studies involving conservation genetics to maintain the genetic viability of natural populations of the species are also urgently needed.
Conclusion
This is the first study to demonstrate the variability of Plebeia flavocincta populations through the geographic range of the species. We demonstrated that this small pollinator species, occurring in varied environments such as areas along humid coasts and in seasonally dry tropical forests, has morphological and genetic variation to the point of causing population structuring. This likely reflects local adaptation and could be exploited to identify populations more accurately. Furthermore, the observed exclusivity of several haplotypes can be considered an indicator of the gain of new areas and population restructuring. Further work could investigate the ecological or behavioral implications of these findings for this stingless bee species, especially considering the risk of deforestation and climate change in the Caatinga.
Data availability statement
The datasets presented in this study can be found in online repositories. The names of the repository/repositories and accession number(s) can be found below: https://www.ncbi.nlm.nih.gov/genbank/, OP066721-OP066794.
Ethics statement
Ethical review and approval was not required in accordance with the local legislation and institutional requirements.
Author contributions
UM, VI-F, and TG designed the study. UM and AC collected the specimens. UM, JS-J, MM, and LM performed the analyses. UM, JG-T, GO, VI-F, and TG coordinated the data analysis. UM and JS-J wrote the manuscript. All authors reviewed and edited the manuscript.
Funding
This work was supported by Fundação de Amparo à Pesquisa do Estado do Pará–FAPESPA (doctoral grant, Public Notice 005/2016), the Conselho Nacional de Desenvolvimento Científico e Tecnológico (CNPq) scholarship (VI-F, 312250/2018-5), and Instituto Tecnológico Vale (ITV) for infrastructure (project RBRS000603.81).
Acknowledgments
We thank the Universidade Federal Rural do Semi-Árido (UFERSA) and Universidade de São Paulo for logistical support during the study. We also thank Cristina Arias for allowing the internship (UM) to learn genetic procedures, thank Charles Santos, Felipe Contrera, Jeferson Coutinho, Marcia Ribeiro, Orlando Tobias, Tiago Francoy, and William Sabino for suggestions and comments, and also Alistair Campbell for reading and reviewing the text.
Conflict of interest
The authors declare that the research was conducted in the absence of any commercial or financial relationships that could be construed as a potential conflict of interest.
Publisher’s note
All claims expressed in this article are solely those of the authors and do not necessarily represent those of their affiliated organizations, or those of the publisher, the editors and the reviewers. Any product that may be evaluated in this article, or claim that may be made by its manufacturer, is not guaranteed or endorsed by the publisher.
References
Alvares, C. A., Stape, J. L., Sentelhas, P. C., Moraes Gonçalves, J. L., and Sparovek, G. (2013). Köppen’s climate classification map for Brazil. Meteorol. Zeitschrift. 22, 711–728. doi: 10.1127/0941-2948/2013/0507
Awange, J. L., Mpelasoka, F., and Goncalves, R. M. (2016). When every drop counts: analysis of droughts in Brazil for the 1901-2013 period. Sci. Total Environ. 566, 1472–1488. doi: 10.1016/j.scitotenv.2016.06.031
Bandelt, H. J., Forster, P., and Röhl, A. (1999). Median-joining networks for inferring intraspecific phylogenies. Mol. Biol. Evol. 16, 37–48. doi: 10.1093/oxfordjournals.molbev.a026036
Barbosa, M. M., Bonatti, V., Teixeira, J. S. G., Rêgo, M. M. C., and Francoy, T. M. (2019). Genetic characterization of Melipona subnitida stingless bee in Brazilian northeast. Sociobiology 66, 597–601. doi: 10.13102/sociobiology.v66i4.3408
Batalha-Filho, H., Waldschmidt, A. M., Campos, L. A. O., Tavares, M. G., and Fernandes-Salomão, T. M. (2010). Phylogeography and historical demography of the Neotropical stingless bee Melipona quadrifasciata (Hym., Apidae): incongruence between morphology and mitochondrial DNA. Apidologie 41, 534–547. doi: 10.1051/apido/2010001
Bonatti, V., Simões, Z. L. P., Franco, F. F., and Francoy, T. M. (2014). Evidence of at least two evolutionary lineages in Melipona subnitida (Apidae, Meliponini) suggested by mtDNA variability and geometric morphometry of forewings. Naturwissenschaten 101, 17–24. doi: 10.1007/s00114-013-1123-5
Bookstein, F. L. (1992). Morphometric Tools for Landmark Data. Cambridge, MA: Cambridge University Press.
Bouckaert, R., Heled, J., Kühnert, D., Vaughan, T., Wu, C. H., Xie, D., et al. (2014). BEAST 2: a software platform for Bayesian evolutionary analysis. PLoS Comput. Biol. 10:e1003537. doi: 10.1371/journal.pcbi.1003537
Brito, R. M., and Arias, M. C. (2010). Genetic structure of Partamona helleri (Apidae, Meliponini) from Neotropical Atlantic rainforest. Insectes. Soc. 57, 413–419. doi: 10.1007/s00040-010-0098-x
Brito, R. M., Francisco, F. O., Françoso, E., Santiago, L. R., and Arias, M. C. (2013). Very low mitochondrial variability in a stingless bee endemic to cerrado. Genet. Mol. Biol. 36, 124–128. doi: 10.1590/S1415-47572013000100018
Campbell, A. J., Carvalheiro, L. G., Maués, M. M., Jaffé, R., Giannini, T. C., Freitas, M. A. B., et al. (2018). Anthropogenic disturbance of tropical forests threatens pollination services to açaí palm in the Amazon river delta. J. Appl. Ecol. 55, 1725–1736. doi: 10.1111/1365-2664.13086
Carvalho, C. S., Lanes, ÉC., Silva, A. R., Caldeira, C. F., Carvalho-Filho, N., Gastauer, M., et al. (2019). Habitat loss does not always entail negative genetic consequences. Front. Genet. 10:1011. doi: 10.3389/fgene.2019.01101
Cheptou, P. O., Hargreaves, A. L., Bonte, D., and Jacquemyn, H. (2017). Adaptation to fragmentation: evolutionary dynamics driven by human influences. Philos. Trans. R. Soc. Lond., B, Biol. Sci. 372:20160037. doi: 10.1098/rstb.2016.0037
Edgar, R. C. (2004). MUSCLE: multiple sequence alignment with high accuracy and high throughput. Nucleic Acids Res. 32, 1792–1797. doi: 10.1093/nar/gkh340
Engels, W., and Imperatriz-Fonseca, V. L. (1990). “Caste development, reproductive strategies, and control of fertility in honey bees and stingless bees,” in Social Insects - An Evolutionary Approach to Castes and Reproduction, ed. W. Engels (Cham: Springer Verlag), 167–230.
Fernandes, M. F., Cardoso, D., and de Queiroz, L. P. (2020). An updated plant checklist of the Brazilian Caatinga seasonally dry forests and woodlands reveals high species richness and endemism. J. Arid Environ. 174:104079. doi: 10.1016/j.jaridenv.2019.104079
Francisco, F. O., and Arias, M. C. (2010). Inferences of evolutionary and ecological events that influenced the population structure of Plebeia remota, a stingless bee from Brazil. Apidologie 41, 216–224. doi: 10.1051/apido/2009079
Francisco, F. O., Nunes-Silva, P., Francoy, T. M., Wittmann, D., Imperatriz-Fonseca, V. L., Arias, M. C., et al. (2008). Morphometrical, biochemical and molecular tools for assessing biodiversity. An example in Plebeia remota. Insect. Soc. 55, 231–237. doi: 10.1007/s00040-008-0992-7
Françoso, E., and Arias, M. C. (2013). Cytochrome c oxidase I primers for corbiculate bees: DNA barcode and mini-barcode. Mol. Ecol. Resour. 13, 844–850. doi: 10.1111/1755-0998.12135
Françoso, E., Gomes, F., and Arias, M. C. (2016). A protocol for isolating insect mitochondrial genomes: a case study of NUMT in Melipona flavolineata (Hymenoptera: Apidae). Mitochondrial DNA A 27, 2401–2404. doi: 10.3109/19401736.2015.1028049
Francoy, T. M., Bonatti, V., Viraktamath, S., and Rajankar, B. R. (2016). Wing morphometrics indicates the existence of two distinct phenotypic clusters within population of Tetragonula iridipennis (Apidae: Meliponini) from India. Insectes Soc. 63, 109–115. doi: 10.1007/s00040-015-0442-2
Francoy, T. M., Grassi, M. L., Imperatriz-Fonseca, V. L., de Jesús May-Itzá, W., and Quezada-Euán, J. J. (2011). Geometric morphometrics of the wing as a tool for assigning genetic lineages and geographic origin to Melipona beecheii (Hymenoptera: Meliponini). Apidologie 42, 499–507. doi: 10.1007/s13592-011-0013-0
Freitas, B. M., Imperatriz-Fonseca, V. L., Medina, L. M., Kleinert, A. D. M. P., Galetto, L., Nates-Parra, G., et al. (2009). Diversity, threats and conservation of native bees in the Neotropics. Apidologie 40, 332–346. doi: 10.1051/apido/2009012
Galaschi-Teixeira, J. S., Falcon, T., Ferreira-Caliman, M. J., Witter, S., and Francoy, T. M. (2018). Morphological, chemical and molecular analyses differentiate populations of the subterranean nesting stingless bee Mourella caerulea (Apidae: Meliponini). Apidologie 49, 367–377. doi: 10.1007/s13592-018-0563-5
González-Varo, J. P., Biesmeijer, J. C., Bommarco, R., Potts, S. G., Schweiger, O., Smith, H. G., et al. (2013). Combined effects of global change pressures on animal-mediated pollination. Trends Ecol. Evol. 28, 524–530. doi: 10.1016/j.tree.2013.05.008
Guillot, G., Mortier, F., and Estoup, A. (2005). GENELAND: a computer package for landscape genetics. Mol. Ecol. Notes 5, 712–715.
Imperatriz-Fonseca, V. L., Koedam, D., and Hrncir, M. (2017). A Abelha Jandaíra No Presente, No Passado e No Futuro. Mossoró: EdUFERSA.
Instituto Brasileiro de Geografia e Estatística (2017). Divisão Regional do Brasil em Mesoregiões e Microregiões Geográficas (IBGE). Rio de Janeiro: Instituto Brasileiro de Geografia e Estatística.
Jaffé, R., Pope, N., Acosta, A. L., Alves, D. A., Arias, M. C., De la Rúa, P., et al. (2016). Beekeeping practices and geographic distance, not land use, drive gene flow across tropical bees. Mol. Ecol. 25, 5345–5358. doi: 10.1111/mec.13852
Jaffé, R., Pope, N., Carvalho, A. T., Maia, U. M., Blochtein, B., de Carvalho, C. A. L., et al. (2015). Bees for development: brazilian survey reveals how to optimize stingless beekeeping. PLoS One 10:e0121157. doi: 10.1371/journal.pone.0121157
Jaffé, R., Veiga, J. C., Pope, N. S., Lanes, ÉC., Carvalho, C. S., Alves, R., et al. (2019). Landscape genomics to the rescue of a tropical bee threatened by habitat loss and climate change. Evol. Appl. 12, 1164–1177. doi: 10.1111/eva.12794
Keyghobadi, N., Roland, J., Matter, S. F., and Strobeck, C. (2005). Among- and within-patch components of genetic diversity respond at different rates to habitat fragmentation: an empirical demonstration. Proc. R. Soc. B 272, 553–560. doi: 10.1098/rspb.2004.2976
Klingenberg, C. P. (2011). MorphoJ: an integrated software package for geometric morphometrics. Mol. Ecol. Resour. 11, 353–357. doi: 10.1111/j.1755-0998.2010.02924.x
Krol, M. S., and Bronstert, A. (2007). Regional integrated modelling of climate change impacts on natural resources and resource usage in semi-arid Northeast Brazil. Environ. Model. Softw. 22, 259–268. doi: 10.1016/j.envsoft.2005.07.022
Librado, P., and Rozas, J. (2009). DnaSP v5: a software for comprehensive analysis of DNA polymorphism data. Bioinformatics 25, 1451–1452. doi: 10.1093/bioinformatics/btp187
Maia, U. M., Jaffé, R., Carvalho, A. T., and Imperatriz-Fonseca, V. L. (2015). Meliponicultura no Rio Grande do Norte. Bras. Med. Vet. 37, 327–333.
Maia, U. M., Miranda, L. D. S., Carvalho, A. T., Imperatriz-Fonseca, V. L., de Oliveira, G. C., and Giannini, T. C. (2020). Climate-induced distribution dynamics of Plebeia flavocincta, a stingless bee from Brazilian tropical dry forests. Ecol. Evol. 10, 10130–10138. doi: 10.1002/ece3.6674
Marengo, J. A., Torres, R. R., and Alves, L. M. (2017). Drought in Northeast Brazil—past, present, and future. Theor. Appl. Climatol. 129, 1189–1200. doi: 10.1007/s00704-016-1840-8
Michener, C. D. (2013). “The Meliponini,” in Pot-honey. A Legacy of Stingless Bees, eds P. Vit, S. R. M. Pedro, and D. Roubik (New York, NY: Springer), 3–17.
Miles, L., Newton, A. C., DeFries, R. S., Ravilious, C., May, I., Blyth, S., et al. (2006). A global overview of the conservation status of tropical dry forests. J. Biogeogr. 33, 491–505. doi: 10.1111/j.1365-2699.2005.01424.x
Miller, M. P. (1997). Tools for Population Genetic Analyses (TFPGA): A Windows Program for the Analysis of Allozyme and Molecular Population Genetic Data. Flagstaff, AZ: Northern Arizona University.
Miranda, E. A., Batalha-Filho, H., Congrains, C., Carvalho, A. F., Ferreira, K. M., and Del Lama, M. A. (2016). Phylogeography of Partamona rustica (Hymenoptera, Apidae), an endemic stingless bee from the Neotropical dry forest diagonal. PLoS One 11:e016444. doi: 10.1371/journal.pone.0164441
Miranda, E. A., Ferreira, K. M., Carvalho, A. T., Martins, C. F., Fernandes, C. R., and Del Lama, M. A. (2017). Pleistocene climate changes shaped the population structure of Partamona seridoensis (Apidae, Meliponini), an endemic stingless bee from the Neotropical dry forest. PLoS One 12:e0175725. doi: 10.1371/journal.pone.0175725
Nogueira, D. S., Mahlmann, T., Teixeira, J. S. G., de Oliveira, M. L., and Roubik, D. W. (2019). Geometric morphometrics of wing venation to differentiates new species of Scaura Schwarz populations (Hymenoptera: Apidae: Meliponini). Sci. Plena 15:e018001. doi: 10.14808/sci.plena.2019.018001
Nogueira-Neto, P. (1997). Vida e Criação de Abelhas Indígenas sem Ferrão (Editora Tecnapis). São Paulo: Editora Nogueirapis.
Okin, G. S., Gillette, D. A., and Herrick, J. E. (2006). Multi-scale controls on and consequences of aeolian processes in landscape change in arid and semi-arid environments. J. Arid Environ. 65, 253–275. doi: 10.1016/j.jaridenv.2005.06.029
Oliveira, P. T., Santos e Silva, C. M., and Lima, K. C. (2017). Climatology and trend analysis of extreme precipitation in subregions of Northeast Brazil. Theor. Appl. Climatol. 130, 77–90. doi: 10.1007/s00704-016-1865-z
Oliveira-Souza, T. C., Delgado, R. C., Magistrali, I. C., Dos Santos, G. L., de Carvalho, D. C., Teodoro, P. E., et al. (2018). Spectral trend of vegetation with rainfall in events of El Niño-Southern Oscillation for Atlantic Forest biome, Brazil. Environ. Monit. Assess. 190, 1–4. doi: 10.1007/s10661-018-7060-1
Ollerton, J. (2017). Pollinator diversity: distribution, ecological function, and conservation. Annu. Rev. Ecol. Evol. Syst. 48, 353–376. doi: 10.1146/annurev-ecolsys-110316-022919
Ollerton, J., Winfree, R., and Tarrant, S. (2011). How many flowering plants are pollinated by animals? Oikos 120, 321–326. doi: 10.1111/j.1600-0706.2010.18644.x
Polzin, T., and Daneshmand, S. V. (2003). On Steiner trees and minimum spanning trees in hypergraphs. Oper. Res. Lett. 31, 12–20. doi: 10.1016/S0167-6377(02)00185-2
Potts, S., Imperatriz-Fonseca, V., Ngo, H. T., Aizen, M. A., Biesmeijer, J. C., Breeze, T. D., et al. (2016). Safeguarding pollinators and their values to human well-being. Nature 540, 220–229. doi: 10.1038/nature20588
Rambaut, A., Drummond, A. J., Xie, D., Baele, G., and Suchard, M. A. (2018). Posterior summarization in Bayesian phylogenetics using Tracer 1.7. Syst. Biol. 67, 901–904. doi: 10.1093/sysbio/syy032
Rattanawannee, A., Jeratthitikul, E., Duangpakdee, O., and Oldroyd, B. P. (2017). Mitochondrial sequencing and geometric morphometrics suggest two clades in the Tetragonilla collina (Apidae: Meliponini) population of Thailand. Apidologie 48, 719–731. doi: 10.1007/s13592-017-0517-3
Ribeiro, M. C., Metzger, J. P., Martensen, A. C., Ponzoni, F. J., and Hirota, M. M. (2009). The Brazilian Atlantic Forest: how much is left, and how is the remaining forest distributed? Implications for conservation. Biol. Conserv. 142, 1141–1153. doi: 10.1016/j.biocon.2009.02.021
Ribeiro, M. D. F., and Taura, T. A. (2019). Presence of Plebeia aff. flavocincta nests in urban areas. Sociobiology 66, 66–74. doi: 10.13102/sociobiology.v66i1.3474
Santos, C. F., Acosta, A. L., Halinski, R., Souza-Santos, P. D., Borges, R. C., Gianinni, T. C., et al. (2022). The widespread trade in stingless beehives may introduce them into novel places and could threaten species. J. Appl. Ecol. 59, 965–981. doi: 10.1111/1365-2664.14108
Santos-Júnior, J. E., Santos, F. R., and Silveira, F. A. (2015). Hitting an unintended target: phylogeography of Bombus brasiliensis Lepeletier, 1836 and the first new Brazilian bumblebee species in a century (Hymenoptera: Apidae). PLoS One 10:e0125847. doi: 10.1371/journal.pone.0125847
Santos-Júnior, J. E., Silveira, F. A., Oliveira, U., Dias, C. A. R., and Santos, F. R. (2019). Conservation and historical distribution of two bumblebee species from the Atlantic Forest. Syst. Biodivers. 17, 22–38. doi: 10.1080/14772000.2018.1530313
Silva, J. M. C., Leal, I. R., and Tabarelli, M. (2017). Caatinga: The Largest Tropical Dry Forest Region in South America. Cham: Springer.
Silveira, M. H. B., Mascarenhas, R., Cardoso, D., and Batalha-Filho, H. (2019). Pleistocene climatic instability drove the historical distribution of forest islands in the northeastern Brazilian Atlantic Forest. Palaeogeogr. Palaeoclimatol. Palaeoecol. 527, 67–76. doi: 10.1016/j.palaeo.2019.04.028
Simon, C., Frati, F., Beckenbach, A., Crespi, B., Liu, H., and Flook, P. (1994). Evolution, weighting, and phylogenetic utility of mitochondrial gene sequences and a compilation of conserved polymerase chain reaction primers. Ann. Entomol. Soc. Am. 87, 651–701. doi: 10.1093/aesa/87.6.651
Tamura, K., Peterson, D., Peterson, N., Stecher, G., Nei, M., and Kumar, S. (2011). MEGA5: molecular evolutionary genetics analysis using maximum likelihood, evolutionary distance, and maximum parsimony methods. Mol. Biol. Evol. 28, 2731–2739. doi: 10.1093/molbev/msr121
Tavares, M. G., Dias, L. A. D. S., Borges, A. A., Lopes, D. M., Busse, A. H. P., Costa, R. G., et al. (2007). Genetic divergence between populations of the stingless bee uruçu amarela (Melipona rufiventris group, Hymenoptera, Meliponini): is there a new Melipona species in the Brazilian state of Minas Gerais? Genet. Mol. Biol. 30, 667–675. doi: 10.1590/S1415-47572007000400027
Tavares-Dasmasceno, J. P., de Souza Silveira, J. L. G., Câmara, T., de Castro Stedile, P., Macario, P., Toledo-Lima, G. S., et al. (2017). Effect of drought on demography of Pileated Finch (Coryphospingus pileatus: Thraupidae) in northeastern Brazil. J. Arid Environ. 147, 63–79. doi: 10.1016/j.jaridenv.2017.09.006
Vasconcelos, S., Nunes, G. L., Dias, M. C., Lorena, J., Oliveira, R. R., Lima, T. G., et al. (2021). Unravelling the plant diversity of the Amazonian canga through DNA barcoding. Ecol. Evol. 11, 13348–13362. doi: 10.1002/ece3.8057
Wagner, A. (2012). The role of robustness in phenotypic adaptation and innovation. Proc. R. Soc. B. 279, 1249–1258. doi: 10.1098/rspb.2011.2293
Werneck, F. P., Costa, G. C., Colli, G. R., Prado, D. E., and Sites-Jr, J. W. (2011). Revisiting the historical distribution of seasonally dry tropical forests: new insights based on palaeodistribution modelling and palynological evidence. Glob. Ecol. Biogeogr. 20, 272–288. doi: 10.1111/j.1466-8238.2010.00596.x
Keywords: dry forest, Caatinga, stingless bee, geometric morphometry, mitochondrial DNA, population variability
Citation: Maia UM, Santos Júnior JE, Molina M, Galaschi-Teixeira JS, Carvalho AT, Miranda LS, Imperatriz-Fonseca VL, Oliveira G and Giannini TC (2022) Evidence for morphological and genetic structuring of Plebeia flavocincta (Apidae: Meliponini) populations in Northeast Brazil. Front. Ecol. Evol. 10:1057624. doi: 10.3389/fevo.2022.1057624
Received: 29 September 2022; Accepted: 04 November 2022;
Published: 25 November 2022.
Edited by:
Vindhya Mohindra, National Bureau of Fish Genetic Resources (ICAR), IndiaReviewed by:
Chao Chen, Institute of Apiculture Research (CAAS), ChinaEvandro Marsola Moraes, Federal University of São Carlos, Brazil
Copyright © 2022 Maia, Santos Júnior, Molina, Galaschi-Teixeira, Carvalho, Miranda, Imperatriz-Fonseca, Oliveira and Giannini. This is an open-access article distributed under the terms of the Creative Commons Attribution License (CC BY). The use, distribution or reproduction in other forums is permitted, provided the original author(s) and the copyright owner(s) are credited and that the original publication in this journal is cited, in accordance with accepted academic practice. No use, distribution or reproduction is permitted which does not comply with these terms.
*Correspondence: Ulysses Madureira Maia, ulymm86@hotmail.com
†ORCID: Ulysses Madureira Maia, orcid.org/0000-0003-0940-9331; José Eustáquio dos Santos Júnior, orcid.org/0000-0002-7150-3751; Michele Molina, orcid.org/0000-0003-1584-7768; Juliana Stephanie Galaschi-Teixeira, orcid.org/0000-0002-6003-7708; Airton Torres Carvalho, orcid.org/0000-0003-3395-4444; Leonardo de Sousa Miranda, orcid.org/0000-0001-6427-8157; Vera Lucia Imperatriz-Fonseca, orcid.org/0000-0002-1079-2158; Guilherme Oliveira, orcid.org/0000-0003-0054-3438; Tereza Cristina Giannini, orcid.org/0000-0001-9830-1204