Differentiation of the Chestnut Tiger Butterfly Parantica sita (Lepidoptera: Nymphalidae: Danainae) in China
 Ping Hu1,2†
  Liangzhi Lu1†
  Shaoji Hu3,4
  Wa Da5
  Chia-Lung Huang6
  Huihong Zhang7
  Di Wang1
  Yifan Zhang1
  Yongqiang Xu5
  Rongjiang Wang1,8*
- 1School of Life Sciences, Peking University, Beijing, China
- 2Kunming Institute of Zoology, Chinese Academy of Sciences, Kunming, China
- 3Yunnan Key Laboratory of International Rivers and Transboundary Eco-Security, Yunnan University, Kunming, China
- 4Institute of International Rivers and Eco-Security, Yunnan University, Kunming, China
- 5Tibet Plateau Institute of Biology, Lhasa, China
- 6Institute of Oceanography, Minjiang University, Fuzhou, China
- 7School of Agriculture, Yunnan University, Kunming, China
- 8Institute of Ecology, Peking University, Beijing, China
The chestnut tiger butterfly, Parantica sita (Kollar) (Lepidoptera: Nymphalidae: Danainae), occurs in Asia, along the Himalayas, and into the Malayan region. Previous studies found three types of mitogenomes with substantial genetic divergence in samples from China. To clarify the level of differentiation within P. sita, we investigated both molecular data and morphological features in 429 individuals from China. Upon examination, mitochondrial cytochrome oxidase subunit I (COI) sequences showed three substantially diverged haplotype groups. Based on microsatellite genotypes, the samples divided into three clusters that were consistent with the COI haplotype groups. With that genetic data, we named three distinguishable P. sita lineages: PS-A, PS-B, and PS-C. We also found obvious morphological differences in wing color, male sex brand, and genitalia structures among the three lineages. According to the published structure of male genitalia, that of PS-A is identical to that of P. s. sita, and that of PS-B is identical to that of P. pedonga. Based on all the results, we tentatively propose dividing P. sita into three species: PS-A (the former P. s. sita) is the typical Parantica sita [Kollar, (1844)], mainly distributed in southwestern China; PS-C (the former P. s. niphonica) is elevated to full species as Parantica niphonica (Moore, 1883), distributed in Taiwan Island and Japan; and PS-B will be Parantica pedonga Fujioka, 1970, mainly distributed in Tibet and western Sichuan. Divergence time estimates showed that PS-A separated from the PS-B + PS-C clade about 8.79 million years ago (Ma), when the Hengduan Mountains underwent an appreciable elevation increase, isolating the Tibet population from the others. PS-B and PS-C diverged about 4.87 Ma, in accord with the formation of Taiwan Island mountains. The founder effect may explain why PS-C’s genetic diversity is lower than that of the other clades.
Introduction
Fundamental to understanding the evolutionary sciences is the understanding of the mechanisms underlying biodiversity (Purvis and Hector, 2000), and many studies have attempted to infer how the genetic differentiation of species has been influenced through time and space (e.g., Howes et al., 2006; Cheng et al., 2016; Liu et al., 2019, 2021). Genetic differentiation is influenced by both abiotic and biotic factors, possibly working jointly, so that various evolutionary histories are found among different taxa (e.g., Nielson et al., 2001; Kozak et al., 2006; Cheng et al., 2019).
Geological events that change topography and climate may critically affect the mechanisms influencing biodiversity (Hewitt, 2000). For instance, the uplift of the Qinghai-Tibet Plateau (QTP), including the Himalaya and Hengduan Mountains, in southwestern China created a complex, heterogeneous topography [e.g., large altitudinal differences that often exceed 2,000 m between valleys and mountain ridges in a series of parallel, north-south–oriented mountains (Yao et al., 2010)]. High mountains create biogeographic barriers that can impede gene flow between populations and can drive genetic differentiation and even speciation (Long et al., 2006; Lei et al., 2014; Niu et al., 2018; Cheng et al., 2019). Additionally, the QTP uplift greatly influenced climate, such as the development of the Asian monsoon system (Tang et al., 2013) and the aridification of Central Asia (Miao et al., 2012). Subsequent habitat diversification led to increased biodiversity through ecological adaptations (Ledevin et al., 2018; Liu et al., 2021), leaving this area a major global biodiversity hotspot with high levels of endemism and species richness (Myers et al., 2000).
Taiwan Island, another biodiversity hotspot (Myers et al., 2000), was also affected by the Cenozoic Himalayan orogeny (Zhang et al., 2015), and populations distributed on both sides of the Taiwan Strait may have experienced genetic differentiation. During the interglacial-glacial cycles in the Pleistocene, a land bridge would periodically form in the Strait, leading to repeated connections and separations between Mainland China and Taiwan Island (Teng, 1990; Huang et al., 1997). Those occurrences greatly influenced Taiwan’s contemporary fauna and flora. As global biodiversity hotspots, the QTP and Taiwan Island are popular areas for the exploration of biodiversity mechanisms (e.g., Lei et al., 2014; Niu et al., 2018; Cheng et al., 2019; Liu et al., 2021), and even more investigations are needed to clarify those regions’ species’ complex evolutionary histories.
In this study, we focus on the chestnut tiger butterfly, Parantica sita (Kollar) (Lepidoptera: Nymphalidae: Danainae). Found across Asia, P. sita has six subspecies: P. s. sita, P. s. niphonica (Moore), P. s. tytia (Gray), P. s. ethologa (Swinhoe), P. s. oblita (Tsukada and Nishiyama), and P. s. melanosticta (Morishita)1. Among them, P. s. sita is distributed mainly in southwestern China, and P. s. niphonica occurs in Taiwan Island, South Korea, and Japan (Chou, 1994). In a previous study, we found substantial genetic divergence between the mitogenomes of those two subspecies—a 4.1% divergence in the complete mitogenome and a fragment insertion/deletion in the A + T rich region (Hu and Wang, 2019). Additionally, the phylogenetic analysis showed P. s. niphonica more closely related to P. luzonensis than to P. s. sita, so we proposed that P. s. sita and P. s. niphonica are independent species (Hu and Wang, 2019). In a subsequent study, we found a novel mitogenome in P. s. sita samples from Leshan, Sichuan, in southwestern China. Its sequence diverged significantly from the known mitogenomes of those two subspecies, and there was a fragment insertion/deletion in the A + T rich region (Zhang et al., 2022). Then, phylogenetic analysis showed that those three mitogenome types were not monophyletic because P. luzonensis was mixed in (Zhang et al., 2022). This implied that the Leshan individuals were possibly from an independent species and, consequently, that P. sita in China could be a species complex. To clarify P. sita’s genetic differentiation, we collected a large number of individuals from throughout the species’ entire distribution area in China for a genotyping investigation, as well as for morphological comparisons. Meanwhile, as the distribution area covers both QTP and Taiwan Island, an understanding of P. sita’s genetic divergence would be valuable for explaining how geological events contribute to species evolution.
Materials and Methods
Sampling of Butterflies and DNA Extraction
We collected 403 P. s. sita individuals from its distribution range (i.e., Sichuan, Chongqing, Yunnan, Guizhou, and Tibet) (Figure 1). Because samples collected in different months were considered different populations in some sites, 18 populations were sampled from 13 sampling sites (Supplementary Table 1). Besides, 26 individuals of P. s. niphonica were collected from Japan and Taiwan Island. Because P. s. niphonica maintains an annual migration route between Taiwan Island and Japan (Kanazawa et al., 2012; Cheng et al., 2015), those 26 individuals were considered to be from one population (Supplementary Table 1). For the outgroup, we collected 10 P. melaneu and P. swinhoei individuals. All butterflies were taken to the laboratory as soon as possible after capture, and their thoraxes were then preserved in ethanol at −20°C.
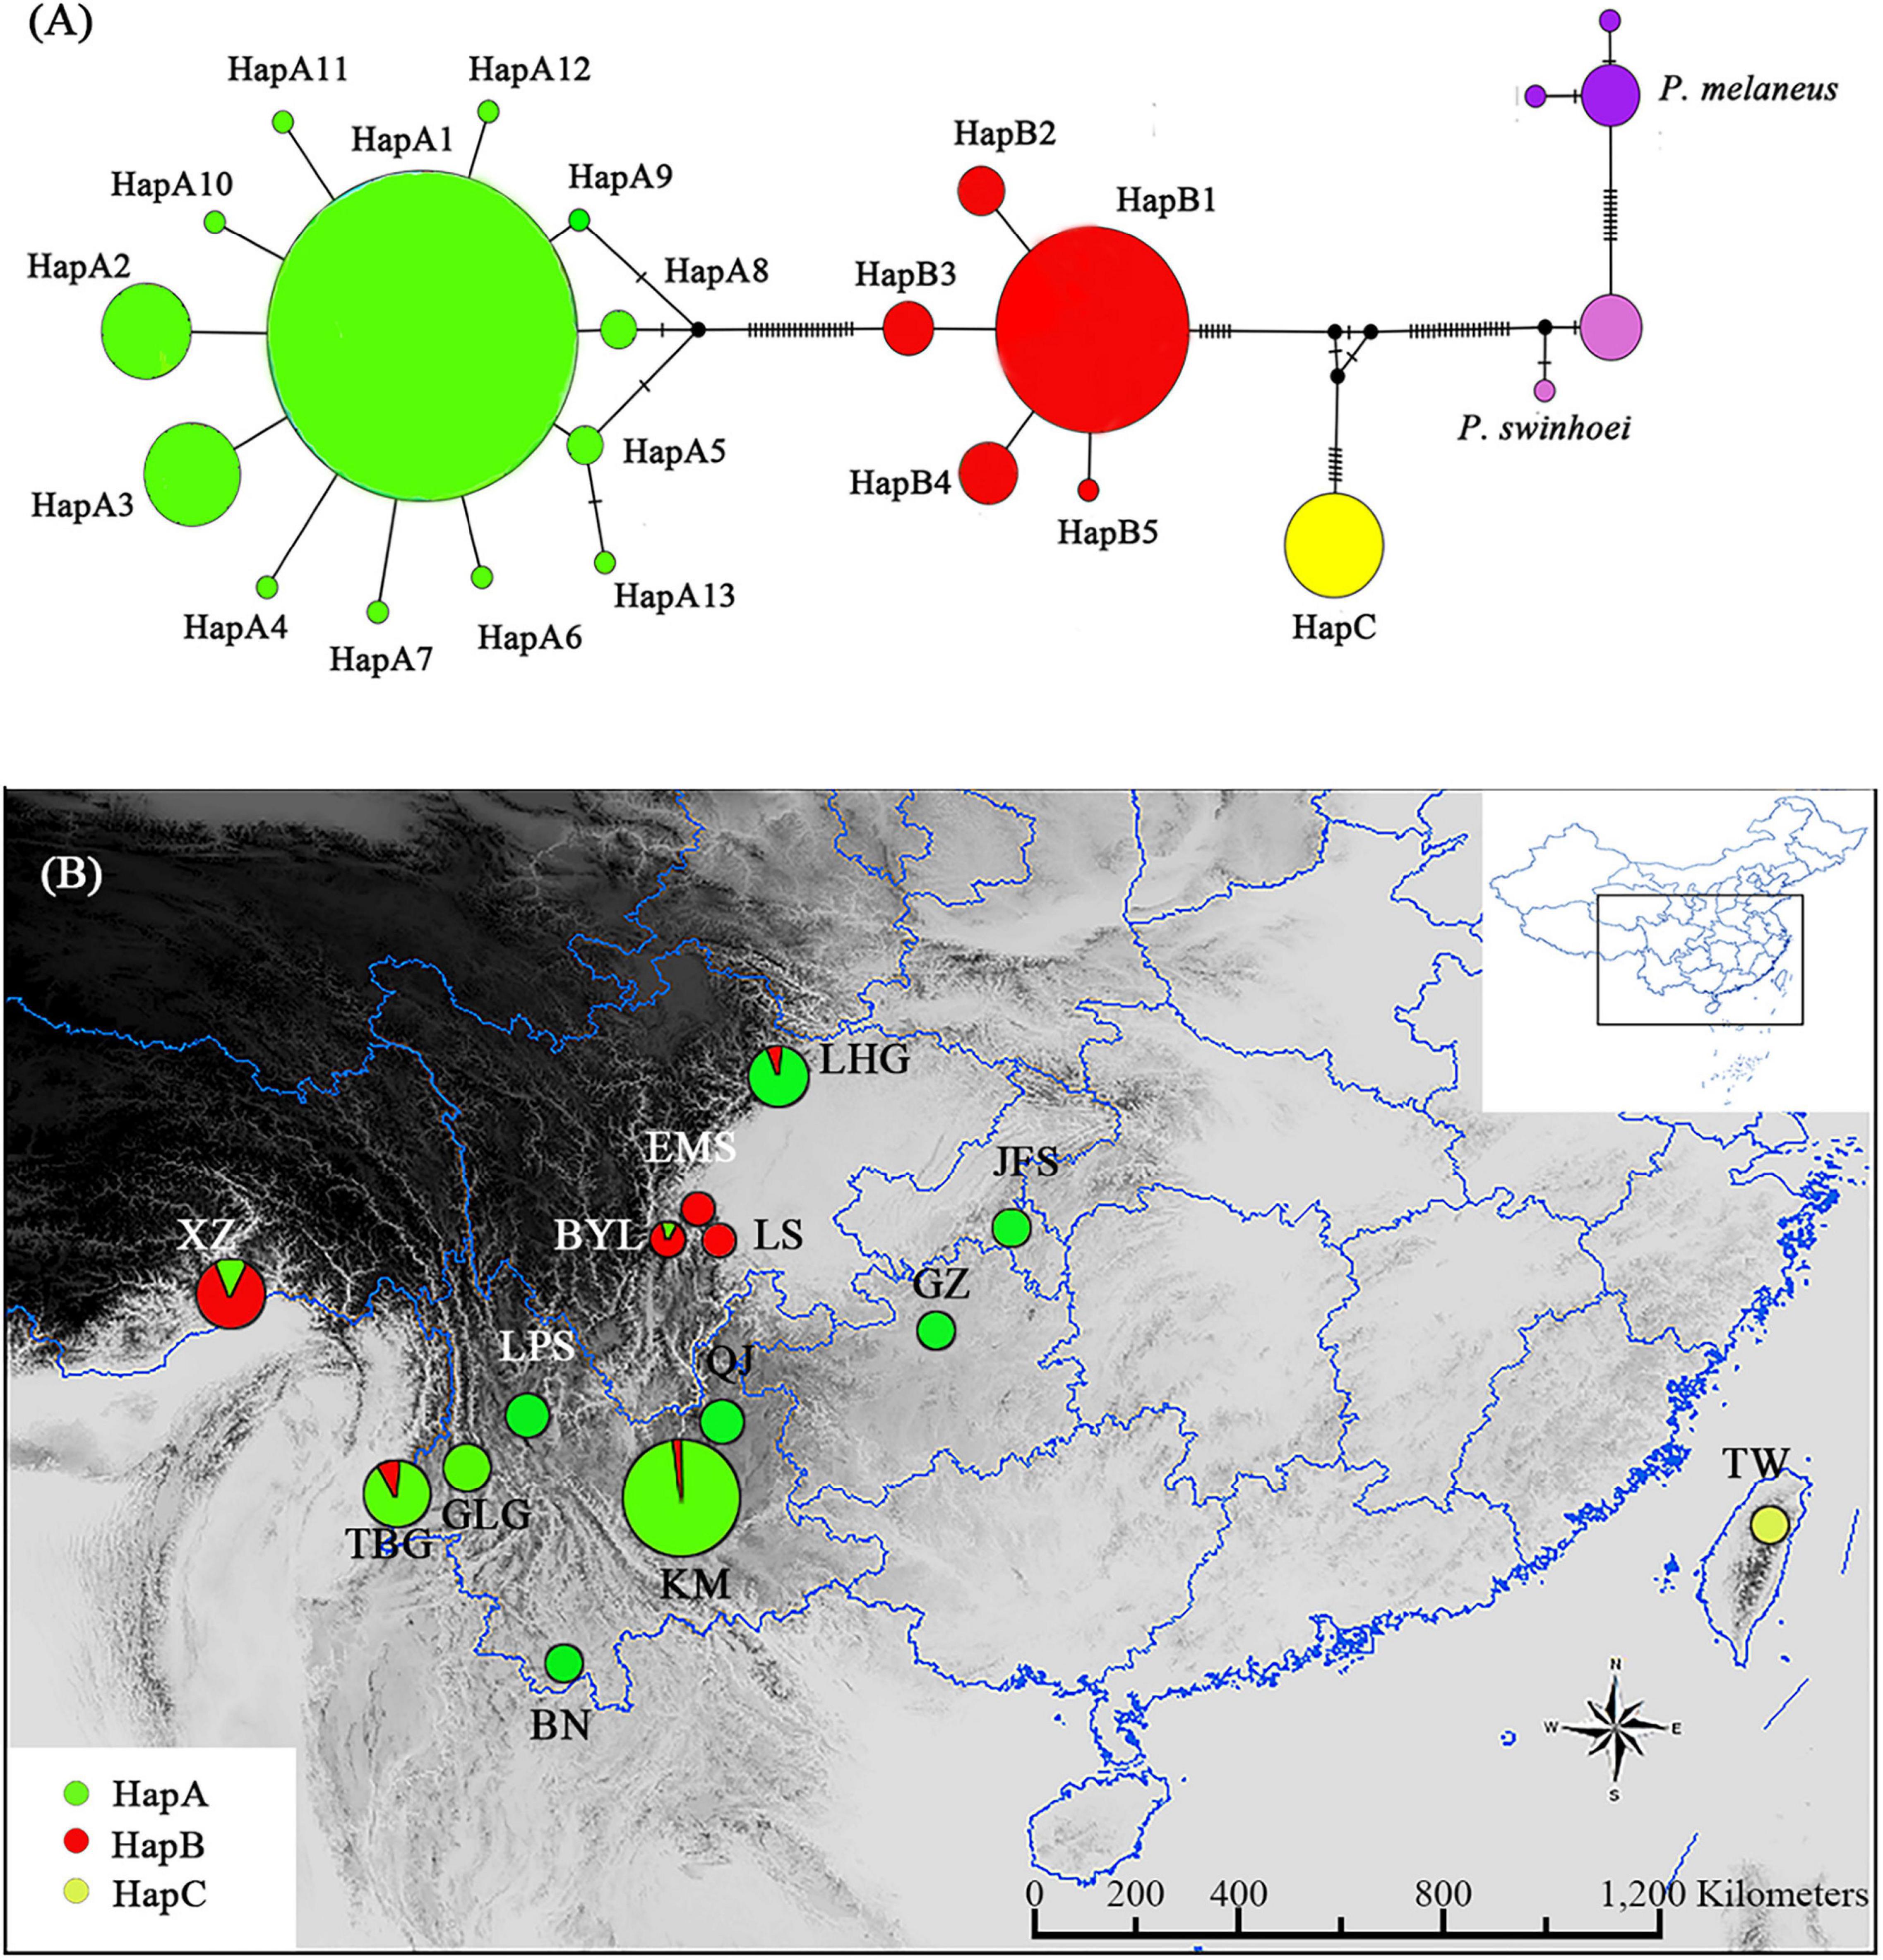
Figure 1. Parantica sita haplotypes based on cytochrome oxidase subunit I (COI) sequencing. (A) Haplotype network diagram of the 19 sampled populations. Circle size is proportional to the numbers of samples and each vertical line between haplotypes indicates a base difference. (B) The geographical distributions of the three haplotype groups. Circle size is proportional to the number of samples. XZ: Motuo, Tibet; TBG: Tongbiguan, Yunnan; GLG: Mt. Gaoligong, Yunnan; LPS: Mt. Luoping, Yunnan; BN: Xishuangbanna, Yunnan; KM: Kunming, Yunnan; QJ: Qujing, Yunnan; BYL: Bayuelin Nature Reserve, Sichuan; EMS: Mt. E’mei, Sichuan; LS: Leshan, Sichuan; LHG: Laohegou Nature Reserve, Sichuan; JFS: Mt. Jinfo, Chongqing; GZ: Guizhou; TW: Mt. Yangming, Taiwan. The inset shows the distribution area within China.
Before DNA extraction, the thoraxes were soaked in TE buffer (10 mmol/L Tris–HCl, 1 mmol/L EDTA, pH 8.0) to remove ethanol. Total genomic DNA was extracted with TIANamp Genomic DNA Kit (Tiangen, China) following the manufacturer’s instructions.
Cytochrome Oxidase Subunit I Sequencing and Analysis
Cytochrome oxidase subunit I (COI) fragments were amplified using universal primers LCO1490 (5′-GGTCAACAAATCATAAAGATATTGG-3′) and HCO2198 (5′-TAAACTTCAGGGTGACCAAAAAATCA-3′) (Folmer et al., 1994; Hebert et al., 2003). We performed the PCR in a 25 μL reaction volume using the EASYTaq PCR SuperMix Kit (Transgen, China) under the following conditions: denaturing at 94°C for 4 min, then 35 cycles of denaturing at 94°C for 30 s, annealing at 54°C for 30 s, elongation at 72°C for 50 s, and a final elongation at 72°C for 10 min. The products were sequenced on both forward and reverse strands by RuiBiotech Ltd. (Beijing, China).
Sequences were edited and aligned using the MUSCLE algorithm in MEGA v6.0 (Tamura et al., 2013). Genealogical relationships among haplotypes were further assessed using a TCS network algorithm constructed in PopArt v1.7 (Leigh and Bryant, 2015) with P. melaneu and P. swinhoei as the outgroups.
Microsatellite Genotyping and Analysis
The microsatellite fragments of 14 polymorphic loci were amplified (Supplementary Table 2) using the protocol described in our previous study (Hu et al., 2020). For genetic diversity analysis, we calculated polymorphism information content, expected heterozygosity, and observed heterozygosity with CERVUS v3.0.7 (Kalinowski et al., 2007); the average numbers of alleles and numbers of effective alleles with PopGen v1.32 (Yeh and Boyle, 1997); and allelic richness and private allelic richness of each population with HP-RARE v1.0 (Kalinowski, 2005). Population structure was evaluated using three methods: (i) Bayesian approximation conducted in STRUCTURE v2.3.4 (Pritchard et al., 2000), (ii) a spatial Bayesian model-based approach in TESS v2.3 (Chen et al., 2007), and (iii) discriminant analysis of principal components using the R package adegenet v2.0 (Jombart et al., 2010).
Genetic Variation and Spatial Analysis
To evaluate the genetic variation both among and within populations based on COI and microsatellite data, we calculated hierarchical analysis of molecular variance (AMOVA) by computing conventional F-statistics from haplotypes with 10,000 permutations in Arlequin v3.5 (Excoffier and Lischer, 2010). We also used Arlequin to calculate the pairwise FST for each pair of the 19 populations. Then, to assess whether there was isolation by distance, we performed Mantel correlation tests between geographical distances and the pairwise genetic distances, FST/(1-FST). We also investigated the relationships between genetic and geographical distances by using spatial autocorrelation analysis. Both those analyses and the Mantel tests were performed in GenALEx v6.5 (Peakall and Smouse, 2012). We used MEGA v6.0 (Tamura et al., 2013) to calculate the p-distances for each pair of the 19 populations.
Gene Flow Analysis and Divergence Time Estimation
Assuming that P. sita in China is actually three species (see Results), we estimated the gene flow among those species by using MIGRATE-N (Beerli and Felsenstein, 2001) to calculate Bayesian inference from the microsatellite data. The estimated divergence times of the three lineages, based on COI sequences, were performed in BEAST v1.8.4 (Drummond and Rambaut, 2007). Based on whole mitochondrial genes, Chazot et al. (2019) estimated that the divergence time between P. s. niphonica and Ideopsis similis was about 20 million years ago (Ma) with a 95% highest posterior density (HPD) of 25–16 Ma. We used this divergence time as the secondary calibration in our analysis. The results of three runs were combined using LogCombiner in BEAST (Drummond and Rambaut, 2007) and the initial 10% were discarded as burn-in. The tree with divergence times was visualized using FIGTREE v1.3.12.
Morphological Observations
Specimens of both sexes were spread for examination and digitally photographed against a medium-gray background. Photos were adjusted using Adobe Photoshop CS (Adobe, United States), and the ground color near the hindwing anal angle was extracted for comparison across taxa. To compare the male sex brands, specimens were observed under an SMZ1500 stereoscope (Nikon, Japan), and magnified photographs of the textured patches on the upper side of the hindwings and the modified scales on the hindwing undersides were taken with a DMX1200 digital camera (Nikon, Japan) mounted on the stereoscope.
Mainly followed Hu et al. (2018), we observed male and female genitalia as follows. For each specimen, the abdomen was removed and placed into a 1.5 mL microcentrifuge tube. Then 1 mL water was added to the abdomen to allow the tissue to rehydrate at 50°C for 30 min, after which 1 mL 10% NaOH was added to digest the soft tissue at 70°C for 1 h. The treated abdomen was neutralized with 2% acetic acid and then dissected in a water-filled Petri dish under a stereoscope, first removing residual tissues, scales, and hair. The genitalia were then soaked in 80% glycerol for 12 h to render them transparent, and then photographed with a DMX1200 digital camera (Nikon, Japan) mounted on an SMZ1500 stereoscope (Nikon, Japan). The photographs were automatically stacked using Helicon Focus v7.5.8 (Helicon Soft, United States). After observation and photography, all parts of the genitalia were fixed on a glue card using water soluble polyvinyl acetate and pinned with the specimen.
Results
Cytochrome Oxidase Subunit I Sequences
We obtained 658-bp COI fragments from 426 P. sita individuals. After alignment and primer sequence removal, the sequences, now 591 bp in length, encoded 197 amino acids. There were 44 polymorphic sites, among which 36 occurred in the third codon site, two in the second codon site, and six in the first site (Supplementary Table 3).
We found 19 COI haplotypes in 426 individuals (Supplementary Table 3). In the haplotype network with P. melaneus and P. swinhoei as outgroups, the P. sita individuals clustered into three significantly diverged groups (Figure 1A). The HapA group consisted of 13 haplotypes with 1–6-bp differences, the HapB group consisted of five haplotypes with 1–2-bp differences, and the HapC group had only one haplotype (Figure 1A). There were also great differences among the groups: 25 bp between haplotype A1 and B1, 31 bp between A1 and C, and 15 bp between B1 and C.
The HapA group was distributed mainly in southwestern China, including Yunnan, Guizhou, Chongqing, and northern Sichuan, and the HapB group was distributed mainly in western Sichuan and Tibet (Figure 1B). Some individuals in the HapA group were distributed in the HapB group’s range and vice versa (Figure 1B). The HapC group was distributed exclusively in Japan and Taiwan Island (Figure 1B). So, with the 19 P. sita populations divided into three haplotype groups, AMOVA indicated that the genetic variation came mainly from among groups (90.4%; Table 1). The pairwise FST values among those three groups were distinctly higher than those among populations within each group (Supplementary Table 4). The p-distances among populations within each group ranged from 0.000 to 0.014, and those among three groups ranged from 0.025 to 0.052 (Supplementary Table 4).
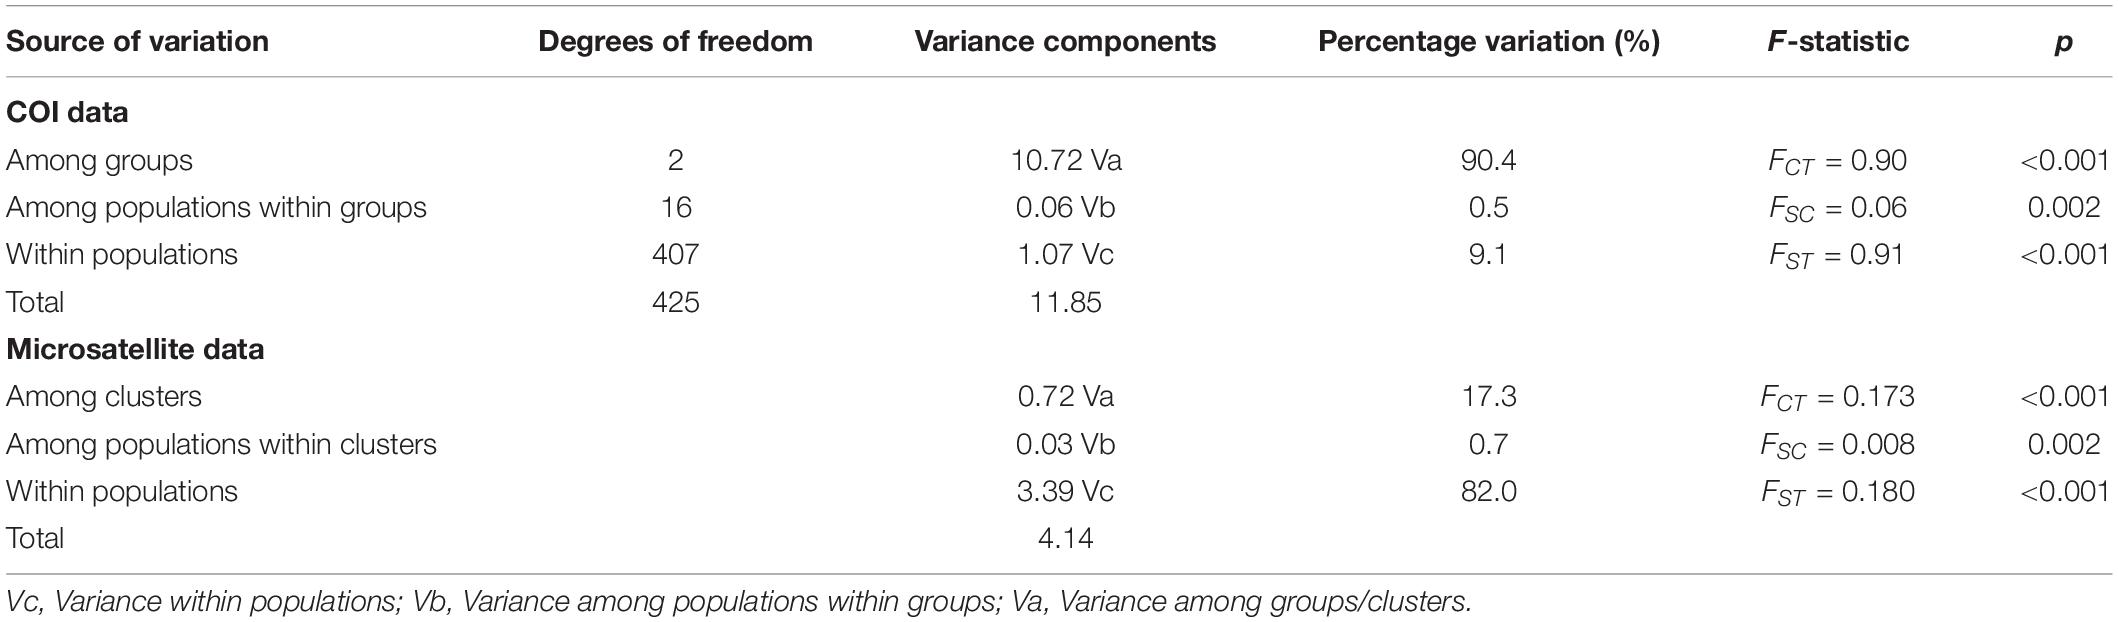
Table 1. Results of AMOVA of mtDNA cytochrome oxidase subunit I (COI) and microsatellite data from 19 Parantica sita populations.
Microsatellite Genotypes
We analyzed the microsatellite markers at 14 polymorphic loci in 421 of the 429 individuals from 19 populations of P. sita (eight individuals failed amplification). The results showed high levels of polymorphism with polymorphism information content ranging from 0.376 to 0.480 and expected heterozygosity from 0.432 to 0.534 (Supplementary Table 5).
Clustering analysis in STRUCTURE revealed the 19 populations clearly divided into three clusters (Figure 2A). The populations in northern Sichuan, Guizhou, Chongqing, and Yunnan gathered into Cluster1 and those in Tibet and western Sichuan into Cluster2, while the individuals from Taiwan Island and Japan were in Cluster3 (Figure 2A). Based on their distribution ranges, these three clusters coincided with haplotype groups, corresponding to HapA, HapB, and HapC, respectively. A subsequent analysis using TESS obtained same result—the 19 populations were divided into three clusters (Figure 2B). In discriminant analysis of principle components, all individuals formed the same three clusters as those found by STRUCTURE and TESS analysis (Figure 2C).
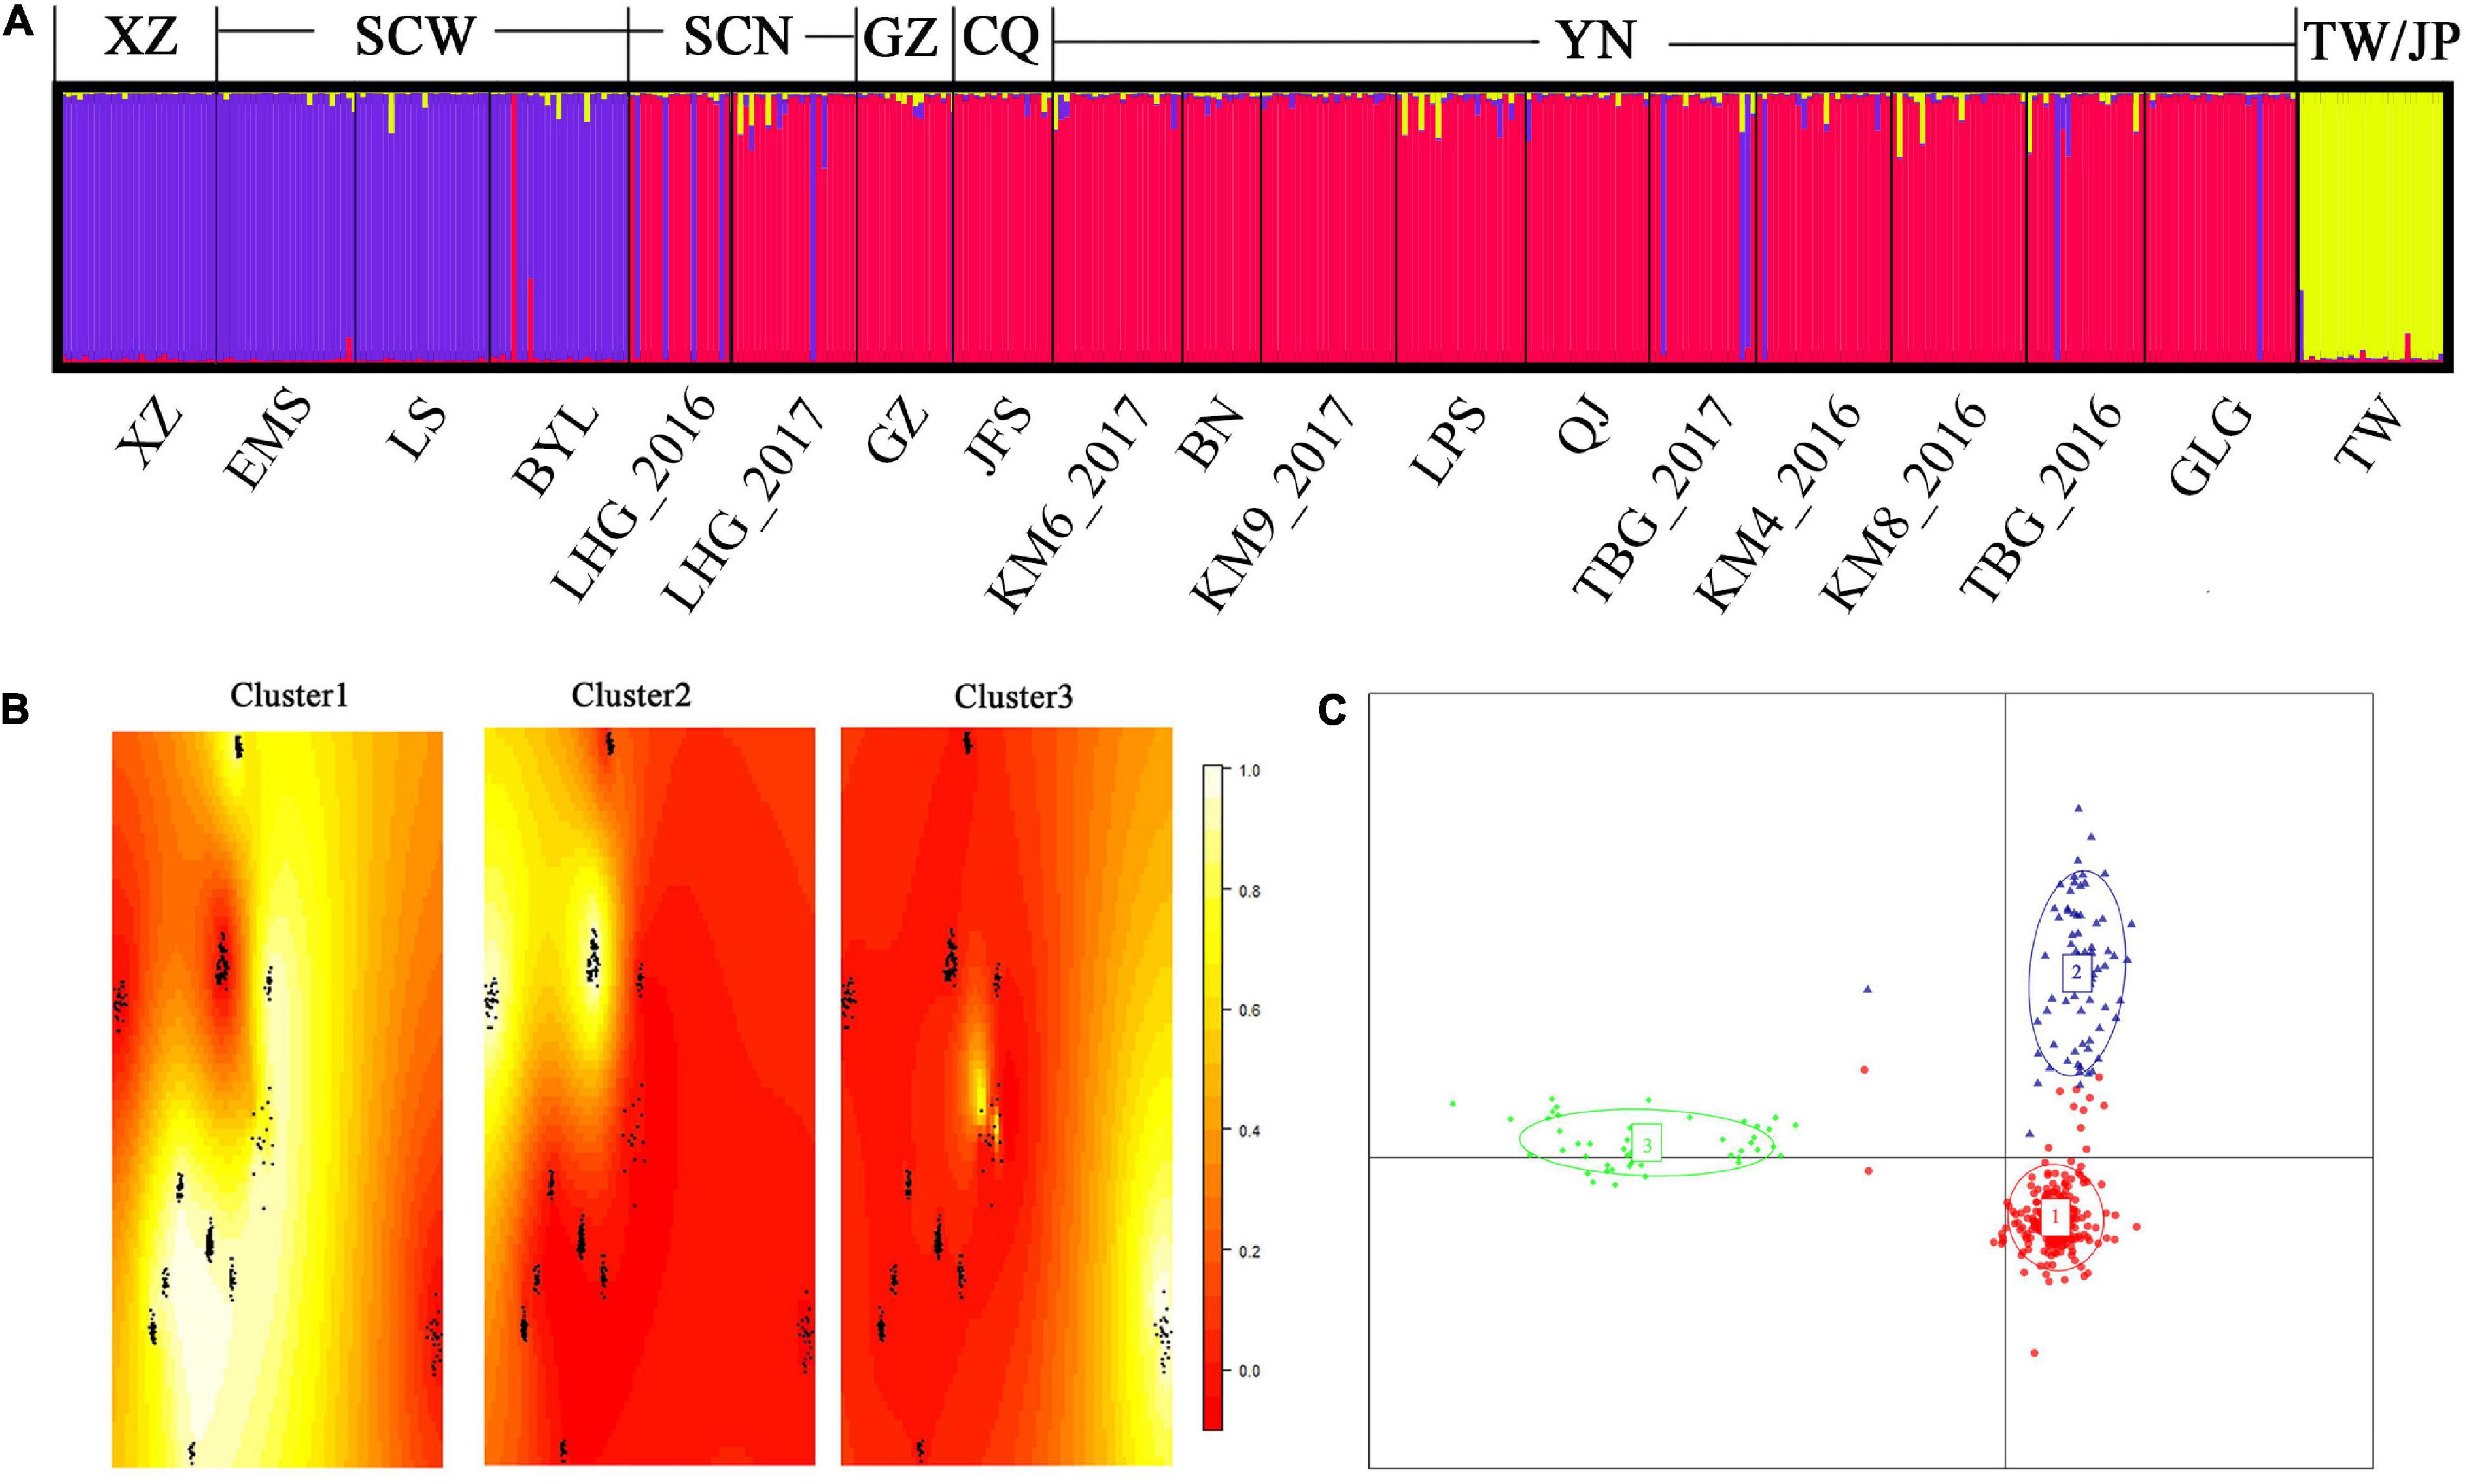
Figure 2. Results of using microsatellite markers with three clustering methods to analyze the 19 Parantica sita populations. (A) A Bayesian approximation conducted in STRUCTURE. The letters below the bar plot are the geographic populations (see Supplementary Table 1) and the letters above are the main geographical distribution areas corresponding to the cluster. XZ: Tibet; SCW: western Sichuan; SCN: northern Sichuan; GZ: Guizhou; CQ: Chongqing; YN: Yunnan; TW/JP: Taiwan Island/Japanese archipelago. Each vertical bar represents an individual and different colors represent speculative clusters. (B) A spatial Bayesian model-based approach in TESS. In each heat map, yellow represents individual assignment probability close to 1 while red indicates individual assignment probability close to 0. The 19 P. sita populations gathered into three clusters: Cluster1 was distributed mainly in Yunnan, Guizhou, Chongqing, and northern Sichuan; Cluster2 mainly in Tibet and western Sichuan; and Cluster3 exclusively on Taiwan Island and the Japanese archipelago. (C) Discriminant analysis of principal components. Each dot represents an individual and each color represents a cluster. All populations gathered into three groups: Cluster1, mainly distributed in Yunnan, Guizhou, Chongqing, and northern Sichuan; Cluster2, mainly distributed in Tibet and western Sichuan; and Cluster3, distributed on Taiwan Island and the Japanese archipelago.
Analysis of molecular variance of the microsatellite data showed that genetic variation came mainly from within populations (82.0%) and among clusters (17.3%, Table 1).
Integration of Cytochrome Oxidase Subunit I and Microsatellite Data
After integrating the COI haplotypes and microsatellite genotypes, all individuals matched perfectly. Those belonging to HapA were in Cluster1, those belonging to HapB were in Cluster2, and all of HapC were in Cluster3. Notably, the genetic properties of 12 individuals were “mismatched” to their corresponding geographic ranges: Eleven individuals from the Cluster1/HapA distribution range were identified as Cluster2/HapB and one individual from western Sichuan was identified as Cluster1/HapA (Figures 1A, 2). That implies that Cluster1/HapA and Cluster2/HapB are distinguishable lineages with substantial genetic divergence and, although they are sympatric, some factors may hamper hybridization. Although there were no “mismatched” individuals between Cluster3/HapC and the other two clusters, it is safe to propose that, based on genetic divergence, Cluster3/HapC is an independent lineage. For simplification, we designated the three lineages PS-A, PS-B, and PS-C, respectively, in the following analyses.
Morphological Differences
Overall, the wings of these three lineages appeared similar, but upon closer examination we found differences. First, the sub-hyaline patch in the PS-C discal cell was whitish, but it was almost transparent with a grayish blue hue in PS-A and PS-B (Figures 3A–C). Second, the hindwing’s upperside background color was blackish brown in PS-C, reddish brown in PS-A, and brick red in PS-B (Figures 3A–C). Due to either individual differences or worn wings, some individuals could not be accurately distinguished based on wing color. Finally, the male sex brand differed among the three lineages. There are two types of modified white scales, long hairy scales and short round scales, on the undersides of sex brands. PS-B had mainly long hairy scales, PS-C had mainly short round scales, and the ratio of the two scale types in PS-A was approximately 1:1 (Figures 3D–F). The proportion of the two types of scales in a couple of individuals were not distinguishable.
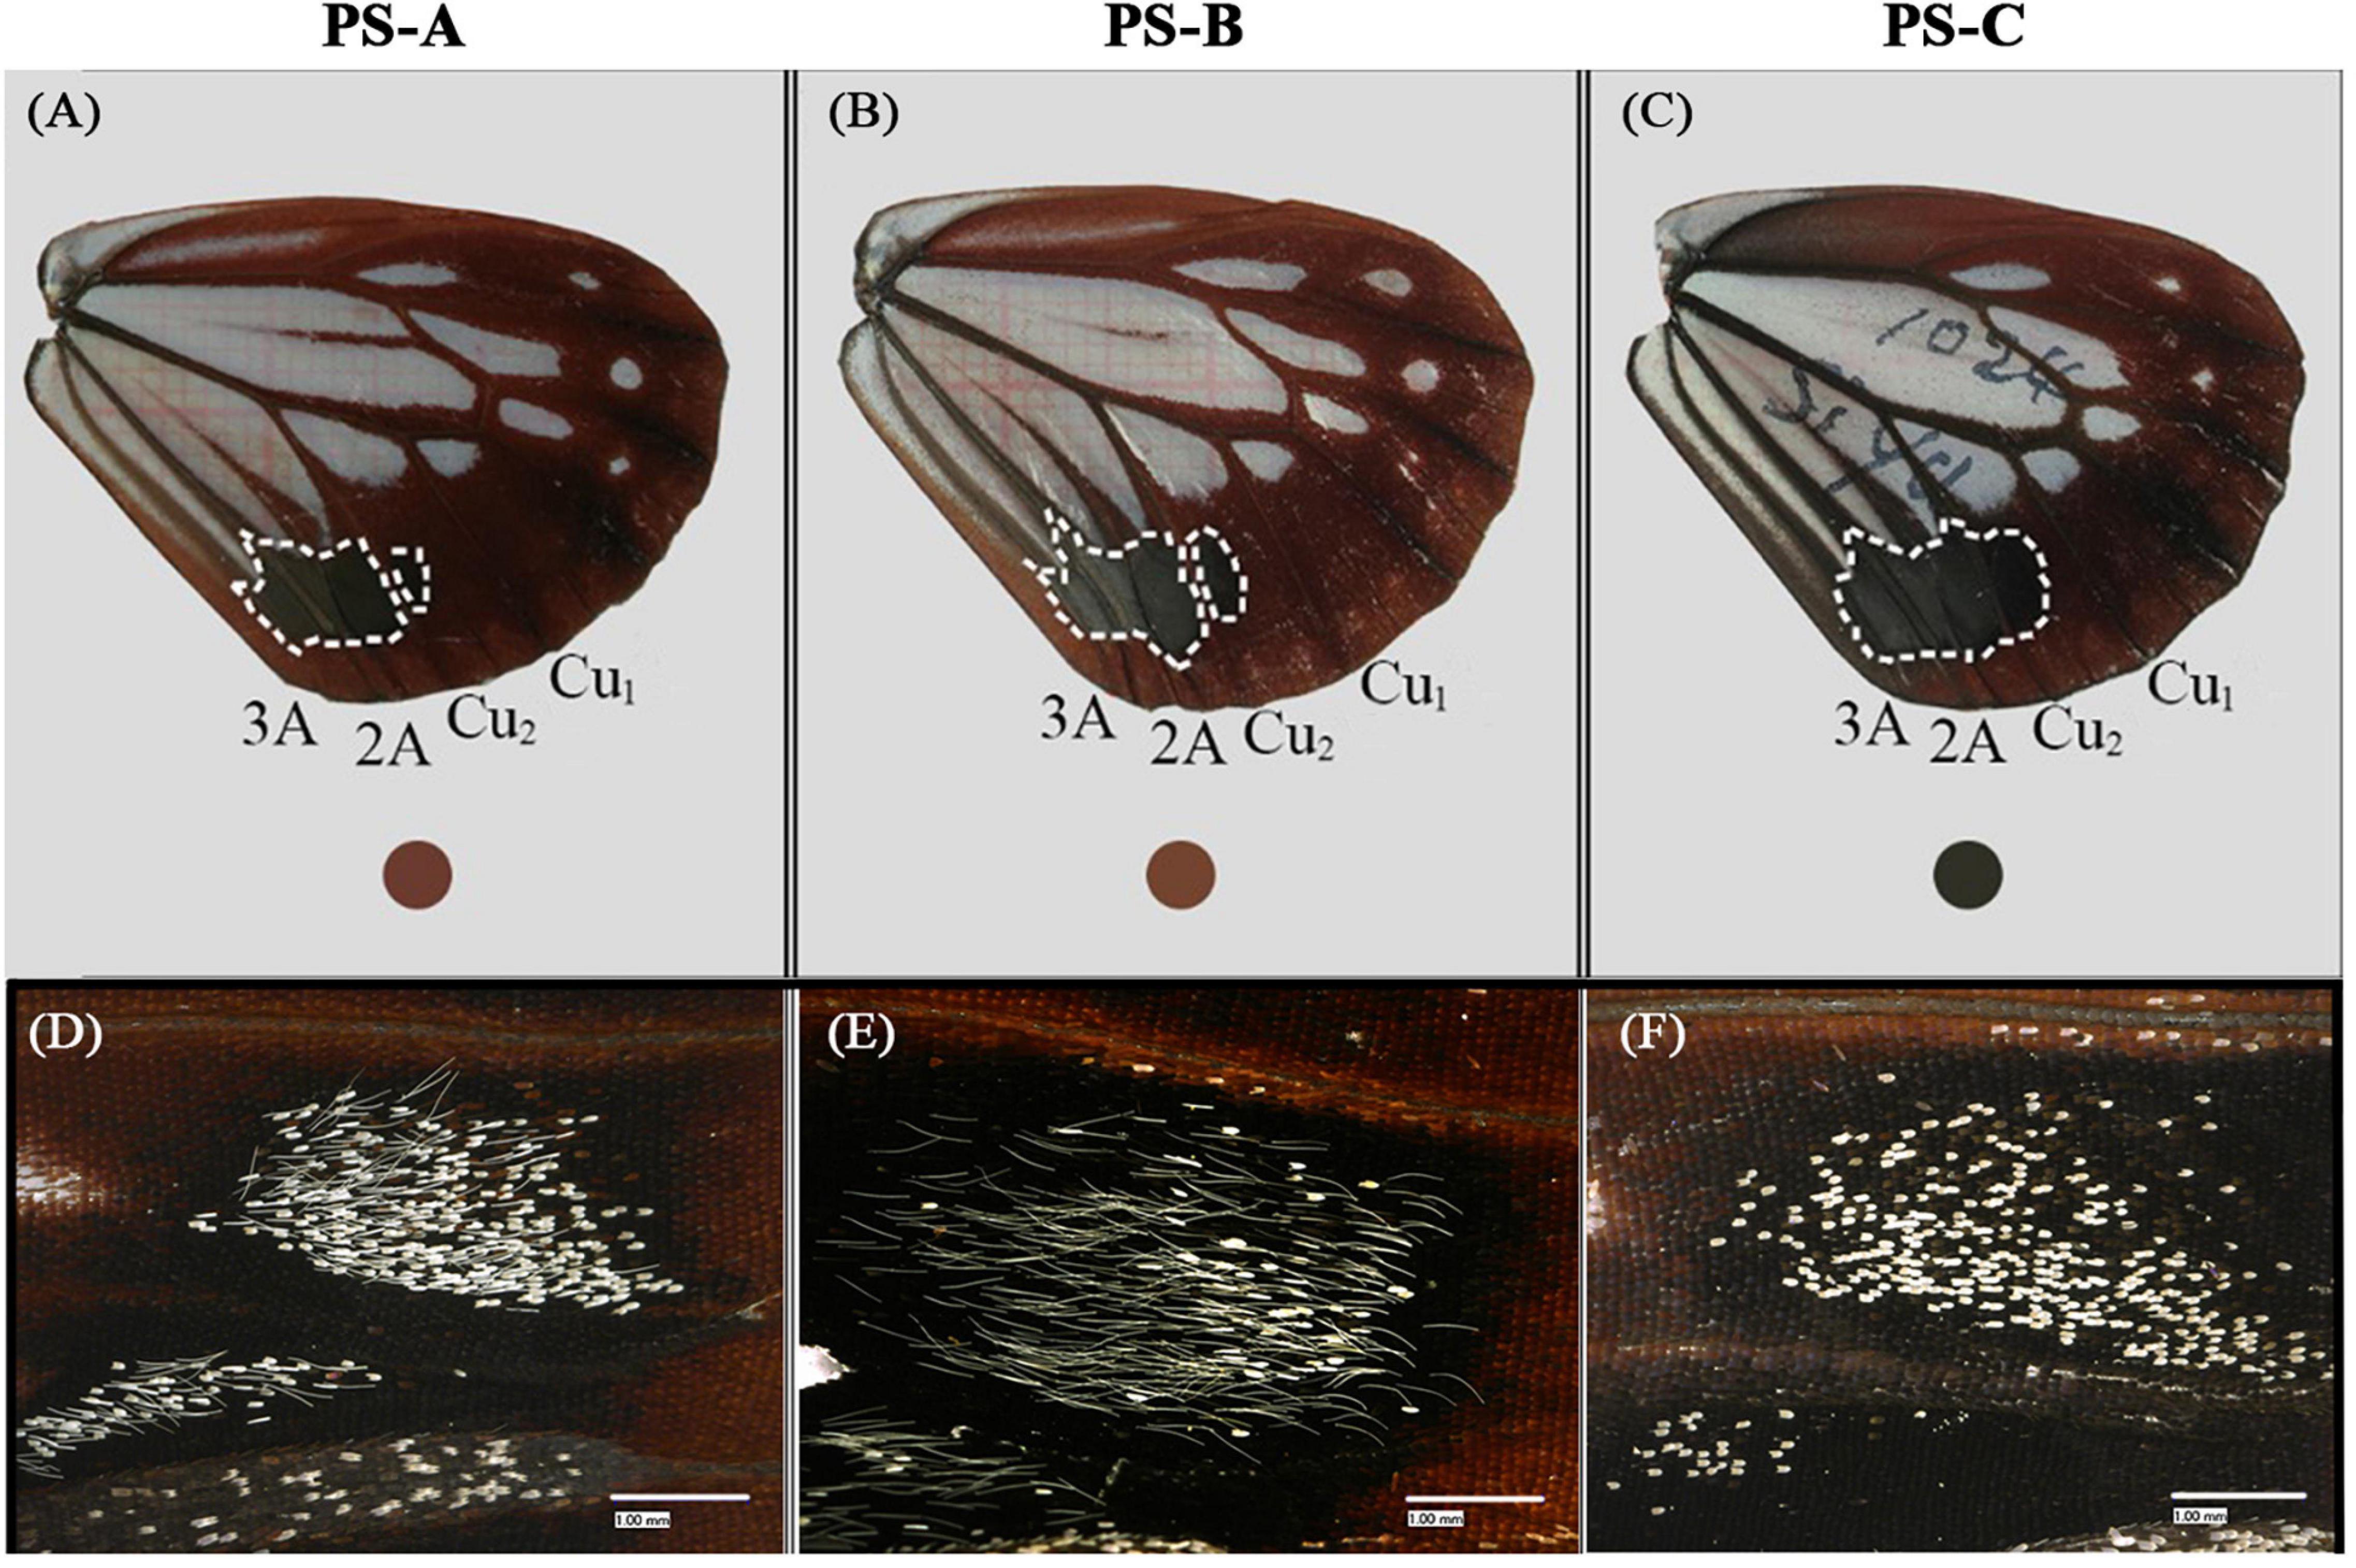
Figure 3. The uppersides (A–C) and undersides (D–F) of representative hindwings of the three Parantica sita lineages: PS-A, PS-B, and PS-C. (A–C) The dotted line surrounds the range of the black patch of the male sex brand, and the color within the colored circle indicates the color near the anal angle of the hindwing. (D–F) Male sex brand variability as shown by modified white scales on the undersides of the sex brands. Scale bar is 1 mm.
The male and female genitalia were obviously different among the three lineages. For male genitalia, the distance between the socii of PS-B was obviously broader than those of PS-A and PS-C; the valve of PS-B was narrower than those of PS-A and PS-C; and the saccus of PS-B bent upward (Figure 4). The most promising differences between PS-A and PS-C were a blunt projection at the middle of the valve margin and the distance between the socii of PS-C was wider than that of PS-A (Figure 4). ANOVA comparing the distances between the socii showed significant differences among the three lineages (F = 7.694, p < 0.01). For female genitalia, PS-B’s papillae anales were longer and the signum granules larger than those of PS-A and PS-C (Figure 4). The major difference between PS-A and PS-C was a longer ductus bursae in PS-A (Figure 4).
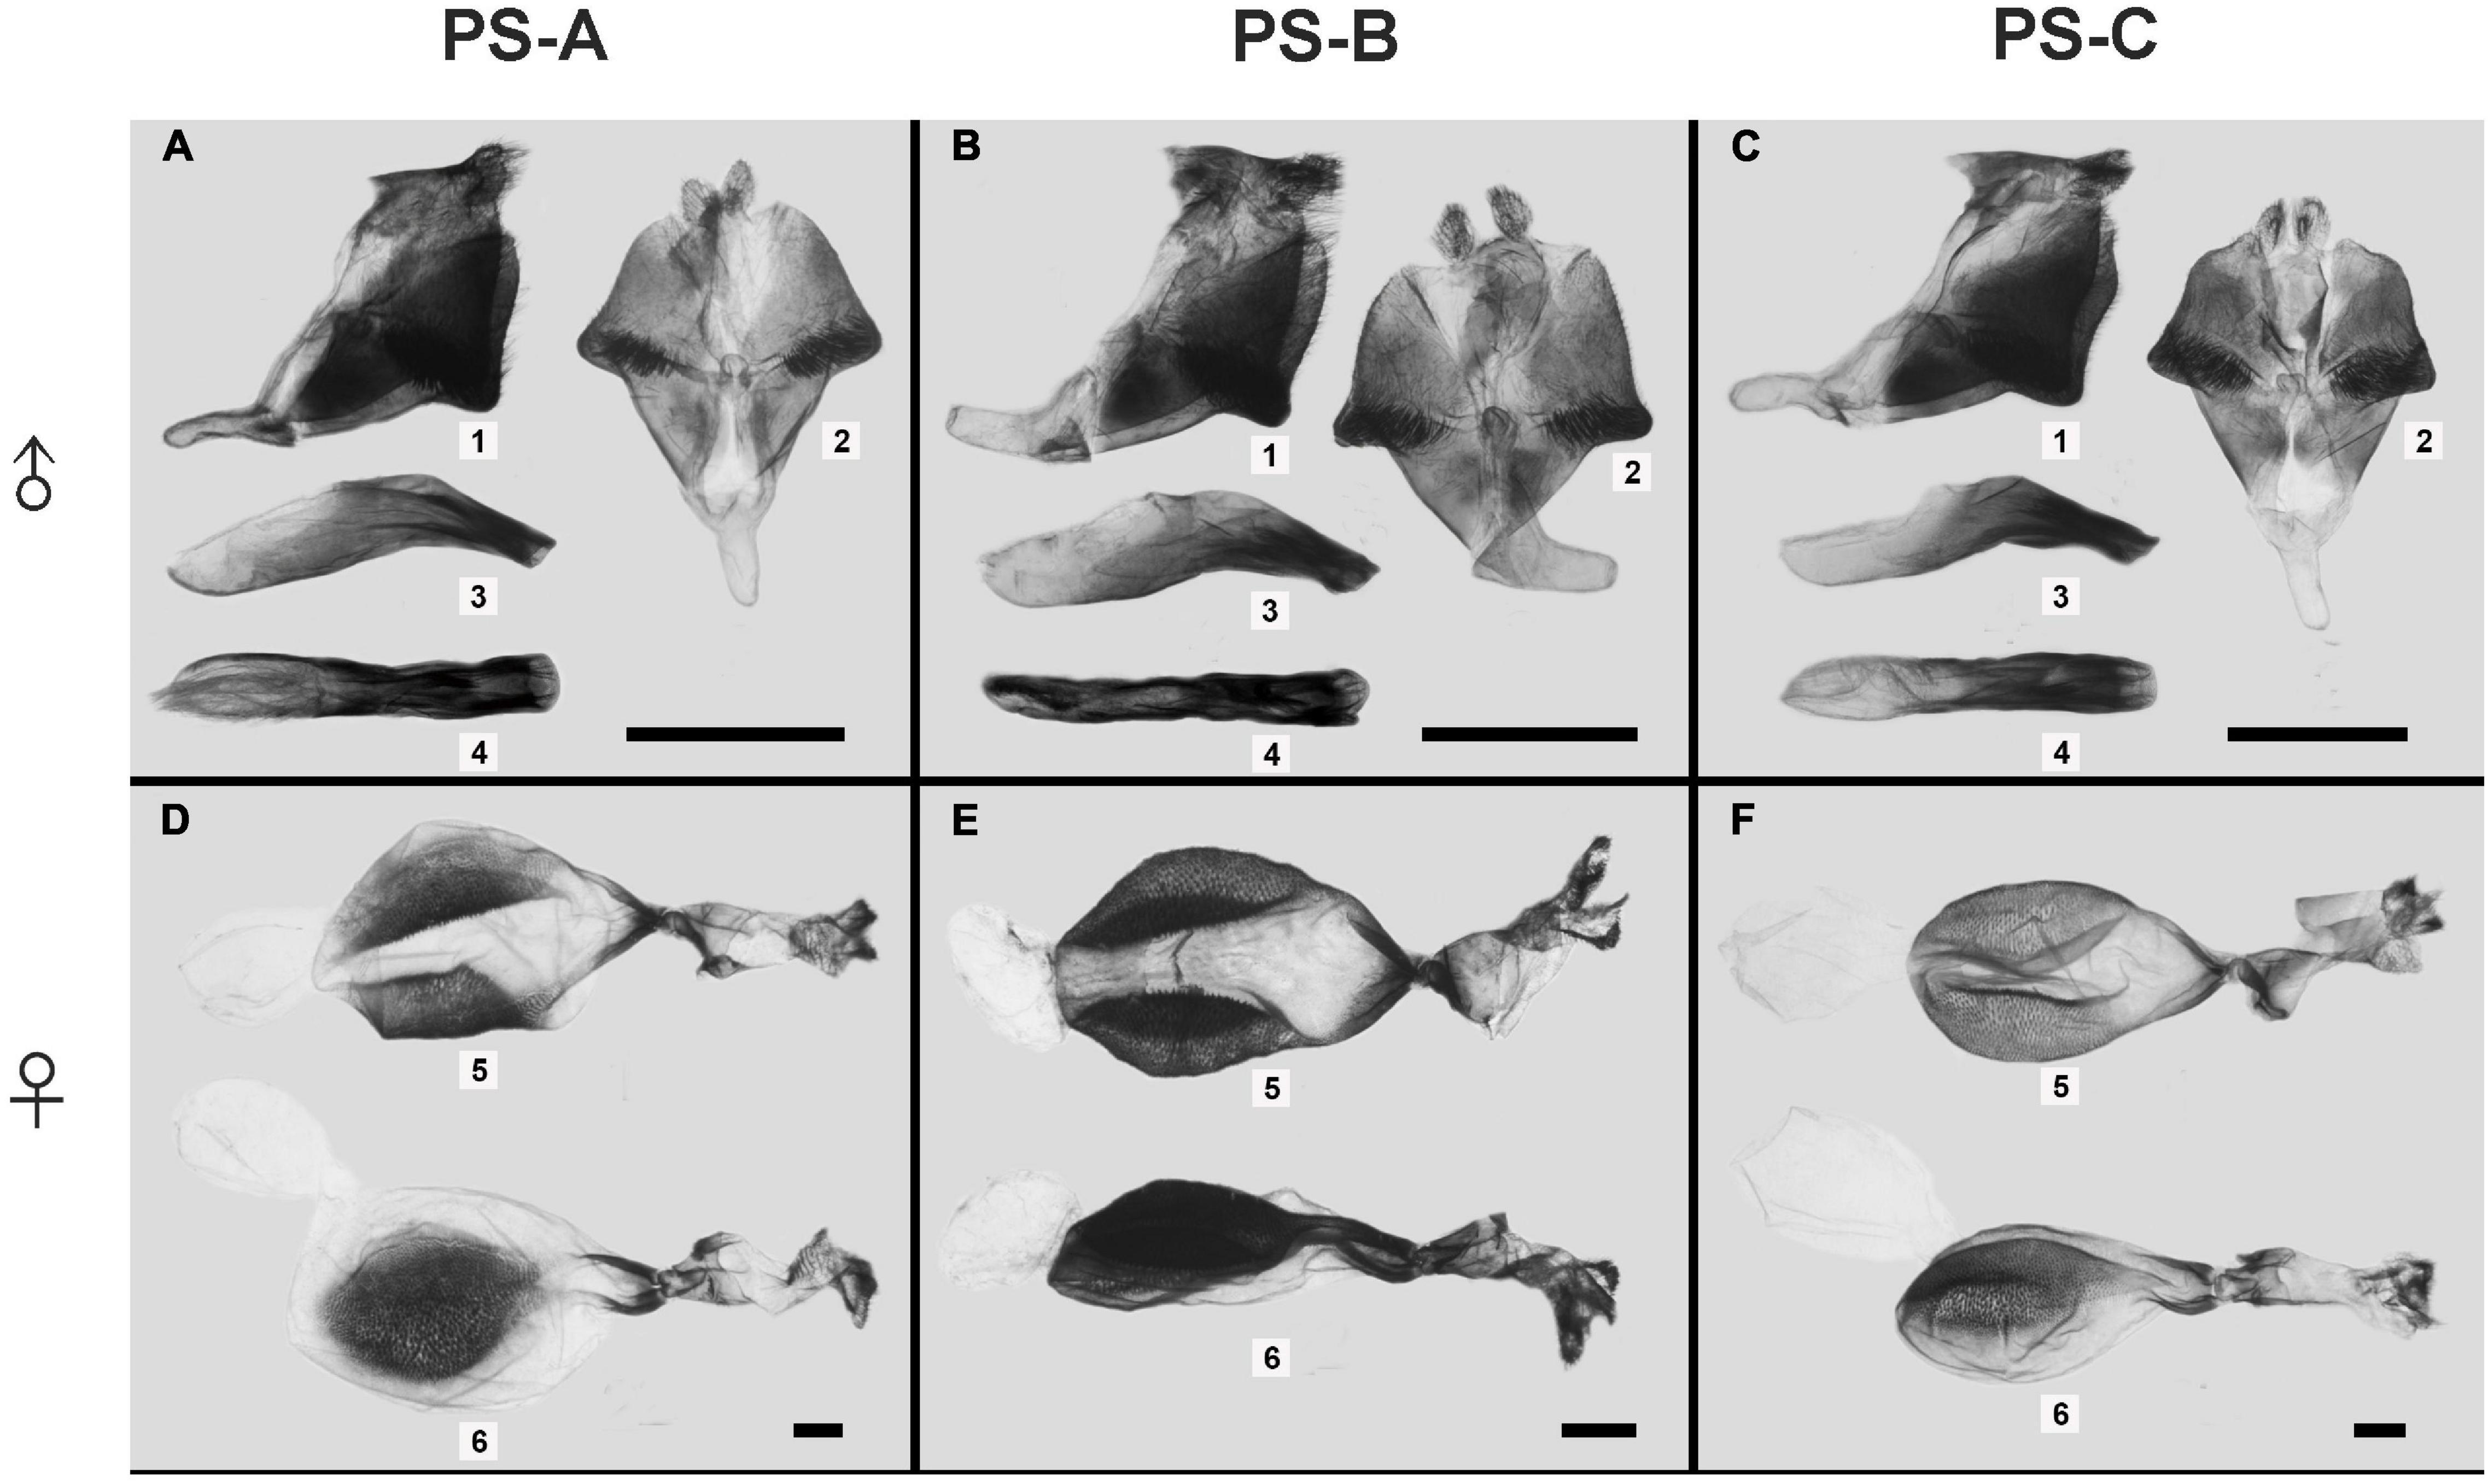
Figure 4. The male and female genitalia of the three Parantica sita lineages: PS-A, PS-B, and PS-C. (A–C) Male external genitalia (1, genitalia in lateral view; 2, genitalia in dorsal view; 3, aedeagus in lateral view; 4, aedeagus in dorsal view); (D–F) Female genitalia (5, dorsal view; 6, lateral view). Scale bar is 1 mm.
According to the published structure of male genitalia (Lang, 2012), PS-A’s overall structure was identical to that of P. s. sita and that of PS-B was identical to that of P. pedonga.
Gene Flow Among the Three Lineages
The estimated asymmetric gene flow, based on the microsatellite data, among the three lineages showed that the magnitudes of gene flow from PS-A to PS-B and from PS-A to PS-C were much higher than those in the opposite direction (Figure 5). The number of migrants per generation in all cases was lower than 1 (Figure 5), indicating no obvious gene flow among the three lineages.
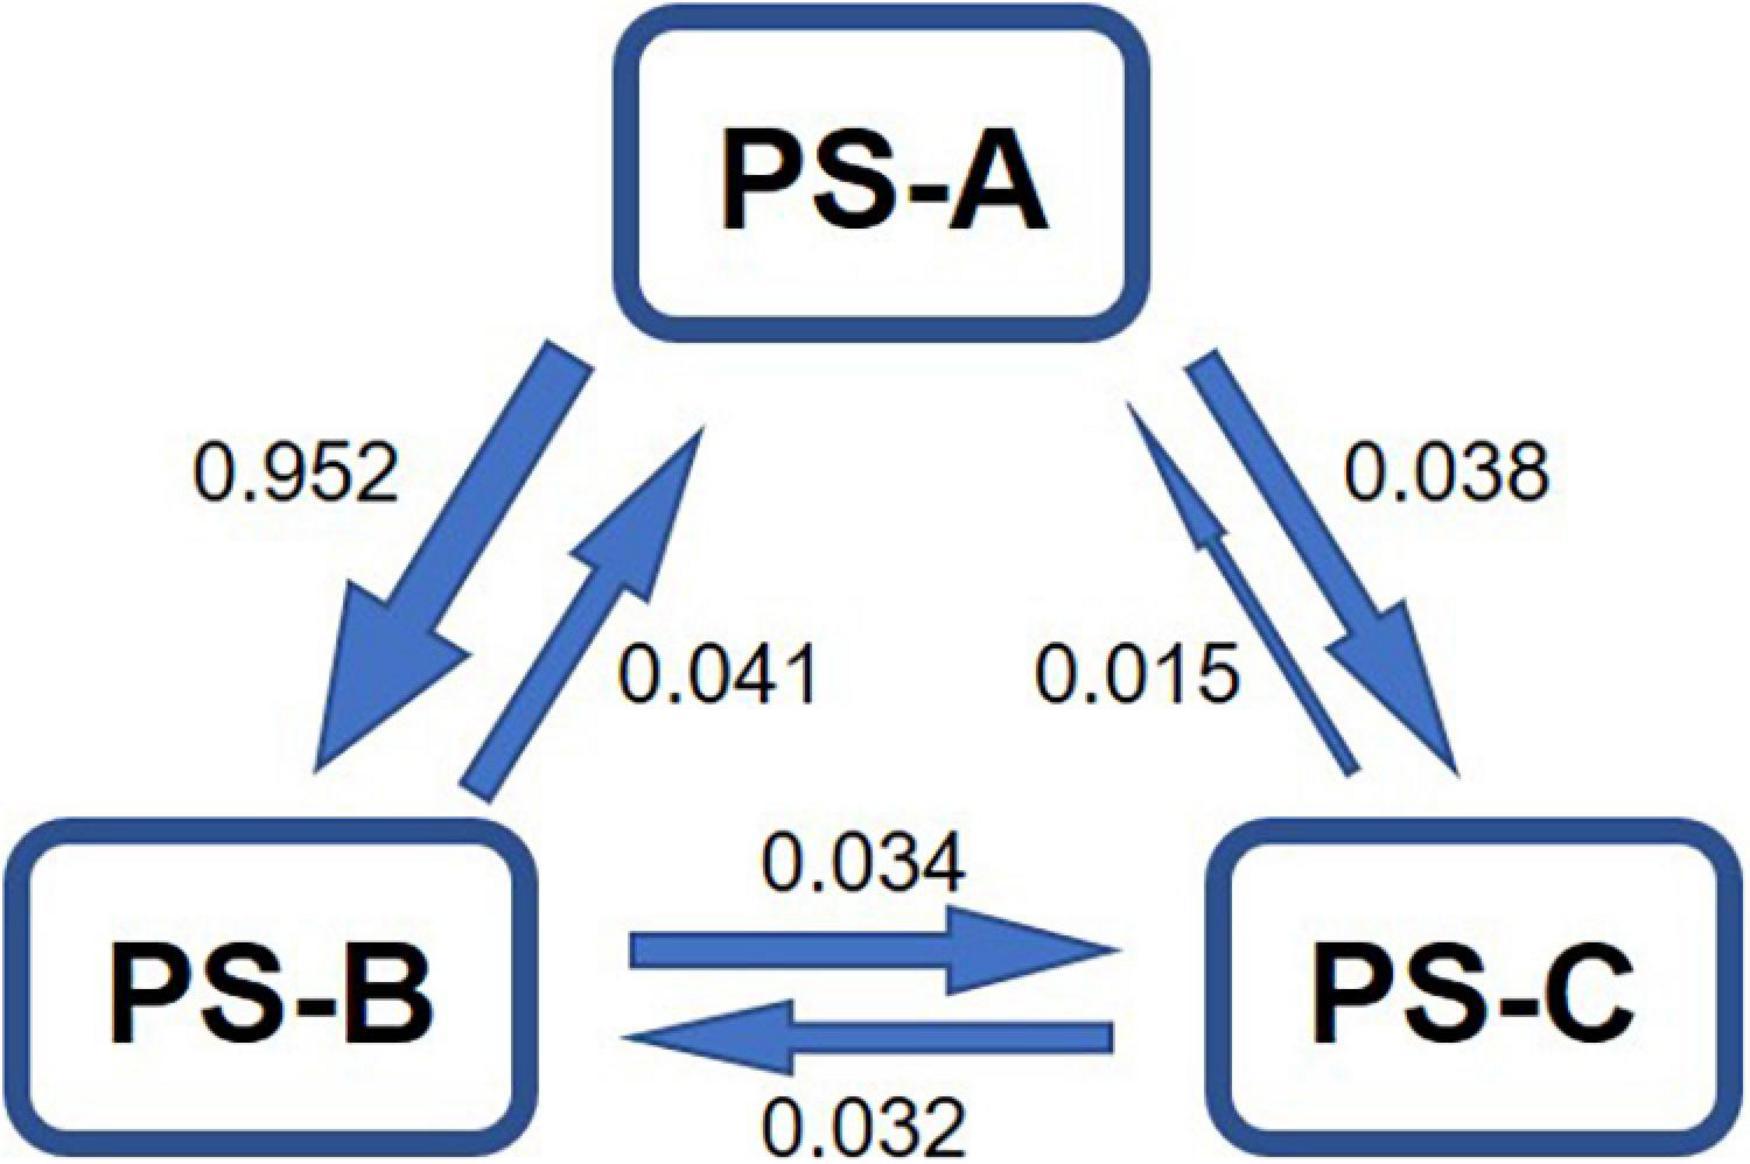
Figure 5. Estimated asymmetric gene flow, based on microsatellite data, among the three lineages of Parantica sita (PS-A, PS-B, and PS-C). Numbers indicate the number of migrants per generation.
Estimations of Divergence Times
Divergence time dating results showed that the PS-A clade separated from the PS-B + PS-C clade at about 8.79 Ma (95% HPD: 13.05–4.85 Ma), and the PS-B and PS-C clades separated about 4.87 Ma (95% HPD: 7.95–2.18 Ma; Figure 6).
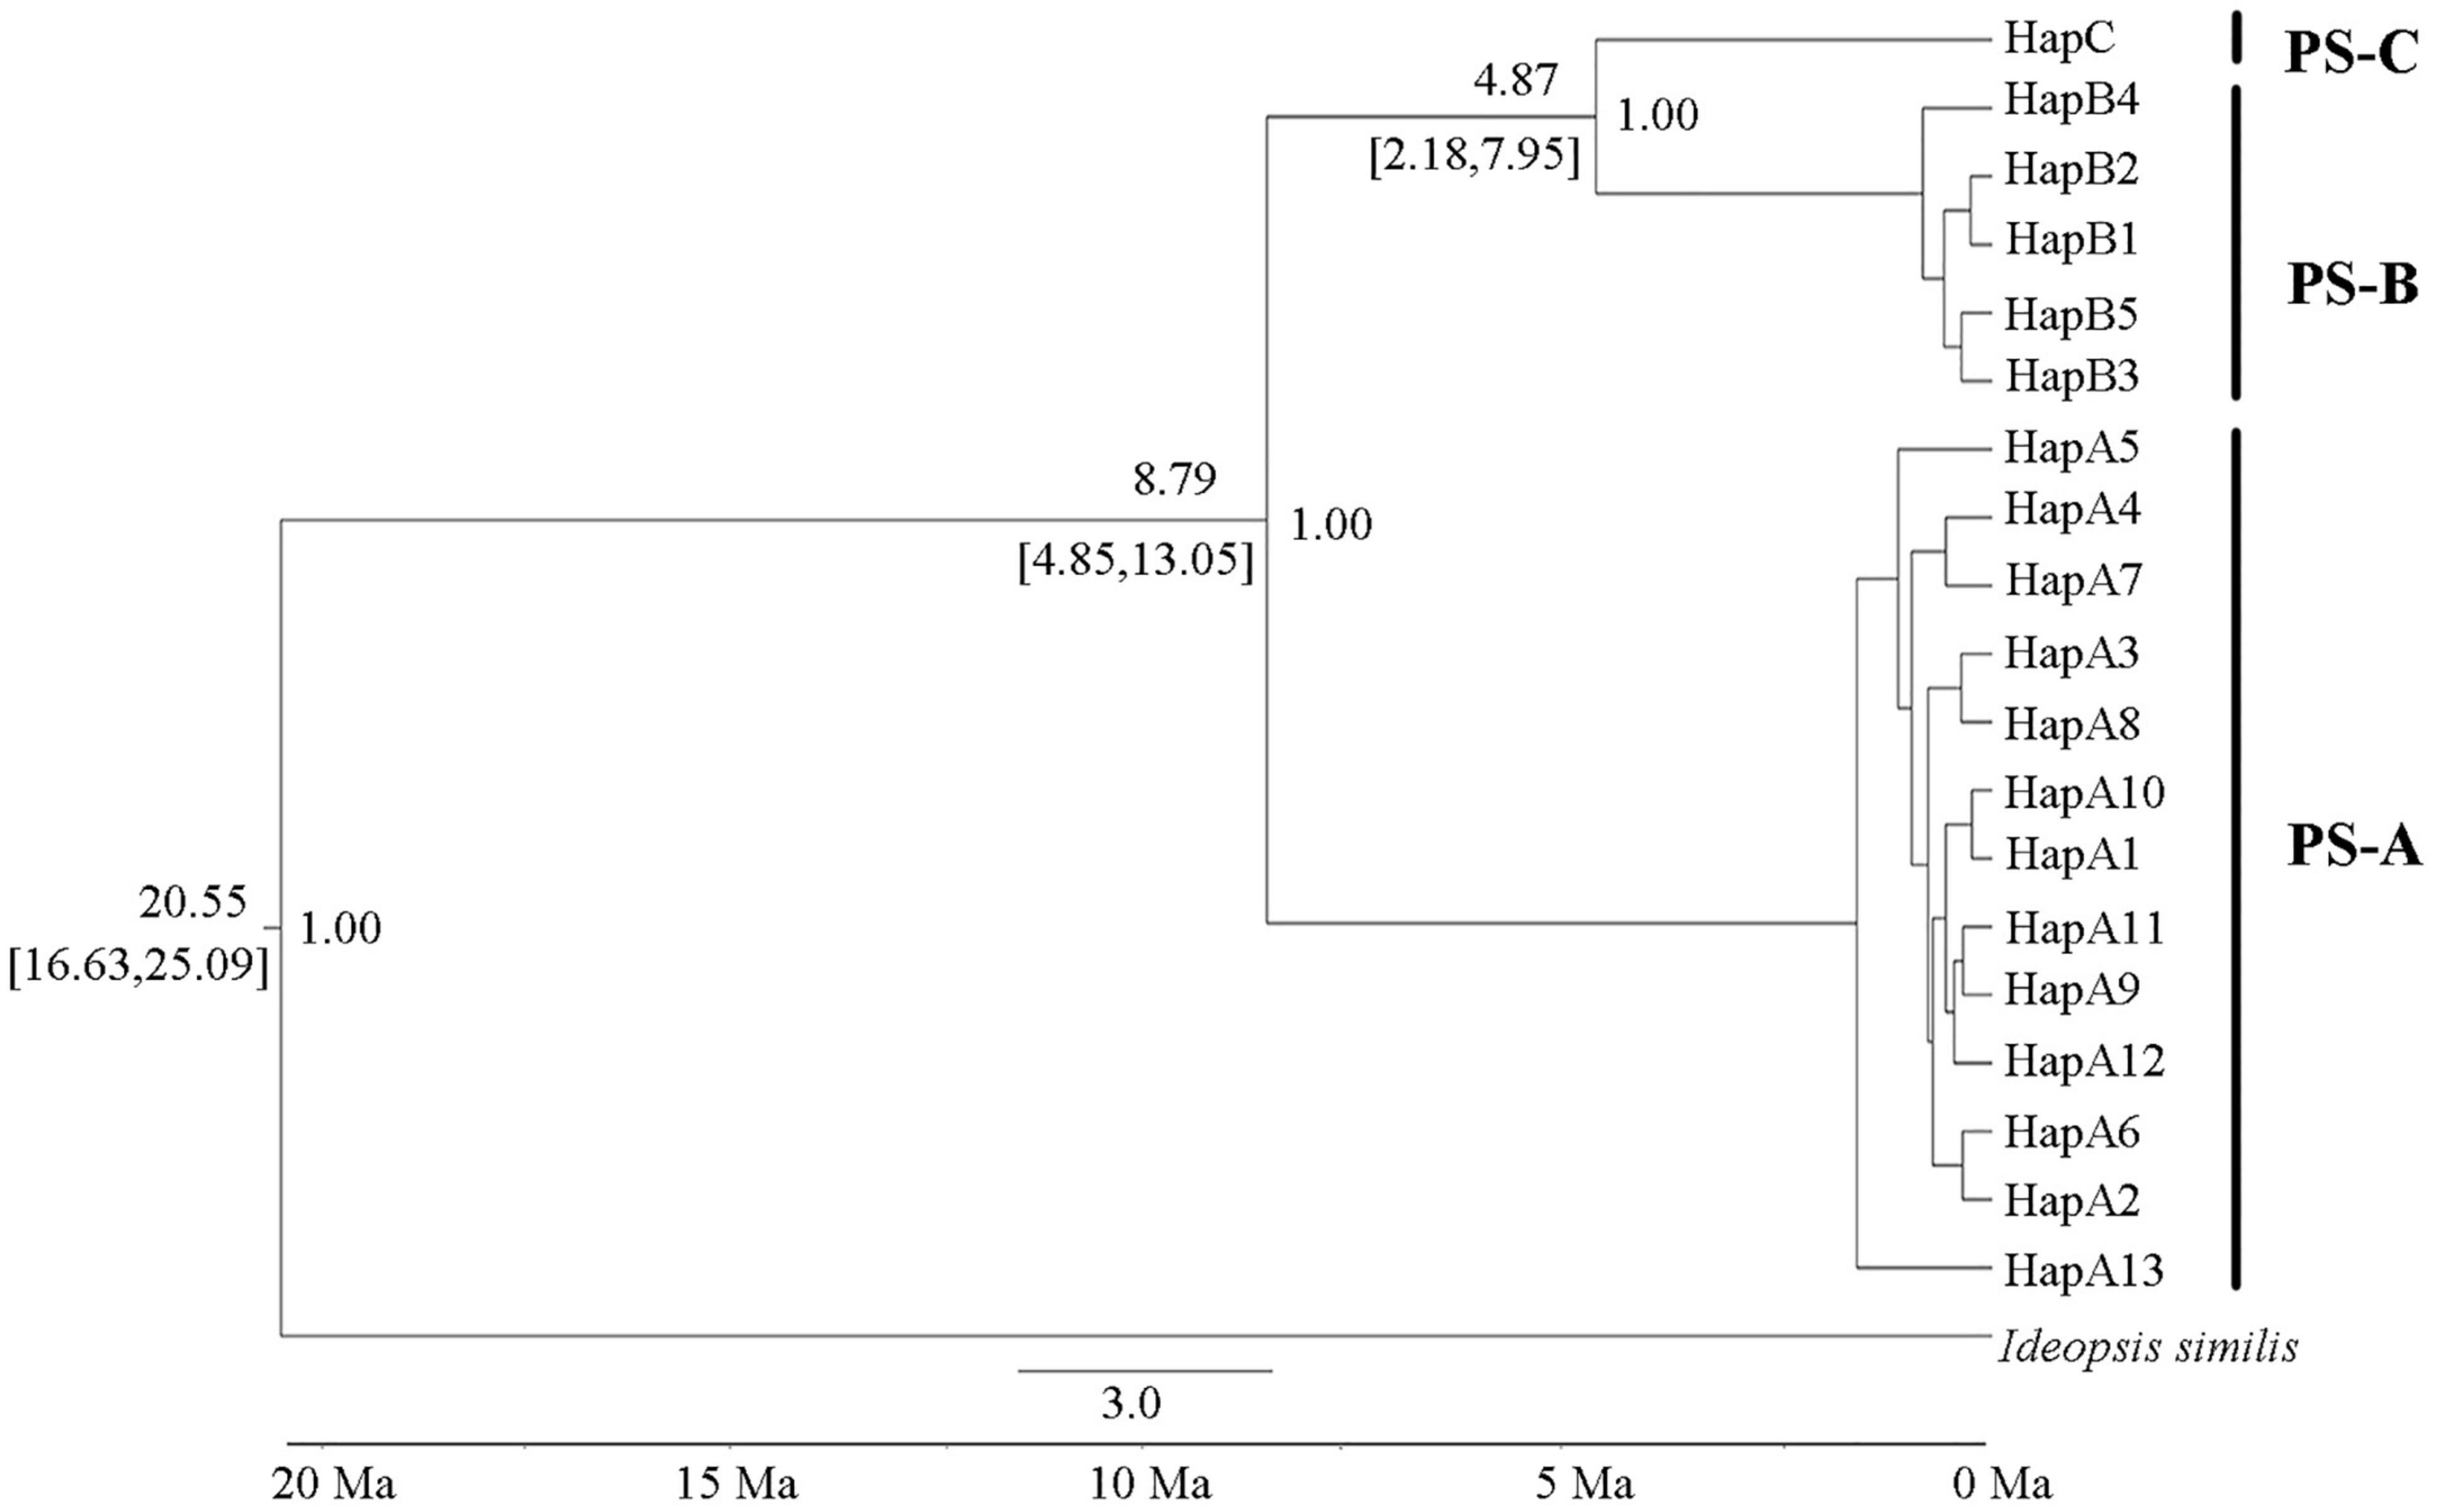
Figure 6. Divergence time estimates of the three Parantica sita lineages (PS-A, PS-B, and PS-C). The number above a branch at the left of a node is the divergence time, and that below the branch is its 95% confidence interval. The number to the right of a node is the posterior probability. Ma: million years ago.
Genetic Differentiations Within Lineages
For PS-A, the AMOVA result based on COI data indicated that the main genetic variation was 96.4% within populations (Table 2). A similar result was obtained based with microsatellite data (99.7% within populations, Table 2). Mantel test results detected no isolation by distance in the PS-A populations (Figure 7). Also, spatial autocorrelation traces were always within the 95% confidence limits, indicating no spatial autocorrelation among all PS-A populations (Figure 8).
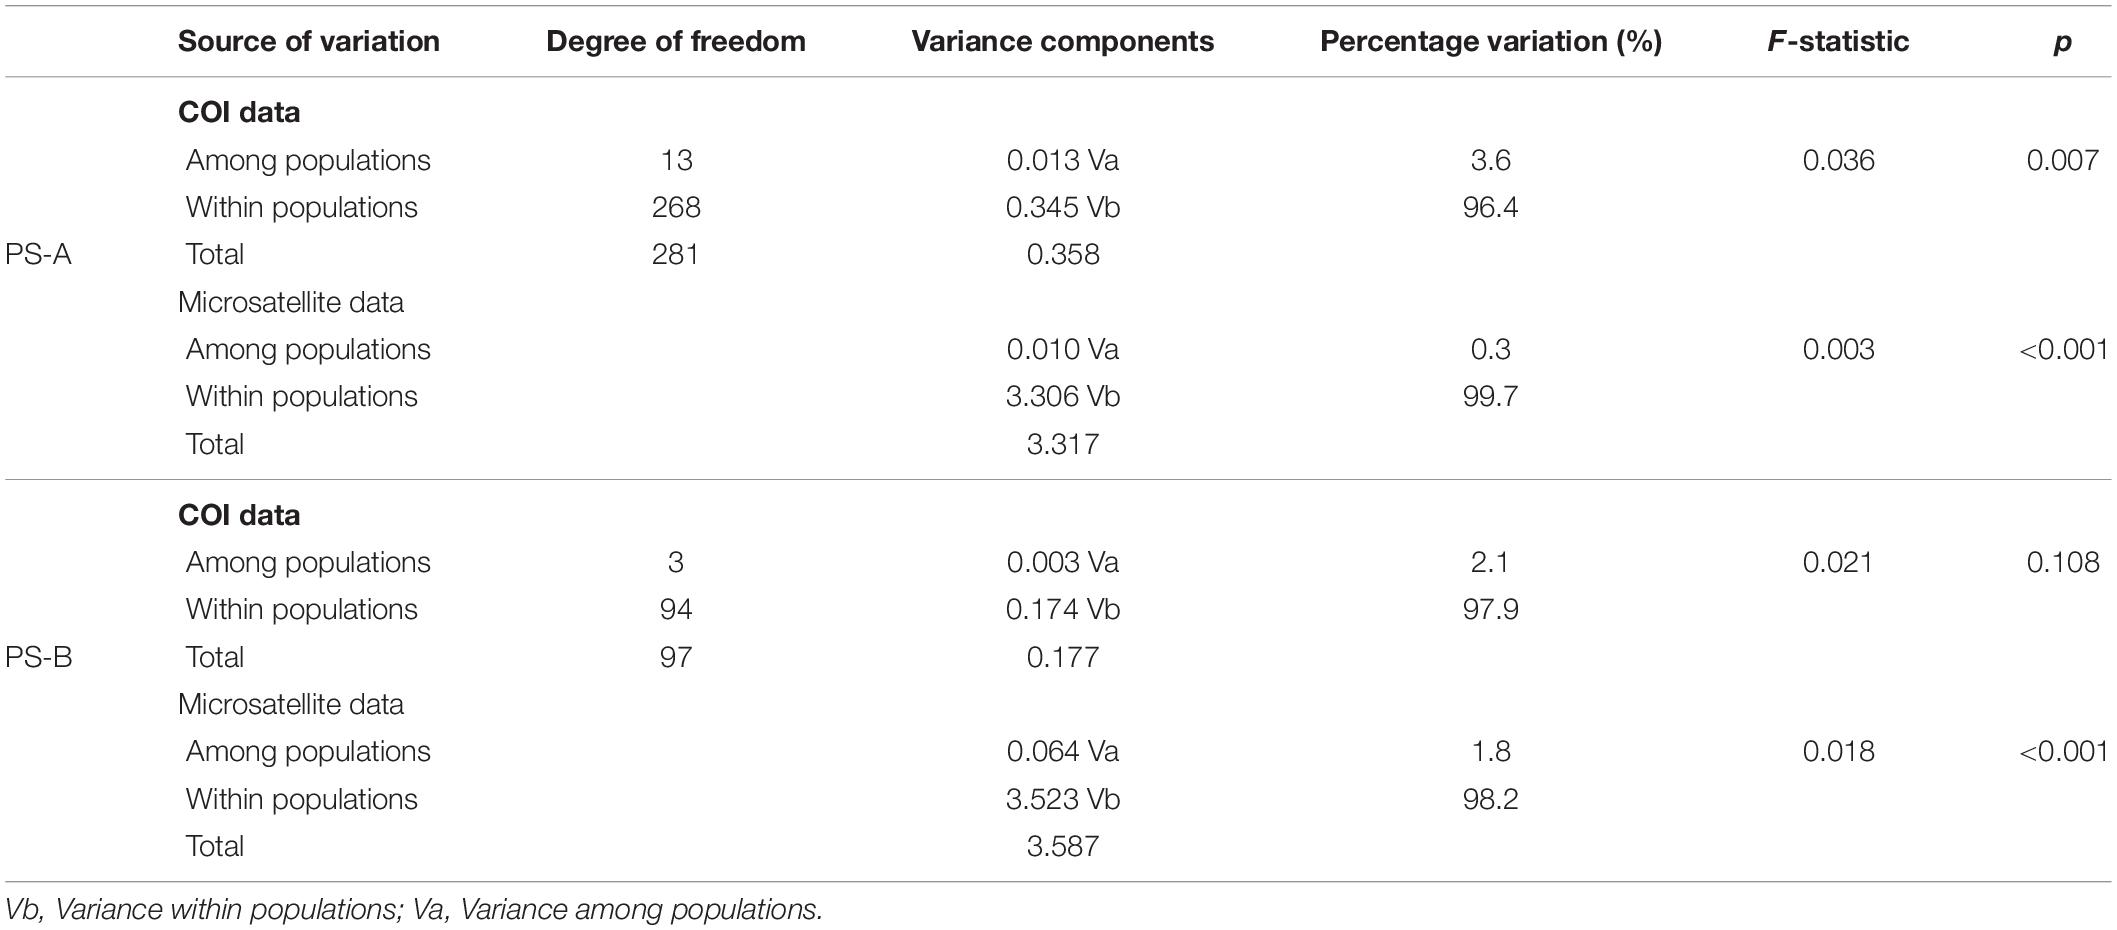
Table 2. AMOVA results based on mtDNA cytochrome oxidase subunit I (COI) and microsatellite data from two Parantica sita lineages: PS-A and PS-B.
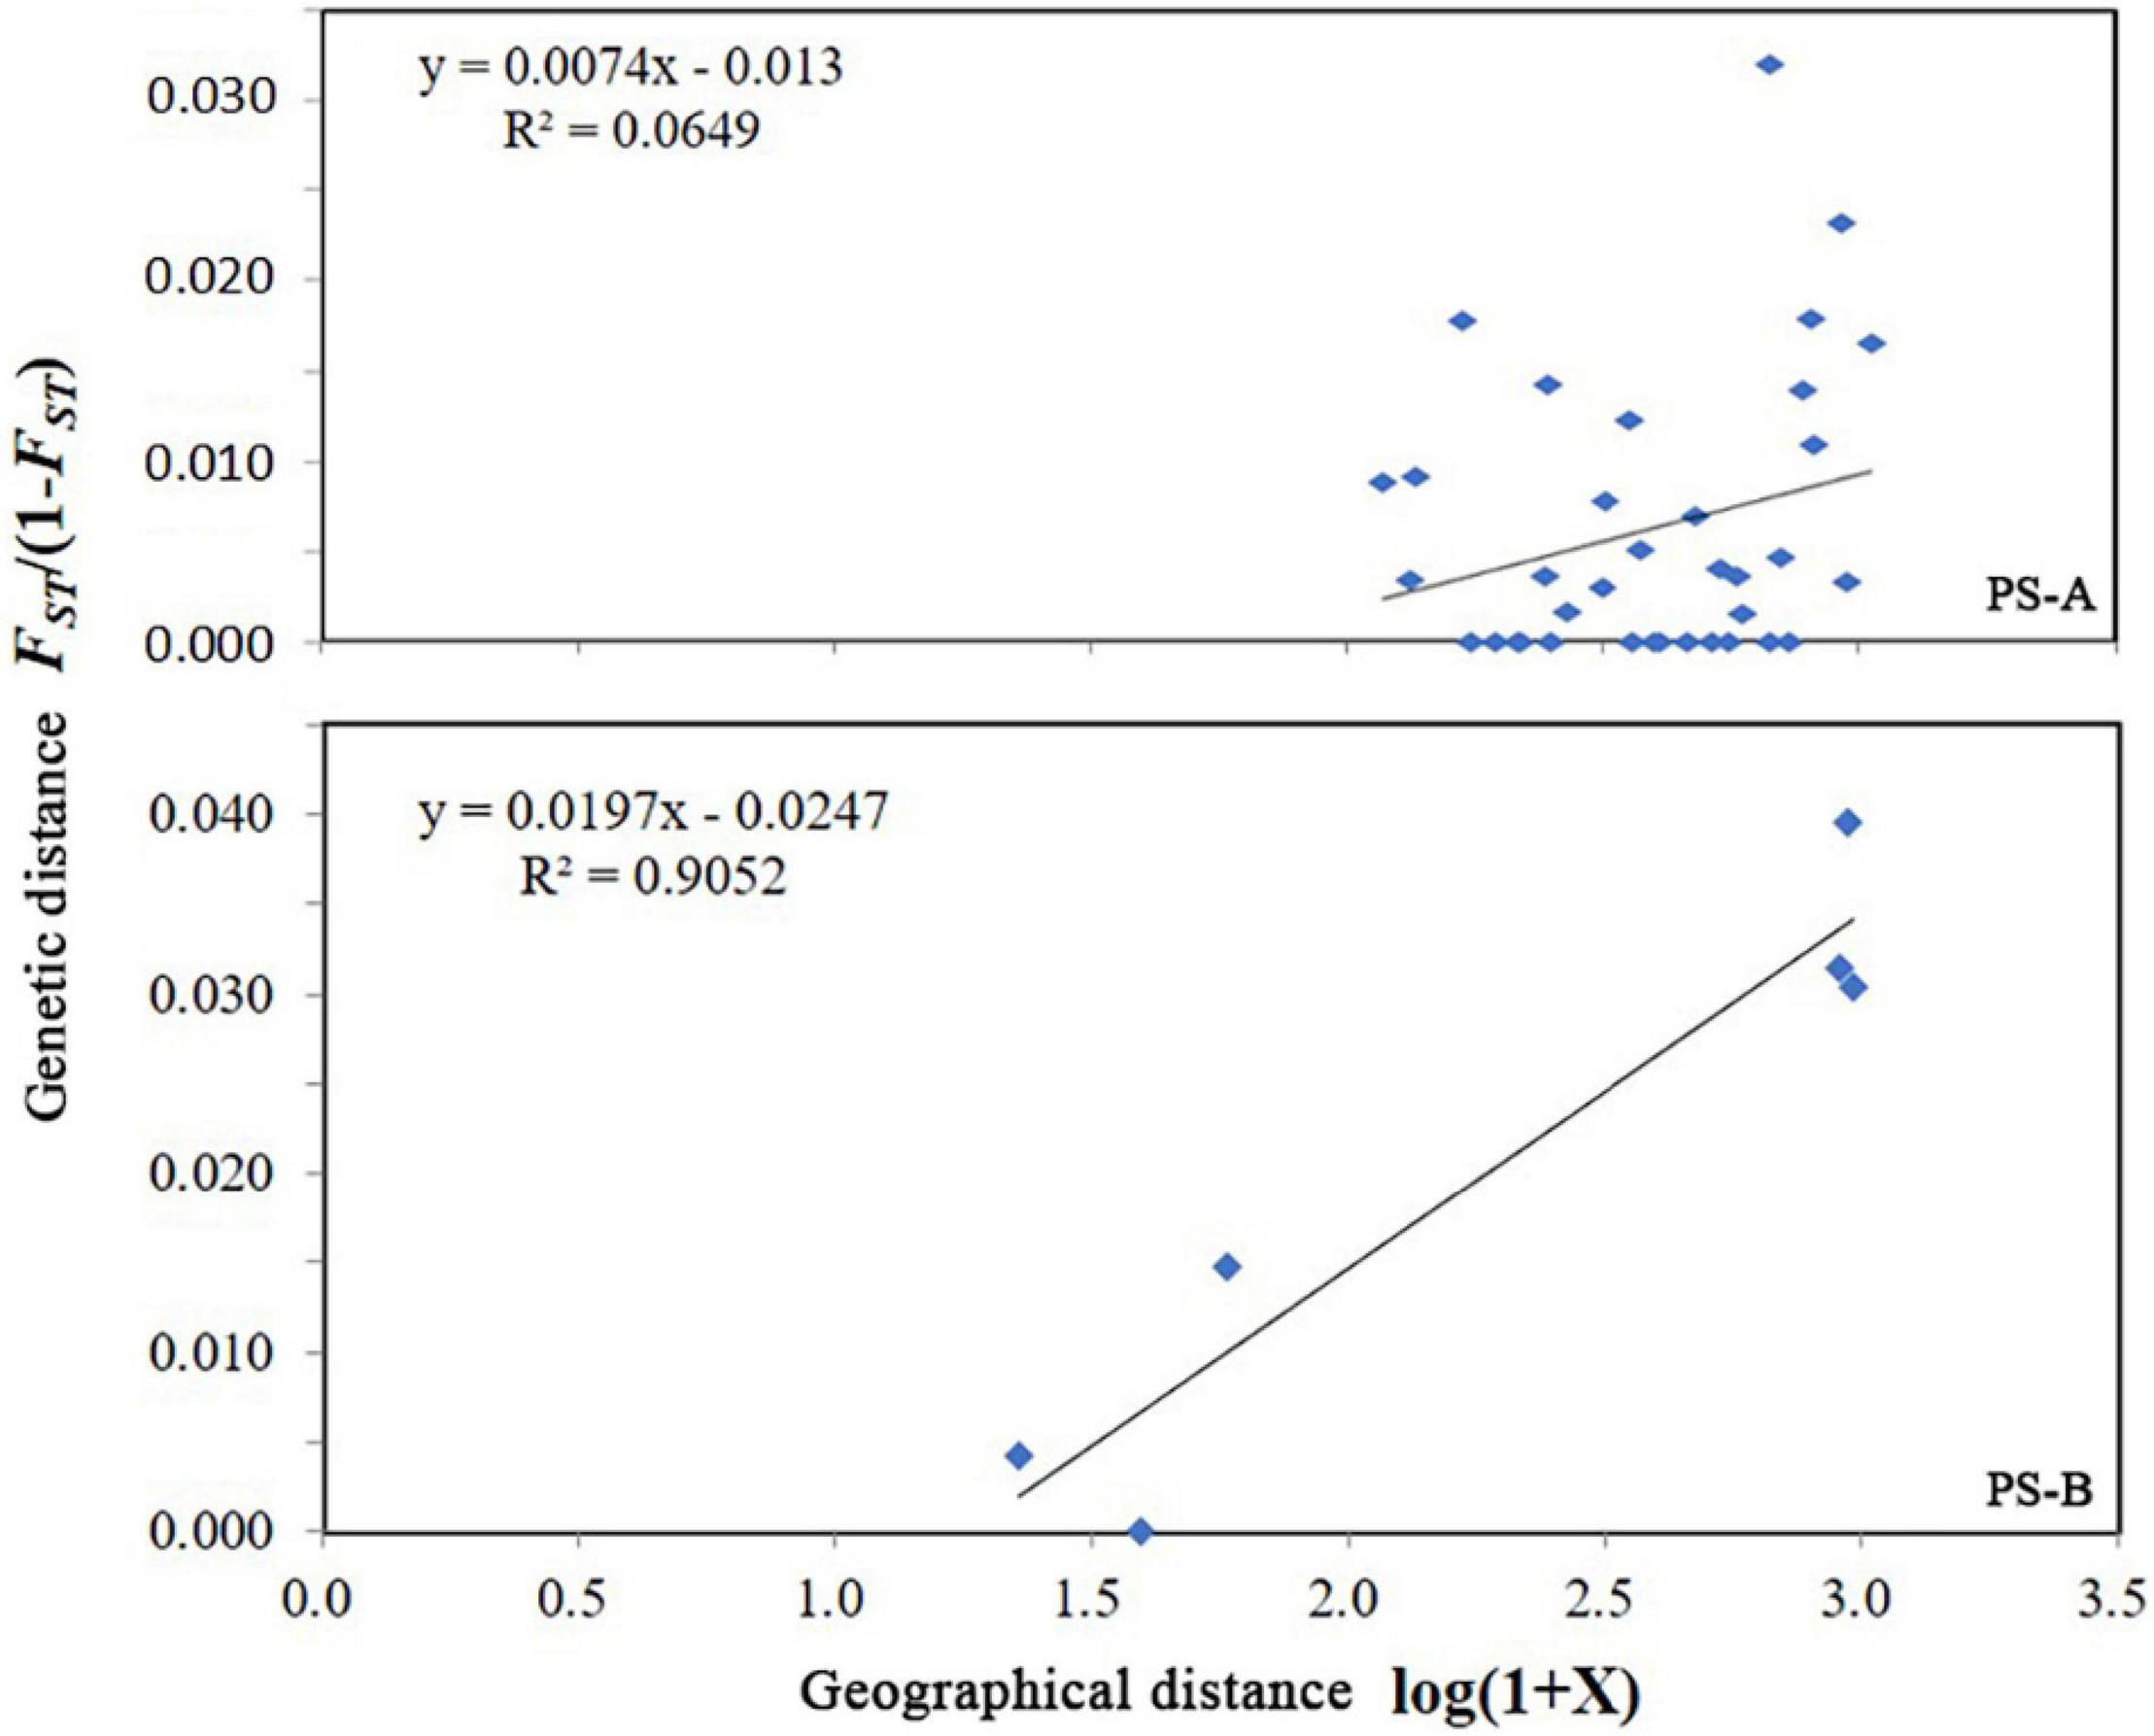
Figure 7. Results of Mantel tests of genetic distance vs. geographical distance of the populations of Parantica sita lineages: PS-A and PS-B.
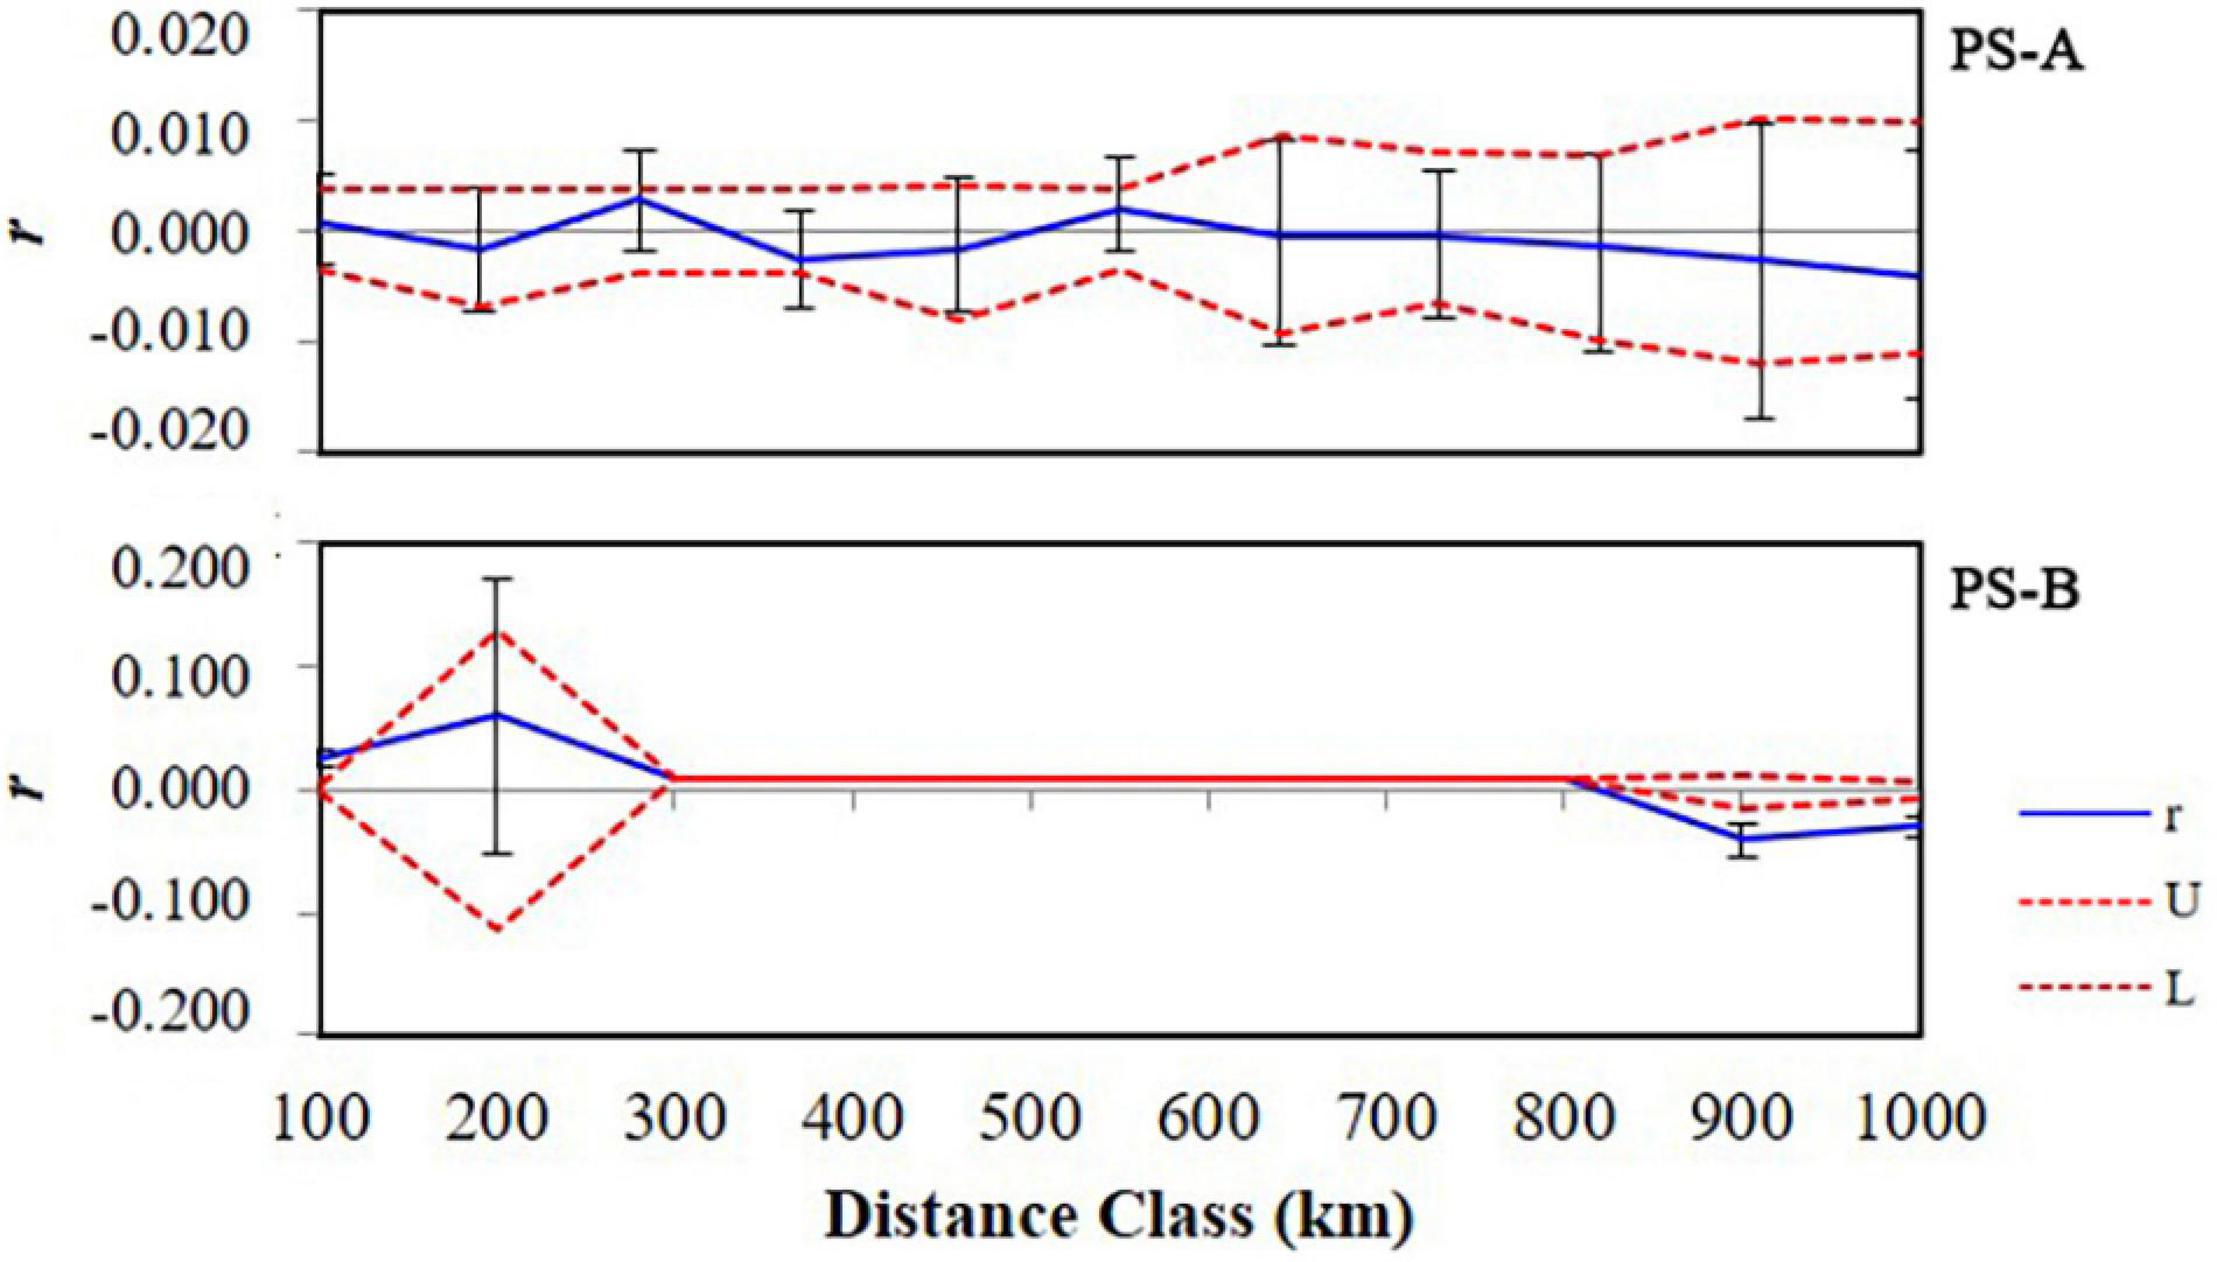
Figure 8. Results of spatial autocorrelation analysis of the PS-A and PS-B Parantica sita clades. The blue line indicates the trend of spatial autocorrelation coefficient r, the red dotted lines indicate the 95% confidence interval boundaries (U, upper boundary; L, lower boundary).
For PS-B, the AMOVA result based on COI data showed that the genetic variation occurred mainly within populations (97.9%, Table 2) and the AMOVA based on microsatellite data showed a similar result (98.2% within populations, Table 2). The Mantel test revealed correlated genetic and geographical distances in PS-B populations (Figure 7). When the geographical distance between populations was within 0–120 km and greater than 800 km, spatial autocorrelation traces were outside the 95% confidence limits (Figure 8), thus indicating that there was spatial autocorrelation between PS-B populations in western Sichuan and Tibet.
Discussion
Differentiation of P. sita
In previous studies, we found substantial genetic divergence among three types of mitogenomes in P. sita (Wu et al., 2014; Hu and Wang, 2019; Zhang et al., 2022). In this study, the large number of samples we collected across the P. sita distribution range in China allowed us to investigate mitochondrial COI haplotypes, and the three resulting haplotype groups we detected in those samples (Figure 1A) were consistent with the findings from those previous studies. The genetic divergences among the three groups are even greater than that between two sibling species, P. melaneus and P. swinhoei (Figure 1A). Because great genetic divergences in mitochondrial sequences can be found within insect species (Borchers and Marcus, 2014), we also analyzed the microsatellite genotypes of our samples. Those results showed that the samples once again divided into three clusters (Figure 2), each corresponding to mitochondrial haplotype groups. Importantly, the mitochondrial and nuclear data of the 12 genetically/geographically mismatched individuals were consistent, indicating no hybridization between individuals from the different cluster/haplotype groups. Therefore, we conclude that in China there are three P. sita lineages (i.e., PS-A, PS-B, and PS-C) that are substantially genetically diverged from one another. There are already two P. sita subspecies reported in China, P. s. sita in southwestern China and P. s. niphonica on Taiwan Island (Chou, 1994). Altogether and based on the sampling regions, we conclude that PS-C is P. s. niphonica and there are two lineages in P. s. sita.
Combining molecular data and morphological features can provide more powerful taxonomic evidence than either type of data alone (Caesar et al., 2006; Warren et al., 2009; Hu et al., 2018). Genitalia structures are important diagnostic characters in insect taxonomy, and those structures differed greatly among PS-A, PS-B, and PS-C (Figure 4). Therefore, based on both molecular divergence and genitalia differences, we can justifiably conclude that PS-A, PS-B, and PS-C lineages are actually three species. According to the published structures of male P. sita genitalia (Lang, 2012), PS-A’s male genitalia is identical to that of P. s. sita. The distribution range of PS-A is almost the same as that of P. s. sita, further supporting that PS-A is P. s. sita. However, the male genitalia of PS-B is identical to that of P. pedonga. P. pedonga had been classified as P. sita until Fujioka (1970) recognized it as a new species based on differences in male genitalia. According to Fujioka (1970) description, P. pedonga and P. sita appear greatly similar, except that the black patch of the male sex brand on P. pedonga’s hind wing does not extend beyond the fold in cu2 space, whereas it goes beyond Cu2 vein in P. sita (Zhang et al., 2008). Here, we found a contradictory result: The black patches of all PS-B males go beyond Cu2 vein. Fortunately, we collected a sample that had been identified as P. pedonga based on the position of its black patch. Through sequencing and microsatellite genotyping, its COI haplotype belonged to HapB, and its microsatellite genotypes were clustered in Cluster2, thus indicating that this P. pedonga individual belongs in PS-B. Therefore, we reasonably conclude that PS-B is P. pedonga, no matter the extent of the black patch. Possibly, Fujioka (1970) described only those specimens with smaller black patches as P. pedonga.
Judging from our molecular and morphological evidence (especially the genitalia characters), we tentatively propose that P. sita is actually a species complex of three species: PS-A (the former P. s. sita) should be the typical Parantica sita [Kollar, (1844)], distributed mainly in southwestern China; PS-C (the former P. s. niphonica) should be elevated to full species as Parantica niphonica (Moore, 1883), distributed in Taiwan Island and Japan; and PS-B should be recognized as Parantica pedonga Fujioka, 1970, mainly distributed in Tibet and western Sichuan. Table 3 summarizes the distinguishable characters for those three species. The wing colors and scale types of the male sex brand can be used to easily identify most specimens, but not all. However, the significant differences in both genitalia structures and COI sequences among these three species may be used for effective species identification.
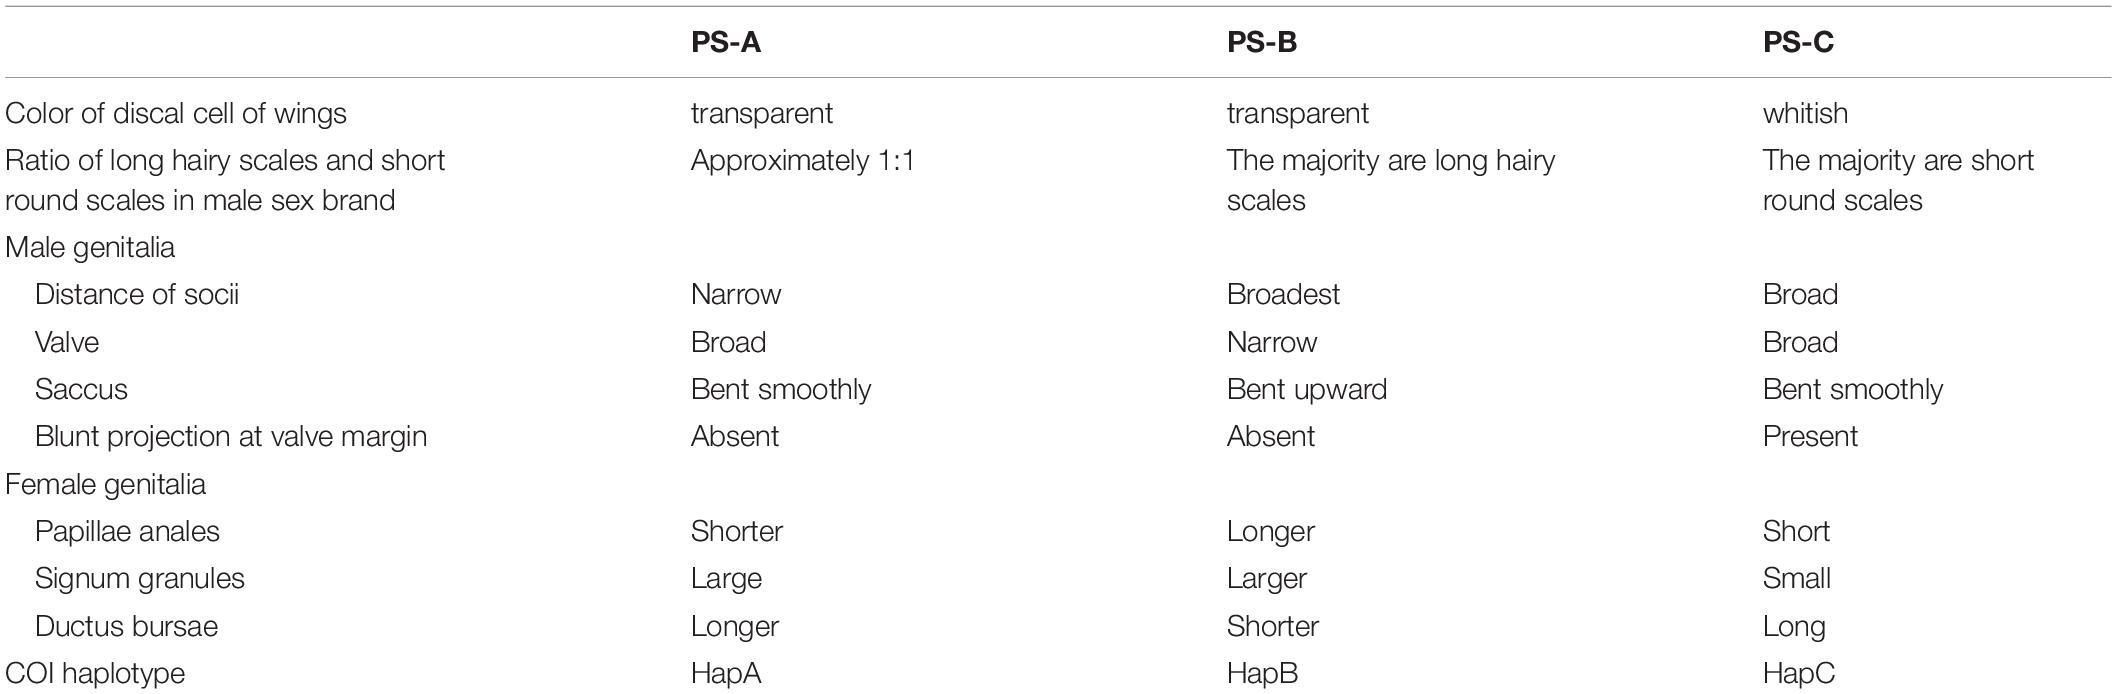
Table 3. Summary of the distinguishing characters for the Parantica sita lineages: PS-A, PS-B, and PS-C.
Evolutionary History and Related Geological Events
Both PS-A and PS-B are distributed in southwestern China with PS-A mainly in Yunnan, Guizhou, Chongqing, and northern Sichuan, and PS-B in Tibet and western Sichuan (Figure 1B). The Hengduan Mountains extend north to south through this region, and the PS-A distribution range covers the eastern side of the Mountains and Tibet to the west. PS-A’s separation from PS-B + PS-C at about 8.79 Ma (Figure 6) correlates highly with the appreciable increase in the Hengduan Mountains’ elevation about 8 (±3) Ma (Molnar et al., 1993; Mulch and Chamberlain, 2006). Based on our gene flow analysis results, PS-A is the ancestor of P. sita because asymmetric gene flow always occurs from ancestral to daughter populations/species (Cheng et al., 2019; Figure 5). Also, more haplotypes in PS-A than PS-B support PS-A as the ancestor. As the Hengduan Mountains rose, the Tibet population was completely isolated from the others and consequent speciation occurred. The PS-B populations in western Sichuan may have originated from a recent dispersal of the Tibet population across the Hengduan Mountains. We also found some PS-B individuals in the valleys of the Hengduan Mountains. Higher mountains in this region may impede gene flow among geographical populations, so there is isolation by distance in the PS-B populations (Figure 7). Similarly, those individuals with “mismatched” distribution ranges likely originated from a recent dispersal.
The PS-B and PS-C lineages separated about 4.87 Ma, soon after the formation of Taiwan Island and concomitant formation of mountains on the Island. The formation resulted from the collision of the Eurasian and Philippine plates about 4–5 Ma (Teng, 1990; Huang et al., 1997). After formation, Taiwan Island underwent repeated connection to and separation from Mainland China during Pleistocene glaciations (Teng, 1990; Huang et al., 1997), so the population/species in Taiwan Island appeared closely related to those in Mainland China, especially those neighboring the Taiwan Strait (Long et al., 2006; Liu et al., 2021). However, PS-C is more closely related to PS-B, the Tibet and western Sichuan populations, rather than PS-A. This implies that the PS-C ancestors did not originate from PS-A and migrate to Taiwan Island through a land bridge. That is likely possible because an extensive plain in eastern China effectively separates the southwestern China populations from Taiwan Island because P. sita tends to occur in areas with 1,000–3,000 m elevations (Lu et al., 2020). The potential migration shortcut for the PS-C ancestors may have been southward from Tibet into the Indo-China Peninsula, and then eastward into Taiwan Island. However, since three subspecies (i.e., P. s. ethologa, P. s. oblita, and P. s. melanosticta) live in the Indo-China Peninsula, Malaysia, and the Philippines, PS-C may have originated from one of those subspecies instead of from PS-B. To clarify PS-C’s evolutionary history, those three subspecies must be included in a future investigation; and since P. luzonensis was mixed into P. sita clades in a phylogenetic analysis (Zhang et al., 2022), it should be included as well.
Whatever the ancestors of PS-C are, it most likely arose from a small number of colonizers, thus leading to a founder effect, which explains the lower genetic diversity of PS-C on Taiwan Island than for the mainland species. On the other hand, PS-C’s (P. s. niphonica) seasonal, annual migration between Japan and Taiwan Island (Kanazawa et al., 2012; Cheng et al., 2015) likely causes high mortality that could undermine both effective population size and, consequently, high genetic diversity.
Notably, although they diverged about 8.79 Ma, PS-A and PS-B appear morphologically similar, whereas the appearances of PS-C are distinguishable from them. Possibly, because both PS-A and PS-B live in mountainous regions, they may have been under similar selection pressures that resulted in similar appearances as the two lineages adapted to similar ecological conditions. However, PS-C lives in oceanic islands and not mainland mountains, so it had to adapt to different selective pressures that likely resulted in an appearance different from its mainland congeners. To explore these hypotheses, a future study should thoroughly investigate the genes that are under natural selection in the P. sita genome. Genomics analysis is also needed to clarify the evolutionary history of the genus Parantica.
Data Availability Statement
The datasets presented in this study can be found in online repositories. The names of the repository/repositories and accession number(s) can be found below: Microsatellite sequences, https://www.ncbi.nlm.nih.gov/genbank/, MK838447-838459 and MT009235-009237; COI sequences, https://www.ncbi.nlm.nih.gov/genbank/, OM200014-200032.
Author Contributions
RW: study designing and manuscript writing. PH and LL: sample collection, molecular analysis, morphology analysis, and writing manuscript. SH and HZ: sample collection and morphology analysis. WD, C-LH, DW, YZ, and YX: sample collection. All authors contributed to the article and approved the submitted version.
Funding
This work was supported by the biodiversity conservation program of the Ministry of Ecology and Environment, China (China BON-Butterflies, No. SDZXWJZ012016038) and the Second Tibetan Plateau Scientific Expedition and Research (STEP) program (Grant No. 2019QZKK05010603).
Conflict of Interest
The authors declare that the research was conducted in the absence of any commercial or financial relationships that could be construed as a potential conflict of interest.
Publisher’s Note
All claims expressed in this article are solely those of the authors and do not necessarily represent those of their affiliated organizations, or those of the publisher, the editors and the reviewers. Any product that may be evaluated in this article, or claim that may be made by its manufacturer, is not guaranteed or endorsed by the publisher.
Acknowledgments
We thank Ran Ma and Yuping Meng from Peking University and Liangyu Yang from Capital Normal University for help with laboratory work. We also thank Wei Zhang from Peking University for suggestions on the whole study, and Xueyan Li from Kunming Institute of Zoology, Chinese Academy of Sciences for manuscript revision. Sample collection was supported by Du Feng from Jilin Agricultural University; Fei Xiong from Leshan, Sichuan Province; Zhiwei Dong and Zhou Chang from Kunming Institute of Zoology, Chinese Academy of Sciences; Pingfan Jia from the Southwest Forestry University; Jichun Xing from Guizhou University; Jiang Hou from Chongqing Museum; and Liang Dou from Sichuan University. We appreciate their help.
Supplementary Material
The Supplementary Material for this article can be found online at: https://www.frontiersin.org/articles/10.3389/fevo.2022.846499/full#supplementary-material
Footnotes
References
Beerli, P., and Felsenstein, J. (2001). Maximum likelihood estimation of a migration matrix and effective population sizes in n subpopulations by using a coalescent approach. P. Natl. Acad. Sci. U. S. A. 98, 4563–4568. doi: 10.1073/pnas.081068098
Borchers, T. E., and Marcus, J. M. (2014). Genetic population structure of buckeye butterflies (Junonia) from Argentina. Syst. Entomol. 39, 242–255. doi: 10.1111/syen.12053
Caesar, R. M., Sörensson, M., and Cognato, A. I. (2006). Integrating DNA data and traditional taxonomy to streamline biodiversity assessment: an example from edaphic beetles in the Klamath ecoregion, California, USA. Divers. Distrib. 12, 483–489. doi: 10.1111/j.1366-9516.2006.00237.x
Chazot, N., Wahlberg, N., Lucci Freitas, A. V., Mitter, C., Sohn, J. C., Sahoo, R. K., et al. (2019). Priors and posteriors in Bayesian timing of divergence analyses: the age of butterflies revisited. Syst. Biol. 68, 797–813. doi: 10.1093/sysbio/syz002
Chen, C., Durand, E., Forbes, F., and François, O. (2007). Bayesian clustering algorithms ascertaining spatial population structure: a new computer program and a comparison study. Mol. Ecol. Notes 7, 747–756. doi: 10.1111/j.1471-8286.2007.01769.x
Cheng, R., Jiang, N., Xue, D. Y., and Han, H. X. (2019). Species reassessment congruent with the phylogeographical study of the Biston falcata species group. Syst. Entomol. 44, 886–898. doi: 10.1111/syen.12362
Cheng, R., Jiang, N., Yang, X., Xue, D., Liu, S., and Han, H. (2016). The influence of geological movements on the population differentiation of Biston panterinaria (Lepidoptera: Geometridae). J. Biogeogr. 43, 691–702. doi: 10.1111/jbi.12676
Cheng, W. W., Pun, H. S., Chung, O., Fukumura, T., and Kanazawa, I. (2015). Parantica sita niphonica (Lepidoptera: Nymphalidae) migrated from Japan to Hong Kong, southern China in 2013. Bull. Osaka Mus. Nat. Hist. 69, 25–28.
Chou, I. (1994). Monographia Rhopalocerorum Sinensium (Monograph of Chinese Butterflies). Zhengzhou: Henan Scientific and Technological Publishing House, 1.
Drummond, A. J., and Rambaut, A. (2007). BEAST: Bayesian evolutionary analysis by sampling trees. BMC Evol. Biol. 7:214. doi: 10.1186/1471-2148-7-214
Excoffier, L., and Lischer, H. E. L. (2010). Arlequin suite ver 3.5: a new series of programs to perform population genetics analyses under Linux and Windows. Mol. Ecol. Resour. 10, 564–567. doi: 10.1111/j.1755-0998.2010.02847.x
Folmer, O., Black, M., Hoeh, W., Lutz, R., and Vrijenhoek, R. (1994). DNA primers for amplification of mitochondrial cytochrome c oxidase subunit I from diverse metazoan invertebrates. Mol. Mar. Biol. Biotechnol. 3, 294–299.
Fujioka, T. (1970). Butterflies colleccted by the lepidopterological research expedition to Nepel Himalayan, 1963. Part I Papilionoidea. Spec. Bull. Lep. Soc. Jap. 4, 1–125.
Hebert, P. D. N., Cywinska, A., Ball, S. L., and DeWaard, J. R. (2003). Biological identifications through DNA barcodes. Proc. R. Soc. B-Biol. Sci. 270, 313–321. doi: 10.1098/rspb.2002.2218
Hewitt, G. (2000). The genetic legacy of the Quaternary ice ages. Nature 405, 907–913. doi: 10.1038/35016000
Howes, B. J., Lindsay, B., and Lougheed, S. C. (2006). Range-wide phylogeography of a temperate lizard, the five-lined skink (Eumeces fasciatus). Mol. Phylogenet. Evol. 40, 183–194. doi: 10.1016/j.ympev.2006.03.008
Hu, P., Huang, C. L., Luo, M. X., Hsu, Y. F., and Wang, R. J. (2020). Development and characterization of novel microsatellite markers in chestnut tiger butterfly Parantica sita (Lepidoptera: Nymphalidae) using next-generation sequencing. Appl. Entomol. Zool. 55, 281–286. doi: 10.1007/s13355-020-00675-w
Hu, P., and Wang, R. J. (2019). The complete mitochondrial genome of Parantica sita sita (Lepidoptera: Nymphalidae: Danainae) revealing substantial genetic divergence from its sibling subspecies P. s. niphonica. Gene 686, 76–84. doi: 10.1016/j.gene.2018.10.088
Hu, S. J., Cotton, A. M., Condamine, F. L., Duan, K., Wang, R. J., Hsu, Y. F., et al. (2018). Revision of Pazala Moore, 1888: the Graphium (Pazala) mandarinus (Oberthür, 1879) group, with treatments of known taxa and descriptions of new species and new subspecies (Lepidoptera: Papilionidae). Zootaxa 4441, 401–446. doi: 10.11646/zootaxa.4441.3.1
Huang, C. Y., Wu, W. Y., Chang, C. P., Tsao, S., Yuan, P. B., Lin, C. W., et al. (1997). Tectonic evolution of accretionary prism in the arc-continent collision terrane of Taiwan. Tectonophysics 281, 31–51. doi: 10.1016/S0040-1951(97)00157-1
Jombart, T., Devillard, S., and Balloux, F. (2010). Discriminant analysis of principal components: a new method for the analysis of genetically structured populations. BMC Genet. 11:94. doi: 10.1186/1471-2156-11-94
Kalinowski, S. T. (2005). HP-RARE 1.0: a computer program for performing rarefaction on measures of allelic richness. Mol. Ecol. Notes 5, 187–189. doi: 10.1111/j.1471-8286.2004.00845.x
Kalinowski, S. T., Taper, M. L., and Marshall, T. C. (2007). Revising how the computer program CERVUS accommodates genotyping error increases success in paternity assignment. Mol. Ecol. 16, 1099–1106. doi: 10.1111/j.1365-294X.2007.03089.x
Kanazawa, I., Chen, C., and Hiyoshi, Y. (2012). A chestnut tiger, Parantica sita niphonica (Nymphalidae: Danainae), marked in Japan and recaptured in China in 2006. News Lepidopterists’. Soc. 54, 38–39.
Kozak, K. H., Blaine, R. A., and Larson, A. (2006). Gene lineages and eastern North American palaeodrainage basins: phylogeography and speciation in salamanders of the Eurycea bislineata species complex. Mol. Ecol. 15, 191–207. doi: 10.1111/j.1365-294X.2005.02757.x
Lang, S. Y. (2012). The Nymphalidae of China (Lepidoptera, Rhopalocear), Part I. Pardubice: Tshikolovets Publications.
Ledevin, R., Chevret, P., Helvaci, Z., Michaux, J. R., and Renaud, S. (2018). Bank voles in Southern Eurasia: vicariance and adaptation. J. Mamm. Evol. 25, 119–129. doi: 10.1007/s10914-016-9368-3
Lei, F., Qu, Y., and Song, G. (2014). Species diversification and phylogeographical patterns of birds in response to the uplift of the Qinghai-Tibet Plateau and Quaternary glaciations. Curr. Zool. 60, 149–161. doi: 10.1093/czoolo/60.2.149
Leigh, J. W., and Bryant, D. (2015). POPART: full-feature software for haplotype network construction. Methods Ecol. Evol. 6, 1110–1116. doi: 10.1111/2041-210X.12410
Liu, H. X., Liang, J. Y., Zhou, J. Y., Wang, S. J., and Bu, W. J. (2021). Vicariance and ecological adaptation drive genetic and morphological diversification of a widely distributed bug, Carbula crassiventris (Insecta: Hemiptera: Pentatomidae), in South China. Ecol. Entomol. 46, 368–382. doi: 10.1111/een.12978
Liu, Y. X., Dietrich, C. H., and Wei, C. (2019). Genetic divergence, population differentiation and phylogeography of the cicada Subpsaltria yangi based on molecular and acoustic data: an example of the early stage of speciation? BMC Evol. Biol. 19:5. doi: 10.1186/s12862-018-1317-8
Long, Y., Wan, H., Yan, F. M., Xu, C. R., Lei, G. C., Li, S. W., et al. (2006). Glacial effects on sequence divergence of mitochondrial COII of Polyura eudamippus (Lepidoptera: Nymphalidae) in China. Biochem. Genet. 44, 359–375. doi: 10.1007/s10528-006-9035-0
Lu, L. Z., Hu, P., Zhang, Y. F., Zhang, H. H., Wang, D., Hu, S. J., et al. (2020). Projecting the distribution range of the chestnut tiger butterfly Parantica sita sita (Lepidoptera: Nymphalidae: Danainae) in southwestern China. Appl. Entomol. Zool. 55, 413–421. doi: 10.1007/s13355-020-00699-2
Miao, Y. F., Herrmann, M., Wu, F. L., Yan, X. L., and Yang, S. L. (2012). What controlled Mid-Late Miocene long-term aridification in Central Asia? – Global cooling or Tibetan Plateau uplift: a review. Earth-Science Reviews 112, 155–172.
Molnar, P., England, P., and Martinod, J. (1993). Mantle dynamics, uplift of the tibetan plateau, and the indian monsoon. Rev. Geophys. 31, 357–396. doi: 10.1029/93RG02030
Mulch, A., and Chamberlain, C. P. (2006). The rise and growth of Tibet. Nature 439, 670–671. doi: 10.1038/439670a
Myers, N., Mittermeier, R. A., Mittermeier, C. G., da Fonseca, G. A. B., and Kent, J. (2000). Biodiversity hotspots for conservation priorities. Nature 403, 853–858. doi: 10.1038/35002501
Nielson, M., Lohman, K., and Sullivan, J. (2001). Phylogeography of the tailed frog (Ascaphus truei): Implications for the biogeography of the Pacific Northwest. Evolution 55, 147–160. doi: 10.1111/j.0014-3820.2001.tb01280.x
Niu, Y. T., Ye, J. F., Zhang, J. L., Wan, J. Z., Yang, T., Wei, X. X., et al. (2018). Long-distance dispersal or postglacial contraction? Insights into disjunction between Himalaya-Hengduan Mountains and Taiwan in a cold-adapted herbaceous genus, Triplostegia. Ecol. Evol. 8, 1131–1146. doi: 10.1002/ece3.3719
Peakall, R., and Smouse, P. E. (2012). GenAlEx 6.5: genetic analysis in Excel. Population genetic software for teaching and research–an update. Bioinformatics 28, 2537–2539. doi: 10.1093/bioinformatics/bts460
Pritchard, J. K., Stephens, M., and Donnelly, P. (2000). Inference of population structure using multilocus genotype data. Genetics 155, 945–959. doi: 10.1093/genetics/155.2.945
Purvis, A., and Hector, A. (2000). Getting the measure of biodiversity. Nature 405, 212–219. doi: 10.1038/35012221
Tamura, K., Stecher, G., Peterson, D., Filipski, A., and Kumar, S. (2013). MEGA6: molecular evolutionary genetics analysis version 6.0. Mol. Biol. Evol. 30, 2725–2729. doi: 10.1093/molbev/mst197
Tang, H., Micheels, A., Eronen, J. T., Ahrens, B., and Fortelius, M. (2013). Asynchronous responses of East Asian and Indian summer monsoons to mountain uplift shown by regional climate modelling experiments. Clim. Dynam. 40, 1531–1549. doi: 10.1007/s00382-012-1603-x
Teng, L. S. (1990). Geotectonic evolution of a late Cenozoic arc-continent collision inTaiwan. Tectonophysics 183, 57–76. doi: 10.1016/0040-1951(90)90188-E
Warren, A. D., Ogawa, J. R., and Brower, A. V. Z. (2009). Revised classification of the family Hesperiidae (Lepidoptera: Hesperioidea) based on combined molecular and morphological data. Syst. Entomol. 34, 467–523. doi: 10.1111/j.1365-3113.2008.00463.x
Wu, L. W., Lin, L. H., Lees, D. C., and Hsu, Y. F. (2014). Mitogenomic sequences effectively recover relationships within brush-footed butterflies (Lepidoptera: Nymphalidae). BMC Genomics 15:468. doi: 10.1186/1471-2164-15-468
Yao, Y. H., Zhang, B. P., Han, F., and Pang, Y. (2010). Spatial pattern and exposure effect of altitudinal belts in the Hengduan Mountains. J. Mountain Science 28, 11–20.
Yeh, F. C., and Boyle, T. J. B. (1997). Population genetic analysis of co-dominant and dominant markers and quantitative traits. Belgian J. Bot. 129, 157.
Zhang, D. Z., Ding, G., Ge, B. M., Zhang, H. B., and Tang, B. P. (2015). Molecular dating of a marine species, Eriocheir japonica (Decapoda: Grapsidae), corroborates cenozoic tectonic events and sea level fluctuation. Biochem. Syst. Ecol. 63, 45–50. doi: 10.1016/j.bse.2015.09.023
Zhang, Y. F., Lu, L. Z., Hu, P., Wang, D., and Wang, R. J. (2022). A novel mitochondrial genome haplotype in Parantica sita sita (Lepidoptera: Nymphalidae: Danainae) indicates substantial intraspecific genetic divergence. Appl. Entomol. Zool. doi: 10.1007/s13355-022-00772-y [Epub ahead of print].
Keywords: male genitalia, speciation, biogeography, COI sequence, microsatellite, genetic differentiation
Citation: Hu P, Lu L, Hu S, Da W, Huang C-L, Zhang H, Wang D, Zhang Y, Xu Y and Wang R (2022) Differentiation of the Chestnut Tiger Butterfly Parantica sita (Lepidoptera: Nymphalidae: Danainae) in China. Front. Ecol. Evol. 10:846499. doi: 10.3389/fevo.2022.846499
Received: 31 December 2021; Accepted: 08 February 2022;
Published: 14 March 2022.
Edited by:
Xin Zhou, China Agricultural University, ChinaReviewed by:
Zhenyong Du, China Agricultural University, ChinaZhaofu Yang, Northwest A&F University, China
Copyright © 2022 Hu, Lu, Hu, Da, Huang, Zhang, Wang, Zhang, Xu and Wang. This is an open-access article distributed under the terms of the Creative Commons Attribution License (CC BY). The use, distribution or reproduction in other forums is permitted, provided the original author(s) and the copyright owner(s) are credited and that the original publication in this journal is cited, in accordance with accepted academic practice. No use, distribution or reproduction is permitted which does not comply with these terms.
*Correspondence: Rongjiang Wang, rjwang@pku.edu.cn
†These authors have contributed equally to this work and share first authorship