Altitudinal Patterns in Adaptive Evolution of Genome Size and Inter-Genome Hybridization Between Three Elymus Species From the Qinghai–Tibetan Plateau
 Zhao Chen1,2†
  Yongzhuo Guan2†
  Mengli Han1
  Yuxia Guo2 Jingxue Zhang1 Zhipeng Guo2 Genlou Sun3
  Xuebing Yan1*
- 1College of Animal Science, Yangzhou University, Yangzhou, China
- 2College of Animal and Veterinary Science, Henan Agricultural University, Zhengzhou, China
- 3Biology Department, Saint Mary's University, Halifax, NS, Canada
Genome size variation and hybridization occur frequently within or between plant species under diverse environmental conditions, which enrich species diversification and drive the evolutionary process. Elymus L. is the largest genus in Triticeae with five recognized basic genomes (St, H, P, W, and Y). However, the data on population cytogenetics of Elymus species are sparse, especially whether genome hybridization and chromosomal structure can be affected by altitude are still unknown. In order to explore the relationship between genome sizes, we studied interspecific hybridization and altitude of Elymus species at population genetic and cytological levels. Twenty-seven populations at nine different altitudes (2,800–4,300 m) of three Elymus species, namely, hexaploid E. nutans (StHY, 2n = 6x = 42), tetraploid E. burchan-buddae (StY, 2n = 4x = 28), and E. sibiricus (StH, 2n = 4x = 28), were sampled from the Qinghai–Tibetan Plateau (QTP) to estimate whether intraspecific variation could affect the genomic relationships by genomic in situ hybridization (GISH), and quantify the genome size of Elymus among different altitude ecological groups by flow cytometry. The genome size of E. nutans, E. burchan-buddae, and E. sibiricus varied from 12.38 to 22.33, 8.81 to 18.93, and 11.46 to 20.96 pg/2C with the averages of 19.59, 12.39, and 16.85 pg/2C, respectively. The curve regression analysis revealed a strong correlation between altitude and nuclear DNA content in three Elymus species. In addition, the chromosomes of the St and Y genomes demonstrated higher polymorphism than that of the H genome. Larger genome size variations occurred in the mid-altitude populations (3,900–4,300 m) compared with other-altitude populations, suggesting a notable altitudinal pattern in genome size variation, which shaped genome evolution by altitude. This result supports our former hypothesis that genetic richness center at medium altitude is useful and valuable for species adaptation to highland environmental conditions, germplasm utilization, and conservation.
Introduction
Strong correlations between variation in genomic attributes and species diversity across the plant tree of life suggest that polyploidy or other mechanisms of genome size change confer selective advantages due to the introduction of genomic novelty (Barrett et al., 2019). Genome size and nuclear DNA content are both important biodiversity characteristics, which provide a practical and predictive element in biology (Höfer and Meister, 2010; Sliwinska, 2018). Determination of genome size in species is of great significance not only for molecular and cell genetics, but also for plant genomics and evolution study. Numerous correlations between genome size and physiologically or ecologically relevant phenotypes have been observed, including nucleus size (Baetcke et al., 1967), plant cell size (Pegington and Rees, 1970), seed size (Beaulieu et al., 2007), body size (Gregory et al., 2000), and growth rate (Cavalier, 1978). Adaptive models of genome size evolution suggest that positive selection drives genome size toward an optimum due to selection on these or other traits and that stabilizing selection prevents expansions and contractions away from the optimum (Gregory and Hebert, 1999; Müller et al., 2019). Correlations between intraspecific variation in genome size and other phenotypes or environmental factors have been observed (Long et al., 2013; Kang et al., 2015; Hoang et al., 2019), suggesting the possibility that some of the observed variations may be adaptive. Much of the discussion about genome size variation has focused on variation among species, and intraspecific variation has often been downplayed as the result of experimental artifacts (Hoang et al., 2019) or argued to be too small to have much evolutionary relevance (Hannes et al., 2021). However, there is substantial controversy about the genetic process that controls the size of plant genomes (Pellicer et al., 2014), but most researchers believed that the main mechanism that drives the rapid amplification of plant genomes is polyploidy or transposable elements (TEs), especially transposons (Pellicer et al., 2014). Recent research has suggested that genome size varies many orders of magnitude across species, due to changes in both ploidy and haploid DNA content, and we still know relatively little about the makeup of many eukaryote genomes, the impact of genome size on phenotype, or the processes that govern variation in repetitive DNA and genome size among taxa (Wendel et al., 2016; Li et al., 2020).
Genome size can be an important feature that predicts the response of different species to climate and environmental changes. Meanwhile, genome size has a significant influence on some epigenetic traits and plant growth and development (Müller et al., 2019). During the last decades, flow cytometry became the preferred method for genome size measurement in plants. Flow cytometry is a powerful technology, and cells and particles can be analyzed in a cell nuclei suspension because of its precision, high speed, objectivity, and relative simplicity (Yumni et al., 2021). Species relationships can be elucidated by correlating the chromosome numbers with genome sizes (Huang et al., 2013). The application of flow cytometry has been well-documented for the determination of the accurate nuclear DNA contents, adding hints on the ploidy status and the evolutionary pattern in the varying genome sizes (Saha et al., 2017). Besides the easiness of sample preparation and high throughput, the capability to estimate genome size, nuclear replication state, and ploidy and endopolyploidy levels is an advanced feature of this method compared with other approaches such as Feulgen densitometry or genome sequencing. Flow cytometry has been extensively used in plant genetics, plant physiology, and other fields (Ochatt, 2008). Genomic in situ hybridization (GISH) has been considered to be an effective and illustrative method for the rapid and reliable identification of genomic homology in allopolyploid and related species, alien chromatin in interspecific and intergeneric species, and identification of genetic constitution on chromosome level in polyploid species (Qie et al., 2007; Badaeva et al., 2021; Chaves et al., 2021).
The genus Elymus comprises ~150 species in the Triticeae tribe of the grass family (Poaceae) and is widely distributed throughout the Tropics. Asia is an important center of origin and diversity of the perennial species in the Triticeae (Sun, 2002), where more than half, ~80, of the known Elymus species have originated (Dewey, 1984). Cytogenetic analyses have identified that all Elymus species include the St genome in combination with one or more of four other genomes (H, Y, P, and W). The St, H, P, and W genomes are known to be denoted by Pseudoroegneria (Nevski) Á, Löve Hordeum L., Agropyron Gaertn., and Australopyrum (Tzvelev) Á. Löve, respectively (Jensen, 1990; Torabinejad and Mueller, 1993). However, the origin of genome Y has always been controversial. The Elymus genus, tetraploid E. burchan-buddae (StY), E. sibiricus (StH), and hexaploid E. nutans (StHY) have similar morphologies, different genome constitutions, and overlapping habitats (Sun and Salomon, 2009), which display a continuous distribution at different altitudes on the Qinghai–Tibetan Plateau (QTP) of western China. An altitudinal gradient, as an important index of spatial niche measurement, greatly affects the distribution range and pattern of organisms. Intense stresses (low temperature, low oxygen supply, and high UV radiation) caused by high-altitude environments may result in noticeable genetic adaptations in native species (Beall, 2014). Recently, several studies have reported differences in the genome size and evolutionary processes driving the adaption of alpine plants along altitudinal gradients, and an adaptation of genome size to an unknown ecological parameter connected to altitude (Hämälä and Savolainen, 2019; Bohutínská et al., 2021). Savas et al. (2019) also determined that a geographical origin (localization, altitude) had a statistically significant effect on genome size. Our previous study showed significant correlations between altitude and morphological traits, and tetraploid Elymus species had a higher sensitivity to altitude than hexaploid E. nutans (Chen et al., 2015). The variation in intraspecies genome size is especially obvious when the geographical distance is relatively long or the climatic conditions are quite different. As an important ecological factor, altitude has an obvious influence on ecological factors such as temperature and moisture and thus affects genetic variation and population differentiation (Buehler et al., 2012). For example, a positive correlation was detected between genome size and growing altitude in wild populations of Corchorus olitorius (Benor et al., 2011). A variation in genome size along altitudinal gradients has also been reported in maize (Díez et al., 2013), showing that altitude affects genomic variation and population differentiation possibly due to the dramatic influence on ecological factors including temperature and moisture. However, potential geographical patterns of genome size variation with the increase in altitudinal gradients are still not explicit. The limited number of reports on the genome size and chromosome counts is controversial for the rarely studied species of Elymus. We aim to explore how Elymus has adapted and evolved to the highly heterogeneous environments in QTP. Thus, we hypothesize that genome size is reduced in populations at high elevations. The objectives of this study were: (1) to estimate the nuclear DNA content in allohexaploid hexaploid E. nutans (StHY, 2n = 6x = 42), allotetraploid burchan-buddae (StY, 2n = 4x = 28), and E. sibiricus (StH, 2n = 4x = 28), (2) to investigate the genomic constitution and genomic homology between the St, H, and Y genomes, and (3) to examine the pattern between genome size and altitude to preliminary explore altitude change affecting the adaptability, fitness, competitiveness, and colonizing ability in Elymus species.
Materials and Methods
Plant Materials
Seeds from three Elymus species, namely, E. nutans, E. sibiricus, and E. burchan-buddae, were sampled at nine different locations across the QTP at varying altitudes from 3,000 to 4,300 m within a small geographical scope of 60 km between 34°28′26.2“N and 34°40′43.7” N of latitude and from 100°22.1′42.6“E to 100°40′33.9” E of longitude (Figure 1, Supplementary Table 1). Three Elymus species were sampled at the same field at each altitude level, and 10 individuals were sampled for each population with individuals at least 10 m apart. The seeds were stored in the Animal Forage Laboratory of Henan Agricultural University. Morphological traits of each individual, including plant height, flag leaf length and width, spike weight and length, glume length and width, lemma length and width, palea length and width, floret number, and awn length, were determined (Chen et al., 2015). According to the required standards of Dolezel (2003), barley (Hordeum vulgare L.) was chosen as an internal reference standard, which was provided by Xiong Da-Bing at the National Engineering Research Center for Wheat. Plants of Elymus and barley were grown from seeds in an optical incubator at 25°Cwith a photoperiod of 12 h and 15°C in the dark per day, and their fresh tender leaves were collected within 2 to 3 weeks after planting.
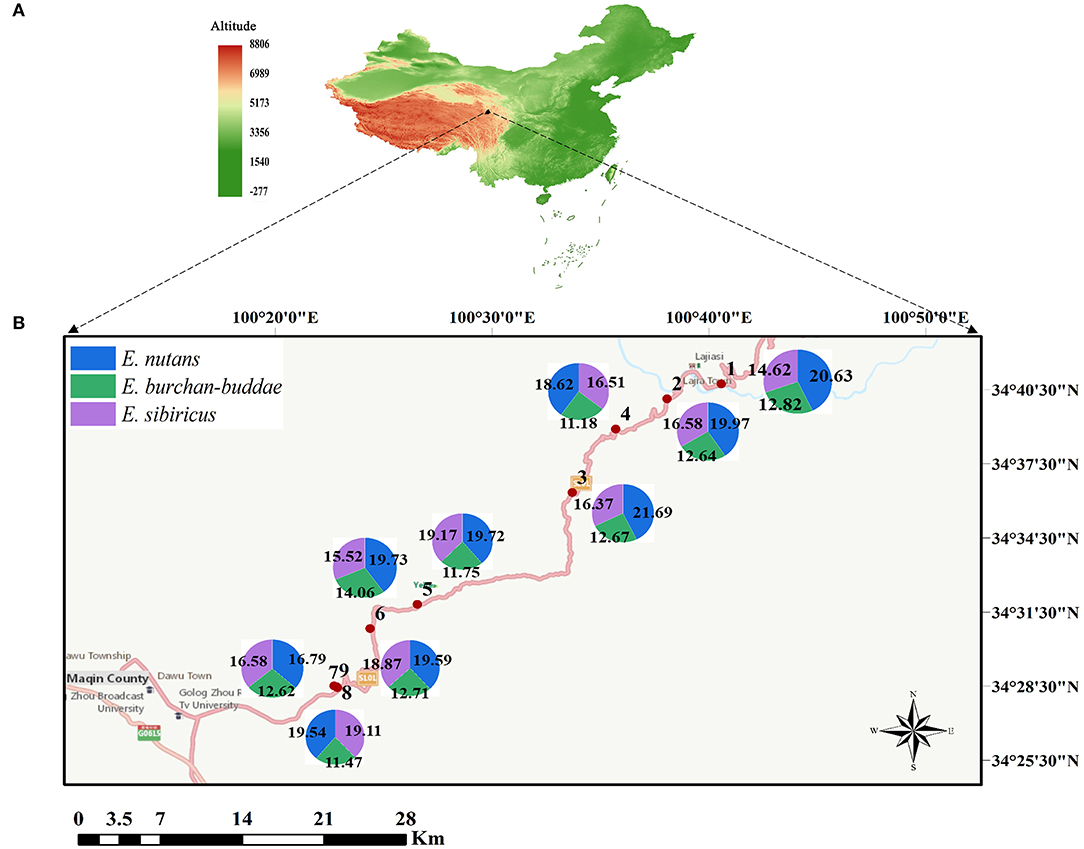
Figure 1. Geographical distribution of the nine sampling sites and genome size of three Elymus species (E. nutans, E. burchan-buddae, and E. sibiricus, the detailed altitudes are given in Supplementary Table 1). (A) Sampling location at the Qinghai–Tibetan Plateau center of China. (B) The geographical location of the population sampled. The crook lines indicate various sizes of national highways; the pizza charts show the genome size of three Elymus species; and the numbers in the charts represent the population number.
Preparation of Nuclei Suspension
The 50-mg fresh leaves were sampled from each individual of E. nutans, E. burchan-buddae, and E. sibiricus, then washed with distilled water, dried with filter paper, and placed in a plastic Petri dish containing 250 μl of precooled extraction buffer. After vertically fast shredding with a sharp single-edge blade (maintaining equal weight to protect the organization from adhesions), 250 μl of extraction buffer was added, and the tissues were filtered through a 30 μm filter head (Celltrics, Partec, Germany) into a 1.5-ml centrifuge tube. Following filtration, the samples were centrifuged at 11,000 rpm at 4 °C for 15–20 s. The supernatant was discarded, and the nuclei were resuspended in 500 μl of a solution containing propidium iodide (PI) staining solution (0.02 mg/ml RNase solution+0.02 mg/mL PI solution). The nuclei suspension of Hordeum vulgare L. was obtained using the same method and mixed with the nuclei suspension of three Elymus species individually by the same volume. The samples were incubated at a low temperature in the dark for ~30–60 min.
Genome Size Evaluation by Flow Cytometry Measurement
The nuclear DNA content was determined using a flow cytometer (CyFlow® Cube8, Partec, Germany). The excitation wavelength was set at 488 nm at 270 V, the excitation FL2 fluorescence channel was collected, and the propidium iodide (PI) emission fluorescence intensity was detected. A minimum of 10,000 nuclei per sample were analyzed. Three measurements were obtained for each sample, while 10 replications were determined for each population per species. The nuclear DNA content was calculated as follows: sample nuclear DNA content (pg/2C) = [(mean value of the sample peak)/(mean value of the internal standard)] × known nuclear DNA. The mean genome sizes were presented as 1C value in picograms (pg) or megabase pairs (1 pg = 978 Mbp) (Dolezel, 2003).
Preparation of Root tip and Mitotic Chromosome
Root tips were pretreated in ice-cold water at 0–4°C for 20–24 h and placed in 2 mM of 8-hydroxyquinoline (Sigma) at room temperature (25°C) under dark treatment for 2–4h. After being washed with distilled water for 15 min, they were dried with filter paper, fixed in ethanol–glacial acetic acid (3:1, v/v) for 24 h at room temperature, and then stored at 4°C in a refrigerator for 2–4 days. Again, they were washed two times with distilled water for 5 min and transferred to a EP tube filled with 4% cellulose–pectinase [2.7% Cellulase Onozuka R10 (Phytotech, USA) and 1.3% pectolyase (Sigma, Germany), pH 4.8] at 37°C for 1–2 h. After the unnecessary enzymolysis liquid was removed carefully using a pipette, they were washed with distilled water for 10 min, transferred onto slides with distilled water, and covered with the cover glass. Each root tip was squashed in a drop of 45% acetic acid. The slides with well-spread chromosomes were kept in a freezer at −80°C for more than 30 min, and the slides were air-dried for GISH.
Probe Preparation
Pseudoroegneria strigosa and Hordeum bogdanii Wilensky were grown about 3 weeks in pots for probe preparation. The total genomic DNAs of P. strigosa and H. bogdanii were extracted by the CTAB method (Murray and Thompson, 1980). Before labeling, the total genomic DNA was randomly fragmented into a size of 100–500 bp by DNase I (Sigma, Germany). The treated genomic DNAs of P. strigosa and H. bogdanii were labeled with biotin-11-dUTP (Thermo, USA) and digoxigenin-11-dUTP (Roche, Switzerland), respectively, by a nick translation method and used as probes in GISH analyses.
Genomic in situ Hybridization
The slides were re-fixed in ethanol–glacial acetic acid (3:1, v/v) for 30 min, washed two times for 10 min in ethanol, and dried at 37°C for over 24 h. Chromosomes were denatured in 70% formamide in 2 × SSC (1 × SSC is 0.15 M NaCl and 0.015 M sodium citrate) at 80–85°C for 90 s, then dehydrated through an ice-cold ethanol series (50, 70, 100%) for 5 min each, and air-dried. The probe hybridization mixture [containing 100% deionized formamide (by vol.), biotin-labeled DNA or dig-labeled DNA, 50% dextran sulfate (by vol.), 20 × SSC, and ddH2O] was denatured at 90°C for 10 min.
Fluorescence Microscopy Detection
Following hybridization, the slides were removed and then placed in 2 × SSC at room temperature for 5 min and 42°C for 5 min, 1 × TNT [0.1M Tris, 0.15M NaCl, 0.05% Tween-20 (by vol.)]. The slides were placed in a mixture of 1 × TNB buffer [containing 1M Tris (pH 7.5), 3M NaCl, blocking reagent], ddH2O, streptavidin–Texas red (Invitrogen, USA), or anti-DIG-fluorescein (FITC) (BOSTER, USA), hybridized in a humidified box at 37°C for 1 h, then washed three times with 1 × TNT at room temperature for 5 min, and air-dried. After that, a drop of 4′,6-diamidino-2-phenylindole (DAPI) was placed on each slide. Fluorescence was viewed with a double rotary laser confocal imaging real-time analyzer (PerkinElmer, UltraVIEW VoX, USA).
Data Analysis
Statistical Analysis
The CyViewTM Cube software was used for flow cytometry/FCS analysis, and histograms with a coefficient of variation (CV) above 5% were rejected. Statistical analyses were performed using a one-way ANOVA (SPSS 20.0.) with least significant difference (LSD) and Duncan's multiple comparisons to evaluate significance within and among populations of three Elymus species.
Curve Fitting Analysis
In order to explore the specific varying pattern between altitude and nuclear DNA content of each population, curve regression analysis was used. The regression analysis was performed by Curve Expert Professional 2.3.0 to estimate the relationship between nuclear DNA content and altitude. The curve regression of three Elymus species is shown in (Figure 2), where the independent variables X and Y represent the altitude and the nuclear DNA content, respectively, and the r-value represents the correlation between two quantities. The curve regression analysis between altitude and nuclear DNA content estimated by flow cytometry of PI-stained samples showed a strong correlation with r values of 0.963, 0.987, and 0.998 of E. nutans, E. burchan-buddae, and E. sibiricus, respectively, which accounted for an obvious biological significance.
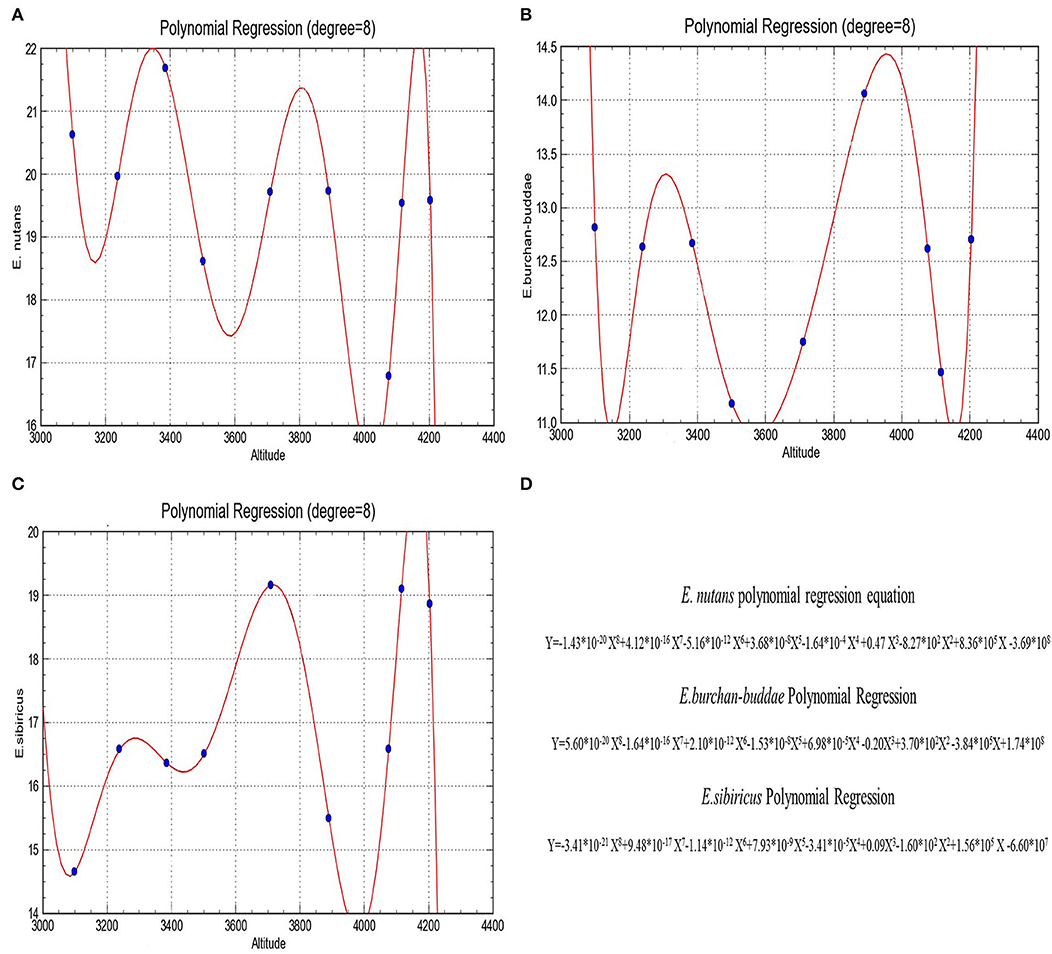
Figure 2. Curve regression analyses of three Elymus species: (A) E. nutans, (B) E. burchan-buddae, and (C) E. sibiricus; (D), polynomial regression analyses of three Elymus species.
Results
Altitudinal Variation in Nuclear DNA Content of Three Elymus Species
The mean 2C nuclear DNA of E. nutans, E. burchan-buddae, and E. sibiricus was in the range of 12.38–22.33, 8.81–18.93, and 11.46–20.96 pg/2C with averages of 19.59, 12.39, and 16.85 pg/2C, respectively (Table 1). The largest nuclear DNA content in E. nutans was observed for the population at an altitude of 3,385 m (22.33pg/2C), while the smallest was at an altitude of 4,075 m (12.38 pg/2C). For E. burchan-buddae, the population at an altitude of 3,889 m (18.93 pg/2C) and an altitude of 3,501 m (8.81 pg/2C) showed the largest and the smallest DNA content, respectively (Table 1). The largest and the smallest nuclear DNA content of E. sibiricus appeared at altitudes of 3,709 m (20.96 pg/2C) and 3,501 m (11.46pg/2C), respectively (Table 1).
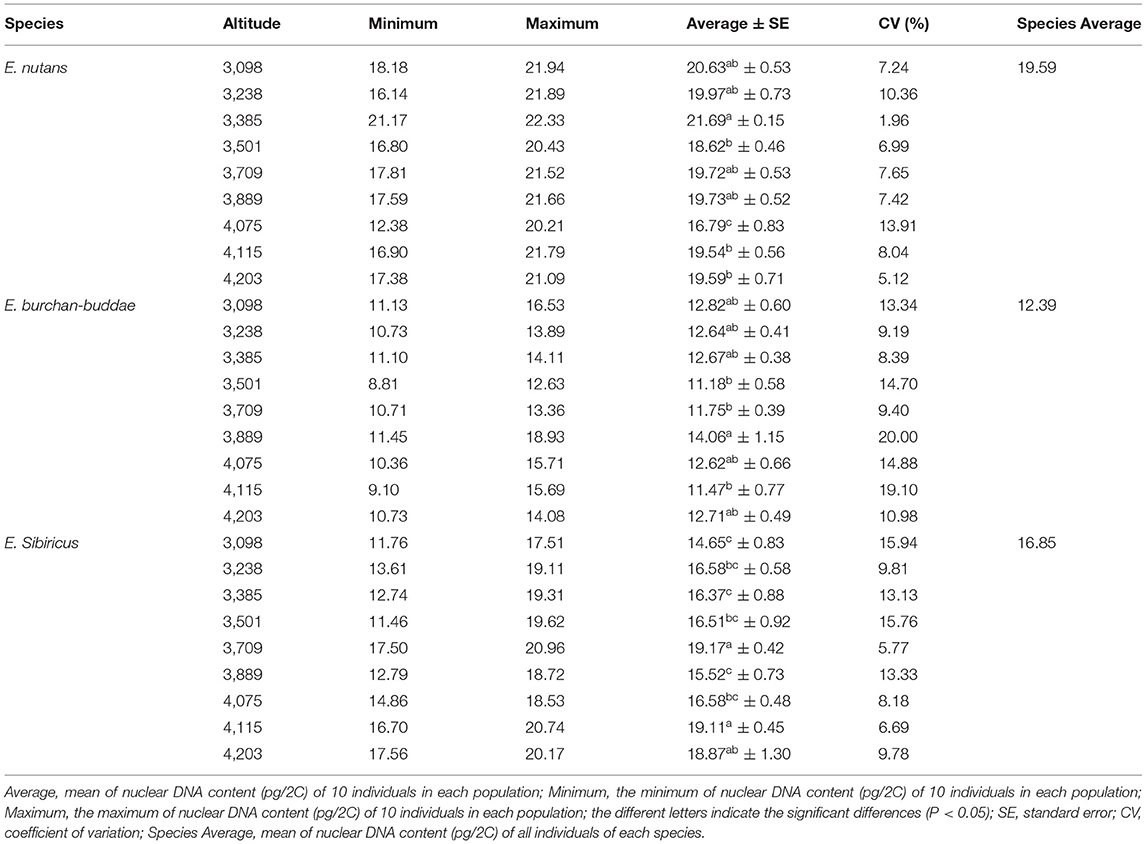
Table 1. Nuclear DNA content (pg/2C) of three Elymus species in nine altitudes (between 3,098 and 4,203 m).
The coefficient of variation ranges of E. nutans, E. burchan-buddae, and E. sibiricus were 1.96–13.91, 8.39–20.00, and 5.77–15.94%, respectively (Table 1). The largest CV values of E. nutans, E. burchan-buddae, and E. sibiricus were 13.91, 20.00, and 15.94% at 4,075, 3,889, and 3,098 m, respectively (Table 1). Hexaploid E. nutans showed a larger variation at 3,000–3,400 m; a high variation of tetraploid E. sibiricus occurred at 3,400–3,900 and 3,900–4,300 m; and E. burchan-buddae showed a high variation at 3,400–3,900 and 3,000–3,400 m. For hexaploid E. nutans, the nuclear DNA content was high in populations at 3,000–3,400 m, while the nuclear DNA content of tetraploid E. burchan-buddae and E. sibiricus was high in populations at 3,400–3,900 and 3,900–4,300 m, respectively (Table 1). There was a negative correlation between genome size variation and altitudinal gradient in E. nutans, while no correlation was found in E. sibiricus and E. burchan-buddae, which expounded significantly complex evolutionary of genome size of Elymus along an altitudinal gradient (Figure 3; Supplementary Table 2). The plant height (r = 0.394, p < 0.05) and palea length (r = −0.720, p < 0.05) were correlated with genome size in E. nutans (Supplementary Table 2).
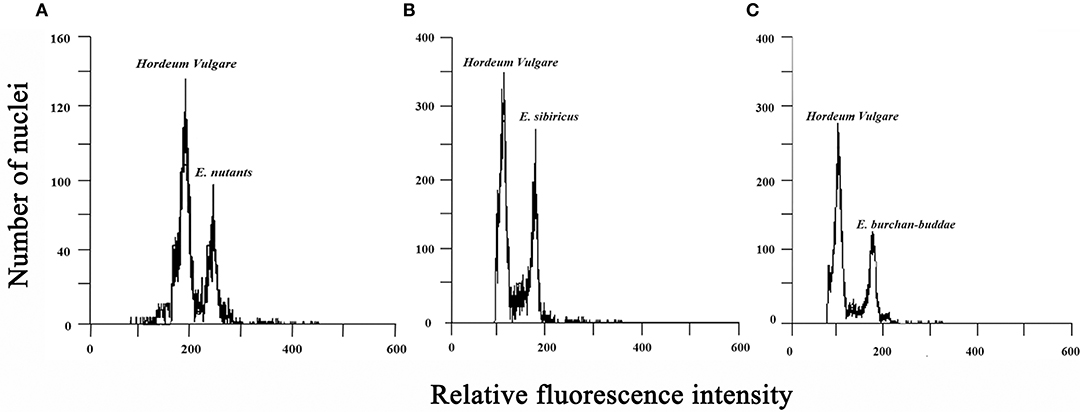
Figure 3. Frequency distribution of the genome size of three Elymus species: (A), E. nutans; (B), E. sibiricus; and (C), E. burchan-buddae. Internal standard: Hordeum vulgare L.
Hybridization Between Elymus Species and Genome Donor Species
Genomic relationships of 27 populations (10 individuals for each population) among three Elymus species, namely, hexaploid E. nutans, tetraploid E. burchan-buddae, and E. sibiricus, at nine different altitudes were estimated by GISH with a total genomic DNA from P. strigosa labeled with biotin-11-dUTP and detected with a streptavidin Texas-Red conjugated antibody and a total genomic DNA from H. bogdanii labeled and detected with an anti-DIG-fluorescein (FITC). GISH clearly classified all chromosomes into three subgenomes, namely, H, St, and Y. Sequential GISH permitted the identification of individual chromosomes within each subgenome (Figure 4).
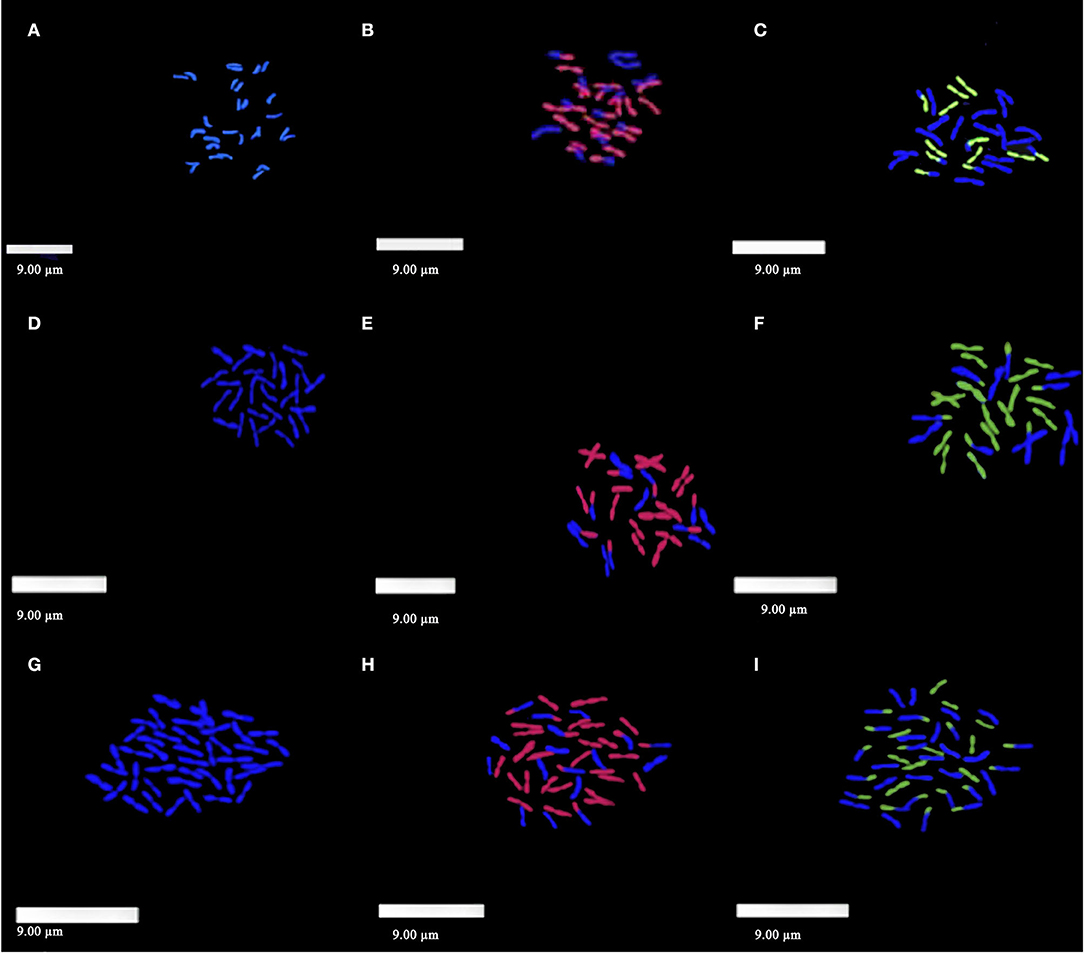
Figure 4. Genomic in situ hybridization on somatic metaphase cells from root tips of E. nutans, E. burchan-buddae, and E. sibiricus, with Pseudoroegneria strigosa and H. bogdanii as probes. (A–C) E. burchan-buddae. (A) Twenty-eight chromosomes counterstained by DAPI on metaphase; (B) 24 chromosomes showed red fluorescence when probing with St-genome DNA of P. strigosa; (C) 12 chromosomes showed green fluorescence when probing with H-genome DNA of H. bogdanii. (D–F) E. sibiricus. (D) Twenty-eight chromosomes counterstained by DAPI on metaphase; (E) 22 chromosomes showed red fluorescence when probing with St-genome DNA of P. strigosa; (F) 22 chromosomes showed green fluorescence when probing with H-genome DNA of H. bogdanii. (G–I) E. nutans. (G) Forty-two chromosomes counterstained by DAPI on metaphase; (H) 32 chromosomes showed red fluorescence when probing with St-genome DNA of P. strigosa; (I) 26 chromosomes showed green fluorescence when probing with H-genome DNA of H. bogdanii.
After DAPI staining, 28 chromosomes of E. burchan-buddae could be counted and showed blue fluorescence signals on metaphase (Figure 4A). When a total DNA probe from P. strigosa was hybridized into the chromosome of E. burchan-buddae, the strong hybridization of red fluorescence signals was observed on 20–24 chromosomes (Figure 4B). The same in situ hybridization pattern was obtained when using a total DNA probe from H. bogdanii on chromosomes of E. burchan-buddae; 8–12 chromosomes showed green fluorescence signals (Figure 4C). We found that the St genome had partial homology to the Y genome, and the H genome possibly had some relationship with the St or Y genome. Compared with the two groups of hybridization, the genomes St and H could be distinguished.
For E. sibiricus, 28 chromosomes showed blue fluorescence signals by DAPI (Figure 4D). When total DNA probes from P. strigosa and H. bogdanii were applied to chromosomes of E. sibiricus, some labeling could be detected as revealed by dispersed and spotted fluorescent signals. The major hybridization signals were the same, and 18–22 chromosomes showed red and green fluorescence signals (Figures 4E,F, respectively). We found that the St genome had partial homology to the H genome. The results verified the St genome in E. sibiricus from P. strigosa and the H genome in E. sibiricus from H. bogdanii.
Blue fluorescence signals were observed on 42 chromosomes of E. nutans after DAPI staining (Figure 4G). In situ hybridization with total DNA from P. strigosa and H. bogdanii revealed strong signals on chromosomes with 26–32 red and 20–26 green fluorescence (Figures 4H,I, respectively). The St genome had partial homology to the H genome, and the H genome could be distinguished. The relationship between the St genome and the Y genome was closer than that between the Y genome and the H genome compared with the two groups of hybridization.
Discussion
In our study, we first applied FCM to evaluate intraspecific and interspecific genome size variations among nine populations of hexaploid E. nutans (StHY), tetraploid E. sibiricus (StH), and E. burchan-buddae (StY), which are morphologically very similar and have partly overlapping distribution areas (a continuous distribution on the Qinghai–Tibetan plateau at a certain altitude range), different ploidy and genome combinations, and genome presenting obvious regional differentiation (Ohsawa and Ide, 2008). It is no wonder that confusion sometimes arises during sampling, propagating, and investigating germplasm collections. However, based on FCM and genome sequencing, all three wild Elymus species can be recognized easily. In addition, Hordeum vulgare L. was considered an ideal internal standard due to its very few secondary compounds and approximate genome size to Elymus as well as strong genetic stability (Tuna et al., 2006; Chang et al., 2022). The most plausible reason for interspecific and intraspecific genome size variation was suggested to be one or the other kind of repetitive sequences along with complex genetic mechanisms, karyotypic, environmental, and phylogenetic factors (Du et al., 2017). Therefore, our study provided accurate and reliable data for assessing genome size variation.
Intraspecific and Interspecific Variation Among Elymus Species
Our study revealed highly statistical intraspecific variations of genome size along altitudinal gradients in three Elymus species despite their same geographical distribution. A significant intraspecific variation in maize (Lai et al., 2005) and Brachionus asplanchnoidis (Stelzer et al., 2019) was also reported. However, the mechanism resulting in genome size variation evolution is complicated. One probable explanation is that populations of plants in high-altitude mountainous regions are always inclined to be geographically isolated and altitude can shape genome size to adapt to diverse and infertile environmental conditions. In addition, the distinct intraspecific differences observed in genome size in this study could be attributed to its non-strict self-pollinating in Elymus, resulting in a larger variation in genome size than self-pollinating species and unstable genome size (Eilam et al., 2007). Consequently, it is convincing that genome size diverges widely in populations, indicating highly genomic variability. No (Oney-Birol and Tabur, 2018) strong association (positive by Šmarda et al., 2008; negative by Charles and Jeremy, 2008) between genome size and plant height was previously reported. Different sampling strategies and plant species in these studies would lead to various associations; however, we found a positive association between genome size and plant height and between genome size and ploidy level. Our finding will be helpful in selecting germplasm with high forage productivity at the cellular level.
Our comprehensive study discriminated a significantly large genome size variation among the three wheatgrasses; therefore, they can be differentiated efficiently by genome size and unambiguously regardless of their similar morphological features and overlapping distributing location. Our results showed a larger genome size in hexaploid Elymus species compared with that in tetraploid Elymus species. Larger genomes are considered to be more complicated with more frequency repeat sequences, larger intergenic spacer, and more introns, which might accelerate the evolutionary process of plant species. Moreover, greater genome size changes in hexaploid species demonstrated a wider genomic differentiation and indicated a faster evolution in the hexaploid species (Abbott and Lowe, 2004; Nakano et al., 2021) than in the tetraploid species. Large differences in evolutionary pressures, especially the additional H genome in hexaploid E. nutans, accelerated genomic variation, accommodating adequate adaptability and accounting for extensive altitudinal distribution in these areas with high altitude (Zhao et al., 2019). Besides, genome combination differentiation between the genomes Y and H in E. sibiricus and E. burchan-buddae can be the potential reason for an interspecific genome size variation, which corresponds to the previous research (Sun and Salomon, 2009). The origin of Y genome has always been a very interesting scientific question in wheatgrass phylogenetic studies (Sun and Salomon, 2009; Sun and Komatsuda, 2010; Tan et al., 2022). Our data showed that Y genome size is smaller than the H genome size, which provides a hint for discovering the potential progenitor and donor of the Y genome. Furthermore, interspecific genomic changes that occurred in the formation of polyploids resulted from hybridization, sequence rearrangements, and homologous recombination (Han et al., 2003; Urfusová et al., 2021).
Varying Pattern Between Genome Size and Altitude
Genome size variation of plant species has a momentous adaptive and evolutionary significance and is always related to environmental characteristics (Mráz et al., 2009; Meyerson et al., 2016), including latitude, longitude, and altitude generally. Our study claimed a wide variation of genome size among wheatgrass populations along altitudinal gradients and revealed a complex and strong association between altitude and genome size. In our previous work, higher genetic diversity was observed in populations at 3,400–3,900 m (medium altitudes) than those at 3,000–3,400 and 3,900–4,300 m (low and high altitudes, respectively) for the Elymus species (Yan et al., 2009). Interestingly, in this study, larger genome size variations occurred at the 3,400–3,900 m regions compared with the Elymus populations at other altitudes. The results yielded notable genomic evolution information within and among Elymus populations, especially at 3,400–3,900 m, revealing abundant genome size diversity. And population genetic relationships seemed to be closer with a similar altitude, and the curve regression analysis showed a strong association between genetic relationships of populations and their genome size at a particular altitude. Our study result also is consistent with that of Ohsawa and Ide (2008). Primarily, species abundance typically peaks at mid-altitude compared with the high- and low-altitude areas coupled with a severe ecological environment including low oxygen content, cold temperature, infertile soil, and water depletion, leading to a deteriorating habitat suitability for plants from the center to the edge (Herrera and Bazaga, 2008; Ohsawa and Ide, 2008). In addition, genetic variation across the altitudinal ranges is often centrally distributed and highly diverse at the mid-altitude regions in Elymus species as well as other widespread species (Brown, 1984). In contrast, marginal altitudes including high (3,900–4,300 m) and low (3,000–3,400 m) altitudes limited the opportunities for hybridization or gene introgression, which may narrow genomic variation. A larger temperature variation at the 3,900–4,300 m altitude compared with the other altitudes is a possible reason for generating more plentiful genomic variation among and within species (Koskey et al., 2018). Under the circumstances, a stronger plasticity and higher genomic variation at mid-altitudes (3,900–4,300 m) within Elymus populations under varying environmental conditions are well-annotated. These findings of the genomic variation patterns in Elymus across altitudinal gradients are favorable to polyploidy evolution and species formation, contributing to explaining the powerful adaptability of Elymus to the highland environment. From the standpoint of germplasm conservation and utilization, the mid-altitude was the conducive locality for collecting and developing QTP wheatgrass germplasm resources.
The Genomic Relationships Between the St, H, and Y Genomes in Elymus Species
Genome is generally defined as a full set of chromosomes in a haploid cell of a genome or all the genes in haploid cells as a genome. We found 1C nuclear DNA contents (genome sizes) of E. nutans (StHY), E. burchan-buddae (StY), and E. sibiricus (StH) were 9.82, 6.195, and 8.425 pg/1C, respectively. The nuclear DNA content of genome St (4.8 pg) is larger than that of genomes H (3.625 pg) and Y (1.395 pg), whereas the nuclear DNA content of genome Y is smaller than that of genome H. When hybridizing the probe P. strigosa with E. burchan-buddae and E. sibiricus, we found the relationship between the St genome and the Y genome was closer than that between the St genome and the H genome. Hybridization of H. bogdanii with E. burchan-buddae and E. nutans showed that the H genome had partial homology to the Y genome, and they are from different donors. Our results supported the hypothesis that the Y genome evolved in a diploid species and has a different origin from the St genome (Yan et al., 2011). RPB2 genes and transcription elongation factor G (EF-G) sequence analysis also indicates the Y genome has a different origin from the St genome (Sun and Salomon, 2009; Yan et al., 2011).
Our GISH results on Elymus showed the close homology between Elymus and the other two species including P. strigosa and H. bogdanii. Simultaneously, GISH data showed that the St, H, and Y genomes were closely related, and genomic homology was found among them. Lu and Bothmer (1990) suggested that genomes St, H, and Y have lower homology. A certain degree of homology of the St and Y genomes was reported in the intergeneric hybridizations among interspecific hybrids of three diploid species of Pseudoroegneria and four tetraploid species of Roegneria (StY) and with three species of Elymus (StH, StYW) (Zhang et al., 2009). Zhang and Yan (2000) reported the St genome and Y genome in Roegneria grandis had high homology. We found the relationship between the St genome and the Y genome was closer than that between the St genome and the H genome, and the Y genome and the H genome.
Conclusion
An apparent genome size variation within the population of native Elymus species was observed along the altitude on the QTP, accounting for their strong adaptation to a changeable and harsh highland environment. Ploidy levels are regarded as the main biological character for genome variation, and genome size can significantly positively influence morphological traits such as plant height. More importantly, we found a higher chromosome variation in the population at 3,900–4,300 m. We speculated that more complicated genomic changes were associated with escalating altitudes in the Tibetan Plateau, and the mid-altitude (3,900–4,300 m) area fosters more genomic variation. We believe that this altitudinal range is ideal for the investigation, collection, and utilization of superior plant germplasm resources. These genomic and chromosomal changes promote the genetic variability and enable the newly formed allopolyploids to adapt to more changeable and harsher environments during the evolution of polyploid species, thus facilitating their rapid and successful establishment in nature.
Data Availability Statement
The original contributions presented in the study are included in the article/Supplementary Material, further inquiries can be directed to the corresponding author.
Author Contributions
ZC and YoG conceived the project, designed the experiments, and wrote the paper. MH, JZ, ZG, and YuG helped perform the experiments. XY and GS revised the manuscript. All authors discussed the results, commented on the manuscript, and read and approved the final manuscript.
Funding
This study was supported by two (Grant Nos. 31872995 and 31372358) from the National Foundation Science Commission of China.
Conflict of Interest
The authors declare that the research was conducted in the absence of any commercial or financial relationships that could be construed as a potential conflict of interest.
Publisher's Note
All claims expressed in this article are solely those of the authors and do not necessarily represent those of their affiliated organizations, or those of the publisher, the editors and the reviewers. Any product that may be evaluated in this article, or claim that may be made by its manufacturer, is not guaranteed or endorsed by the publisher.
Supplementary Material
The Supplementary Material for this article can be found online at: https://www.frontiersin.org/articles/10.3389/fevo.2022.923967/full#supplementary-material
References
Abbott, R. J., and Lowe, A. J. (2004). Origins, establishment and evolution of new polyploid species: Senecio cambrensis and S. eboracensis in the British isles. Biol. J. Linn. Soc. 82, 467–474. doi: 10.1111/j.1095-8312.2004.00333.x
Badaeva, E. D., Chikida, N. N., Belousova, M. K., Alevtina, S. R., Sergei, A. S., and Svyatoslav, A. Z. (2021). A new insight on the evolution of polyploid Aegilops species from the complex crassa: molecular-cytogenetic analysis. Plant Syst. Evol. 307, 1–18. doi: 10.1007/s00606-020-01731-2
Baetcke, K., Sparrow, A., Nauman, C., and Schwemmer, S. S. (1967). The relationship of DNA content to nuclear and chromosome volumes and to radiosensitivity (LD50). Proc. Natl. Acad. Sci. U.S.A. 58, 533–540. doi: 10.1073/pnas.58.2.533
Barrett, C. F., McKain, M. R., Sinn, B. T., Ge, X. J., Zhang, Y., Antonelli, A., et al. (2019). Ancient polyploidy and genome evolution in Palms. Genome Biol. Evol. 11, 1501–1511. doi: 10.1093/gbe/evz092
Beall, C. M. (2014). Adaptation to high altitude: phenotypes and genotypes. Annu. Rev. Anthropol. 43, 251–272. doi: 10.1146/annurev-anthro-102313-030000
Beaulieu, J. M., Moles, A. T., Leitch, I. J., Bennett, M. D., Dickie, J. B., and Knight, C. A. (2007). Correlated evolution of genome size and seed mass. New Phytol. 173, 422–437. doi: 10.1111/j.1469-8137.2006.01919.x
Benor, S., Fuchs, J., and Blattner, F. R. (2011). Genome size variation in Corchorus olitorius (Malvaceae sl) and its correlation with elevation and phenotypic traits. Genome 54, 575–585. doi: 10.1139/g11-021
Bohutínská, M., Vlček, J., Yair, S., Laenen, B., Konečná, V., and Fracassetti, M. (2021). Genomic basis of parallel adaptation varies with divergence in Arabidopsis and its relatives. Proc. Natl. Acad. Sci. U.S.A. 118, e2022713118. doi: 10.1073/pnas.2022713118
Brown, J. H. (1984). On the relationship between abundance and distribution of species. Am. Nat. 124, 255–279. doi: 10.1086/284267
Buehler, D., Graf, R., Holderegger, R., and Gugerli, F. (2012). Contemporary gene flow and mating system of Arabisalpina in a Central European alpine landscape. Ann. Bot. 109, 1359–1367. doi: 10.1093/aob/mcs066
Cavalier, S. T. (1978). Nuclear volume control by nucleoskeletal DNA, selection for cell volume and cell growth rate, and the solution of the DNA C-value paradox. J. Cell. Sci. 34, 247–278. doi: 10.1242/jcs.34.1.247
Chang, C. W., Fridman, E., Mascher, M., and Schmid, K. J. (2022). Physical geography, isolation by distance and environmental variables shape genomic variation of wild barley (Hordeum vulgare L. ssp. spontaneum) in the Southern Levant. Heredity 128, 1–13. doi: 10.1038/s41437-021-00494-x
Charles, A. K., and Jeremy, M. B. (2008). Genome size scaling through phenotype space. Ann. Bot. 101, 759–766. doi: 10.1093/aob/mcm321
Chaves, A. L. A., Carvalho, P. H. M., Ferreira, M. T. M., Benites, F. R. G., and Techio, V. H. (2021). Genomic constitution, allopolyploidy, and evolutionary proposal for Cynodon Rich. based on GISH. Protoplasma 259, 999–1011. doi: 10.1007/s00709-021-01716-z
Chen, Z., Guan, Y. Z., Ling, X. P., Zhang, H. R., Yu, Y., Zhang, M., et al. (2015). Effects of altitude on the morphological traits of Elymus speices. Acta Agresta Sin. 23, 897–904. doi: 10.11733/j.issn.1007-0435.2015.05.001
Dewey, D. R. (1984). “The genomic system of classification as a guide to intergeneric hybridization with the perennial triticeae,” in Gene Manipulation in Plant Improvement. Stadler Genetics Symposia Series, ed J. P. Gustafson (Boston, MA: Springer). doi: 10.1007/978-1-4613-2429-4_9
Díez, C. M., Gaut, B. S., Meca, E., Scheinvar, E., Montes-Hernandez, S., and Eguiarte, L. E. (2013). Genome size variation in wild and cultivated maize along altitudinal gradients. New Phytol. 199, 264–276. doi: 10.1111/nph.12247
Dolezel, J. (2003). Nuclear DNA content and genome size of trout and human. Cytom. Part A 51, 127–128. doi: 10.1002/cyto.a.10013
Du, Y. P., Bi, Y., Zhang, M. F., Yang, F. P., Jia, G. X., and Zhang, X. H. (2017). Genome size diversity in Lilium (Liliaceae) is correlated with karyotype and environmental traits. Front. Plant Sci. 8, 1303. doi: 10.3389/fpls.2017.01303
Eilam, T., Anikster, Y., Millet, E., Manisterski, J., Sagi-Assif, O., and Feldman, M. (2007). Nuclear DNA amount in diploid triticeae species. Genome 50, 1029–1037. doi: 10.1139/G07-083
Gregory, T. R., and Hebert, P. D. (1999). The modulation of DNA content: proximate causes and ultimate consequences. Genome Res. 9, 317–324. doi: 10.1101/gr.9.4.317
Gregory, T. R., Hebert, P. D., and Kolasa, J. (2000). Evolutionary implications of the relationship between genome size and body size in flatworms and copepods. Heredity 84, 201–208. doi: 10.1046/j.1365-2540.2000.00661.x
Hämälä, T., and Savolainen, O. (2019). Genomic patterns of local adaptation under gene flow in Arabidopsis lyrata. Mol. Biol. Evol. 36, 2557–2571. doi: 10.1093/molbev/msz149
Han, F. P., Fedak, G., Ouellet, T., and Liu, B. (2003). Rapid genomic changes in interspecific and intergeneric hybrids and allopolyploids of Triticeae. Genome 46, 716–723. doi: 10.1139/g03-049
Hannes, B., Powell, R. F., Brown, M. R., Chris, M., Jaume, P., Leitch, I. J., et al. (2021). The nature of intraspecific and interspecific genome size variation in taxonomically complex eyebrights. Ann. Bot. 128, 639–651. doi: 10.1093/aob/mcab102
Herrera, C. M., and Bazaga, P. (2008). Adding a third dimension to the edge of a species' range: altitude and genetic structuring in mountainous landscapes. Heredity 100, 275–285. doi: 10.1038/sj.hdy.6801072
Hoang, P. T. N., Schubert, V., Meister, A., Fuchs, J., and Schubert, I. (2019). Variation in genome size, cell and nucleus volume, chromosome number and rDNA loci among duckweeds. Sci. Rep. 9, 3234. doi: 10.1038/s41598-019-39332-w
Höfer, M., and Meister, A. (2010). Genome size variation in Malus species. J. Bot. 2010, 874304. doi: 10.1155/2010/874304
Huang, H., Tong, Y., Zhang, Q. J., and Gao, L. Z. (2013). Genome size variation among and within camellia species by using flow cytometric analysis. PLoS ONE 8:e64981. doi: 10.1371/journal.pone.0064981
Jensen, K. B. (1990). Cytology and taxonomy of Elymus kengii, E. grandiglumis, E. alatavicus, and E. batalinii (Poaceae: Triticeae). Genome 33, 668–673. doi: 10.1139/g90-099
Kang, M., Wang, J., and Huang, H. (2015). Nitrogen limitation as a driver of genome size evolution in a group of karst plants. Sci. Rep. 5, 11636. doi: 10.1038/srep11636
Koskey, G., Mburu, S. W., Kimiti, J. M., Ombori, O., Maingi, J. M., and Njeru, E. M. (2018). Genetic characterization and diversity of rhizobium isolated from root nodules of mid-altitude climbing bean (Phaseolus vulgaris L.) varieties. Front. Microbiol. 9, 968–981. doi: 10.3389/fmicb.2018.00968
Lai, J. S., Li, Y. B., Messing, J., and Dooner, H. K. (2005). Gene movement by Helitron transposons contributes to the haplotype variability of maize. Proc. Natl. Acad. Sci. U.S.A. 103, 9068–9073. doi: 10.1073/pnas.0502923102
Li, W., Liu, L., and Wang, Y. (2020). Determination of genome size and chromosome ploidy of selected taxa from Prunus armeniaca by flow cytometry. Sci. Hortic. 261, 108987. doi: 10.1016/j.scienta.2019.108987
Long, Q., Rabanal, F. A., Meng, D., Huber, C. D., and Farlow, A. (2013). Massive genomic variation and strong selection in Arabidopsis thaliana lines from Sweden. Nat. Genet. 45, 884–890. doi: 10.1038/ng.2678
Lu, B. R., and Bothmer, R. V. (1990). Intergeneric hybridization between Hordeum and Asiatic Elymus. Hereditas 112, 109–116. doi: 10.1111/j.1601-5223.1990.tb00048.x
Meyerson, L. A., Cronin, J. T., Bhattarai, G. P., Brix, H., Lambertini, C., Lucanova, M., et al. (2016). Do ploidy level and nuclear genome size and latitude of origin modify the expression of Phragmites australis, traits and interactions with herbivores? Biol. Invasions 18, 1–19. doi: 10.1007/s10530-016-1200-8
Mráz, P., Chrtek, J., and Šingliarová, B. (2009). Geographical parthenogenesis, genome size variation and pollen production in the arctic-alpine species Hieracium alpinum. Bot. Helv. 119, 41–51. doi: 10.1007/s00035-009-0055-3
Müller, L. B., Zotz, G., and Albach, D. C. (2019). Bromeliaceae subfamilies show divergent trends of genome size evolution. Sci. Rep. 9, 5136. doi: 10.1038/s41598-019-41474-w
Murray, M. G., and Thompson, W. F. (1980). Rapid isolation of high molecular weight plant DNA. Nucleic Acids Res. 8, 4321–4326. doi: 10.1093/nar/8.19.4321
Nakano, M., Hirakawa, H., Fukai, E., Toyoda, A., Kajitani, R., Minakuchi, Y., et al. (2021). A chromosome-level genome sequence of Chrysanthemum seticuspe, a model species for hexaploid cultivated chrysanthemum. Commun. Biol. 4, 1167. doi: 10.1038/s42003-021-02704-y
Ochatt, S. J. (2008). Flow cytometry in plant breeding. Cytom. Part A 73, 581–598. doi: 10.1002/cyto.a.20562
Ohsawa, T., and Ide, Y. (2008). Global patterns of genetic variation in plant species along vertical and horizontal gradients on mountains. Glob. Ecol. Biogeogr. 17, 152–163. doi: 10.1111/j.1466-8238.2007.00357.x
Oney-Birol, S., and Tabur, S. (2018). Genome size and morphological variations in Brachypodium distachyon L. along altitudinal levels. Pak. J. Bot. 50, 1923–1933.
Pegington, C., and Rees, H. (1970). Chromosome weights and measures in the triticinae. Heredity 25, 195–205. doi: 10.1038/hdy.1970.24
Pellicer, J., Kelly, L. J., Leitch, I. J., Zomlefer, W. B., and Fay, M. F. (2014). A universe of dwarfs and giants: genome size and chromosome evolution in the monocot family melanthiaceae. New Phytol. 201, 1484–1497. doi: 10.1111/nph.12617
Qie, L. J., Shen, S. X., Xuan, S. X., Wang, Y. H., Chen, X. P., Zhang, C. H., et al. (2007). Karyotype analysis of chinese cabbage and cabbage by genome in situ hybridization. Acta Horticult. Sin. 34, 1459–1464.
Saha, P. S., Sengupta, M., and Jha, S. (2017). Ribosomal DNA ITS1, 5.8 S and ITS2 secondary structure, nuclear DNA content and phytochemical analyses reveal distinctive characteristics of four subclades of Protasparagus. J. Syst. Evol. 55, 54–70. doi: 10.1111/jse.12221
Savas, T. G., Baser, I., and Tuna, M. (2019). Genome size variation among natural populations of Brachypodium distachyon and B. hybridum collected from different regions of Turkey. Turk. J. Bot. 43, 196–207. doi: 10.3906/bot-1807-96
Sliwinska, E. (2018). Flow cytometry–a modern method for exploring genome size and nuclear DNA synthesis in horticultural and medicinal plant species. Folia Hortic. 30, 103–128. doi: 10.2478/fhort-2018-0011
Šmarda, P., Bureš, P., Horová, L., and Rotreklová, O. (2008). Intrapopulation genome size dynamics in Festuca pallens. Ann. Bot. 102, 599–607. doi: 10.1093/aob/mcn133
Stelzer, C. P., Pichler, M., Stadler, P., Hatheuer, A., and Riss, S. (2019). Within-population genome size variation is mediated by multiple genomic elements that segregate independently during meiosis. Genome Biol. Evol. 11, 3424–3435. doi: 10.1093/gbe/evz253
Sun, G. L. (2002). Interspecific polymorphism at non-coding regions of chloroplast, mitochondrial DNA and rRNA IGS region in Elymus species. Hereditas 37, 119–124. doi: 10.1034/j.1601-5223.2002.01547.x
Sun, G. L., and Komatsuda, T. (2010). Origin of the Y genome in Elymus and its relationship to other genomes in Triticeae based on evidence from elongation factor G (EF-G) gene sequences. Mol. Phylogenet. Evol. 56, 727–733. doi: 10.1016/j.ympev.2010.03.037
Sun, G. L., and Salomon, B. (2009). Molecular evolution and origin of tetraploid Elymus species. Breed. Sci. 59, 487–491. doi: 10.1270/jsbbs.59.487
Tan, L., Huang, Q. X., Song, Y., Wu, D. D., Cheng, Y. R., Zhang, C. B., et al. (2022). Biosystematics studies on Elymus breviaristatus and Elymus sinosubmuticus (Poaceae: Triticeae). BMC Plant Biol. 22, 57. doi: 10.1186/s12870-022-03441-y
Torabinejad, J., and Mueller, R. J. (1993). Genome constitution of the Australian hexaploid grass Elymus scabrus (Poaceae: Triticeae). Genome 36, 147–151. doi: 10.1139/g93-018
Tuna, M., Vogel, K. P., and Arumuganathan, K. (2006). Cytogenetic and nuclear DNA conent characterization of diploid Bromus erectus and Bromus variegatus. Crop Sci. 46, 637–641. doi: 10.2135/cropsci2005.0178
Urfusová, R., Mahelka, V., Krahulec, F., and Urfus, T. (2021). Evidence of widespread hybridization among couch grasses (Elymus, Poaceae). J. Syst. Evol. 59, 113–124. doi: 10.1111/jse.12563
Wendel, J. F., Jackson, S. A., Meyers, B. C., and Wing, R. A. (2016). Evolution of plant genome architecture. Genome Biol. 17, 37–44. doi: 10.1186/s13059-016-0908-1
Yan, C., Sun, G., and Sun, D. (2011). Distinct origin of the Y and St genome in Elymus species: evidence from the analysis of a large sample of St genome species using two nuclear genes. PLoS ONE 6, e26853. doi: 10.1371/journal.pone.0026853
Yan, X. B., Guo, Y. X., Chong, Z., Liu, F. Y., and Lu, B. R. (2009). Intra-population genetic diversity of two wheatgrass species along altitude gradient on the Qinghai-Tibetan Plateau: its implication for conservation and utilization. Conserv. Genet. 10, 359–367. doi: 10.1007/s10592-008-9596-z
Yumni, R. M. I., Karim, M. F., and Midin, M. R. (2021). Genome size determination of cucumber (Cucumis Sativus), honeydew (Cucumis Melo Inodorus) and rock melon (Cucumis Melo Cantalupensis) via flow cytometry. Herit. Sci. 5, 14–16. doi: 10.26480/gws.01.2021.14.16
Zhang, C., Wang, X. L., Yu, H. Q., Zhang, H. Q., and Zhou, Y. H. (2009). Cytogenetic studies of the intergeneric and interspecif ic hybrids among the Pseudoroegneria, Roegneria and Elymus (Poaceae: Triticeae). Acta Pratcult. Sin. 18, 86–93.
Zhang, X. Q., and Yan, Q. (2000). Cytogenetic studies of hybrids of Roegneria ciliaris with R. alashanica and R. manicaespes (Poaceae :Triticeae). Acta Bot. Yunnan. 22, 155–160
Keywords: Elymus, altitude, genome size, flow cytometry, GISH
Citation: Chen Z, Guan Y, Han M, Guo Y, Zhang J, Guo Z, Sun G and Yan X (2022) Altitudinal Patterns in Adaptive Evolution of Genome Size and Inter-Genome Hybridization Between Three Elymus Species From the Qinghai–Tibetan Plateau. Front. Ecol. Evol. 10:923967. doi: 10.3389/fevo.2022.923967
Received: 20 April 2022; Accepted: 23 June 2022;
Published: 22 July 2022.
Edited by:
Rosane Garcia Collevatti, Universidade Federal de Goiás, BrazilReviewed by:
Sergio Alan Cervantes-Pérez, University of Nebraska-Lincoln, United StatesYuanting Jin, China Jiliang University, China
Copyright © 2022 Chen, Guan, Han, Guo, Zhang, Guo, Sun and Yan. This is an open-access article distributed under the terms of the Creative Commons Attribution License (CC BY). The use, distribution or reproduction in other forums is permitted, provided the original author(s) and the copyright owner(s) are credited and that the original publication in this journal is cited, in accordance with accepted academic practice. No use, distribution or reproduction is permitted which does not comply with these terms.
*Correspondence: Xuebing Yan, yxbbjzz@163.com
†These authors have contributed equally to this work and share first authorship