Environmental factors shaping copepod distributions in cave waters of the Lessinian unsaturated karst (NE-Italy)
 Ilaria Vaccarelli1,2
  Francesco Cerasoli1*
  Stefano Mammola3,4,5
  Barbara Fiasca1
  Mattia Di Cicco1
  Tiziana Di Lorenzo5,6 Fabio Stoch7
  Diana Maria Paola Galassi1
- 1Department of Life, Health and Environmental Sciences, University of L’Aquila, L’Aquila, Italy
- 2University Institute of Higher Studies in Pavia, Pavia, Italy
- 3Molecular Ecology Group (MEG), National Research Council of Italy (CNR), Water Research Institute (IRSA), Verbania, Italy
- 4Laboratory for Integrative Biodiversity Research (LIBRe), Finnish Museum of Natural History (LUOMUS), University of Helsinki, Helsinki, Finland
- 5National Biodiversity Future Center, Palermo, Italy
- 6IRET-CNR, Istituto di Ricerca sugli Ecosistemi Terrestri del CNR, Florence, Italy
- 7Evolutionary Biology and Ecology, Université Libre de Bruxelles, Bruxelles, Belgium
The unsaturated karst represents a transitional zone connecting the land surface to the water table of the underlying saturated zone through percolating water and small perched aquifers. It constitutes a significant groundwater reservoir and hosts a high biodiversity of specialized and endemic species. Whereas investigating this ecotone can shed light on the invertebrate diversity of the whole karst system, ecological studies in the unsaturated karst have been hampered by access, mapping, and sampling challenges. We studied the unsaturated zone of 52 caves in the Lessinian Massif (NE-Italy), which is dominated by carbonate rocks interspersed with spot areas composed mainly of igneous rocks. Our aim was to understand which ecological and historical factors may have shaped the distribution of the groundwater crustacean copepods at a regional spatial scale in the Lessinian unsaturated karst. We collected 33 species belonging to the orders Harpacticoida and Cyclopoida. Species richness estimators and related species accumulation curves suggest an exhaustive sampling effort. A hydrologic analysis performed in a Geographic Information System environment divided the study area in three distinct drainage basins: Eastern Lessini, Lessinian Core, and Western Lessini. Regression analyses indicated that richness of non-stygobitic copepods (i.e., surface-water species which exploit groundwater for different purposes) was mainly driven by inter-basin differences. Richness of stygobitic copepods (i.e., obligate groundwater dwellers) was instead strongly related to lithological features and responded negatively to surface thermal variability. Next, we used a kernel density estimation to spatially explore diversity patterns in the area. The highest density of stygobitic harpacticoids was identified in the Eastern Lessinian basin, which is lithologically more heterogeneous and surrounded by practically non-aquiferous igneous rocks that may limit dispersal. Conversely, the Western Lessinian basin hosted a high density of stygobitic cyclopoid species. This spatial pattern suggests different colonization pathways for the two taxa, with a strong effect of igneous rocks in hampering dispersal of most harpacticoids. Lithological barriers seemingly did not affect non-stygobitic copepods, which were found across the whole area. Altogether, these results emphasize the key role played by the interaction of hydrological features, climate, and lithology in determining different copepod biodiversity patterns in the unsaturated karst.
1. Introduction
Karstified areas are complex and spatially heterogeneous (Brancelj and Stoch, 2022). The upper karst layer, the epikarst, frequently supports perched aquifers which are fed by infiltrating rainwater or snow melting (Bakalowicz, 2019). In many areas of the world, the epikarst represents a substantial groundwater reservoir as it comprises almost permanently saturated zones storing a considerable volume of water (Bakalowicz, 2004; Aquilina et al., 2006). Since Mangin (1973) coined the term “epikarst” for the topmost layer of the karst (i.e., the one interposed between the overlying soil and the karst), several studies addressed its hydrogeological dynamics (Bakalowicz, 2004; Williams, 2008; Champollion et al., 2018) and the composition of its biotic communities (Camacho et al., 2006; Pipan and Culver, 2007a, 2007b; Galassi et al., 2009a; Pipan and Culver, 2013; Bruno et al., 2018; Pipan et al., 2018).
From an ecological perspective, the epikarst represents a transitional zone (ecotone) mediating matter and energy fluxes between the surface and the underlying karst (Pipan and Culver, 2005; Kogovšek, 2010). Indeed, water from the epikarst seeps out from crevices of the cave ceilings and walls, following the gravity flux of percolating water, conveying organic matter and organisms towards the vadose zones and deeper saturated layers (Pipan and Culver, 2007a,b; Bonacci et al., 2009). Yet, the difficulties of accessing the epikarst have always made its geographic and scientific exploration a challenge (Pipan et al., 2010). Given that the microcrevices in karstified rocks are not directly accessible, most research on its biodiversity relies on sampling the percolating waters from the cave ceiling, which may be collected in large and small rimstone pools, puddles, trickles, rivulets, or laminar water layers on rocks (Pipan et al., 2018). This indirect information prevents researchers from fully understanding the communities living in the epikarst, insofar as the species assemblages observed in the water bodies where percolating waters are conveyed may be only a glimpse of what truly dwells in the layers above.
Nonetheless, even the partial picture derived from indirect sampling suggests that unsaturated karstic habitats are a rich and valuable reservoir of biodiversity (Camacho et al., 2006; Pipan and Culver, 2007a,b, 2013; Galassi et al., 2009a,b; Bruno et al., 2018; Pipan et al., 2018), often rivaling that of flooded (saturated) karst (Pipan and Brancelj, 2004; Pipan and Culver, 2007b). Many of the species dwelling in the unsaturated karst are narrow-range endemics presenting unique adaptive traits to thrive in the small fractures of the karstic rock (Brancelj, 2009). In a sense, each fracture of the epikarst often represents an “island” (Itescu, 2019) where single populations evolved independently from the closest ones occurring in adjacent yet disconnected fractures. When these species finally drip down in the pools, trickles, puddles and rivulets in the unsaturated zone of the karst, they may appear to be mixed.
The copepods (Crustacea, Copepoda) represent the dominant taxon in this subterranean environment, and their species richness in the unsaturated karst can even double that of the saturated zones of karst aquifers (Pipan and Culver, 2013). At the regional scale, copepods may cover up to 50% of the total obligate groundwater fauna (hereinafter “stygofauna”) of the unsaturated karst, representing in some cases up to 20% of the species richness per cave (Pipan and Culver, 2007b).
Growing evidence suggests that long-term evolutionary processes and real-time ecological drivers are the dominant factors shaping biodiversity patterns in subterranean environments (Danielopol et al., 2000; Galassi, 2001; Zagmajster et al., 2014; Ribera et al., 2018; Mammola et al., 2020). On the one hand, paleogeographic events, aquifer connectivity and species dispersal ability may primarily dictate the extent of occurrence of the stygofauna at regional to continental scales. On the other hand, the availability and heterogeneity of (micro)habitats and species ecophysiology act as filters shaping distribution patterns at smaller spatial scales (Christman and Culver, 2001; Galassi et al., 2009a,b; Stoch and Galassi, 2010; Eme et al., 2014; Fattorini et al., 2016; Pipan et al., 2018; Mouron et al., 2022). Yet, the relative contribution of these different driving forces in determining distribution patterns remains debated.
For example, Iannella et al. (2020a) demonstrated that the European distribution patterns of stygobitic harpacticoid species are shaped by historical features, such the hydrogeological properties of the aquifers, including the lithology and the extent of the recharge area. On the other hand, previous findings indicated that contemporary factors, such as rainfall regime and thermal conditions, represented the primary drivers of the distribution of stygobitic and non-stygobitic copepods in karstic groundwaters in Western and Central Europe (e.g., Iepure et al., 2016). The diversity of copepod species in the unsaturated karst may be the expression of contemporary events, such as rainfall infiltrations that promote the periodical arrival in cave environments of both non-stygobitic species and organic matter coming from the surface, and stygobitic species that are dislodged from the inaccessible part of the epikarst and accumulate in drips and pools (Culver et al., 2009; Bruno et al., 2018).
To attain a perspective about the contemporary and historical factors driving the present-day distribution of copepods from the unsaturated karst of the Central-Eastern Alpine region in Europe, we analysed the copepod assemblages of the Lessinian Massif (northeastern Italy, Figure 1). The massif is a hotspot of groundwater biodiversity in Central-Eastern Europe, harboring many stygobitic and non-stygobitic copepod species, most of which are endemic to the unsaturated karst (Ruffo and Stoch, 2006; Galassi et al., 2009a; Bruno et al., 2018). We estimated the richness of stygobitic and non-stygobitic harpacticoids and cyclopoids in fifty-two caves across the Lessinian Massif, mapping their distribution and exploring a set of historical (e.g., lithology) and contemporary (e.g., temperature and precipitation annual averages) environmental factors potentially shaping their species richness patterns. We predict that the richness of non-stygobitic copepods, both cyclopoids and harpacticoids, should be primarily explained by contemporary factors, while a combination of historical and contemporary factors should have more influence on the stygobitic copepods as well as on the overall richness of copepod assemblages (i.e., stygobitic and non-stygobitic combined).
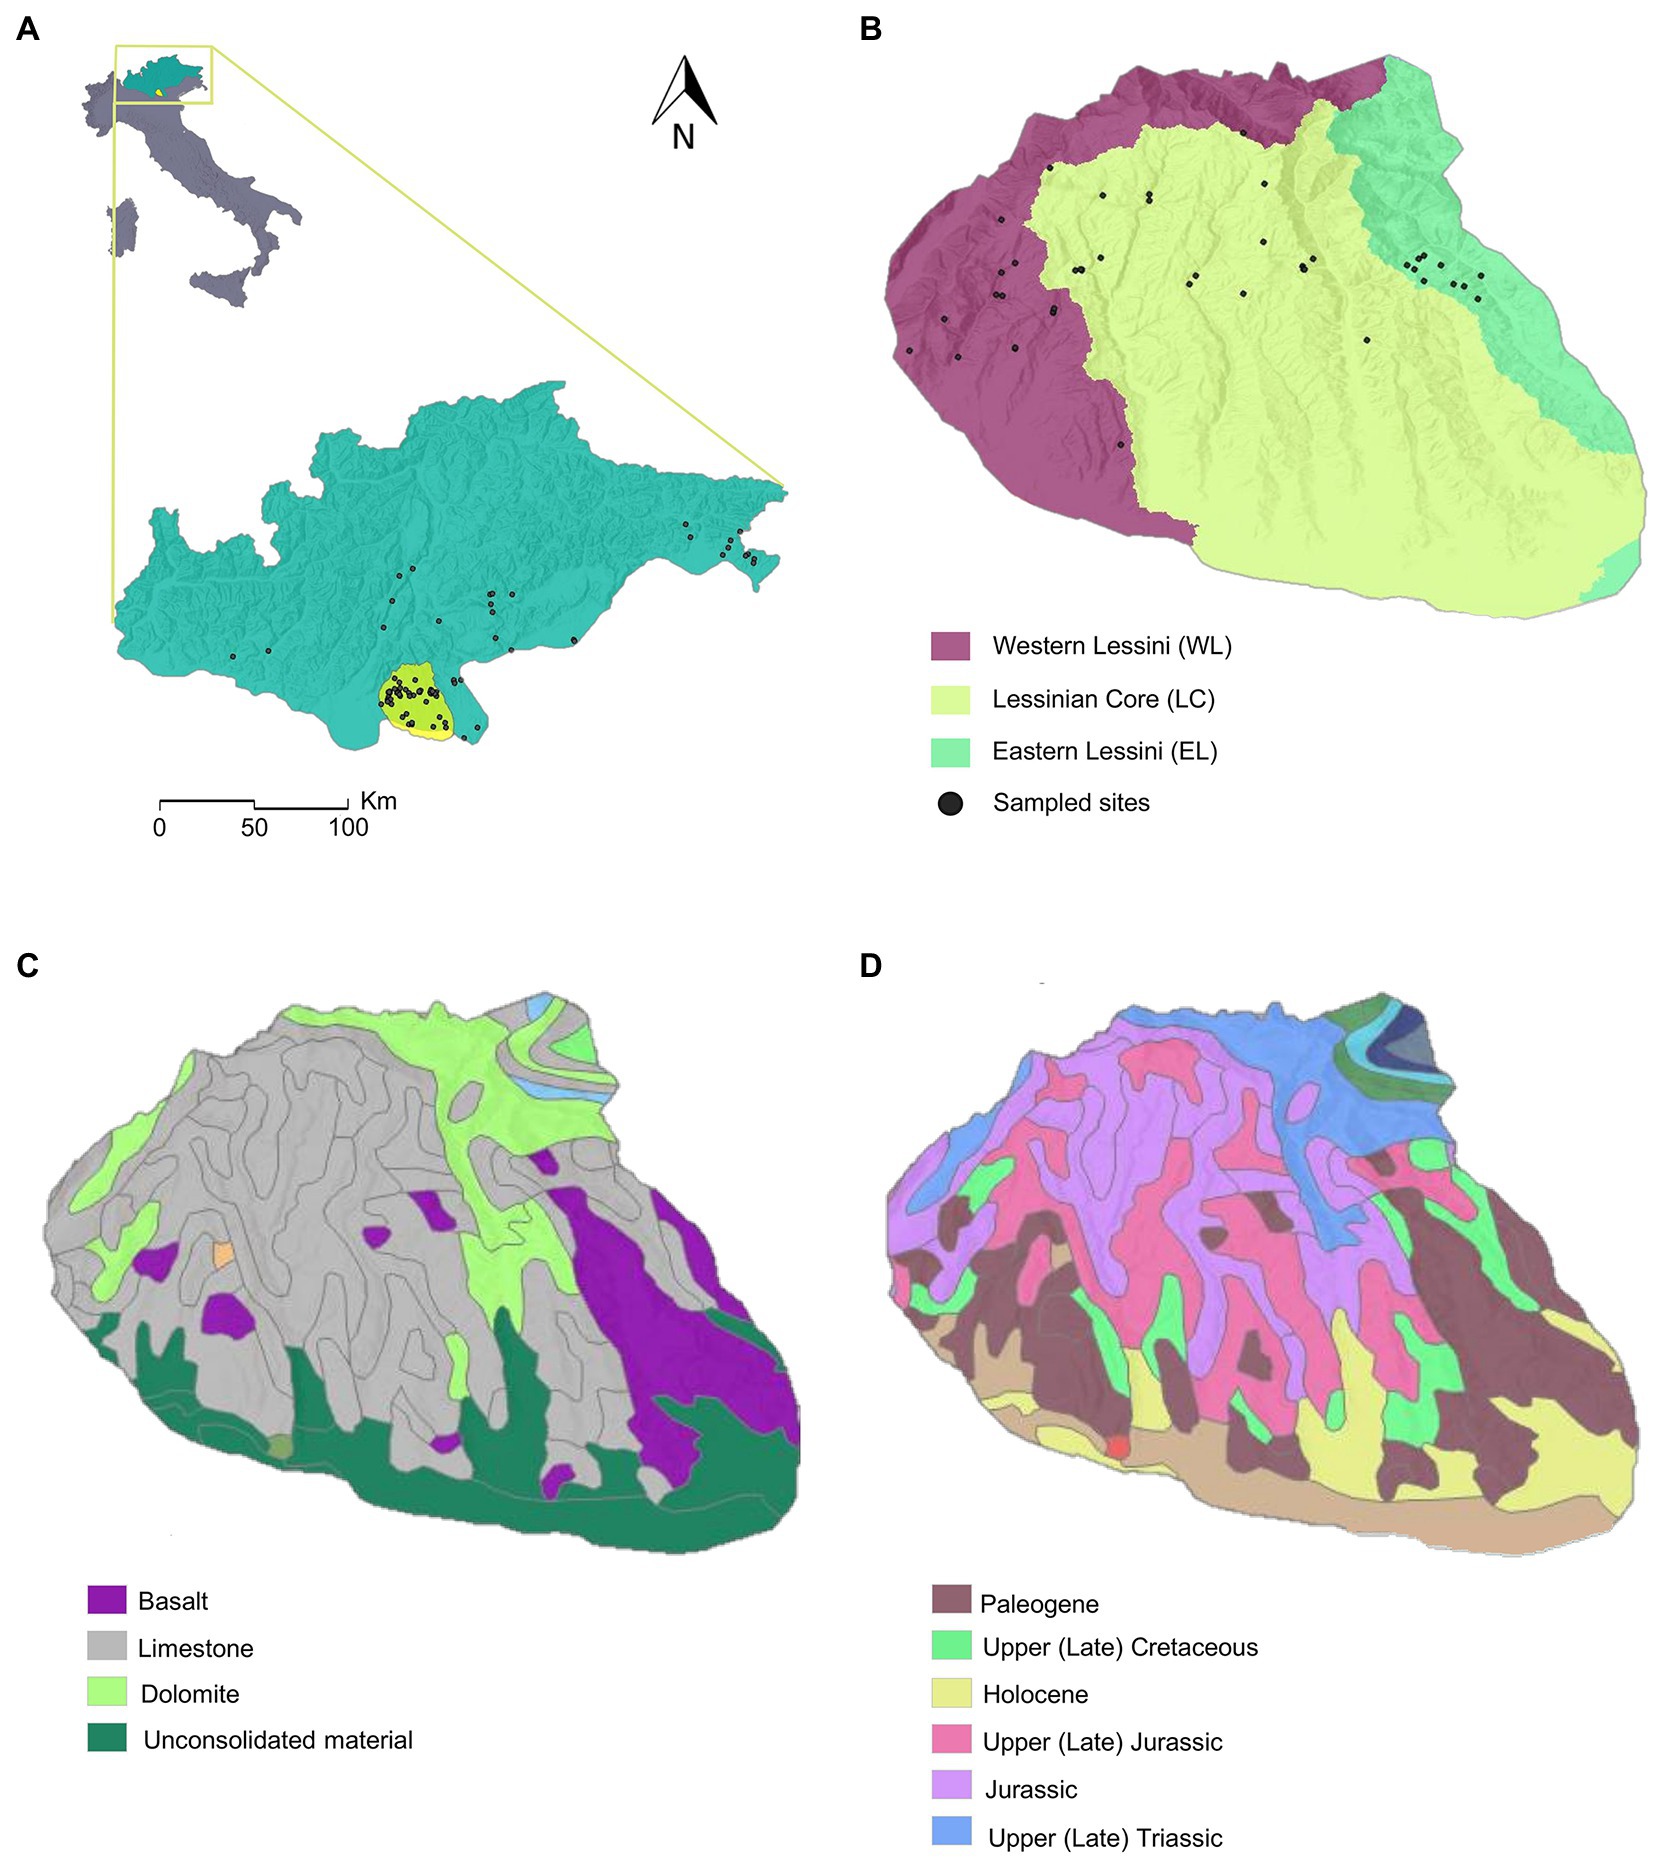
Figure 1. Study area and hydrogeologic maps. (A) Central-Eastern Alpine Stygoprovince, with the Lessinian Massif highlighted in yellow; (B) Lessinian Massif with the three main drainage basins as derived in ArcGIS Pro 2.8; (C) map of the main lithologies; (D) map of the lithological ages. In (A) and (B) sampled sites are represented by black dots.
2. Materials and methods
2.1. Study area
The Lessinian Massif has an extension of about 800 km2, and rises up to 1865 m a.s.l. The geological structure of the massif is mainly described by carbonate rocks of Cretaceous and Jurassic ages in the northern part. Eocene limestone is primarily located in the southern part of the massif, while outcrops of igneous rocks are predominantly located in the eastern part (Giusberti et al., 2020). The carbonate succession is crossed by basaltic veins and necks (due to volcanic activity dating back to the Paleogene) which emerge mainly near the resurgences Covolo dell’Acqua and Cave “C” of Veja. Tectonic structural and fluvial morphology prevails on the surface. Quaternary alluvial deposits overlay the carbonate bedrock in a complex system of large ridges diverging from North to South which are separated by deep valleys (Patrizi, 2001).
The groundwater flows in N-W to S-E directions. The studied caves host unsaturated karstic waters, and the saturated deep aquifers are mainly distributed in the southernmost part of the Lessinian Massif and at the borders with the alluvial plain of the River Adige (Patrizi, 2001). The hydrologic regime of the Lessinian Massif is mostly governed by meteoric events. Infiltrating rainfall flows through the vadose zone of the karst massif and reaches the deep, saturated aquifers; the contribution of melting snow is important only for caves with higher elevation.
The landscape of the Lessinian Massif shows an apparent contrast between the not-very-evident surface karst morphology and the karst hydrology (fluvial karst) which can be explained by the presence of a dense network of fractures and faults (tectokarst) draining the water towards the deepest portions of the carbonate massif (Giusberti et al., 2020).
2.2. Sampling
In 2002, we sampled the unsaturated zone of karst aquifers of fifty-two caves (Supplementary material Table S1). Caves are located at a latitude between 45.49 °N and 45.70 °N and at a longitude from 10.86 °E to 11.24 °E (Figure 1). The elevation of the caves ranged from a minimum of 195 m a.s.l. (“Spluga del Torrente” cave) to a maximum of 1,564 m a.s.l. (“Buso da Neve della Gaibana” cave). We collected faunal samples in different cave microhabitats following the protocol by Malard et al. (2002). In an attempt to get a representative sample of the biota, we sampled each microhabitat at least twice. We filtered vadose waters dripping from cave ceilings using a plankton net (60-μm mesh size) and a funnel. We sampled rimstone pools with small hand pumps and larger puddles, rivulets, and cave streams by sieving sediments through a hand net (60-μm mesh size). Finally, we used baited traps to collect carnivorous species from larger pools and small siphons in caves.
We preserved biological samples in 80° ethyl alcohol. We sorted specimens under a Leica M205C stereomicroscope. We categorized each species as stygobitic (obligate groundwater dweller) and non-stygobitic (surface freshwater species found in groundwater habitats). We selected the Crustacea Copepoda as the target taxon for the analyses because they represented about 50% of the collected species, followed by the Oligochaeta (35%) and Amphipoda (10%), the other species belonging to Diplostraca, Syncarida, Isopoda, and Mollusca which were collected with only a few species.
We identified the Crustacea Copepoda at the species/subspecies level using taxonomic keys (Borutzky, 1952; Dussart, 1967, 1969; Boxshall and Halsey, 2004; Wells, 2007) and additional specialized literature.
2.3. Data analysis
2.3.1. Sampling effectiveness
We used the R package “vegan” version 2.5.7 (Oksanen et al., 2022) to check whether our sampling campaigns allowed us to collect a representative sample of the Lessinian copepod assemblages. Specifically, we estimated the number of potentially unobserved species (based on incidences in sampled sites) through the “specpool” function, considering the Chao, first-order Jackknife and Bootstrap non-parametric estimators. The number of observed species was then compared to the maximum and minimum number of estimated species (respectively calculated as , and ). Subsequently, we generated accumulation curves through the “specaccum” function, using the Chao estimator and 10,000 random permutations.
2.3.2. Historical and contemporary drivers of alpha diversity
We assessed copepod alpha diversity considering: (i) total copepod species richness (SR_Tot); (ii) richness of stygobitic (SR_Sb) and non-stygobitic (SR_nSB) copepods separately; (iii) richness of stygobitic (SR_Cyclo_Sb) and non-stygobitic (SR_Cyclo_nSb) species of Cyclopoida; (iv) richness of stygobitic (SR_Harpa_Sb) and non-stygobitic (SR_Harpa_nSb) species of Harpacticoida. We explored a set of environmental drivers potentially shaping the copepod diversity, including contemporary (present climatic conditions) and historical factors (the drainage basin the single caves fall in, altitude of the caves, distance of the sampling sites from the surface, and lithology).
We ran all statistical analyses in the R environment version 4.2.0 (R Core Team, 2022). We implemented Generalized Linear Models (GLMs) with Poisson distribution and log-link function to assess to what extent the above-mentioned different realizations of copepod alpha diversity (response variables) were influenced by variability across the sampled caves (explanatory variables). First, we ran a hydrologic analysis in ArcGIS Pro 2.8 using the “Hydrology” toolset available in the ArcGIS Spatial Analyst extension, to model the water flow across a surface from a digital elevation model (DEM). The “Hydrology” tools focus on the movement of water across a surface, returning the drainage basins of a given surface, namely the total area flowing to a given outlet, or pour point (i.e., the lowest point at which water flows out of an area) (ESRI Inc., 2021). The result is the delineation of the boundaries among different watersheds (or basins). This tool allowed us to divide the study area into three discrete drainage basins: Eastern Lessini, Lessinian Core, and Western Lessini (Figure 1).
We included elevation (derived from a Digital Elevation Model with 10 meters cell resolution; Tarquini and Nannipieri, 2017) and the distance of the cave sampling site from the surface as continuous explanatory variables. In mountainous areas, elevation may provide information on the degree of groundwater recharge by snow melting and possibly on groundwater temperature (Castellarini et al., 2007), despite this mostly holds when limiting the analyses to relatively small study areas (Mammola and Leroy, 2018). Furthermore, elevation is a proxy of habitat heterogeneity. Distance of the sampling site from the surface is a proxy of several ecological gradients within a cave (Mammola, 2019), including light intensity, food availability (Gibert and Deharveng, 2002; Culver et al., 2009; Mammola et al., 2019a), and thermal variability (Badino, 2010). Drainage basin (three levels: Eastern Lessini – EL, Lessinian Core – LC, and Western Lessini – WL, with “EL” representing the baseline level), and lithology (two levels: “calcareous” versus “mixed,” with “calcareous” representing the baseline level) were treated as categorical explanatory variables. By including the drainage basin as an explanatory variable in the model, we were able to discuss the influence of paleogeographical processes and spatial factors (e.g., aquifer isolation) on the observed variability of copepod alpha diversity in the Lessinian Massif. Further, the main lithological features of a certain area were recently shown to strongly affect the richness and composition of copepod assemblages at regional to continental scales (Pipan and Culver, 2007b; Hahn and Fuchs, 2009; Stein et al., 2012; Cornu et al., 2013; Iepure et al., 2017; Iannella et al., 2020a,b). We generated lithological data by cropping to the study area the lithological map of Italy downloaded from the geo-portal of the Italian Ministry of the Environment and Energy Security.1 Finally, we included surface climatic conditions as contemporary explanatory variables, using gridded climate surfaces (30 arc-sec cell resolution, corresponding to ~1 km2) stored in the Worldclim 2.1 (Fick and Hijmans, 2017) online repository.2 Specifically, out of the nineteen bioclimatic variables available from Worldclim 2.1, we chose annual mean temperature (Bio01), isothermality (Bio03), and annual mean precipitation (Bio12) as candidate climatic predictors. Bio01 and Bio12 provide information on how surface climate averages affect the overall underground environmental conditions, Bio03 is mostly related to how surface thermal variability influences the microclimate of the upper portion of subterranean systems (Mammola and Leroy, 2018).
Prior to model fitting, we carried out data exploration following the protocol by Zuur et al. (2010). First, we visually inspected the distribution of both response and explanatory variables, as well as the presence of outliers. We also computed the percentage of zeros for each response variable to evaluate potential issues associated with zero-inflation. Next, we assessed multicollinearity among continuous explanatory variables by calculating the Variance Inflation Factor (VIF) with the “usdm” package version 1.1–18 (Naimi et al., 2014). We retained only those variables attaining a VIF score < 3 (Zuur et al., 2010).
We used this refined set of explanatory variables to fit GLMs, with species richness values representing the response variables. To facilitate algorithm convergence, we scaled all continuous predictors (i.e., ). Moreover, considering the low sample size (n = 52), we used a maximum of three explanatory variables, without interactions, for model fitting to fulfill the general rule of thumb of having at least 10 observations for each parameter to be estimated in a regression model (Zuur et al., 2009). Initially, we fitted a separate model for each possible combination of three predictors out of the retained ones and selected the model with the lowest corrected Akaike’s Information Criterion (AICc) value. We further refined the selected model by sequentially dropping each predictor in turn and testing the statistical significance of the withheld term via likelihood ratio test (considering value of p ≤ 0.05 as threshold) and inspection of the variation in the AICc value (Zuur et al., 2009). The models resulting from this backward variable selection step, which are hereinafter termed “refined GLM(s)”, were then evaluated in terms of summary statistics (estimated values and corresponding standard error of the beta coefficients for the retained fixed effects) and explained variance (Nagelkerke’s R2) using the package “performance” version 0.9.2 (Lüdecke et al., 2021). Finally, we validated the refined GLMs through the package “DHARMa” version 0.4.5 (Hartig, 2022), checking for possible residual autocorrelation and overdispersion issues. Specifically, we used the “simulateResiduals” function to simulate new observations from the fitted model, which we then compared to observed data to derive scaled residuals. We repeated this process 500 times and visually inspected the resulting quantile-quantile plot (Q-Q plot) and scatterplot of scaled residuals. In case overdispersion or uniformity issues were detected, we fitted again the corresponding GLM considering the same set of predictors but with a negative binomial distribution instead of the Poisson one. We repeated the validation procedure to check whether the issue was solved. We plotted model marginal responses with the package “sjPlot” version 2.8.11 (Lüdecke, 2022). For the richness dimensions showing drainage basin as a significant predictor in the corresponding GLM, we applied a Wilcoxon signed-rank test with Benjamini and Hochberg (1995) value of p correction to test differences in observed richness within each pair of basins.
2.3.3. Kernel density
Kernel Density Estimation (KDE) represents a non-parametric approach to estimate a probability density function. KDE produces a smooth empirical probability density function based on individual locations of all sample data (Węglarczyk, 2018). This technique allows delimiting the zones with a high or low element concentration per unit area according to the location of records and the spatial proximity among the investigated features. We computed the default search radius for the input dataset composed of the recorded species, and the sample data were weighted according to the species richness values. We adopted a spatial variant of Silverman’s Rule of Thumb (Silverman, 1986) that is robust enough for smoothening probability densities affected by spatial outliers (Heidenreich et al., 2013).
We implemented KDE in ArcGIS Pro 2.8 to assess the spatial density of occurrence of copepod species belonging to the orders Cyclopoida and Harpacticoida, with also an in-depth analysis on the harpacticoid genus Lessinocamptus which is represented by species being endemic to the Lessinian caves. We ran the analysis both at the regional scale represented by the Lessinian Massif and at the broader spatial scale encompassing the whole Central-Eastern Alpine biogeographic unit, a biogeographic province including also the Lessinian Massif (Stoch, 2008). When upscaling the KDE to the Central-Eastern Alpine biogeographic unit, the species investigated were those recorded in the 52 sampled Lessinian caves plus additional records of the same species coming from caves and other habitats (e.g., springs and wells) across the biogeographic unit (Ruffo and Stoch, 2006). We chose to extend the study area while keeping the same target species found in the Lessinian groundwaters to check if the overall density patterns underwent variations at a coarser scale.
3. Results
3.1. Sampling effectiveness
We recorded thirty-three species of Copepoda (10 Cyclopoida and 23 Harpacticoida) across the 52 caves sampled in the Lessinian Massif (Supplementary material Table S2); among the recorded species, 15 (3 Cyclopoida and 12 Harpacticoida) were stygobitic. Speocyclops infernus was by far the most widespread species, occurring in 34 caves, while six species (Diacyclops sp.I7, Tropocyclops prasinus, Pilocamptus pilosus, Hypocamptus carpaticus, Lessinocamptus caoduroi, and Lessinocamptus sp.I1) occurred in just one cave (Supplementary material Table S2).
Overall, our sampling effort appeared to be sufficiently effective as observed total species richness represented between 79.7% (considering the first-order Jackknife estimator) and 87.8% (when using Bootstrap) of the maximum estimated richness (Supplementary material Table S3). The highest potential deficit of recorded species appeared for Cyclopoida based on the Chao estimate, mainly due to its relatively high standard error (Supplementary material Table S3). The Chao-based accumulation curve obtained for the cyclopoids reached an asymptotic value of 10 recorded species after 40 sites (Supplementary material Figure S1) while more sites (~48) were needed to approach the asymptote for the harpacticoids, suggesting this group is more elusive.
3.2. Alpha diversity patterns
The hydrologic analysis performed in the GIS environment divided the Lessinian area into three discrete basins. Out of the 52 sampled caves, 16 belonged to the eastern basin (Eastern Lessini), 25 to the Lessinian Core and the remaining 11 to the western basin (Western Lessini).
The caves located in the western basin hosted a higher total copepod species richness (SR_Tot), as well a higher richness of stygobites (SR_Sb) and non-stygobites (SR_nSb) analyzed separately, compared to the other two basins (Figure 2).
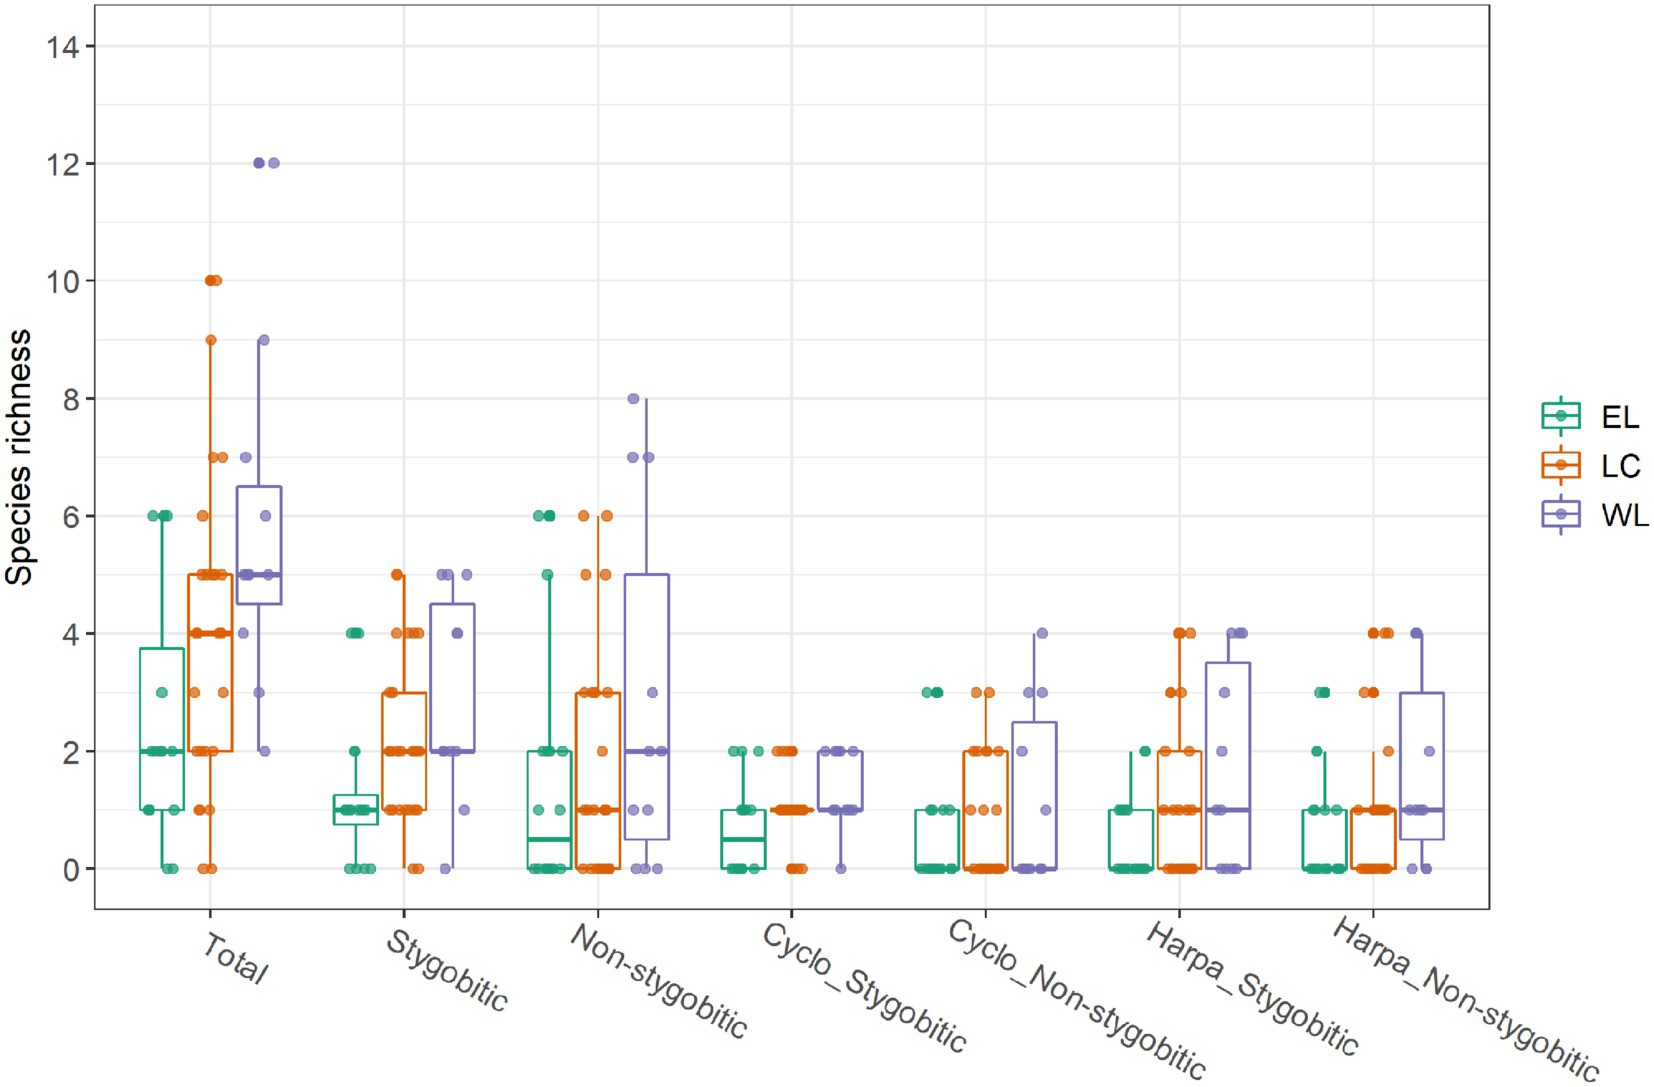
Figure 2. Taxonomic richness across the caves sampled from the three basins (Eastern Lessini – EL; Lessinian Core – LC; Western Lessini – WL), considering overall copepod species richness (Total); richness of stygobitic or non-stygobitic copepod species; richness of stygobitic (Cyclo_Stygobitic) or non-stygobitic (Cyclo_Non-stygobitic) species belonging to Cyclopoida; richness of stygobitic (Harpa_Stygobitic) or non-stygobitic (Harpa_Non-stygobitic) species belonging to Harpacticoida.
The three basins did not apparently differ in the considered environmental variables except for isothermality (Bio03) which was noticeably lower in the occurrence localities of the caves belonging to Western Lessini (Supplementary material Figure S2). “Buso da Neve della Gaibana” cave belonging to the Eastern Lessinian basin showed outlier values for all the continuous environmental predictors except distance of sampling site from surface (DistToSurf), so we decided to exclude it from the following statistical analyses (Supplementary material Figure S2). As for the distribution of the response variables, richness of stygobitic (SR_ Harpa _Sb) and non-stygobitic (SR_ Harpa _nSb) Harpacticoida, along with richness of non-stygobitic Cyclopoida (SR_Cyclo_nSb) equaled 0 in most caves (Supplementary material Figure S3). However, given that zero-inflated Poisson models fitted to the data yielded the same significant predictors and comparable effect sizes to the Poisson GLMs (analysis not shown), we decided not to apply zero-inflated models.
The explanatory variables driving most of the multicollinearity in the environmental dataset were annual mean temperature (Bio01) (VIF score = 20.7) and elevation (VIF score = 15.0); once excluded, the three remaining continuous variables (i.e., Bio03, Bio12, and DistToSurf) had all VIF scores <3. Table 1 summarizes, for each response variable (i.e., richness dimension), the three explanatory variables included in the initial GLM (i.e., the model selected among the competing ones based on AICc).
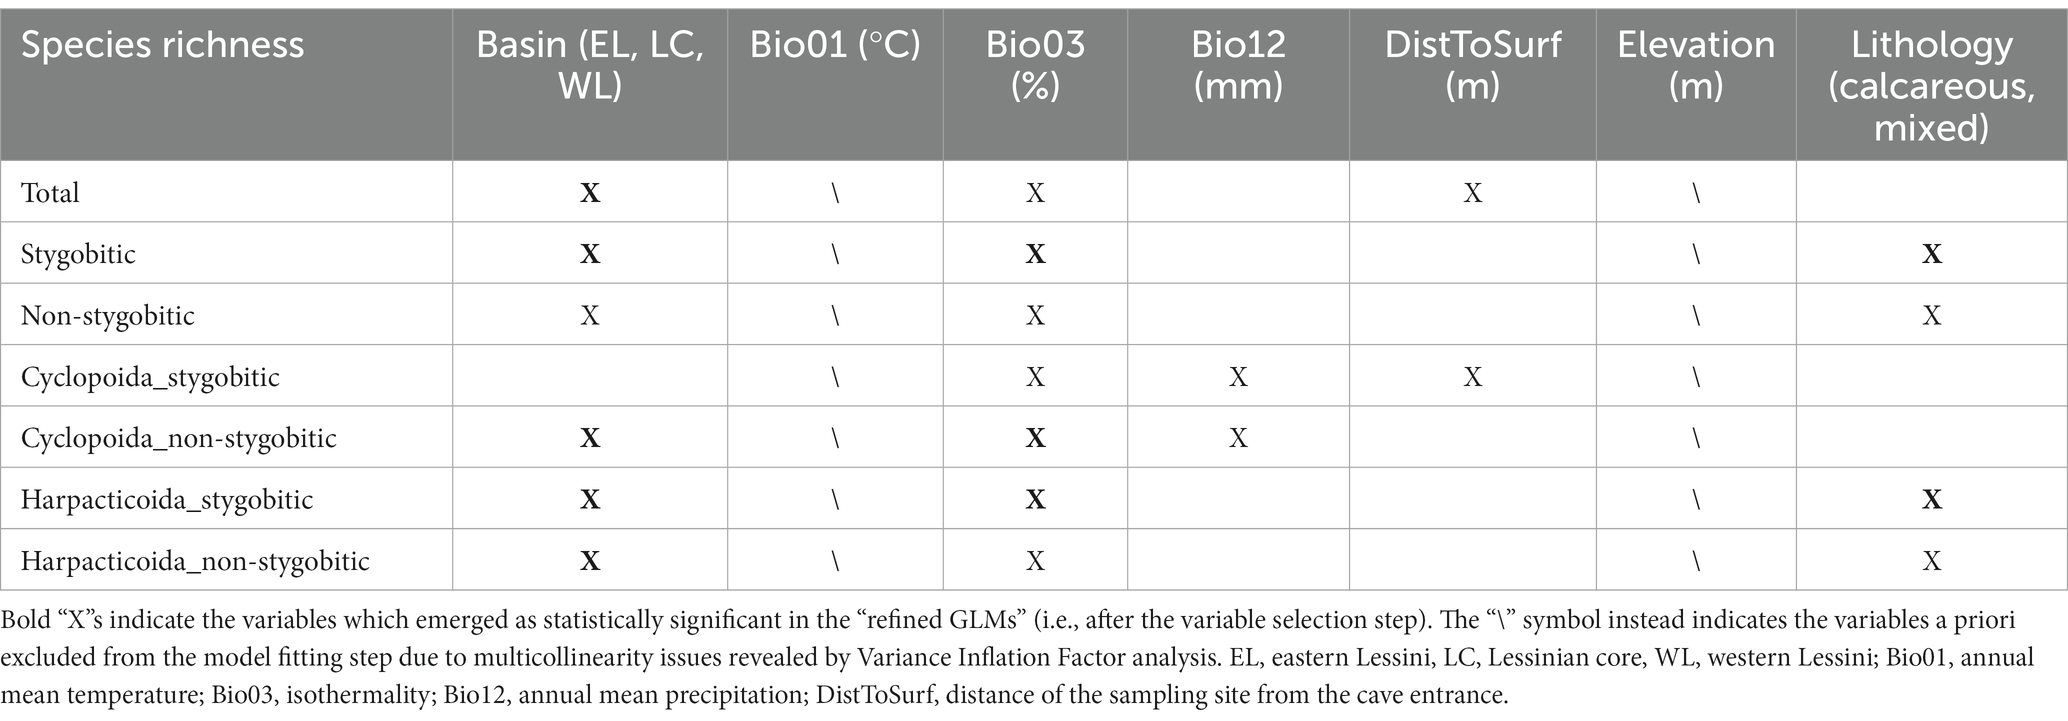
Table 1. The explanatory variables selected to fit the initial Generalized Linear Model (i.e., prior to the backward variable selection) for each of the alpha diversity dimensions (i.e., total species richness, richness of stygobites, richness of non-stygobites etc.) are indicated with “X”.
Following model selection, the refined GLM fitted with SR_Tot as response variable retained only the basin as predictor. However, simulation-based validation showed that this model was affected by overdispersion of residuals (dispersion = 1.638, value of p = 0.006 in the DHARMa non-parametric dispersion test). Thus, we refitted the model assuming a negative binomial distribution, which solved the overdispersion issue (dispersion = 0.976, value of p = 0.458). In this final model, the Western Lessini showed significantly higher predicted total species richness than the Eastern Lessini (Table 2; Supplementary material Figure S4).
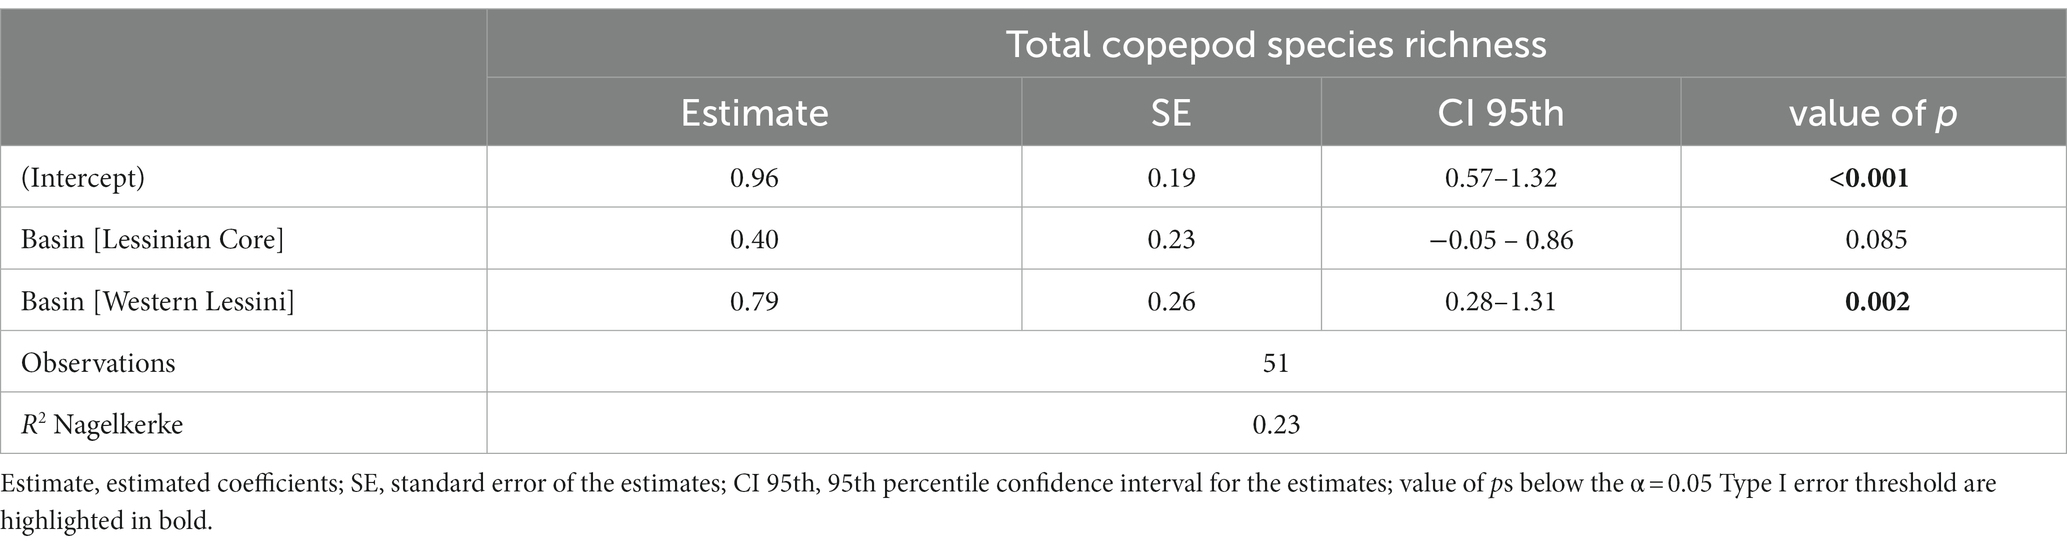
Table 2. Results from the refined Generalized Linear Model relating overall copepod species richness to the drainage basin the sampled caves belong to.
Differently, the refined GLM fitted using species richness of stygobites (SR_Sb) as response variable included, along with basin, isothermality (Bio03) and lithology as influential predictors. According to this model, which shows a relatively high explained variation (R2 = 0.55), richness in stygobites is higher in the Lessinian Core than in the eastern basin, higher in areas with mixed lithology, and negatively related to isothermality (Table 3; Figure 3).
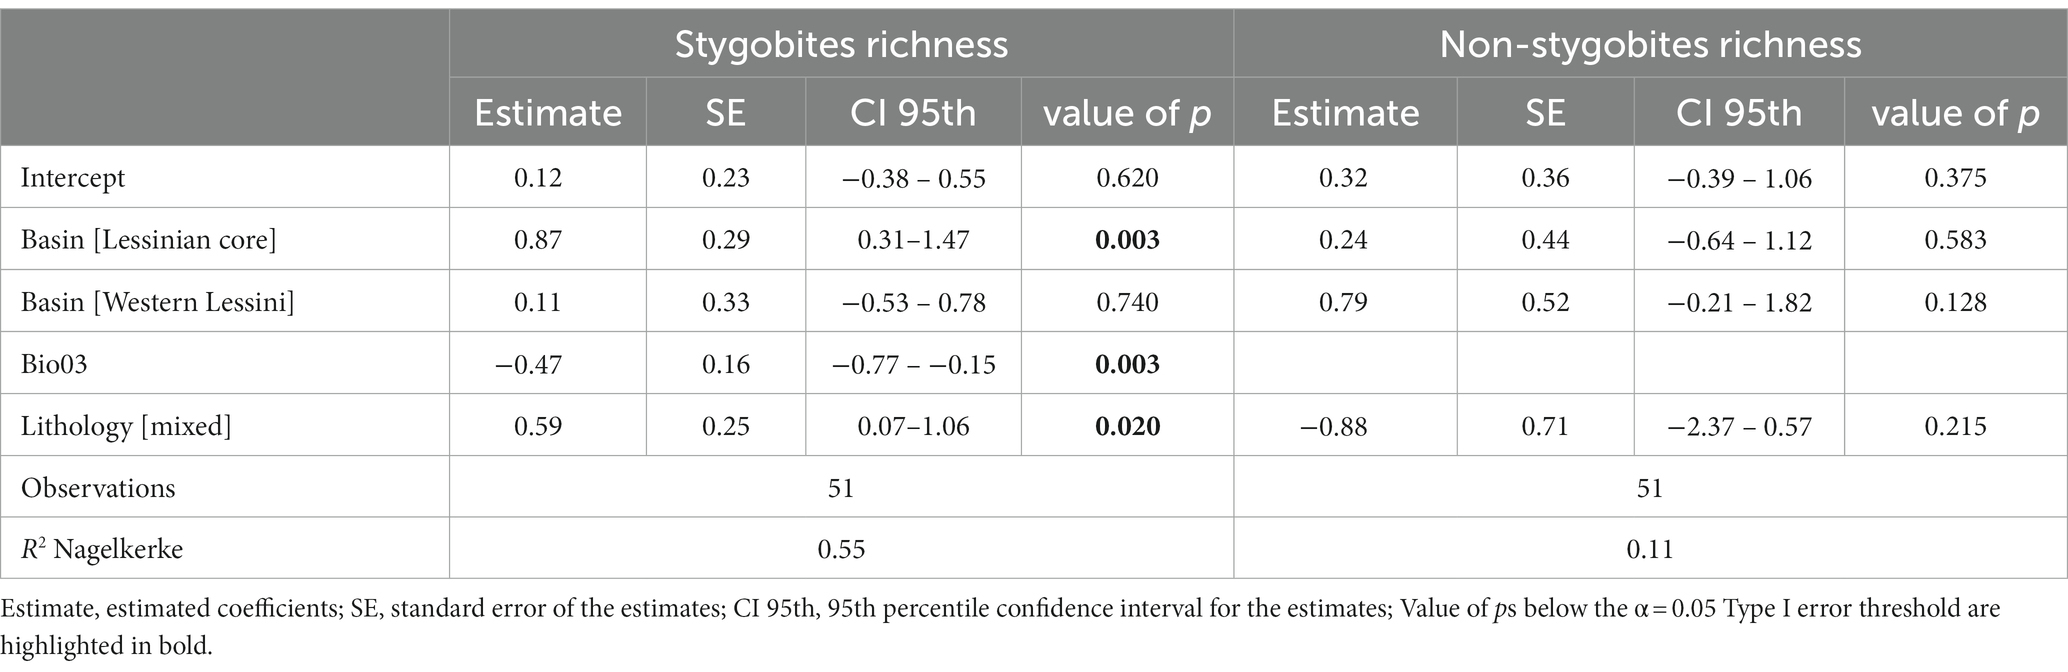
Table 3. Results from the refined Generalized Linear Model relating species richness of stygobitic (left) and non-stygobitic (right) copepods to the drainage basin the sampled caves belong to, isothermality (Bio03) and lithology.
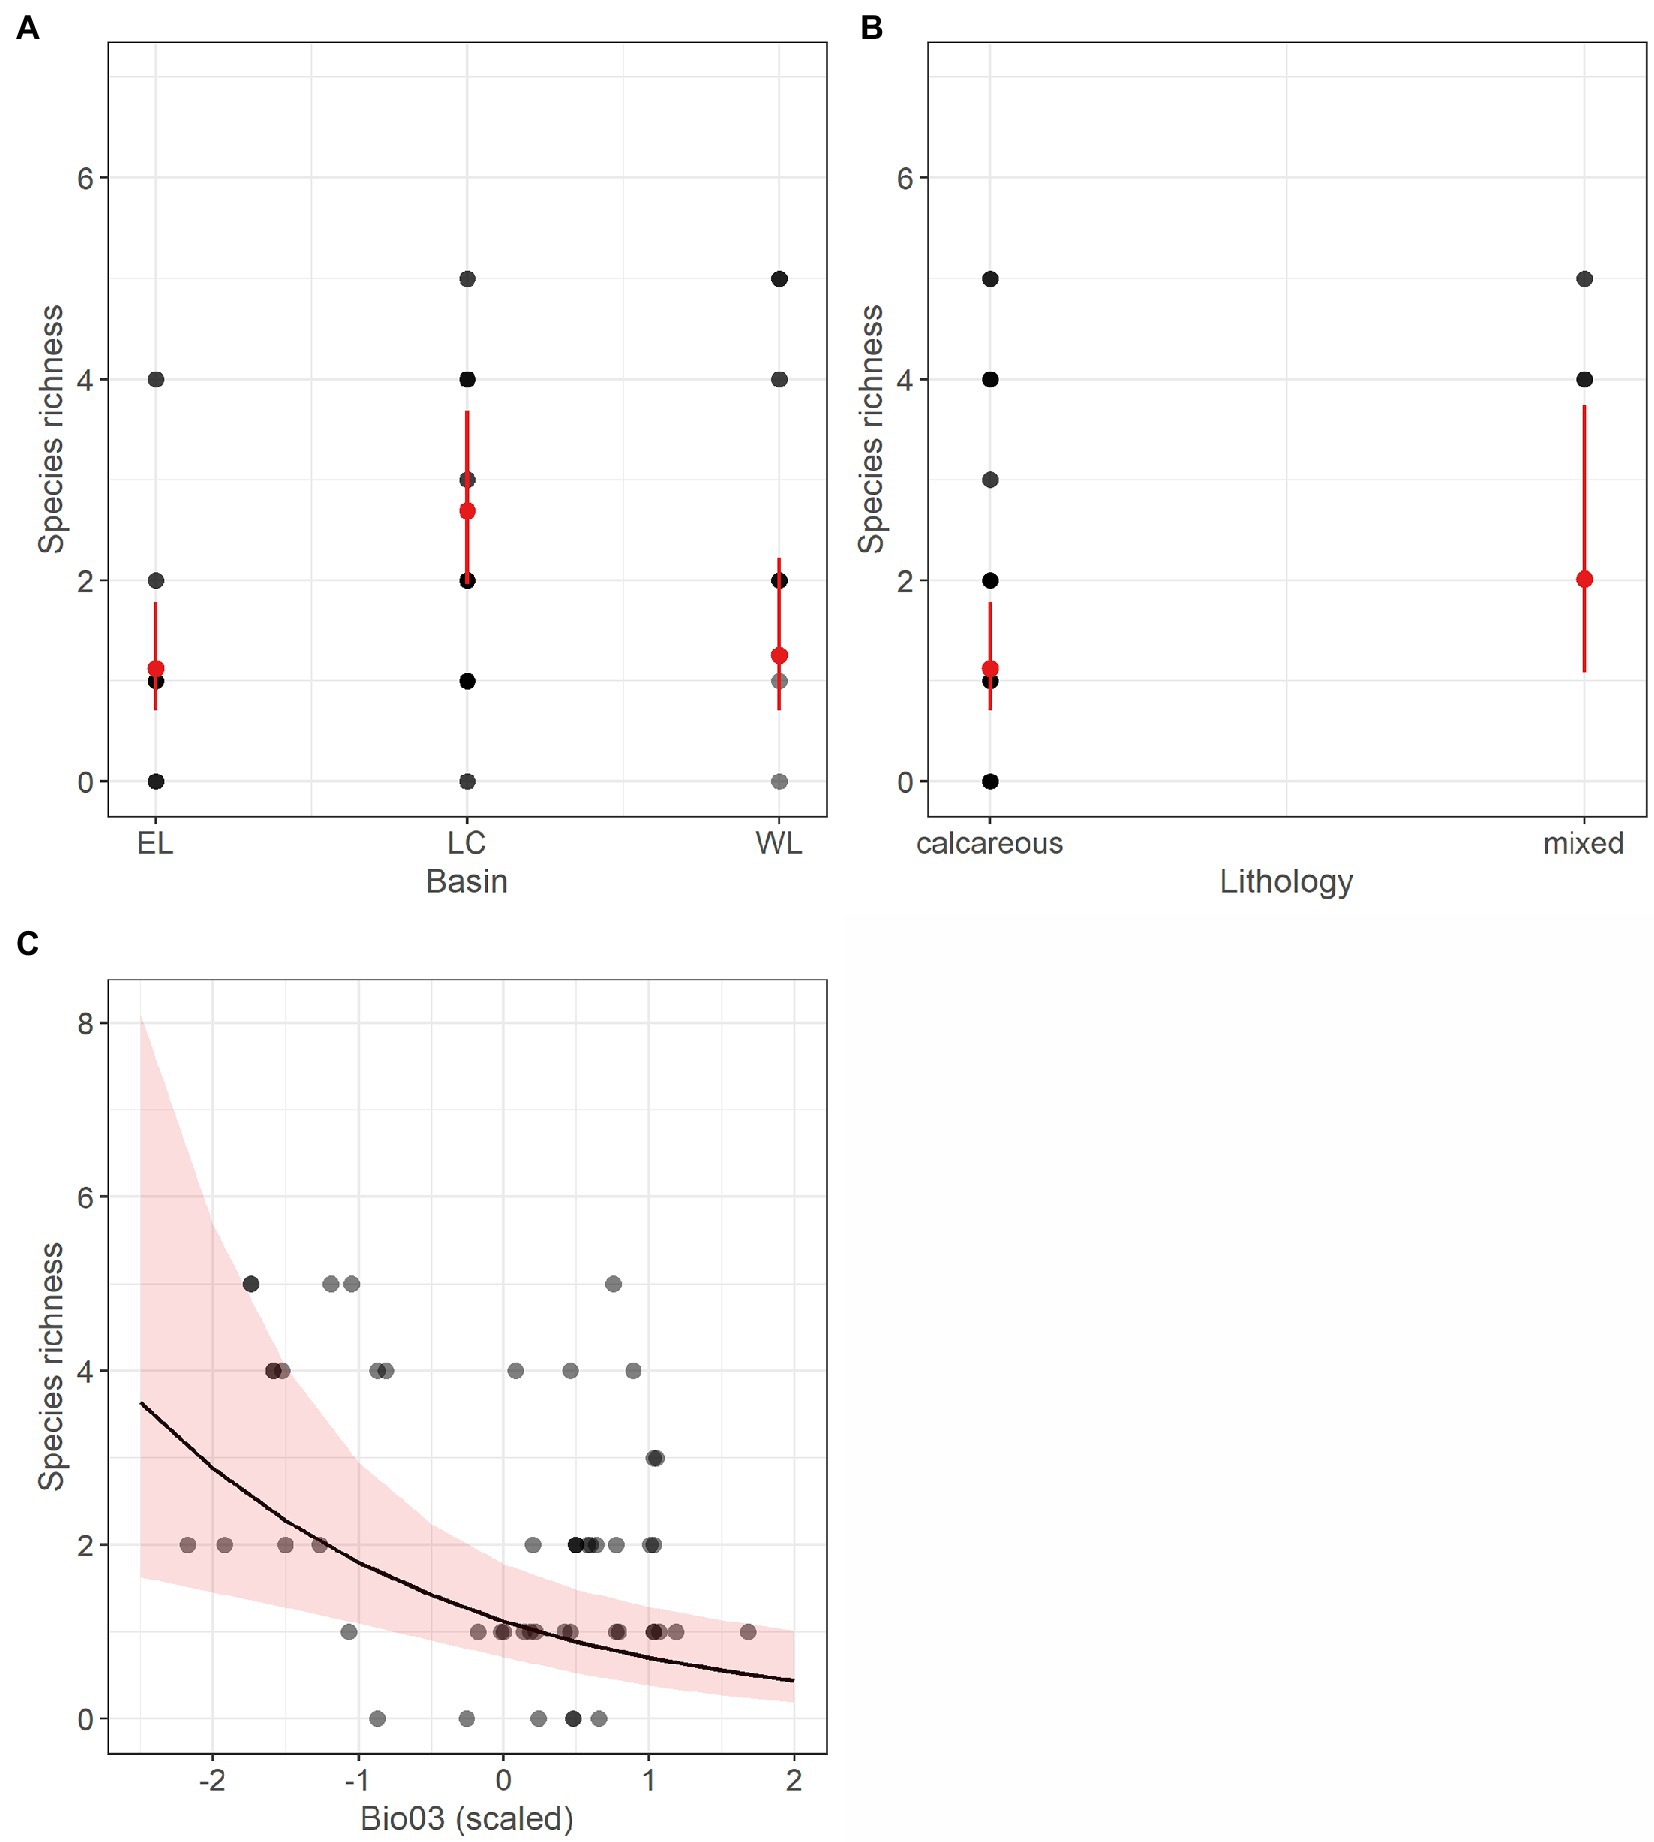
Figure 3. Marginal response plots showing the effect of drainage basin (A), lithology (B) and scaled isothermality (Bio03) values (C) on predicted species richness of stygobitic copepods, as resulting from the corresponding Generalized Linear Model. In (A) and (B), red dots and related bars show predicted values and the corresponding 95th percentile confidence interval. In (C), the black curve corresponds to predicted marginal response with the surrounding shaded area representing the 95th percentile confidence interval. In all the three plots, grey-scale dots represent observed values, with darker dots indicating multiple observations with the same richness value.
The refined GLM obtained for richness of non-stygobites (SR_nSb), which included basin and lithology as predictors, showed both non-uniformity (One-sample two-sided Kolmogorov–Smirnov test: D = 0.214, value of p = 0.016) and overdispersion (dispersion = 2.559, value of p <0.001). Once the model was refitted using negative binomial distribution, both non-uniformity (D = 0.089, value of p = 0.781) and overdispersion (dispersion = 0.976, value of p = 0.458) disappeared, so we present in Table 3 only summary statistics for the latter model. In this model, neither basin nor lithology appeared to significantly influence SR_nSb, and the overall explanatory power is low (R2 = 0.11).
Likewise, the GLM fitted with richness of stygobitic Cyclopoida (SR_Cyclo_Sb) as response variable had low explanatory power (R2 = 0.07) and the beta coefficient estimates were not statistically significant for any of the retained predictors (Bio12, Bio03, DistToSurf); thus, we do not discuss it further. Differently, the refined GLM obtained for richness of non-stygobitic Cyclopoida (SR_Cyclo_nSb) retained basin and isothermality as influential predictors and showed a higher explained variation (Table 4). Specifically, predicted SR_Cyclo_nSb was significantly higher in the Western Lessini, and richness appeared to be positively related to isothermality (although with wide uncertainty around model fit; Figure 4).
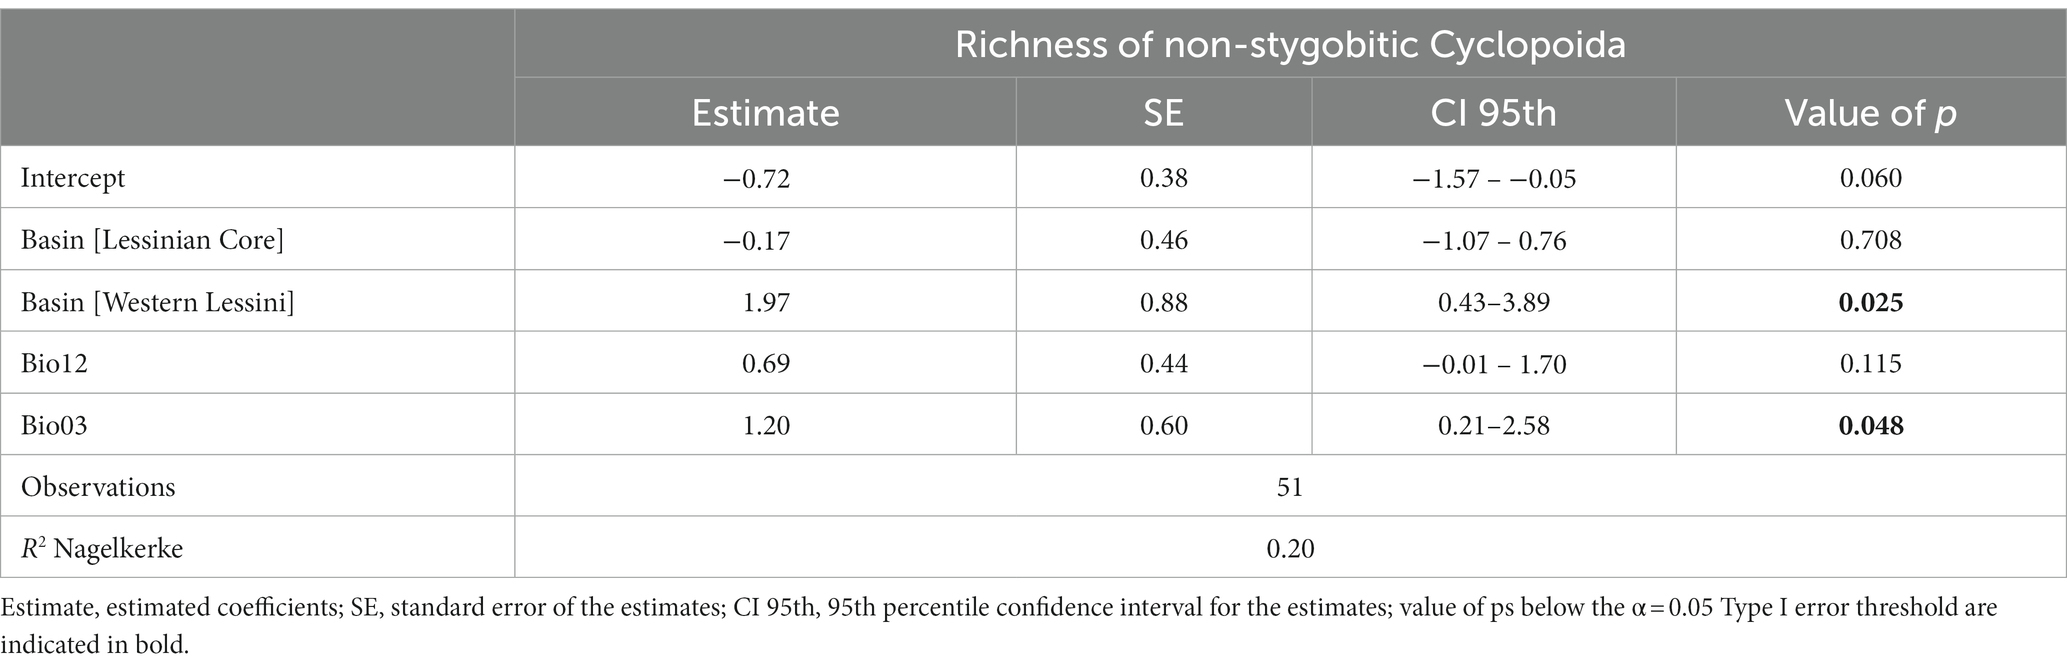
Table 4. Results from the refined Generalized Linear Model relating species richness of non-stygobitic Cyclopoida to the drainage basin the sampled caves belong to, isothermality (Bio03) and annual precipitation (Bio12).
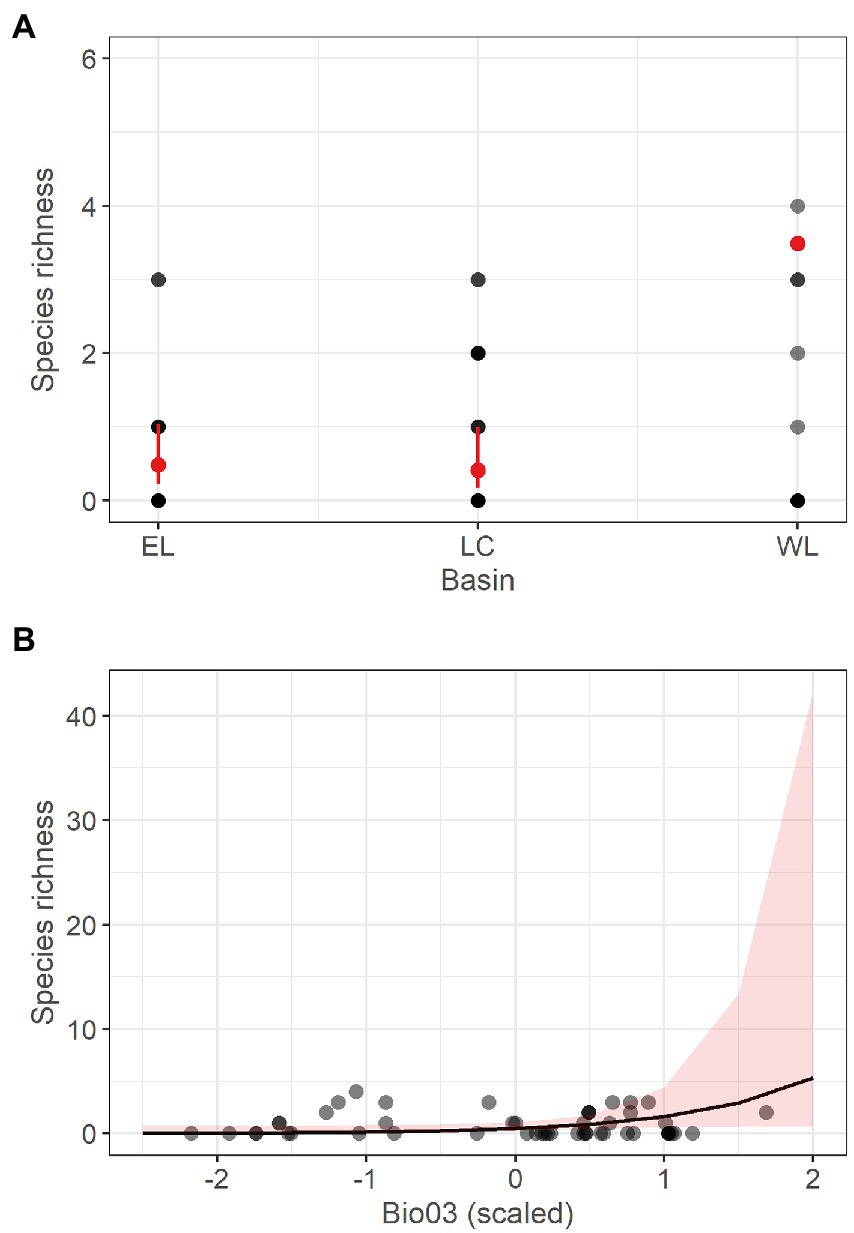
Figure 4. Marginal response plots showing the effect of drainage basin (A) and scaled isothermality (Bio03) values (B) on predicted species richness of non-stygobitic Cyclopoida, as resulting from the corresponding Generalized Linear Model. In (A), red dots and related bars show predicted values and the corresponding 95th percentile confidence interval. In (B), the black curve corresponds to predicted marginal response with the surrounding shaded area representing the 95th percentile confidence interval. In both plots, grey-scale dots represent observed values, with darker dots indicating multiple observations with the same richness value.
Species richness of stygobitic Harpacticoida (SR_Harpa_Sb) appeared to be significantly related to drainage basin, with the Lessinian Core showing higher predicted richness than Eastern Lessini (Table 5; Figure 5A). Moreover, SR_Harpa_Sb responded positively to mixed lithology and negatively to increasing isothermality (Table 5; Figures 5C,D), mirroring the patterns already emerging for total stygobitic species richness, to which Harpacticoida contributed noticeably more than Cyclopoida (Supplementary material Figure S3). The refined GLM obtained for richness of non-stygobitic Harpacticoida (SR_Harpa_nSb), retaining only basin as influential predictor, showed slightly significant overdispersion in model residuals (dispersion = 1.491, value of p = 0.04). When the model was fitted again using negative binomial distribution, overdispersion was solved (dispersion = 0.976, value of p = 0.458); nonetheless, the model still showed low explanatory power (R2 = 0.13), only predicting higher species richness for the Western Lessinian basin compared to the Eastern Lessinian one (Table 5; Figure 5B).
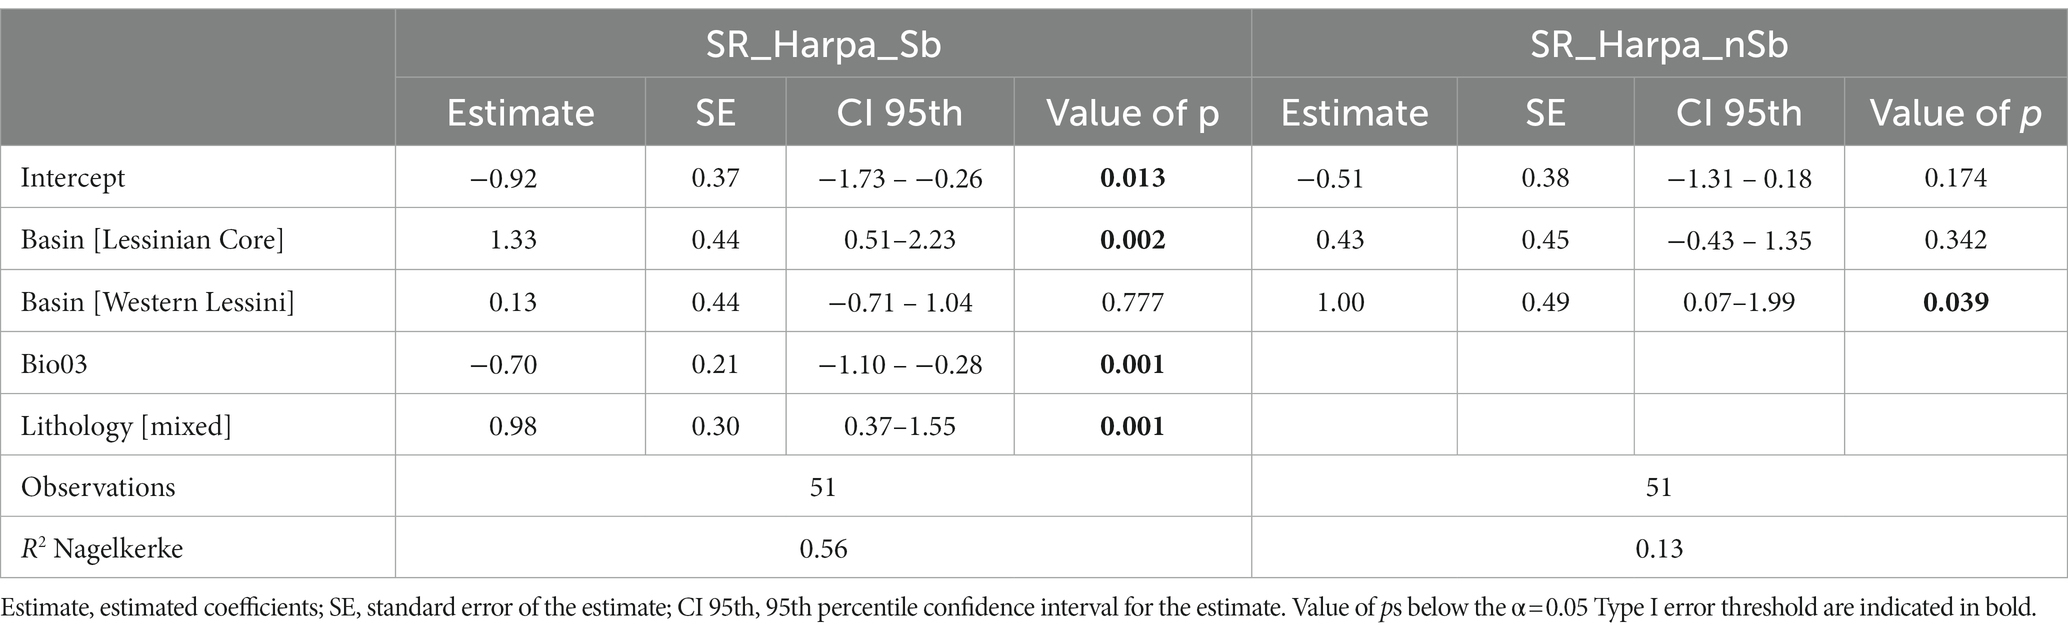
Table 5. Results from the refined Generalized Linear Model (GLM) relating species richness of stygobitic Harpacticoida (SR_Harpa_Sb) to drainage basin, isothermality (Bio03) and lithology, and from the refined GLM relating species richness of non-stygobitic Harpacticoida (SR_Harpa_nSb) to basin only.
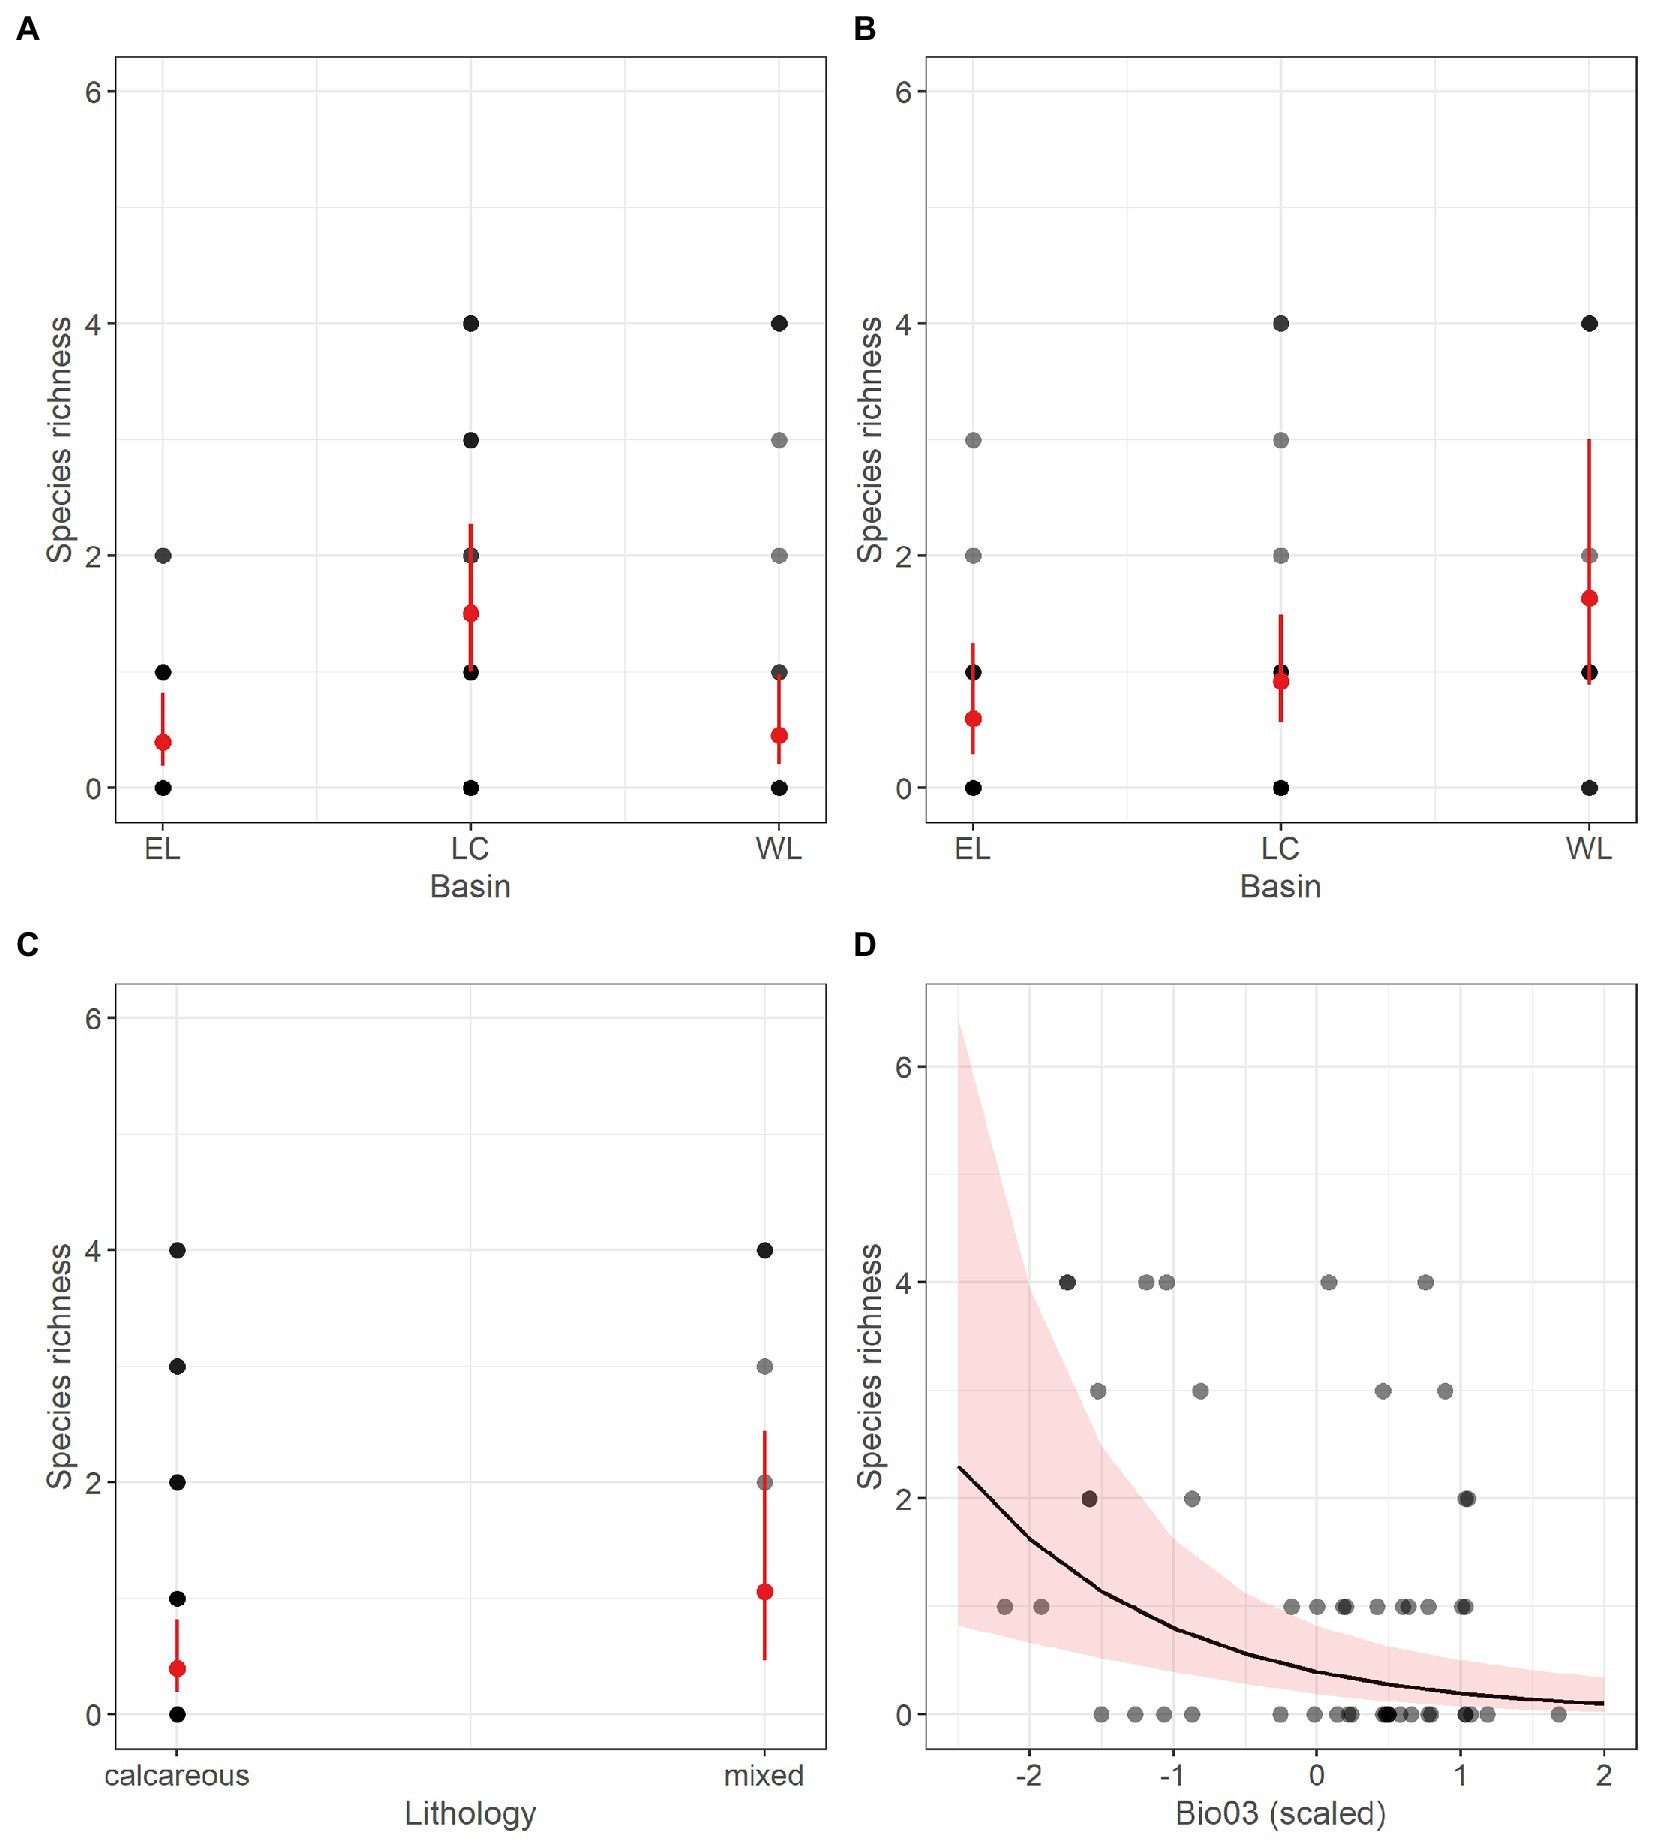
Figure 5. Marginal response plots showing the effect of drainage basin (A), lithology (C) and scaled isothermality (Bio03) values (D) on predicted species richness of stygobitic Harpacticoida, as well as the effect of drainage basin on richness of non-stygobitic Harpacticoida (B), as resulting from the respective Generalized Linear Models. In (A), (B) and (C), red dots and related bars show predicted values and the corresponding 95th percentile confidence interval. In (D), the black curve corresponds to predicted marginal response with the surrounding shaded area representing the 95th percentile confidence interval. In all the plots, grey-scale dots represent observed values, with darker dots indicating multiple observations with the same richness value.
The Wilcoxon signed-rank tests showed that inter-basin differences in observed richness were clearly significant only for total species richness and richness of stygobites, with Western Lessini hosting significantly more species than Eastern Lessini, and both Western Lessini and Lessinian Core being significantly richer in stygobites than Eastern Lessini (Supplementary material Table S4).
3.3. Kernel density patterns
The density clusters of both harpacticoid and cyclopoid species were located almost at the midpoint of the Lessinian Massif. For the non-stygobitic copepods, the KDE revealed, for both harpacticoids and cyclopoids, two separate density clusters falling within the Eastern Lessinian and Western Lessinian basins, while a very low-density band stretched across the Lessinian Core (Figure 6).
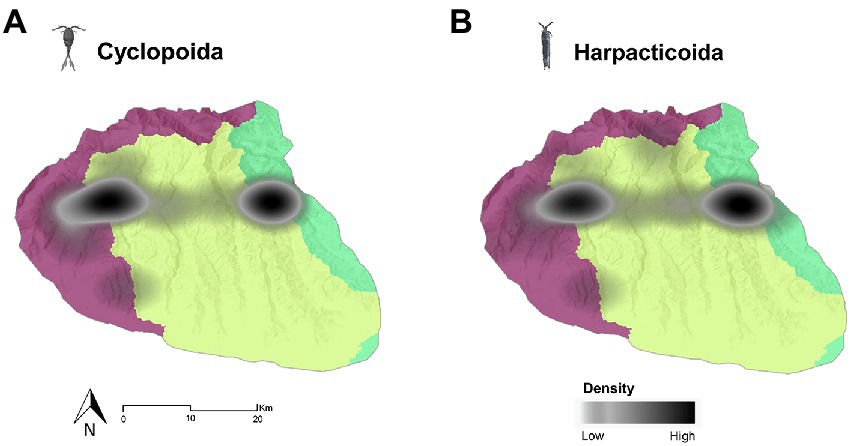
Figure 6. Kernel density estimation maps of the non-stygobitic cyclopoid (A) and harpacticoid (B) copepods species richness across the Lessinian Massif. The different colours of the base map layer represent the three distinct drainage basins (Western Lessini in purple, Lessinian Core in light green, and Eastern Lessini in bright green).
The highest density of stygobitic cyclopoids (Figure 7A) was detected in Western Lessini and Eastern Lessini and, to a lesser extent, at the boundary between the Lessinian Core and Eastern Lessini. Nevertheless, the estimated densities of the stygobitic cyclopoids could have suffered from some uncertainties due to the scarcity of species records (only three species: S. infernus, Diacyclops italianus and Diacyclops sp. I7).
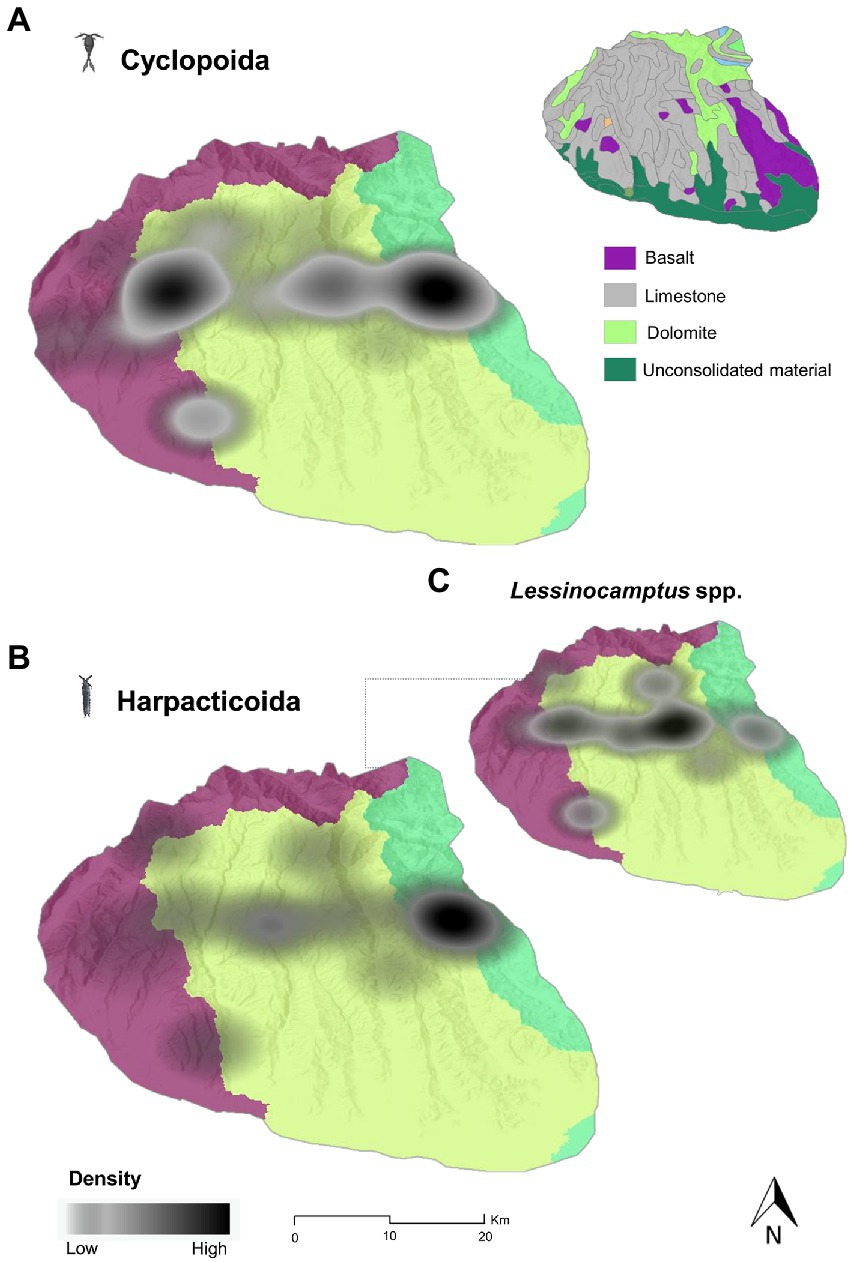
Figure 7. Kernel density estimation maps of the stygobitic cyclopoid (A) and harpacticoid (B) copepods species richness across the Lessinian Massif, with a focus on the harpacticoid genus Lessinocamptus (C). The different colours of the base map layer represent the three distinct drainage basins (Western Lessini in purple, Lessinian Core in light green, and Eastern Lessini in bright green).
The highest density of stygobitic harpacticoids (Figure 7B) was found within Eastern Lessini, with a lower-density extension to the Lessinian Core, thus suggesting a higher connection between the surface drainage basins and their respective karstic perched aquifers, and a higher occurrence of this group into the perched aquifers. Interestingly, the harpacticoid genus Lessinocamptus had the highest probability density in the Lessinian Core, thus showing spatial density patterns partially decoupled from the overall spatial distribution of the harpacticoids (Figure 7C).
From the KDEs performed at the broader spatial scale (Central-Eastern Alpine biogeographic unit), we obtained two additional density maps for stygobitic cyclopoids and harpacticoids (Supplementary material Figure S5).
Out of the 12 recorded stygobitic harpacticoid species, 10 contributed to the obtained density clusters: Ceuthonectes serbicus, Elaphoidella pseudophreatica, Elaphoidella sp. I1, Lessinocamptus caoduroi, Lessinocamptus insoletus, Lessinocamptus pivai, Moraria sp. I1, Moraria stankovitchi, Paramorariopsis sp. I1, Parastenocaris sp. I4. Among the stygobitic cyclopoids, only two out of the three recorded species were included in all the obtained KDE clusters, namely S. infernus and D. italianus.
Overall, considering such a broader spatial scale, the KDE performed for the cyclopoids resulted in two more extensive and relatively uniformly distributed clusters (departing from the Eastern Lessinian and Western Lessinian basins along the Lessinian Core belt). Differently, KDE for the harpacticoids returned a smaller density cluster confined at the easternmost boundary of the Lessinian Massif (Supplementary material Figure S5), showing a more pronounced shift towards East than in the KDE performed for the Lessinian area taken alone (see Figure 7B).
4. Discussion
Despite scientific research in the subterranean domain is growing, the epikarst still represents one of the most challenging systems to study due to its inaccessibility and ecological heterogeneity (Bonacci et al., 2009). Indeed, it may be considered a “grey box” (sensu Ford and Williams, 2007) because it is not directly accessible to sampling and, at the same time, it hosts narrowly endemic and specialized species.
The first evidence emerging from our study is that the species richness of the copepod assemblages of the Lessinian unsaturated karst is mainly described by the drainage basin (historical factor). The Western Lessinian basin hosted significantly higher total copepod species richness, as well as more stygobitic copepod species, than the Eastern Lessinian basin, which appeared to be also significantly poorer than the central Lessinian Core in the number of stygobitic copepods. These findings suggest that the effect of the historical factor related to the drainage basin operated at small scales, so that distinct karstic aquifers located in the same region but differing in palaeogeographic and paleoclimatic conditions host different copepods assemblages.
Further, the lithological composition of the bedrock (historical factor) explained additional variability of stygobitic copepod richness, with mixed lithology determining greater species richness values. The stygobitic harpacticoids, in particular, showed a spatial distribution which was mostly condensed in the eastern basin and to a lesser extent in the central Lessinian Core. The eastern basin is the one with the highest degree of mixed lithologies where the calcareous rocks enter in contact with igneous, practically non-aquiferous rocks. At the regional scale, our analysis supports the results by Iannella et al. (2020a), who mapped hotspots of stygobitic harpacticoid biodiversity at the European scale. The authors have found the highest values of stygobitic harpacticoid species richness mainly associated with aquifers in consolidated rocks or at the boundaries with practically non-aquiferous rocks. In the latter environments, stygobitic species richness tends to decrease rapidly because igneous rocks are nearly impermeable, and few species can live in the small fractures of this groundwater habitat type (Cornu et al., 2013; Iannella et al., 2020b): igneous rocks are thus a barrier to copepod dispersal (Iannella et al., 2020a,b). The mixed lithology of the eastern basin, with calcareous and dolomitic rocks interspersed with fractured igneous rocks, may have provided higher microhabitat heterogeneity favoring the settlement of stygobitic harpacticoids and cyclopoids.
Other studies (Kogovšek and Šebela, 2004; Moldovan et al., 2012; Liu et al., 2017) suggested that the amount of collected specimens and recorded taxa in the unsaturated karst depends on the intensity of water flow and the size and interconnections within the drainage basin of single dripping sites into the same cave. Speculatively, areas with higher precipitations should favour the filling of crevices and fractures of the epikarst, and the subsequent gravity flux down to the cave ceilings and finally into the drips, pools and rivulets (Di Lorenzo et al., 2018). Nevertheless, mean annual precipitation proved to be uninformative in explaining the spatial distribution of copepods’ richness at the small regional scale encompassing our sampled caves. Conversely, significant relationships emerged when considering the contemporary factor related to temperature and alpha diversity of stygobitic versus non-stygobitic copepods. First, the richness of stygobitic copepods was negatively related to isothermality, suggesting more conservative and narrower thermal requirements compared to non-stygobitic species (see Mammola et al., 2019b for an overview). Since depth-dependent temperature differences linked to thermal seasonality do exist among groundwater (micro)habitats, where the highest variability can be observed for shallow subterranean habitats (Pipan and Culver, 2019), the negative response of stygobites to increasing surface isothermality may be related to the strong adaptation of such species to relatively stable conditions over long time scales. On the other hand, considerable thermal variability could give access to caves to a variety of copepod species showing greater thermal tolerance if compared to the stygobitic counterpart, based on the principle that local adaptation to more seasonally variable temperatures selects for generalist species with broad thermal requirements (Stevens, 1989). The latter hypothesis is somewhat corroborated by the positive, yet feeble, response of non-stygobitic cyclopoids to isothermality (contemporary factor).
All the density cores of copepod alpha diversity emerging from the Kernel Density Estimation are located along the mid latitude “longitudinal belt” of the Lessinian Massif’s sampled area. This raises questions as to whether this pattern could be an effect of further historical factors such as the Quaternary glaciations, which partially affected only the northernmost part of the Lessinian Massif (Galassi et al., 2009a). In this regard, Stoch (2000) noticed a high degree of endemism among stygobitic species in the caves of Northern Italy and speculated that deep karstic fissures may have served as refuges for the aquatic fauna during the Quaternary glaciations, in line with what has been argued by Galassi (2001), Galassi et al. (2009a), and by Rouch (1986) for caves located in southern France. Interestingly, similar distribution patterns influenced by glaciation cycles have been observed in other alpine terrestrial subterranean groups, including harvestmen (Mammola et al., 2019c), microwhip scorpions (Mammola et al., 2021), and beetles (Assmann et al., 2010). The marginal location of the Lessinian caves with respect to the Würmian glacier borders and the extensive networks of fractures in the vadose zone of the Lessinian karst may indeed have allowed stygobites to move deep in the Lessinian karst to seek refuge during cold periods, later recolonizing ancestral habitats after the glaciers retreated (Galassi et al., 2009a).
Non-stygobitic cyclopoids and harpacticoids, along with stygobitic cyclopoids, had high densities in the eastern and western basins with largely overlapping density cores, while showing a density gap in the Lessinian Core. The highest densities of stygobitic harpacticoids were found in the eastern part of the Lessinian Massif, although the stygobitic species of the harpacticoid genus Lessinocamptus had the highest incidence in the Lessinian Core. According to Galassi et al. (2013), the harpacticoid L. insoletus and the cyclopoid S. infernus, which are among the species recorded in the present study, can be considered indicative of specific karst aquifer types, likely preferring carbonate rocks. This agrees with what we observed in our study area because the central and western basins are mostly characterized by an alternation of limestone and dolomites, differently from the eastern basin, which includes igneous rocks. Moreover, the Lessinian Core, where the denser cluster of Lessinocamptus species occurs, hosts the most ancient lithological formations (Late Triassic), while most of the western basin is of Jurassic age. Finally, the eastern basin where most of the stygobitic harpacticoids are clustered is predominantly composed of Cretaceous and Paleogene lithologies. The different ages of the rocky formations characterising the different basins may give support for a more or less ancient karstification process, especially in the area where Lessinocamptus species were found, a condition which may have led to independent evolutionary histories of the corresponding species assemblages. When upscaling the KDE to the Italian Central-Eastern Alpine region, the previously highlighted density patterns were generally confirmed. First, the high-density patches of stygobitic cyclopoids appeared more “stretched” along the west–east belt, although maintaining two disjunct density cores in the eastern and western basins, respectively. Secondly, a hyperdense cluster of stygobitic harpacticoids remained almost unchanged in the area enclosed between the eastern Lessinian basin and its border with igneous rocks.
5. Conclusion
Our findings confirm that the Lessinian unsaturated karst represents a unique source of groundwater biodiversity, where the Eastern Lessinian basin is a precious trove of stygobitic harpacticoids. According to our preliminary hypotheses, the alpha diversity patterns of stygobitic copepods were described by a combination of historical and contemporary factors, mainly drainage basin and lithology (historical factors) and surface temperature variability (contemporary factor). Contrary to what we expected, the alpha diversity of non-stygobitic copepods was shaped by both types of factors. In detail, the GLMs and the KDE suggested the presence of a “basin effect,” including hydrological setting and isolation of the perched aquifers feeding the unsaturated karst, which may have influenced past dispersal events. The concurrent existence of a “lithological effect”, leading to environmental heterogeneity and to a “dispersal wall” at the eastern sector of the Lessinian Massif, may have favoured the coexistence of species with different microhabitat preferences (Brancelj and Stoch, 2022). The negative response of stygobitic species richness to surface thermal variability, which did not emerge instead for the non-stygobites, suggests that a broader thermal niche breadth of non-stygobitic copepods allows them to be more widely distributed across the Lessinian caves. Differences in intrinsic dispersal capability (not investigated in this study) between species belonging to cyclopoids and harpacticoids may represent an additional factor behind their contrasting alpha diversity spatial patterns, with cyclopoids being more prone to dispersal than harpacticoids (Galassi, 2001).
Our findings agree with current knowledge about how geomorphology and hydrogeology along the succession of the geological ages have steadily shaped the distribution and development of the stygofauna, especially in ancient unsaturated karst areas where habitats are highly fragmented, thus favouring long-term vicariant events, multiple disjunct refugia and speciation processes. In this context, the risk concerning groundwater biodiversity loss is tightly related to geospatial features of the karst, including the size of drainage basins, natural boundaries or hydrologic connectivity determining the existence or not of ecological corridors. This, in turn, suggests that conservation efforts should be effectively allocated to both species-rich regions and those with lower net alpha diversity but hosting endemics and phylogenetic relics, as for the species of the genus Lessinocamptus, which may also be more prone to extinction due to their restricted distribution range.
Considering the importance of their biodiversity, the scientific community recently emphasized the urgent need to increase research and societal efforts towards evidence-based conservation of subterranean ecosystems (Mammola et al., 2019d, 2022). Our results indicate that conservation measures targeting groundwater copepods should consider how species spread within different groundwater habitat types and/or at their boundaries, paying particular attention to ecotonal zones hosting assemblages with unique ensembles of traits and evolutionary histories.
Data availability statement
The original contributions presented in the study are included in the article/Supplementary material, further inquiries can be directed to the corresponding author/s.
Author contributions
IV, FC, and DG conceived the research. FS and BF created the dataset. IV and FC performed the analyses, with suggestions by SM, MC, and TL. IV and FC wrote the results and interpreted the data. IV, FC, SM, BF, MC, TL, FS, and DG discussed the results and contributed to writing the manuscript. All authors contributed to the article and approved the submitted version.
Funding
DG, SM, FS, BF, and IV are granted by the Biodiversa+ project DarCo. FC is granted by the PNR 2021–2027 (Italian Ministry of University and Research, DM 737/2021). The authors also acknowledge the support of NBFC to CNR, funded by the Italian Ministry of University and Research, PNRR, Missione 4 Componente 2, “Dalla ricerca all’impresa,” Investimento 1.4, Project CN00000033.
Conflict of interest
The authors declare that the research was conducted in the absence of any commercial or financial relationships that could be construed as a potential conflict of interest.
Publisher’s note
All claims expressed in this article are solely those of the authors and do not necessarily represent those of their affiliated organizations, or those of the publisher, the editors and the reviewers. Any product that may be evaluated in this article, or claim that may be made by its manufacturer, is not guaranteed or endorsed by the publisher.
Supplementary material
The Supplementary material for this article can be found online at: https://www.frontiersin.org/articles/10.3389/fevo.2023.1143874/full#supplementary-material
Footnotes
References
Aquilina, L., Ladouche, B., and Dörfliger, N. (2006). Water storage and transfer in the epikarst of karstic systems during high flow periods. J. Hydrol. 327, 472–485. doi: 10.1016/j.jhydrol.2005.11.054
Assmann, T., Casale, A., Drees, C., Habel, J. C., Matern, A., and Schuldt, A. (2010). “The dark side of relict species biology: cave animals as ancient lineages” in Relict Species. eds. J. C. Habel and T. Assman (Berlin: Springer), 91–103.
Badino, G. (2010). Underground meteorology-“What’s the weather underground?”. Acta Carsol. 39, 427–448. doi: 10.3986/ac.v39i3.74
Bakalowicz, M. (2004). “The epikarst, the skin of karst” in Epikarst. Proceedings of the Symposium Held October 1 through 4, 2003. eds. W. K. Jones, D. C. Culver, and J. S. Herman (Shepherdstown, West Virginia, USA, Charles Town, West Virginia, U.S.A: Karst Waters Institute), 16–22.
Bakalowicz, M. (2019). “Epikarst” in Encyclopedia of Caves. eds. W. B. White, D. C. Culver, and T. Pipan. 3rd ed (Cambridge, Massachusetts, U.S.A: Academic Press), 394–398.
Benjamini, Y., and Hochberg, Y. (1995). Controlling the false discovery rate: a practical and powerful approach to multiple testing. J. R. Stat. Soc. B 57, 289–300. doi: 10.1111/j.2517-6161.1995.tb02031.x
Bonacci, O., Pipan, T., and Culver, D. C. (2009). A framework for karst ecohydrology. Environ. Geol. 56, 891–900. doi: 10.1007/s00254-008-1189-0
Borutzky, E. V. (1952). Fauna USSR. Crustacea, Volume III, No. 4. Freshwater Harpacticoida. Izdaniya Akademia Nauk SSSR [Original in Russian but Consulted for this Work in the English Translation by A. Mercado Published in 1964 by the Israel Program for Scientific Translation, Jerusalem].
Boxshall, G. A., and Halsey, S. H. (2004). An Introduction to Copepod Diversity. London: Ray Society.
Brancelj, A. (2009). Fauna of an unsaturated karstic zone in Central Slovenia: two new species of Harpacticoida (Crustacea: Copepoda), Elaphoidella millennii n. sp. and E. tarmani n. sp., their ecology and morphological adaptations. Hydrobiologia 621, 85–104. doi: 10.1007/s10750-008-9634-3
Brancelj, A., and Stoch, F. (2022). “The ecology of aquatic cave environments” in Encyclopedia of Inland Waters. eds. T. Mehner and K. Tockner. 2nd ed (Amsterdam, the Netherlands: Elsevier), 449–459.
Bruno, M. C., Cottarelli, V., Grasso, R., Latella, L., Zaupa, S., and Spena, M. T. (2018). Epikarst crustaceans from some Italian caves: Endemisms and spatial scales. Biogeogr. J. Integr. Biogeogr. 33, 1–18. doi: 10.21426/B633035812
Camacho, A., Valdecasas, A., Rodríguez, J., Cuezva, S., Lario, J., and Sánchez-Moral, S. (2006). Habitat constraints in epikarstic waters of an Iberian Peninsula cave system. Annales De Limnologie – international. J. Limnol. 42, 127–140. doi: 10.1051/limn/2006009
Castellarini, F., Malard, F., Dole-Olivier, M.-J., and Gibert, J. (2007). Modelling the distribution of stygobionts in the Jura Mountains (eastern France). Implications for the protection of ground waters. Divers. Distrib. 13, 213–224. doi: 10.1111/j.1472-4642.2006.00317.x
Champollion, C., Deville, S., Chéry, J., Doerflinger, E., le Moigne, N., Bayer, R., et al. (2018). Estimating epikarst water storage by time-lapse surface-to-depth gravity measurements. Hydrol. Earth Syst. Sci. 22, 3825–3839. doi: 10.5194/hess-22-3825-2018
Christman, M. C., and Culver, D. C. (2001). The relationship between cave biodiversity and available habitat. J. Biogeogr. 28, 367–380. doi: 10.1046/j.1365-2699.2001.00549.x
Cornu, J. F., Eme, D., and Malard, F. (2013). The distribution of groundwater habitats in Europe. Hydrogeol. J. 21, 949–960. doi: 10.1007/s10040-013-0984-1
Culver, D. C., Pipan, T., and Schneider, K. (2009). Vicariance, dispersal and scale in the aquatic subterranean fauna of karst regions. Freshw. Biol. 54, 918–929. doi: 10.1111/j.1365-2427.2007.01856.x
Danielopol, D. L., Pospisil, P., and Rouch, R. (2000). Biodiversity in groundwater: a large-scale view. Trends Ecol. Evol. 15, 223–224. doi: 10.1016/S0169-5347(00)01868-1
Di Lorenzo, T., Cipriani, D., Fiasca, B., Rusi, S., and Galassi, D. M. P. (2018). Groundwater drift monitoring as a tool to assess the spatial distribution of groundwater species into karst aquifers. Hydrobiologia 813, 137–156. doi: 10.1007/s10750-018-3515-1
Dussart, B. H. (1967). Les Copépodes des Eaux Continentales d’Europe Occidentale. Tome I: Calanoides et Harpacticoides. Paris: Boublée & Cie.
Dussart, B. H. (1969). Les Copépodes des Eaux Continentales d’Europe Occidentale. Tome II. Cyclopoïdes et Biologie Quantitative. Paris: Boublée & Cie.
Eme, D., Malard, F., Colson-Proch, C., Jean, P., Calvignac, S., Konecny-Dupré, L., et al. (2014). Integrating phylogeography, physiology and habitat modelling to explore species range determinants. J. Biogeogr. 41, 687–699. doi: 10.1111/jbi.12237
Fattorini, S., Borges, P. A., Fiasca, B., and Galassi, D. M. P. (2016). Trapped in the web of water: groundwater-fed springs are island-like ecosystems for the meiofauna. Ecol. Evol. 6, 8389–8401. doi: 10.1002/ece3.2535
Fick, S. E., and Hijmans, R. J. (2017). WorldClim 2: new 1-km spatial resolution climate surfaces for global land areas. Int. J. Climatol. 37, 4302–4315. doi: 10.1002/joc.5086
Ford, D. C., and Williams, P. D. (2007). Karst Hydrogeology and Geomorphology. Hoboken, New Jersey (U.S.A): John Wiley & Sons.
Galassi, D. M. P. (2001). Groundwater copepods: diversity patterns over ecological and evolutionary scales. Hydrobiologia 453, 227–253. doi: 10.1023/A:1013100924948
Galassi, D. M. P., Huys, R., and Reid, J. W. (2009b). Diversity, ecology and evolution of groundwater copepods. Freshw. Biol. 54, 691–708. doi: 10.1111/j.1365-2427.2009.02185.x
Galassi, D. M. P., Stoch, F., and Brancelj, A. (2013). Dissecting copepod diversity at different spatial scales in southern European groundwater. J. Nat. Hist. 47, 821–840. doi: 10.1080/00222933.2012.738834
Galassi, D. M. P., Stoch, F., Fiasca, B., Di Lorenzo, T., and Gattone, E. (2009a). Groundwater biodiversity patterns in the Lessinian massif of northern Italy. Freshw. Biol. 54, 830–847. doi: 10.1111/j.1365-2427.2009.02203.x
Gibert, J., and Deharveng, L. (2002). Subterranean ecosystems: a truncated functional biodiversity. Bioscience 52, 473–481. doi: 10.1641/0006-3568(2002)052[0473:SEATFB]2.0.CO;2
Giusberti, L., Roghi, G., and Zorzin, R. (2020). “Geologia dei monti lessini veronesi” in Le Terre Gialle e Rosse Della Lessinia. ed. G. Cavallo (Modena, Italy: Franco Cosimo Panini), 32–47.
Hahn, H. J., and Fuchs, A. (2009). Distribution patterns of groundwater communities across aquifer types in South-Western Germany. Freshw. Biol. 54, 848–860. doi: 10.1111/j.1365-2427.2008.02132.x
Hartig, F. (2022). DHARMa: Residual Diagnostics for Hierarchical (Multi-Level/Mixed) 910 Regression Models. R package version 0.4.5. Available at: https://CRAN.R-project.org/package=DHARMa (Accessed February 9, 2023).
Heidenreich, N.-B., Schindler, A., and Sperlich, S. (2013). Bandwidth selection for kernel density estimation: a review of fully automatic selectors. AStA Adv. Stat. Anal. 97, 403–433. doi: 10.1007/s10182-013-0216-y
Iannella, M., Fiasca, B., Di Lorenzo, T., Biondi, M., Di Cicco, M., and Galassi, D. M. P. (2020a). Jumping into the grids: mapping biodiversity hotspots in groundwater habitat types across Europe. Ecography 43, 1825–1841. doi: 10.1111/ecog.05323
Iannella, M., Fiasca, B., Di Lorenzo, T., Biondi, M., Di Cicco, M., and Galassi, D. M. P. (2020b). Spatial distribution of stygobitic crustacean harpacticoids at the boundaries of groundwater habitat types in Europe. Sci. Rep. 10, 19043–19010. doi: 10.1038/s41598-020-76018-0
Iepure, S., Feurdean, A., Bădăluţă, C., Nagavciuc, V., and Perşoiu, A. (2016). Pattern of richness and distribution of groundwater Copepoda (Cyclopoida: Harpacticoida) and Ostracoda in Romania: an evolutionary perspective. Biol. J. Linn. Soc. 119, 593–608. doi: 10.1111/bij.12686
Iepure, S., Rasines-Ladero, R., Meffe, R., Carreño, F., Mostaza, D., Sundberg, A., et al. (2017). Exploring the distribution of groundwater Crustacea (Copepoda and Ostracoda) to disentangle aquifer type features—a case study in the upper Tajo basin (Central Spain). Ecohydrology 10:e1876. doi: 10.1002/eco.1876
Itescu, Y. (2019). Are island-like systems biologically similar to islands? A review of the evidence. Ecography 42, 1298–1314. doi: 10.1111/ecog.03951
Kogovšek, J. (2010). Characteristics of Percolation through the Karst Vadose Zone. Ljubljana (Slovenia): ZRC Publishing.
Kogovšek, J., and Šebela, S. (2004). Water tracing through the vadose zone above Postojnska Jama, Slovenia. Environ. Geol. 45, 992–1001. doi: 10.1007/s00254-003-0958-z
Liu, W., Zhou, C., Ellis Burnet, J., and Brancelj, A. (2017). The effect of hydrological and hydrochemical parameters on the microdistribution of aquatic fauna in drip water in the Velika Pasica cave, Central Slovenia. Ecohydrology 10:1835. doi: 10.1002/eco.1835
Lüdecke, D. (2022). sjPlot: Data Visualization for Statistics in Social Science. R package version 948 2.8.11. Available at: https://CRAN.R-project.org/package=sjPlot
Lüdecke, D., Ben-Shachar, M. S., Patil, I., Waggoner, P., and Makowski, D. (2021). Performance: an R package for assessment, comparison and testing of statistical Models. J. Open Source Soft. 6:3139. doi: 10.21105/joss.03139
Malard, F., Dole-Olivier, M., Mathieu, J., Stoch, F., Brancelj, A., Camacho, A., et al. (2002). Sampling Manual for the Assessment of Regional Groundwater Biodiversity. PASCALIS Project (V Framework Programme. Key Action 2: Global Change, Climate and Biodiversity. 2.2. 3 Assessing and Conserving Biodiversity); ed. F. Malard Villeurbanne (France): Pascalis. Contract n°: N° EVK2-CT-2001-00121, 110.
Mammola, S. (2019). Finding answers in the dark: caves as models in ecology fifty years after Poulson and White. Ecography 42, 1331–1351. doi: 10.1111/ecog.03905
Mammola, S., Aharon, S., Seifan, M., Lubin, Y., and Gavish-Regev, E. (2019a). Exploring the interplay between local and regional drivers of distribution of a subterranean organism. Diversity 11:119. doi: 10.3390/d11080119
Mammola, S., Amorim, I. R., Bichuette, M. E., Borges, P. A., Cheeptham, N., Cooper, S. J., et al. (2020). Fundamental research questions in subterranean biology. Biol. Rev. 95, 1855–1872. doi: 10.1111/brv.12642
Mammola, S., Cardoso, P., Culver, D. C., Deharveng, L., Ferreira, R. L., Fišer, C., et al. (2019d). Scientists’ warning on the conservation of subterranean ecosystems. Bioscience 69, 641–650. doi: 10.1093/biosci/biz064
Mammola, S., and Leroy, B. (2018). Applying species distribution models to caves and other subterranean habitats. Ecography 41, 1194–1208. doi: 10.1111/ecog.03464
Mammola, S., Meierhofer, M. B., Borges, P. A., Colado, R., Culver, D. C., Deharveng, L., et al. (2022). Towards evidence-based conservation of subterranean ecosystems. Biol. Rev. 97, 1476–1510. doi: 10.1111/brv.12851
Mammola, S., Piano, E., Cardoso, P., Vernon, P., Domínguez-Villar, D., Culver, D. C., et al. (2019b). Climate change going deep: the effects of global climatic alterations on cave ecosystems. Anthropocene Rev. 6, 98–116. doi: 10.1177/2053019619851594
Mammola, S., Schönhofer, A. L., and Isaia, M. (2019c). Tracking the ice: subterranean harvestmen distribution matches ancient glacier margins. J. Zool. Syst. Evol. Res. 57, 548–554. doi: 10.1111/jzs.12264
Mammola, S., Souza, M. F. V. R., Isaia, M., and Ferreira, R. L. (2021). Global distribution of microwhip scorpions (Arachnida: Palpigradi). J. Biogeogr. 48, 1518–1529. doi: 10.1111/jbi.14094
Mangin, A. (1973). Sur la dynamique des transferts en aquifer karstique. Proce. Sixth Int. Congr. Speleol. Olomouc 4, 157–162.
Moldovan, O. T., Meleg, I. N., and Perşiou, A. (2012). Habitat fragmentation and its effects on groundwater populations. Ecohydrology 5, 445–452. doi: 10.1002/eco.237
Mouron, S., Eme, D., Bellec, A., Bertrand, M., Mammola, S., Liébault, F., et al. (2022). Unique and shared effects of local and catchment predictors over distribution of hyporheic organisms: does the valley rule the stream? Ecography 2022:e06099. doi: 10.1111/ecog.06099
Naimi, B., Hamm, N. A., Groen, T. A., Skidmore, A. K., and Toxopeus, A. G. (2014). Where is positional uncertainty a problem for species distribution modelling? Ecography 37, 191–203. doi: 10.1111/j.1600-0587.2013.00205.x
Oksanen, J., Simpson, G., Blanchet, F., Kindt, R., Legendre, P., Minchin, P., et al. (2022). Vegan: Community Ecology Package. R package version 2.6-2. Available at: https://CRAN.R-project.org/package=vegan.
Patrizi, G. (2001). Sintesi dei Risultati Dell’indagine Idrogeologica, Geochimica e Geochimico-Isotopica Sugli Acquiferi della Lessinia. Ravenna (Italy): Relazione Inedita, Servin–Servizi Integrati Gestionali Ambientali.
Pipan, T., and Brancelj, A. (2004). “Diversity and peculiarity of epikarst fauna: case study from six caves in Slovenia (Europe)” in Epikarst. Proceedings of the Symposium Held October 1 through 4, 2003. eds. W. K. Jones, D. C. Culver, and J. S. Herman (Shepherdstown, West Virginia, USA: Karst Waters Institute), 119–126.
Pipan, T., and Culver, D. C. (2005). Estimating biodiversity in the epikarstic zone of a West Virginia cave. J. Cave Karst Stud. 67, 103–109.
Pipan, T., and Culver, D. C. (2007a). Epikarst communities: biodiversity hotspots and potential water tracers. Environ. Geol. 53, 265–269. doi: 10.1007/s00254-007-0640-y
Pipan, T., and Culver, D. C. (2007b). Regional species richness in an obligate subterranean dwelling fauna – epikarst copepods. J. Biogeogr. 34, 854–861. doi: 10.1111/j.1365-2699.2006.01667.x
Pipan, T., and Culver, D. C. (2013). Forty years of epikarst: what biology have we learned? Int. J. Speleol. 42, 215–223. doi: 10.5038/1827-806X.42.3.5
Pipan, T., and Culver, D. C. (2019). “Shallow subterranean habitats” in Encyclopedia of Caves. 3rd ed. eds. W. White, D. C. Culver, and T. Pipa (Amsterdam, The Netherlands: Academic Press), 896–908.
Pipan, T., Culver, D. C., Papi, F., and Kozel, P. (2018). Partitioning diversity in subterranean invertebrates: the epikarst fauna of Slovenia. PLoS One 13:0195991. doi: 10.1371/journal.pone.0195991
Pipan, T., Holt, N., and Culver, D. C. (2010). How to protect a diverse, poorly known, inaccessible fauna: identification and protection of source and sink habitats in the epikarst. Aquat. Conserv. Mar. Freshwat. Ecosyst. 20, 748–755. doi: 10.1002/aqc.1148
R Core Team (2022). R: A Language and Environment for Statistical Computing. R Foundation for Statistical Computing, Vienna, Austria.
Ribera, I., Cieslak, A., Faille, A., and Fresneda, J. (2018). “Historical and ecological factors determining cave diversity” in Cave Ecology. Ecological Studies. eds. O. Moldovan, Ľ. Kováč, and S. Halse, vol. 235 (Berlin, Germany: Springer), 229–252.
Rouch, R. (1986). “Copepoda: les Harpacticoïdes souterrains des eaux douces continentales” in Stygofauna Mundi – A Faunistic, Distributional and Ecological Synthesis of the World Fauna Inhabiting Subterranean Waters (Including the Marine Interstitial). ed. L. Botosaneanu (Leiden, The Netherlands: Brill), 321–355.
Ruffo, S., and Stoch, F. (Eds.) (2006). Checklist and Distribution of the Italian Fauna. Verona (Italy): Memorie del Museo Civico di Storia Naturale di Verona, 2a serie, Sezione Scienze della Vita 17, with CD-ROM.
Silverman, B. W. (1986). Density Estimation for Statistics and Data Analysis. London (UK): Chapman and Hall.
Stein, H., Griebler, C., Berkhoff, S., Matzke, D., Fuchs, A., and Hahn, H. J. (2012). Stygoregions – a promising approach to a bioregional classification of groundwater systems. Sci. Rep. 2:673. doi: 10.1038/srep00673
Stevens, G. C. (1989). The latitudinal gradient in geographical range: how so many species coexist in the tropics. Am. Nat. 133, 240–256. doi: 10.1086/284913
Stoch, F. (2000). Indagini sulla fauna acquatica delle grotte del Trentino (Italia Settentrionale). Acta Biol. Stud Trentini Sci. Nat. 74, 117–132.
Stoch, F. (Ed.) (2008) Le acque sotterranee – La biodiversità nascosta. Udine, Italy: Quaderni habitat, Ministero dell’Ambiente e della Tutela del Territorio e del Mare, Museo Friulano di Storia Naturale.
Stoch, F., and Galassi, D. M. P. (2010). Stygobiotic crustacean species richness: a question of numbers, a matter of scale. Hydrobiologia 653, 217–234. doi: 10.1007/s10750-010-0356-y
Tarquini, S., and Nannipieri, L. (2017). The 10 m-resolution TINITALY DEM as a trans-disciplinary basis for the analysis of the Italian territory: current trends and new perspectives. Geomorphology 281, 108–115. doi: 10.1016/j.geomorph.2016.12.022
Węglarczyk, S. (2018). Kernel density estimation and its application. ITM Web Conf. 23:00037. doi: 10.1051/itmconf/20182300037
Wells, J. B. J. (2007). An annotated checklist and keys to the species of Copepoda Harpacticoida (Crustacea). Zootaxa 1568, 1–872. doi: 10.11646/zootaxa.1568.1.1
Williams, P. W. (2008). The role of the epikarst in karst and cave hydrogeology: a review. Int. J. Speleol. 37, 1–10. doi: 10.5038/1827-806X.37.1.1
Zagmajster, M., Eme, D., Fišer, C., Galassi, D. M. P., Marmonier, P., Stoch, F., et al. (2014). Geographic variation in range size and beta diversity of groundwater crustaceans: insights from habitats with low thermal seasonality. Glob. Ecol. Biogeogr. 23, 1135–1145. doi: 10.1111/geb.12200
Zuur, A. F., Ieno, E. N., and Elphick, C. S. (2010). A protocol for data exploration to avoid common statistical problems. Methods Ecol. Evol. 1, 3–14. doi: 10.1111/j.2041-210X.2009.00001.x
Keywords: unsaturated karst, caves, groundwater, Copepoda, alpha diversity, kernel density estimation
Citation: Vaccarelli I, Cerasoli F, Mammola S, Fiasca B, Di Cicco M, Di Lorenzo T, Stoch F and Galassi DMP (2023) Environmental factors shaping copepod distributions in cave waters of the Lessinian unsaturated karst (NE-Italy). Front. Ecol. Evol. 11:1143874. doi: 10.3389/fevo.2023.1143874
Edited by:
Mauro Fois, University of Cagliari, ItalyCopyright © 2023 Vaccarelli, Cerasoli, Mammola, Fiasca, Di Cicco, Di Lorenzo, Stoch and Galassi. This is an open-access article distributed under the terms of the Creative Commons Attribution License (CC BY). The use, distribution or reproduction in other forums is permitted, provided the original author(s) and the copyright owner(s) are credited and that the original publication in this journal is cited, in accordance with accepted academic practice. No use, distribution or reproduction is permitted which does not comply with these terms.
*Correspondence: Francesco Cerasoli, francesco.cerasoli@univaq.it