Identification of optimal codons and analysis of phylogenetic relationship in Osteochilus salsburyi (Teleostei: Cypriniformes) based on complete mitogenome
 Cheng Zhang
 Shun Zhang1
  Danli Wang
 Shanliang Xu
- 1School of Marine Science, Ningbo University, Ningbo, Zhejiang, China
- 2Key Laboratory of Applied Marine Biotechnology, Chinese Ministry of Education, Ningbo University, Ningbo, China
Introduction: Mitogenomes are frequently used in the study of fish phylogenetic and evolutionary studies. However, there is currently no information available regarding the evolution history of Osteochilus salsburyi. To address this gap, an experiment was designed to gain a deeper understanding of this species.
Methods: Here, we analyzed the mitochondrial structure, phylogenetic relationship, and optimal codon usage of O. salsburyi based on complete mitochondrial genome.
Results: The complete mitogenome of O. salsburyi was 16,598 bp (GenBank Accession No: MW114837), including 22 tRNAs, 13 PCGs, two rRNAs, and two non-coding regions. The typical clover-leaf secondary structures of all 22 tRNA genes were detected. Moreover, the palindromic motifs TACAT and ATGTA of the D-loop tended to form hairpin loop structures, while the second-longest OL region contained a conserved motif 5’-GCCGG-3’. The relationships among Osteochilus species recovered from same mitochondrial characters were in agreement. The phylogeny based on nucleotide sequences supported the monophyly of the genus Osteochilus. Using the ΔRSCU (Relative Synonymous Codon Usage) method, six optimal codons (ACC, UAC, AAC, UGU, AGC, and GGC) were determined. Furthermore, we estimated the divergence time of O. salsburyi to be 154.06 Mya, during late Jurassic. Based on the maximum likelihood and Bayesian inference methods were used for phylogenetic analyses, and identical topologies were obtained.
Discussion: Ultimately, our results supported that the classification of O. salsburyi as a species of the genus Osteochilus. In this study, the phylogenetic relationships among available Osteochilus mitogenomes were reported for the first time. This study should help us better understand the evolutionary status and species protection of O. salsburyi.
Introduction
Mitochondrial genomes (mitogenome) are smaller in length compared to the entire nuclear genome (Clayton, 1991; Boore, 1999). They have become increasingly common in higher-level phylogenetic analyses because of their ease of sequencing. A mitogenome is a closed-circular molecule that typically consists of 37 genes comprising 22 tRNA genes, 13 protein-coding genes (PCGs), two rRNA genes, (Wolstenholme, 1992), a control region (CR), and usually a large non-coding region (Benson, 1999). Due to its maternal inheritance, simple structure, high mutation rate, and abundant distribution, the mitogenome has been widely utilised for phylogenetic inference, and is considered as an ideal marker for studies on population genetics, molecular phylogenetics, and species delimitation (Simon et al., 2006; Salvato et al., 2008). Mitogenome research has accumulated a great deal of data over the past decade, and numerous mitogenome data of the family Cyprinidae have been published in the NCBI database. However, mitogenome data of the genus Osteochilus, which belongs to Cyprinidae, are still limited. Up to now, only six mitogenomes of 15 known Osteochilus species have been published in NCBI database. Furthermore, Osteochilus nashii was divided into the barbin genus Osteochilichthys by Yang et al. (2012), which makes it challenging for species identification, conservation and management of natural resources of the remaining Osteochilus species.
Osteochilus salsburyi is a small freshwater fish with high nutritional and economic values, mainly distributed in Southeast Asia, including Laos, Northern Vietnam, and Southern China (Froese and Pauly, 2020). In China, it was mainly distributed in the Pearl River, Minjiang River, Jiulongjiang River, Yuanjiang River, and Hainan Island (Yue, 2000). Despite its popularity among consumers, there are few reports on O. salsburyi research, this is not only insufficient for the sustainable development, utilisation and protection of the germplasm resources of O. salsburyi, but also insufficient for understanding its evolutionary history. Therefore, it is necessary to conduct a detailed analysis of the genetic evolution of this species. Codon usage bias (CUB) is a prevalent phenomenon in the natural world and can be considered a form of molecular evolution (Angellotti et al., 2007). CUB can vary widely among different organisms, even within genes of the same organism (Lavner and Kotlar, 2005). Examining codon usage patterns and identifying their influencing factors in various species can enhance our understanding of the molecular mechanisms of biological adaptation to the environment and help us explore evolutionary relationships among species.
In this study, the complete mitogenome of O. salsburyi was accurately sequenced by Sanger sequencing method. All the gene composition and structure were described, and the optimal codons and phylogenetic relationship of O. salsburyi were analyzed for the first time. These research results would not only provide its genetic information on genetic diversity, molecular evolution, species identification, but facilitate future studies of the taxonomy and evolution history.
Materials and methods
Samples collection and DNA extraction
Specimens of O. salsburyi were collected from Yongjiang River (29°54′36″N, 121°37′48″E), in Ningbo City, Zhejiang Province, China, and deposited in the Key Laboratory of Applied Marine Biotechnology, Ningbo University with a catalog number of WC-150413. All specimens were stored in 100% ethanol and then moved to the laboratory where they were kept at −80°C. Total genomic DNA was extracted from muscle tissue, using the traditional phenol-chloroform extraction method (Sambrook and Russell, 2001). The extracted DNA concentration was determined by ultraviolet spectrophotometer, and high-quality genomic DNA samples were diluted to 50 ng/μl, and stored in 1.5 ml centrifuge tube (Guangzhou Jet Bio-Filtration Co., Ltd.) at −20°C.
PCR amplification and sequencing
The extracted DNA was amplified as PCR template. The primers were designed according to the conserved mitochondrial genome sequence of O. hasseltii (GenBank accession number: NC_029442.1) (Table 1), and we obtained an entire mitogenome of O. salsburyi by fourteen pairs of primers. All PCR amplifications conditions were carried out in a final volume of 12.5 μl containing 0.625 μl of each gene-specific forward and reverse primer, 1 μl genomic DNA (approx. 50 ng), 4 μl DNase-Free Deionised Water, and 6.25 μl Taq PCR MasterMix (Novoprotein Biotech Co., Ltd.). Amplifications were performed on an Eppendorf Mastercycler. The program began by a pre-cycling denaturation cycle at 94°C/3 min; 35 cycles of denaturation cycle at 94°C/1 min, annealing at 55°C/30 s, extension at 72°C/1 min, and a post-cycling extension at 72°C/10 min. The quality of PCR products was evaluated by electrophoresis on 1.0% agarose gels in 1 × TAE buffer and was observed under ultraviolet light. The high-quality PCR products were sequenced by ABI PRISM 3730 (Sangon Biotech (Shanghai) Co., Ltd., China).
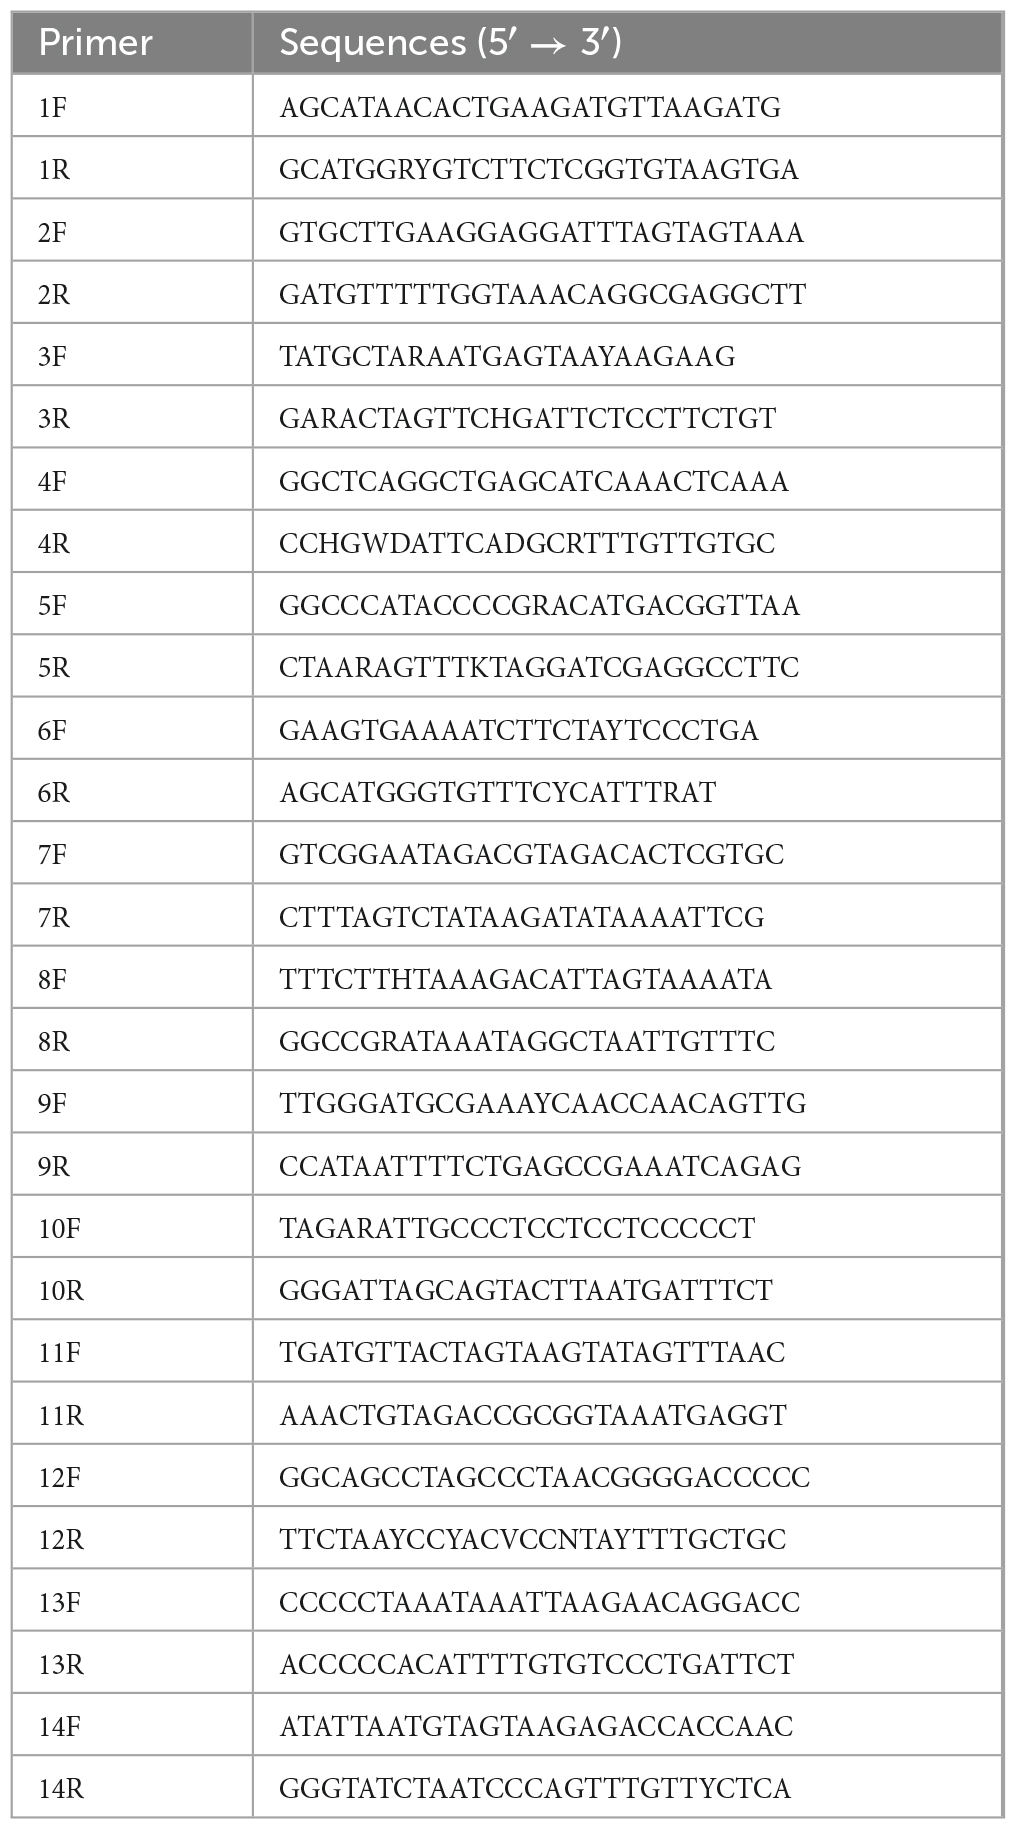
Table 1. Primer pairs used for PCR amplification of O. salsburyi mitogenome.
Complete mitogenome analysis
The approach used to obtain and analyze the mitogenome of O. salsburyi involved several software tools and manual inspection. First, the software NOVOPlasty 4.21 was used to splice the mitogenome fragments (Dierckxsens et al., 2016), followed by manual inspection using Seqman program within the Lasergene software (Burland, 2000). The online software OrganellarGenomeDRAW version 1.3.12 was used to draw the graphical map of the entire mitogenome (Greiner et al., 2019). The Tandem Repeats Finder program version 4.09 was used to identify tandem repeats in the control region (Benson, 1999). In addition, the typical clover-leaf secondary structure and anticodon of tRNAs were identified by the web serve tRNAscan-SE 2.03 (Lowe and Chan, 2016). The codon usage of PCGs and the nucleotide composition of the mitogenome were determined by MEGA 5.0 (Tamura et al., 2011). Finally, the entire mitogenome of O. salsburyi was deposited in the GenBank database (GenBank accession: MW114837).
Determination of optimal codons and cluster analysis
The online program4 was used to calculate various indices related to codon usage in this study. These include the GC content of the first base of codon (GC1), the second base of codon (GC2), the third base of codon (GC3), total GC content (GCall), codon adaption index (CAI), and the effective number of codon (ENC). CAI is an index of synonymous codon usage bias of gene (Sharp and Li, 1987; Ermolaeva, 2001), while ENC evaluates non-uniform use among synonymous groups of codons (Wright, 1990). RSCU was also calculated using CodonW v1.4.2. Optimal codons refers to the codons that appear more frequently in high-expression genes than in low-expression genes (Ikemura, 1985). In this study, taking ENC values as a standard, 10% of all genes with the highest ENC values and the lowest ENC values were designated as the high and the low expression groups, respectively. The ΔRSCU method was used to identify optimal codons, where a codon was considered optimal if its ΔRSCU value was greater than 0.08 and its RSCU value was greater than 1 in the high expression group while being less than 1 in the low expression group.
Phylogenetic analysis
To conduct phylogenetic analyses, this study included 25 complete mitogenomes from cyprinid fishes available in GenBank, in addition to the sequenced mitogenomes described above (Table 2). Two selected outgroups were Cirrhinus microlepis (NC_031608.1) and C. mrigala (JQ838173.1). A total of 12 PCGs were extracted from the Osteochilus mitogenomes and aligned for tree construction, excluding NADH dehydrogenase subunit 6 (ND6) due to its high heterogeneity (Miya and Nishida, 2000). The 12 PCGs of the 26 species were aligned using MAFFT with the default setting (Katoh et al., 2002), and concatenated into a single multi-sequence alignment. The best-fit model of nucleotide substitution was selected using jModeltest v2 based on Bayesian Information Criterion (BIC) value for Bayesian inference (BI) (Guindon and Gascuel, 2003; Darriba et al., 2012), where GTR + I + G was selected. The BI analysis was conducted using MrBayes 3.2.7a with four simultaneous Markov chain Monte Carlo (MCMC) for 200,000 generations (Ronquist et al., 2012), and the topology tree and the Bayesian posterior probabilities were derived after excluding the first 25% of “burn-in” trees. The Maximum likelihood (ML) tree was constructed using RAxML (Stamatakis, 2014) with GTRGAMMA as the best-fit evolutionary model, and 1000 bootstrap replicates to calculate the node support values. Finally, the phylogenetic trees were constructed using the software FigTree v1.4.3.

Table 2. Composition and skewness in PCGs of different 26 Cyprinidae species mitogenomes.
Divergence times estimation
This study estimated the divergence times of major clades using BEAST v1.8.4, which employed the relaxed uncorrelated lognormal clocks, random starting trees and the Yule speciation model. Samples were drawn from the posterior distributions of parameters by sampling from two independent MCMC analyses, The posterior samples were drawn every 1,000 steps over a total of 10,000,000 steps per MCMC run, following a discarded burn-in of 50% steps. Tracer v 1.7.1 was used to merge and check the results of the two analyses. Based on the posterior distribution of the tree, the given mean node heights were calculated using TreeAnnotator v2.7.0, and the results were visualised using Figtree v1.4.3. The differentiation time between Oryzias latipes and Xiphophorus maculatus (125-132 Mya) was used for time correction.
Results and discussion
Mitogenome organisation and composition
Up to now, five species of Osteochilus with known mitogenomes have been identified, including O. salsburyi, O. pentalineatus, O. schlegelii, O. hasseltii, and O. melanopleurus. Among them, the entire mitogenome of O. salsburyi was a circular double-chain molecule with a length of 16,598 bp, while the mitogenomes of the remaining four Osteochilus species varied from 15,647 bp (O. melanopleurus, except for D-loop) to 16,575 bp (O. schlegelii) in length. All five mitogenomes were all composed of 22 tRNA, 13 PCGs, two rRNA (12S and 16S), and two non-coding regions. One of the non-coding regions served as the control region, while the other was the origin of the light strand replication (OL). The gene locations of O. salsburyi mitogenome were shown in Figure 1 and Table 3, and those of the remaining four Osteochilus species were shown in Supplementary Figure 1 Among these genes, 28 genes were encoded on the heavy strand (H-strand), while the other nine genes (ND6, tRNAGln, tRNAAla, tRNAAsn, tRNACys, tRNATyr, tRNASer1(UGC), tRNAGlu, and tRNAPro) were transcribed on the light strand (L-strand). The distribution characteristics of these 37 genes in the five Osteochilus species was similar to that of other teleost fishes (Nakatani et al., 2011; Wang et al., 2016). Apart from the control region, there were 18 intergenic spacer regions ranged from 1 to 26 bp in length, and ten gene overlap regions throughout the entire O. salsburyi mitogenome. Meanwhile, the mitogenomes of O. pentalineatus, O. schlegelii, O. hasseltii, and O. melanopleurus contained 16, 19, 18, and 15 intergenic spacer regions, respectively, and 9, 9, 10, and 9 gene overlap regions, respectively. The mitogenomes of the five Osteochilus species were closely aligned, and only a small number of bases overlap between adjacent genes, indicating that RNA transcription and protein translation may be more efficient. The mitogenome composition (A: 33.09%, C: 25.41%, G: 14.98%, T: 26.52%) showed a strong A + T bias, accounting for 59.61% of the bases. Asymmetry is a common phenomenon in teleost fishes and reflected the conservation of mitochondrial genome in the process of evolution, as reported by Yu et al. (2016) and Cui et al. (2017). The base-skew of the H-strand in the O. salsburyi mitogenome was measured, the AT-skew ([A – T]/[A + T]) value was 0.11, while the GC-skew ([G – C]/[G + C]) value was -0.26. The results showed that the mitogenome composition was strongly A-skewed and C-skewed. Meanwhile, the AT-skew and GC-skew values of the remaining four Osteochilus species, namely O. pentalineatus, O. schlegelii, O. hasseltii, and O. melanopleurus, were found to be similar to each other. This similarity may be attributed to a balance between mutational and selective pressures during replication.
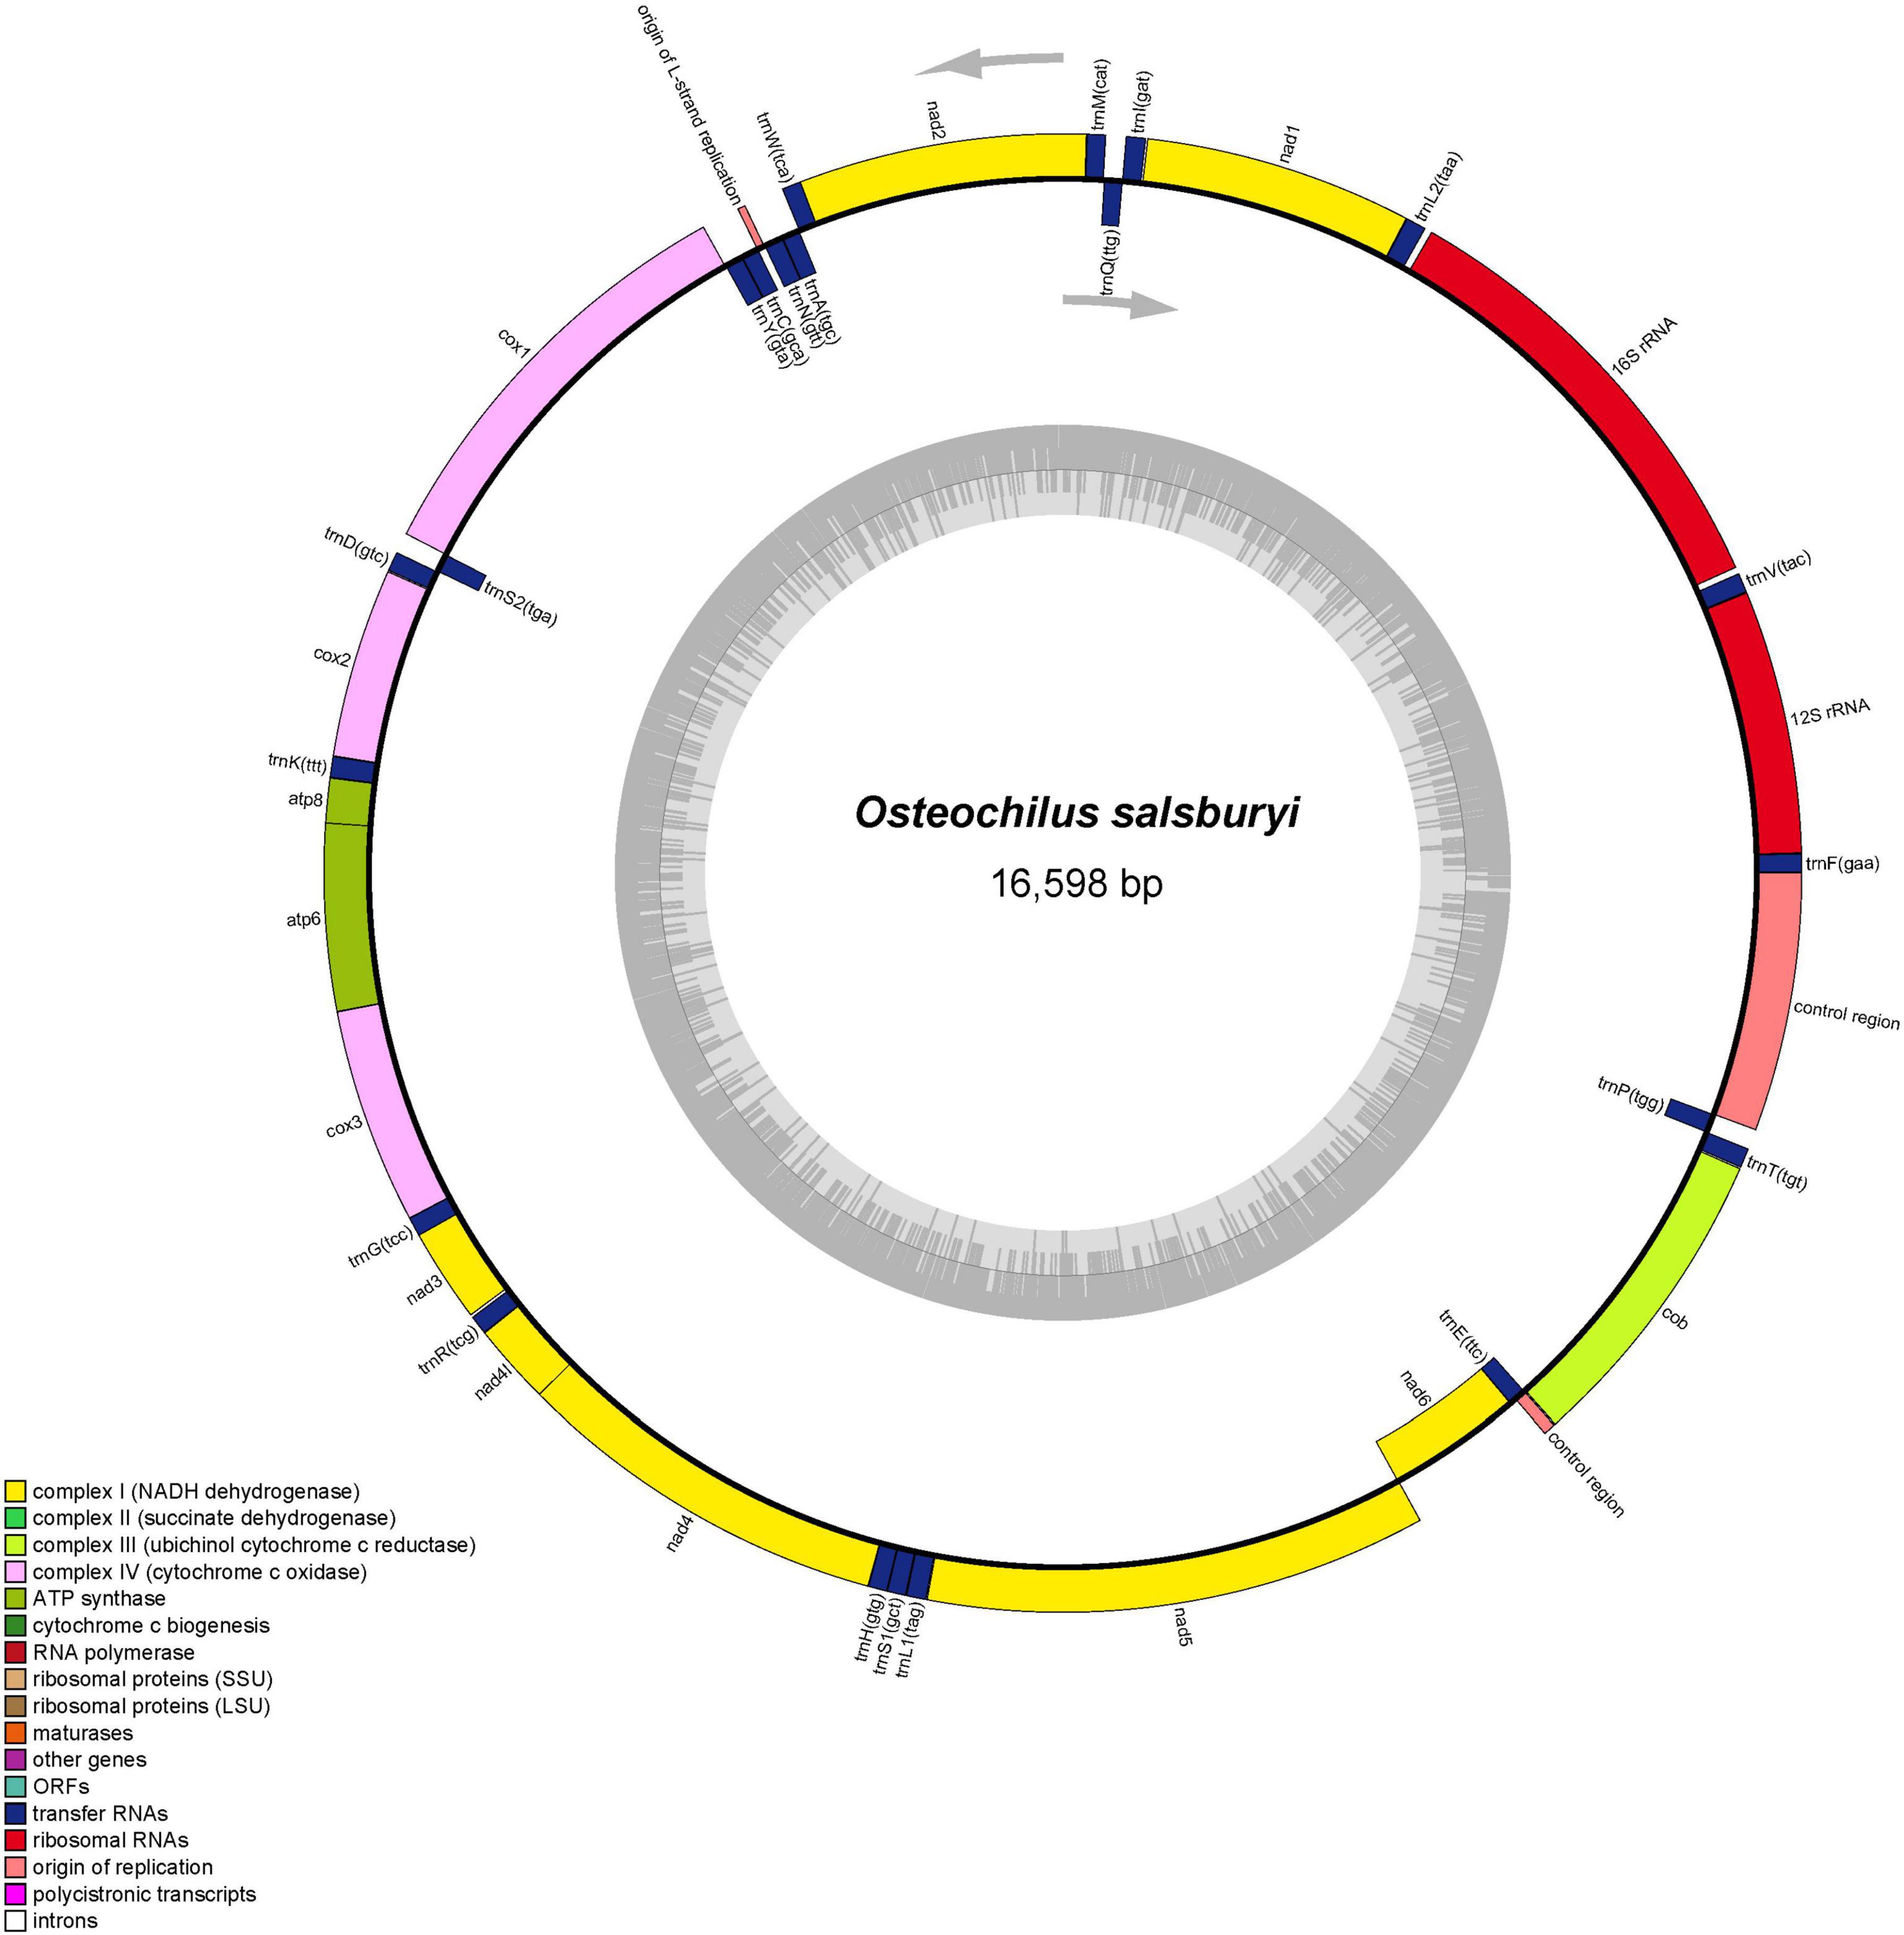
Figure 1. Graphical map of the O. salsburyi mitogenome.
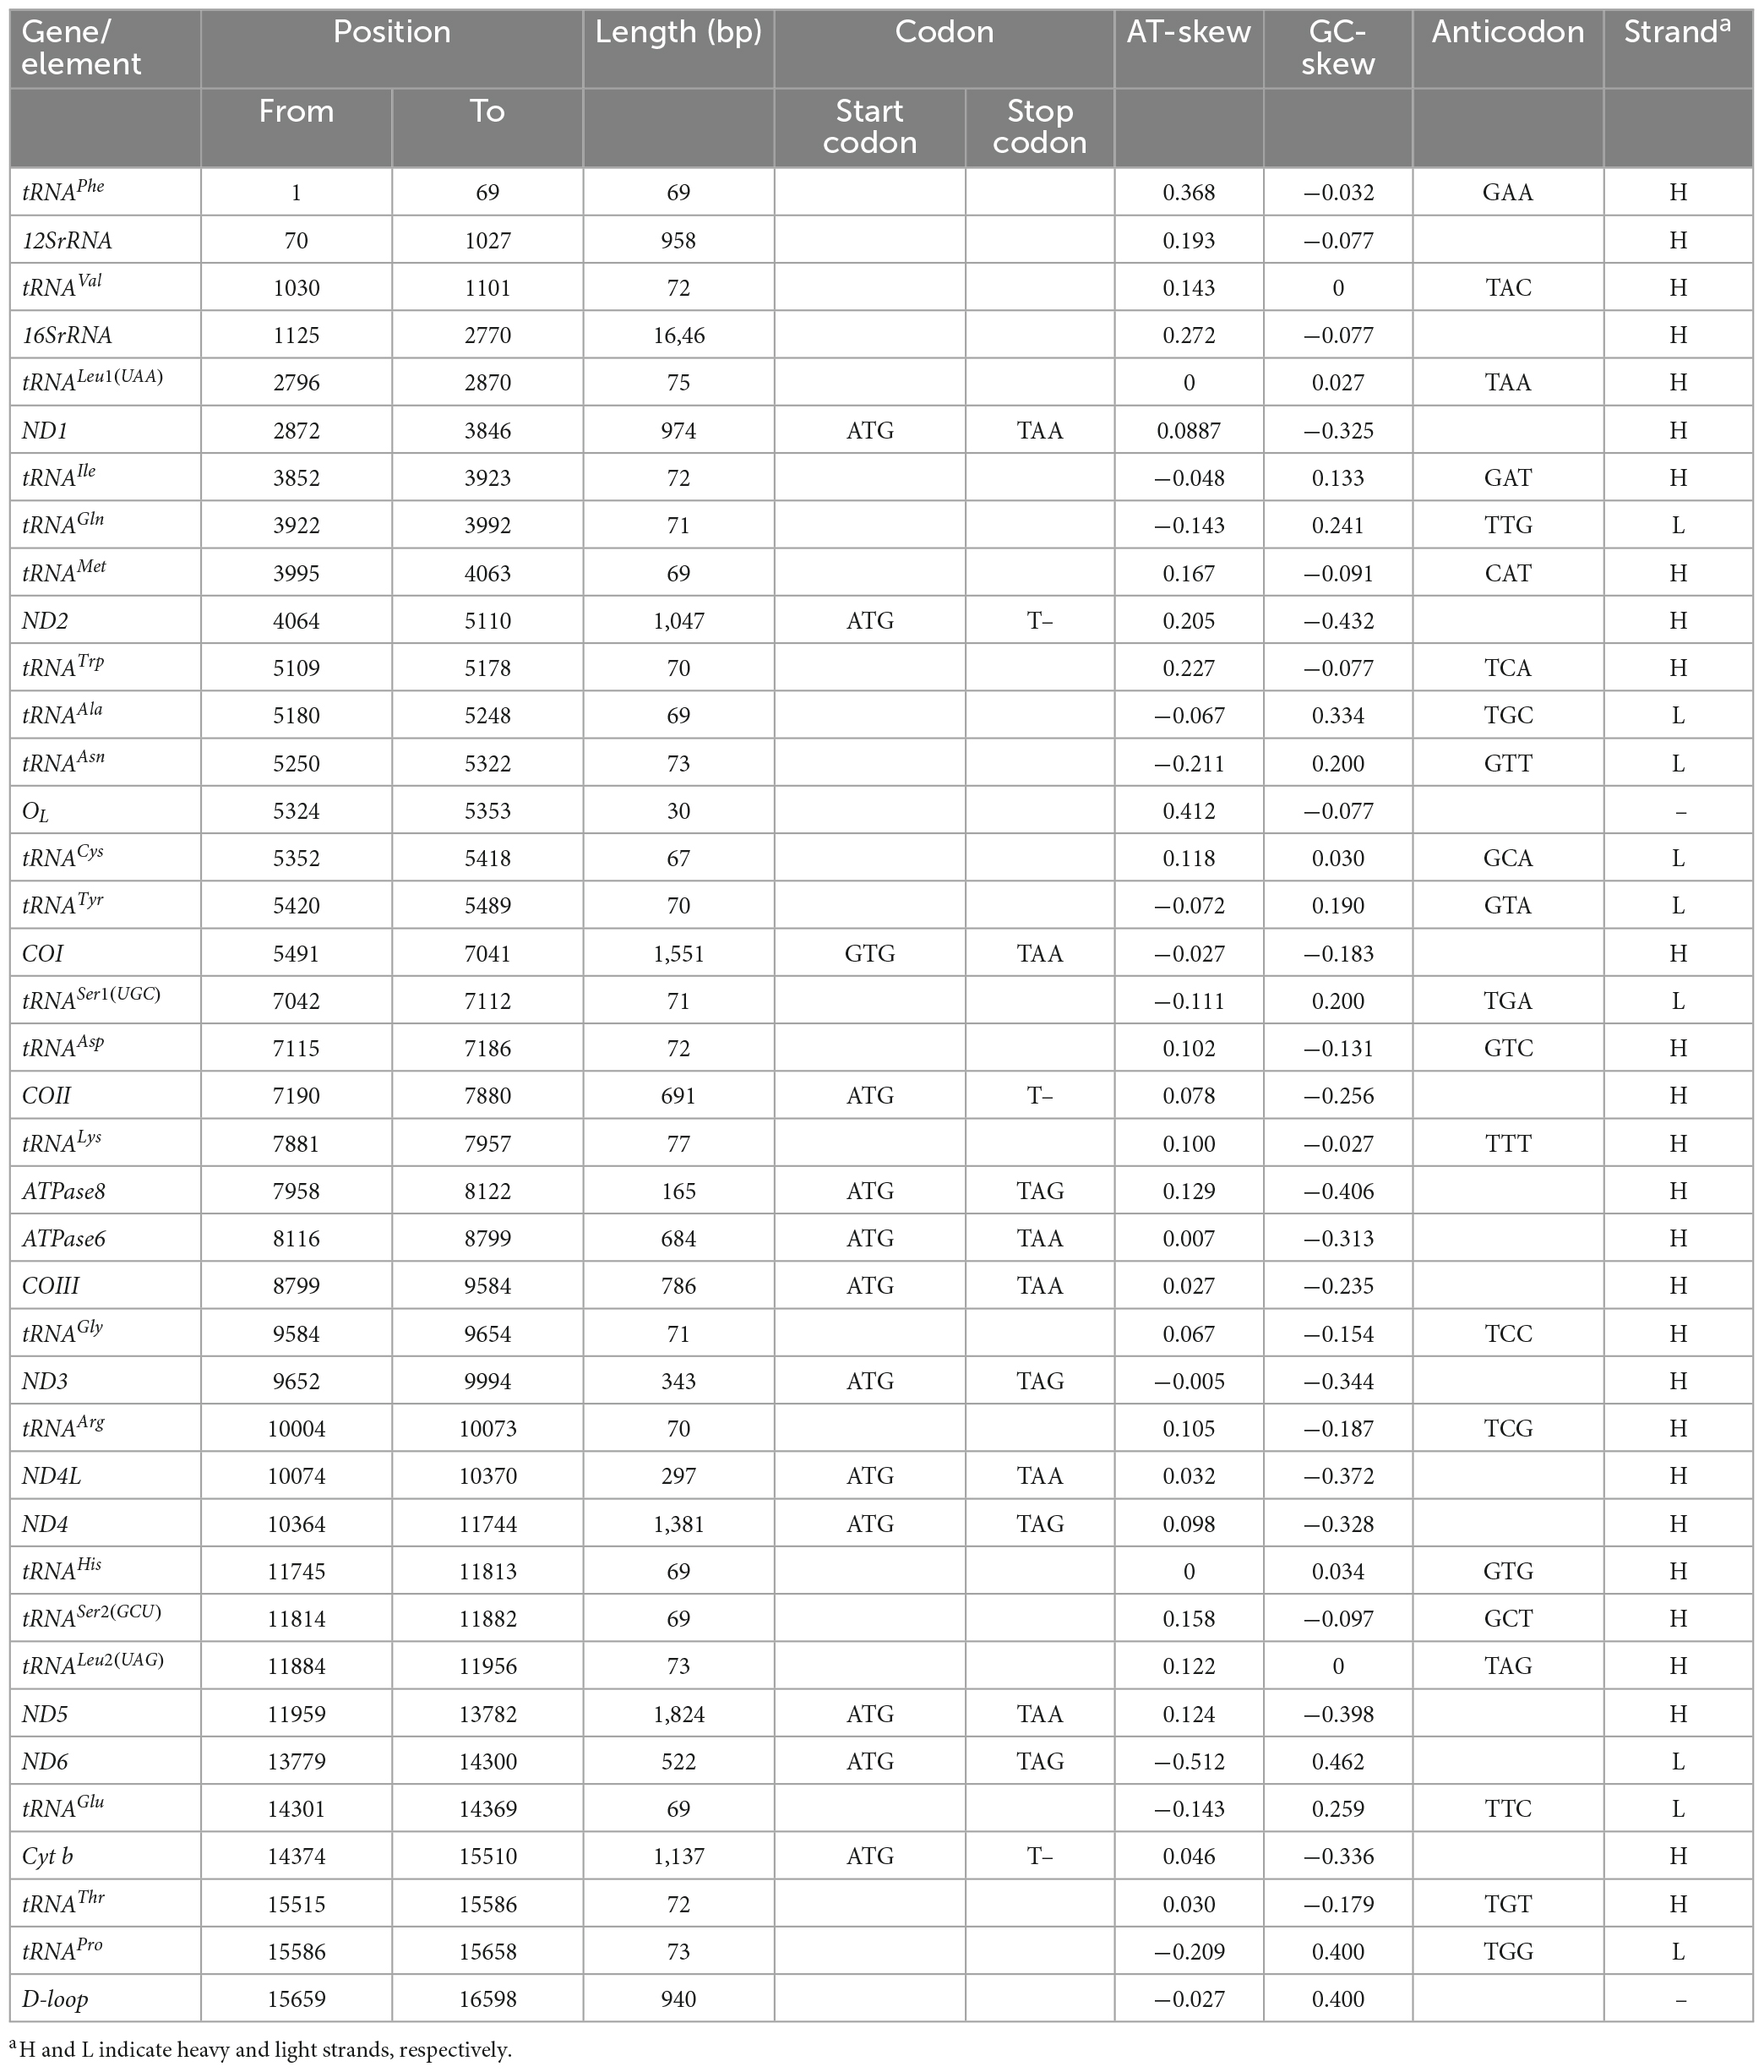
Table 3. Mitogenome characteristic of O. salsburyi.
Transfer RNA genes
All tRNAs were recognised by tRNAscan-SE2.0 (Lowe and Chan, 2016). The mitogenomes of the five Osteochilus species each contained 22 tRNAs, which were scattered throughout the mitogenome and varied from 66 to 77 bp. Of there, 14 tRNAs were encoded on the H-strand, while the remaining eight tRNAs were coded on the L-strand. The coding pattern was commonly observed in almost all Cyprinidae mitogenomes (Wang et al., 2008; Lim et al., 2019; Chung et al., 2020). The primitive arrangement of these tRNA genes in the five Osteochilus species was the same as in the common vertebrate arrangement (Boore, 1999). Additionally, two kinds of serine (tRNASer(UCN) and tRNASer(AGN)) and leucine (tRNALeu(UUR) and tRNALeu(CUN)) were found. All 22 tRNAs in the other four Osteochilus species could be folded into the typical clover-leaf secondary structures, with the exception of the tRNACys of O. melanopleurus, which lacked a dihydrouracil loop (Figure 2 and Supplementary Figure 2). Compared to other genes in the mitogenome, the nucleotide composition of these tRNAs in the five Osteochilus species was highly conserved, showing strong stability (Boore, 1999). The anticodon loop of tRNAThr, and tRNAVal in was longer than the typical length of 7 bp, with a length of 9 bp. Similarly, the anticodon loop of tRNAHis in O. salsburyi and tRNATyr in O. hasseltii were also longer. Furthermore, we found that non-canonical match base pairs or mismatch base pairs were common in the relatively conservative tRNAs. A total of 46 non-canonical match base pairs in the O. salsburyi mitogenome were identified through the tRNAs. Among them, 30 were G-U base pair mismatches, seven were A-C base pair mismatches, four were A-A base pair mismatches, three were U-U base pair mismatches, one was a C-C base pairs mismatch, and one was a C-U base pair mismatch. O. pentalineatus had 29 G-U base pairs, eight A-C base pairs, three A-A base pairs, two C-C, C-U, and U-U base pairs. O. schlegelii had 41 G-U base pairs, seven A-C base pairs, two A-A, C-C, and U-U base pairs, and one C-U base pair. O. hasseltii had 36 G-U base pairs, nine A-C base pairs, three A-A and U-U base pairs, two C-U base pairs, and one C-C base pair. O. melanopleurus had 33 G-U base pairs, eight A-C base pairs, two A-A, C-U, and U-U base pairs, and one base pair each of A-G and C-C. All the mismatch base pairs appeared in the stems of acceptor, anticodon, DHU, and TΨC. In the mitogenomes of the five Osteochilus species, most of these non-canonical nucleotides were G-U pairs, which were known to form weak bonds in tRNAs and non-canonical base pairs in tRNA secondary structure. This led us to speculate that G-U pairing may be a common phenomenon in tRNA of mitogenomes and that it may be corrected through post-transcriptional editing, as described in Lavrov et al. (2000). Furthermore, since the mitogenome is not affected by the recombination process, and this base mismatch phenomenon may help to eliminate deleterious mutations (Lynch, 1997).
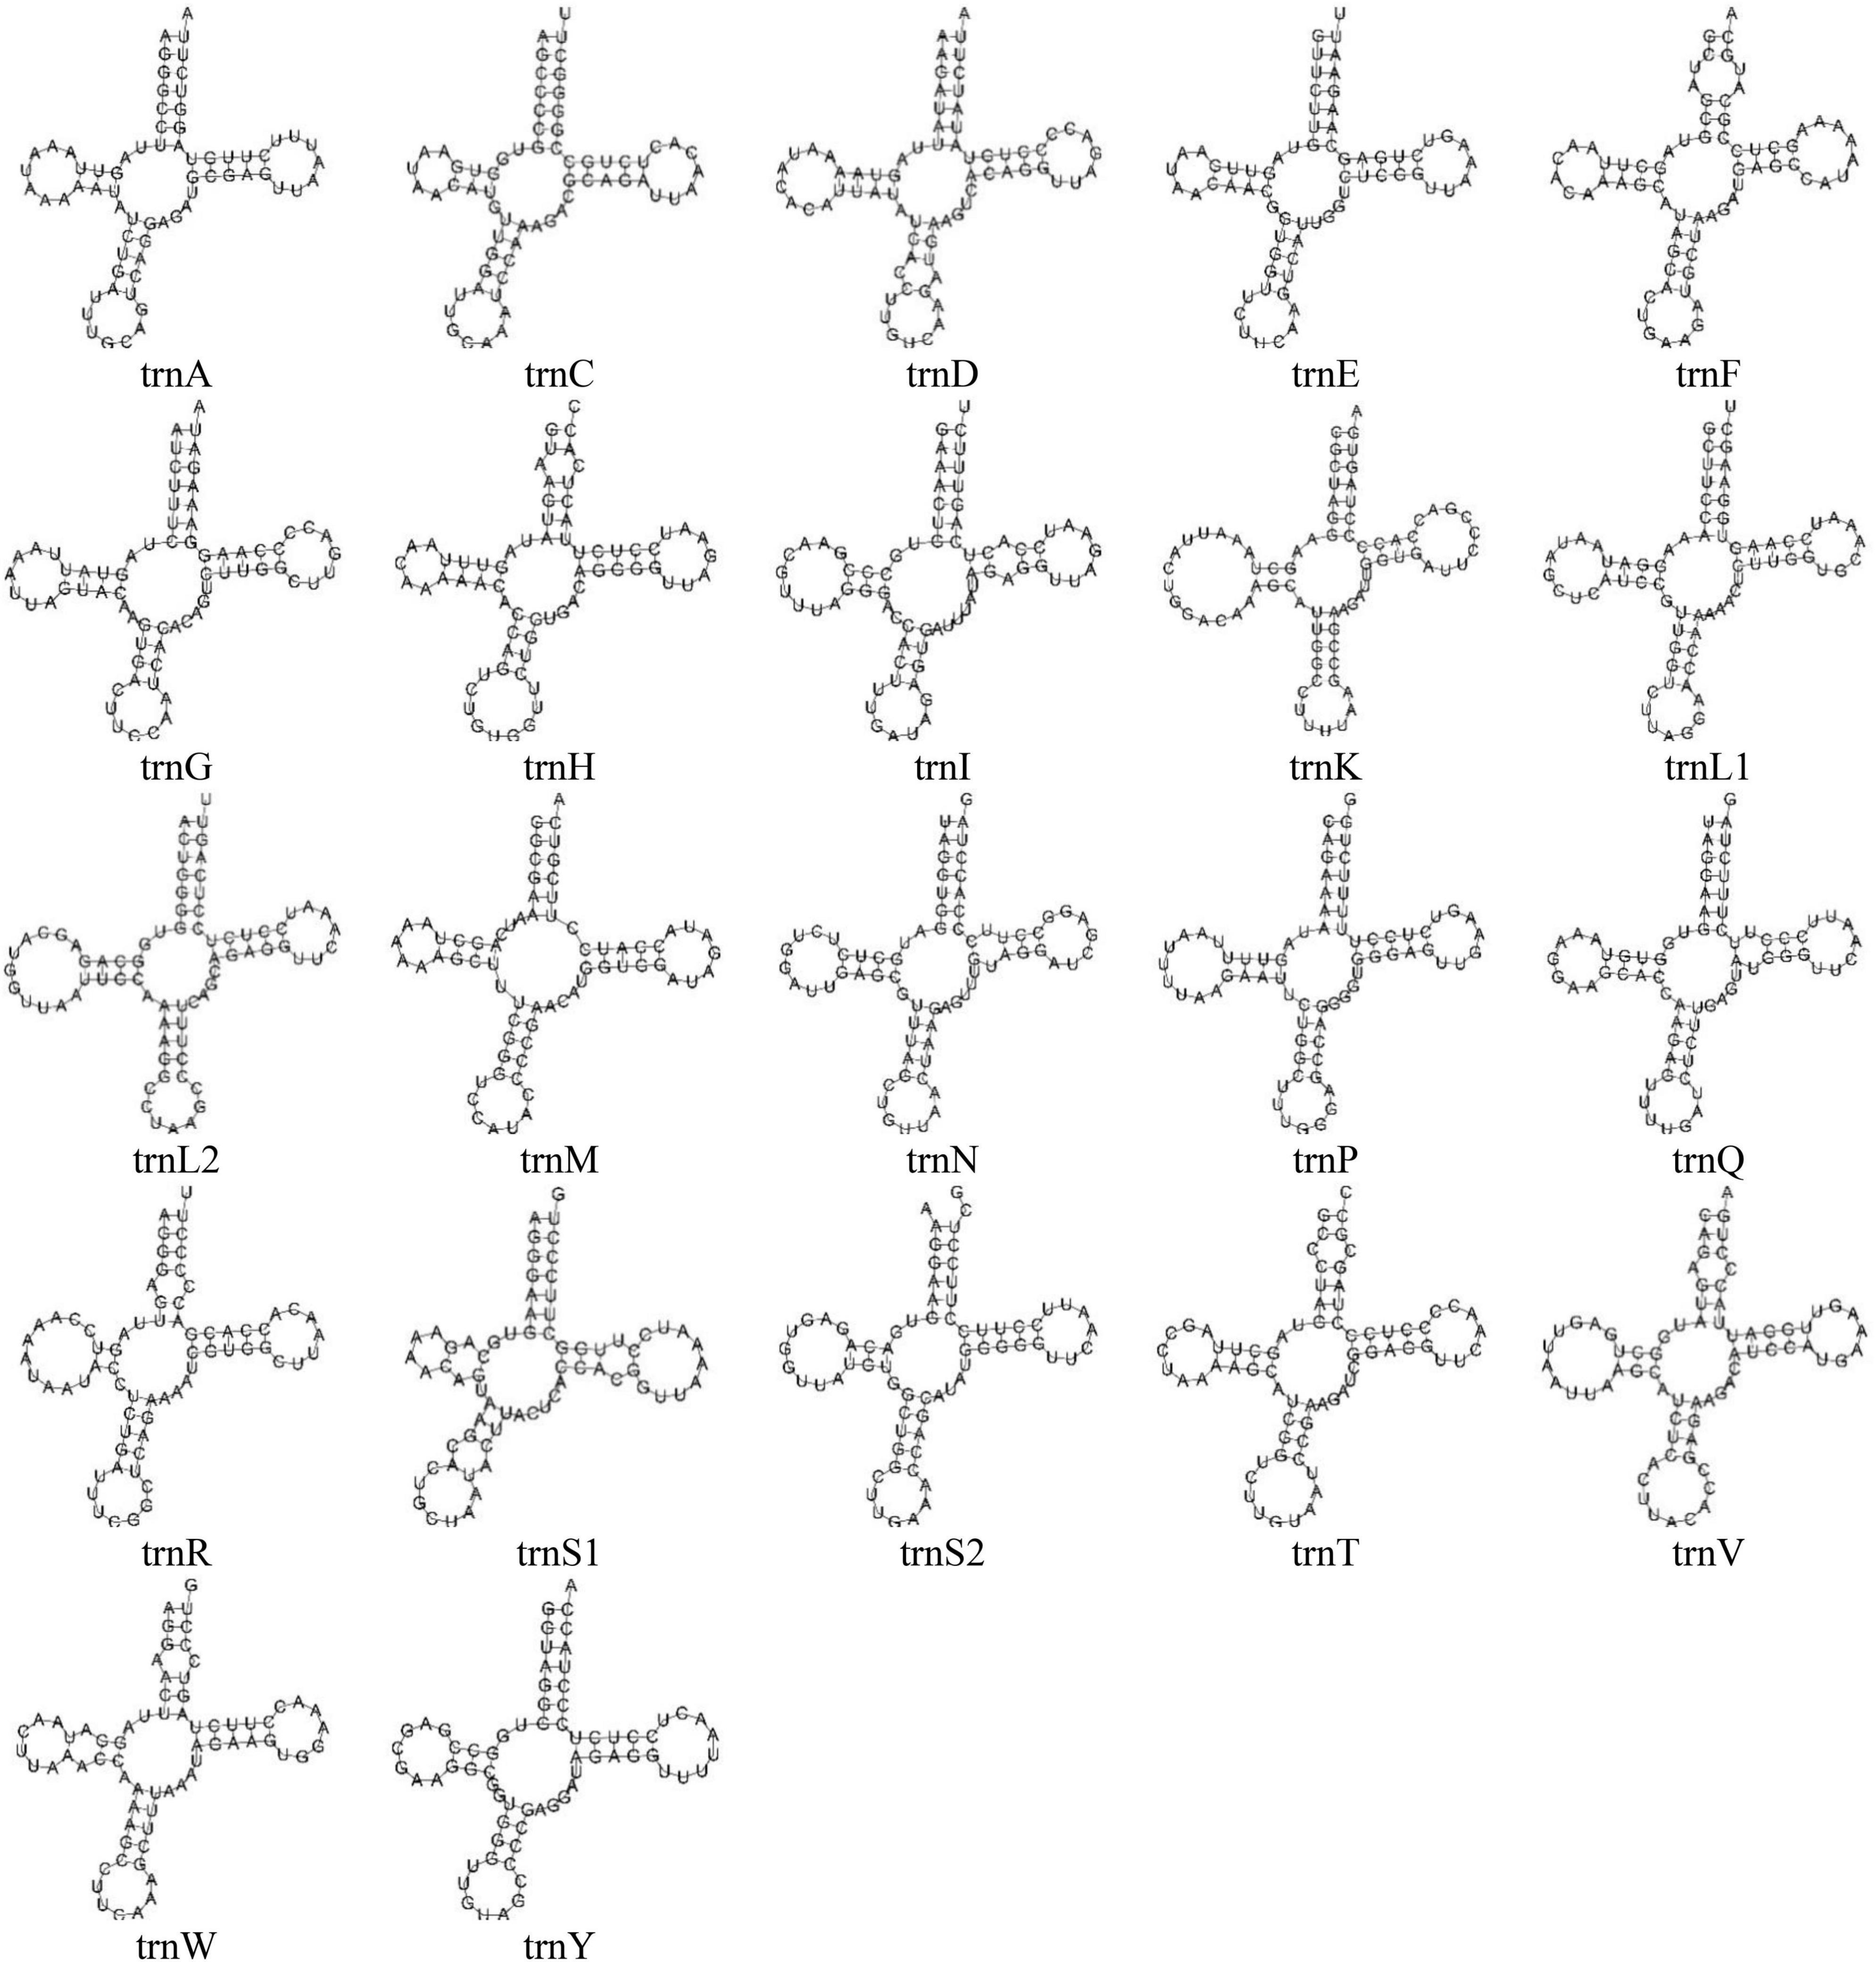
Figure 2. The predicted secondary structures of 22 typical tRNA genes of the O. salsburyi mitogenome.
Ribosomal RNAs and the A + T-rich region
The mitochondrial genomes of O. salsburyi, O. pentalineatus, O. schlegelii, O. hasseltii, and O. melanopleurus each contained two rRNA subunits, 12S and 16S, located on the H-strand and separated by tRNAVal. The length of the two rRNA subunits varied between species (Kartavtsev et al., 2007), with a total size ranging from 2,590 to 2,604 bp. The two rRNAs in the five Osteochilus species exhibited negative GC-skew value and positive AT-skew value, indicating a higher amount of As and Cs in the two gene. The A + T-rich region, commonly used for regulation of mitogenome replication and transcription, was also present (Zhang and Hewitt, 1997). The A + T contents of 16S of the five Osteochilus species ranged from 57.60% to 59.06%, which were all slightly higher than that of 12S. The similar phenomenon was observed in other Cyprinidae, such as O. hasseltii (57.90% in 16S and 51.61% in 12S) and Cirrhinus microlepis (56.69% in 16S and 50.99% in 12S). All five Osteochilus species had an OL, and a D-loop region. Thereinto, the D-loop region was the longest and located between tRNAPro and tRNAPhe, ranging from 489 to 940 bp. The OL was the second-longest non-coding region, positioned downstream of tRNAAsn and the upstream region of tRNACys. This region could fold into a stable stem-loop secondary structure, with 18 bp in the stem and 12 or 15 bp in the loop. The putative structural elements of the OL of O. salsburyi were shown in Figure 3, and the conserved motif 5’-GCCGG-3’ was found at the base of the stem, together with the tRNACys, so were those of the remaining four species. In fact, it was also noted in other fishes, such as Argyrosomus argentatus (Cheng et al., 2012), Oplegnathus fasciatus (Oh et al., 2007b), and Halichoeres poecilopterus (Oh et al., 2007a). It was speculated that this conserved motif may be involved in the RNA-DNA transformation process (Hixson and Brown, 1986). Of course, this feature also existed in some other Cyprinids. Additionally, palindromic motifs TACAT and ATGTA, which tended to form hairpin loop structures, were found in multiple copies throughout the control region and were considered the termination site for the elongation of the H-strand (Saccone et al., 1991). These features were also observed in other closely related cyprinid fishes and other vertebrates (Wang et al., 2007; Prabhu et al., 2019).
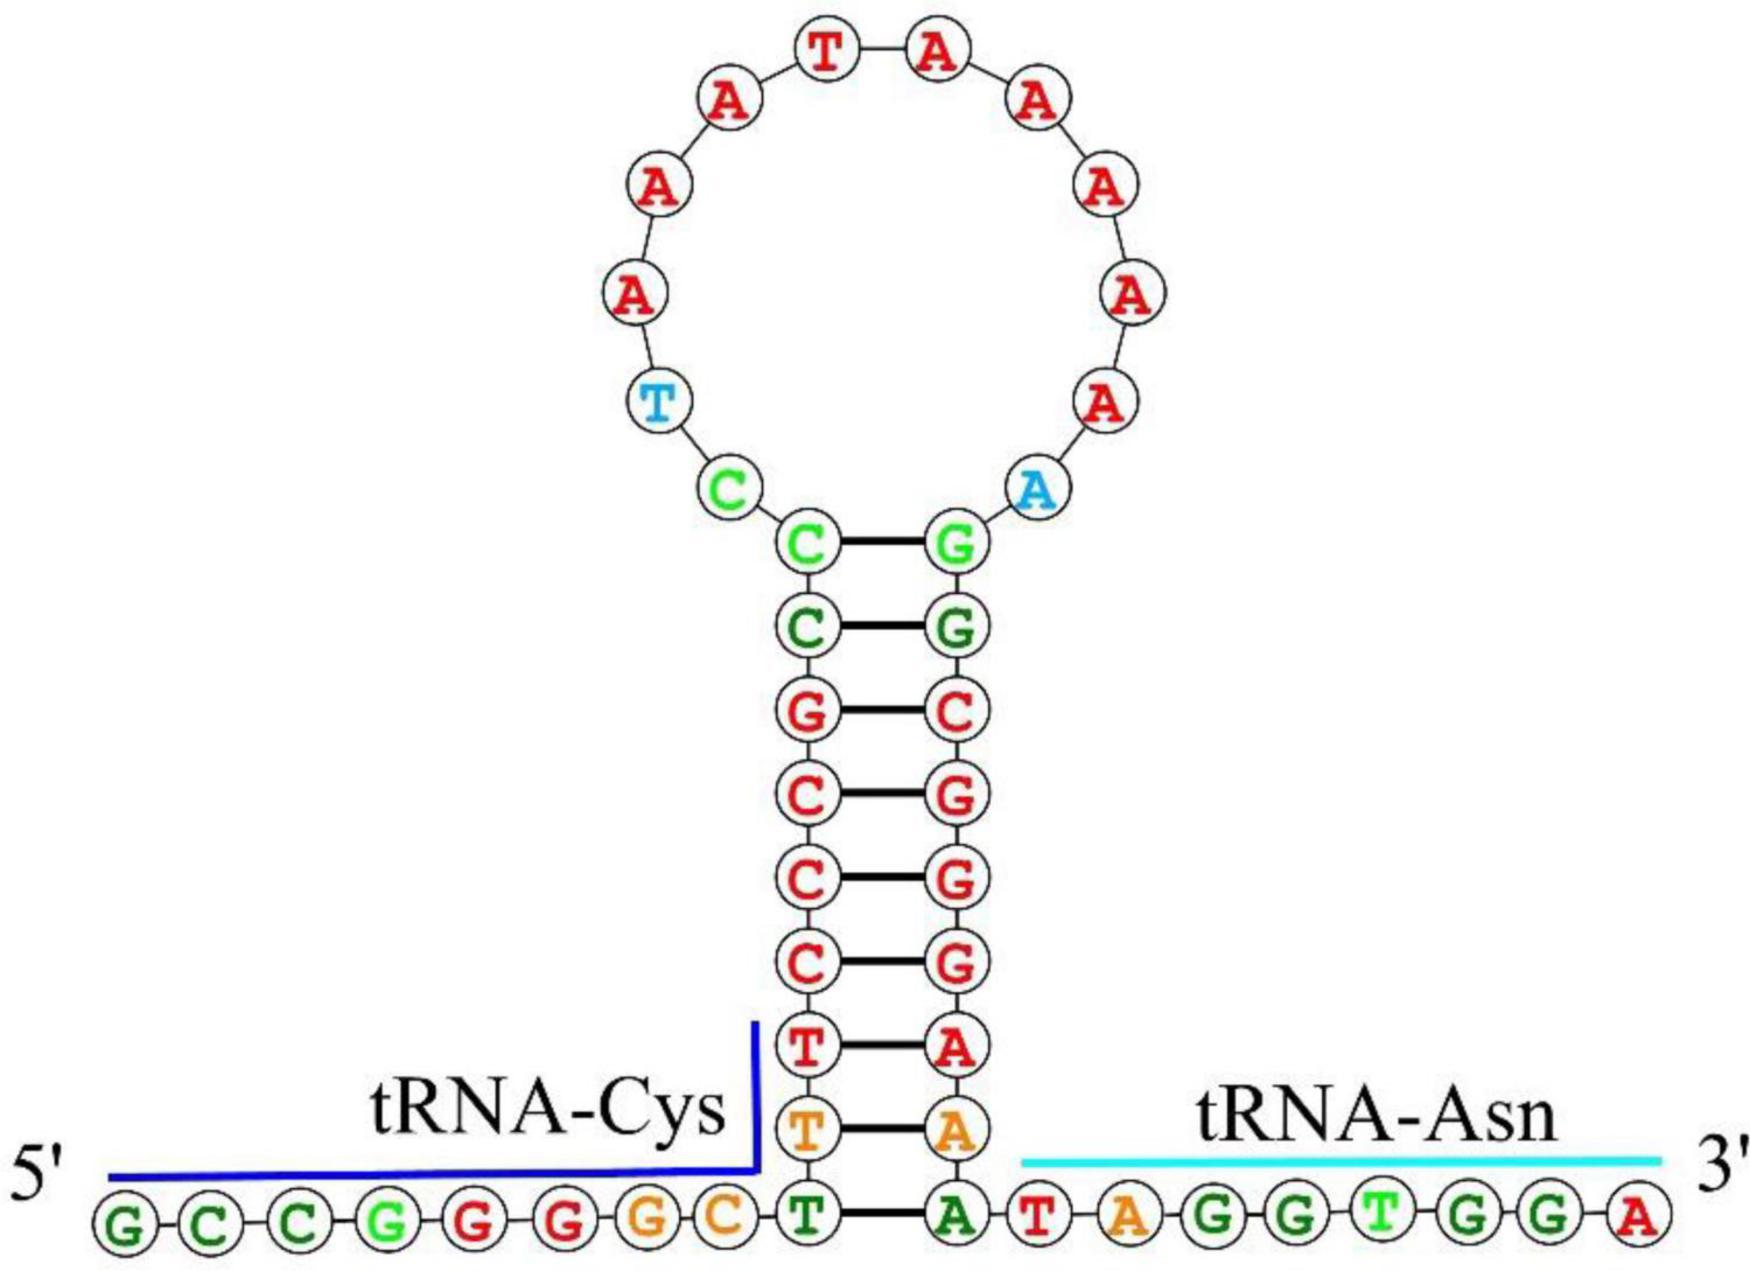
Figure 3. The putative hairpin secondary structure of the OL found in the O. salsburyi mitogenome.
Protein-coding genes
The length of the 13 PCGs in the five Osteochilus species ranged from 11,403 to 11,418 bp, which encoded between 3,801 and 3,806 amino acids. Of these 13 PCGs, only the ND6 gene was encoded on the L-strand, while the remaining 12 PCGs were encoded on the H-strand. While the COI gene was initiated by a GTG codon, the other PCG genes were initiated by the conventional ATG codon. This phenomenon was not unique to Osteochilus species and also had been observed in other teleost fishes (Moreira et al., 2016; Wei et al., 2016). The termination codons of the 13 PCGs in the five Osteochilus species were TAA, TAG, and T–. Among them, termination codons of ND1, COI, COX III, ND4L, ND5, and ATP6 genes were all typical TAA codons. However, the termination codon of the remaining seven PCGs were different across the species. In O. salsburyi, ND3, ND4, ND6, and ATP8 genes terminated with TAG, while ND2, COII, and Cyt b had an incomplete termination codon T– (Table 3). In the other four Osteochilus species, the termination codons of ND2, COX II, and ND4 genes were TAG, T–, and T–, respectively. Differently, the ATP8 gene of O. pentalineatus had a termination codon of TAA, while those of O. schlegelii, O. hasseltii, and O. melanopleurus had TAG. the termination codons of ND3 gene of O. pentalineatus and O. hasseltii were all TAG, whereas those of O. schlegelii and O. melanopleurus had an incomplete termination codon TA-. Additionally, the termination codon of ND6 gene of O. melanopleurus was TAG, but the remaining three Osteochilus species had a TAA codon. Similarly, the termination codon of Cyt b gene of O. schlegelii was TAA, while the remaining three Osteochilus species had an incomplete termination codon T– (Supplementary Table 1). The stop codons seem to have an ability to change in fish mitogenomes, indicating that it may have undergone a rapid evolutionary process (Kim et al., 2004; Peng et al., 2006). The phenomenon of incomplete termination codon was speculated to be completed after post-transcriptional polyadenylation, which was commonly used in metazoan mitogenomes (Ojala et al., 1981; Wolstenholme, 1992). The contents of four bases in the 13 PCGs of the five Osteochilus species varied, with the base A occupying at the most and the base G at the least. The A + T contents of all PCGs in the five Osteochilus species ranged from 56.67 to 60.19%, revealing a bias toward thymine and adenine nucleotide composition. In addition, the AT-skew and GC-skew values of all PCGs in the five Osteochilus species mitogenome were shown in Table 3 and Supplementary Table 1. It was observed that the AT-skew values of COI and ND6 genes of the five Osteochilus species were positive, while the GC-skew values of all the PCGs were negative except for ND6, which were conventional in teleost.
Screening of optimal codons
In this study, the GC content and ENC values analyzed for 13 PCGs of O. salsburyi, with GCall, GC1, GC2, GC3, and ENC values being 39.82, 48.39, 40.34, 30.74, and 40.433, respectively. The GCall, GC1, GC2, GC3, CAI and ENC values for each individual gene ranged from 36.79 to 47.14%, 36.79 to 54.55%, 34.35 to 46.99%, 23.68 to 41.41%, 0.104 to 0.224, and 34.137 to 44.760, respectively. We observed similar results in the other four Osteochilus species. Furthermore, we found that 10 PCGs of O. salsburyi, O. schlegelii and O. hasseltii, 11 PCGs of O. pentalineatus, and 12 PCGs of O. melanopleurus had the lowest GC3 content and the highest GC1 content, indicating a general order of GC content of different codon positions as GC1 > GC2 > GC3. The two major genes (nad2 and ATP8) of the Osteochilus species had the lowest GC3 content, the highest GC2 content, and GC3 was the lowest (Table 4 and Supplementary Table 2). Meanwhile, the results of Pearson correlation analysis showed that GCall was significantly correlated with GC1 GC2, and GC3, but not with other groups. RSCU values were calculated for the codon usage patterns of various genes or gene groups (Cai et al., 2009). The average frequencies of all the PCGs codons of the five Osteochilus species were calculated and displayed in Table 5 and Supplementary Table 3. Relative synonymous codon usage was an important index to directly reflect codon usage bias (Sharp et al., 1986), and we observed that the codons of all PCGs had a strong bias, and relative synonymous codon usage values of NNU and NNA were mostly greater than 1, indicating relatively higher frequency of usage. It could be seen from the relative synonymous codon usage model that the codons related to adenine were more favored in the third codon position among the synonymous substitution codons of each amino acid. Based on the ENC values, we identified COI gene with the highest ENC value and ND2 gene with the lowest ENC value of O. salsburyi as the high and low expression gene groups, respectively. Using the ΔRSCU method, six optimal codons, ACC, UAC, AAC, UGU, AGC, and GGC were determined (Table 6). Based on the same criteria, the number of the optimal codons of O. pentalineatus, O. schlegelii, O. hasseltii, and O. melanopleurus was 10 (UCA, CCA, ACC, UAU, AAA, GAU, GAA, CGU, CGA, and CGG), 6 (AUA, GUU, UCU, GCU, UAU, and CGC), 8 (UUC, UAC, AAA, GAC, CGU, CGA, CGG, and GGC), and 5 (UUU, AUU, CAU, CGA, and GGA), respectively. Numerous studies have indicated that multiple factors were associated with codon usage bias (CUB), which could be determined by mutation or by a combination of natural selection and mutation (Bulmer, 1991). Generally speaking, natural selection affecting gene translation and the pressure of directed mutation on DNA sequences were the two key factors that explain the variation in codon usage between species and within genome. The results of this study suggested that mutation might not affect influenced the CUB, except for natural selection.
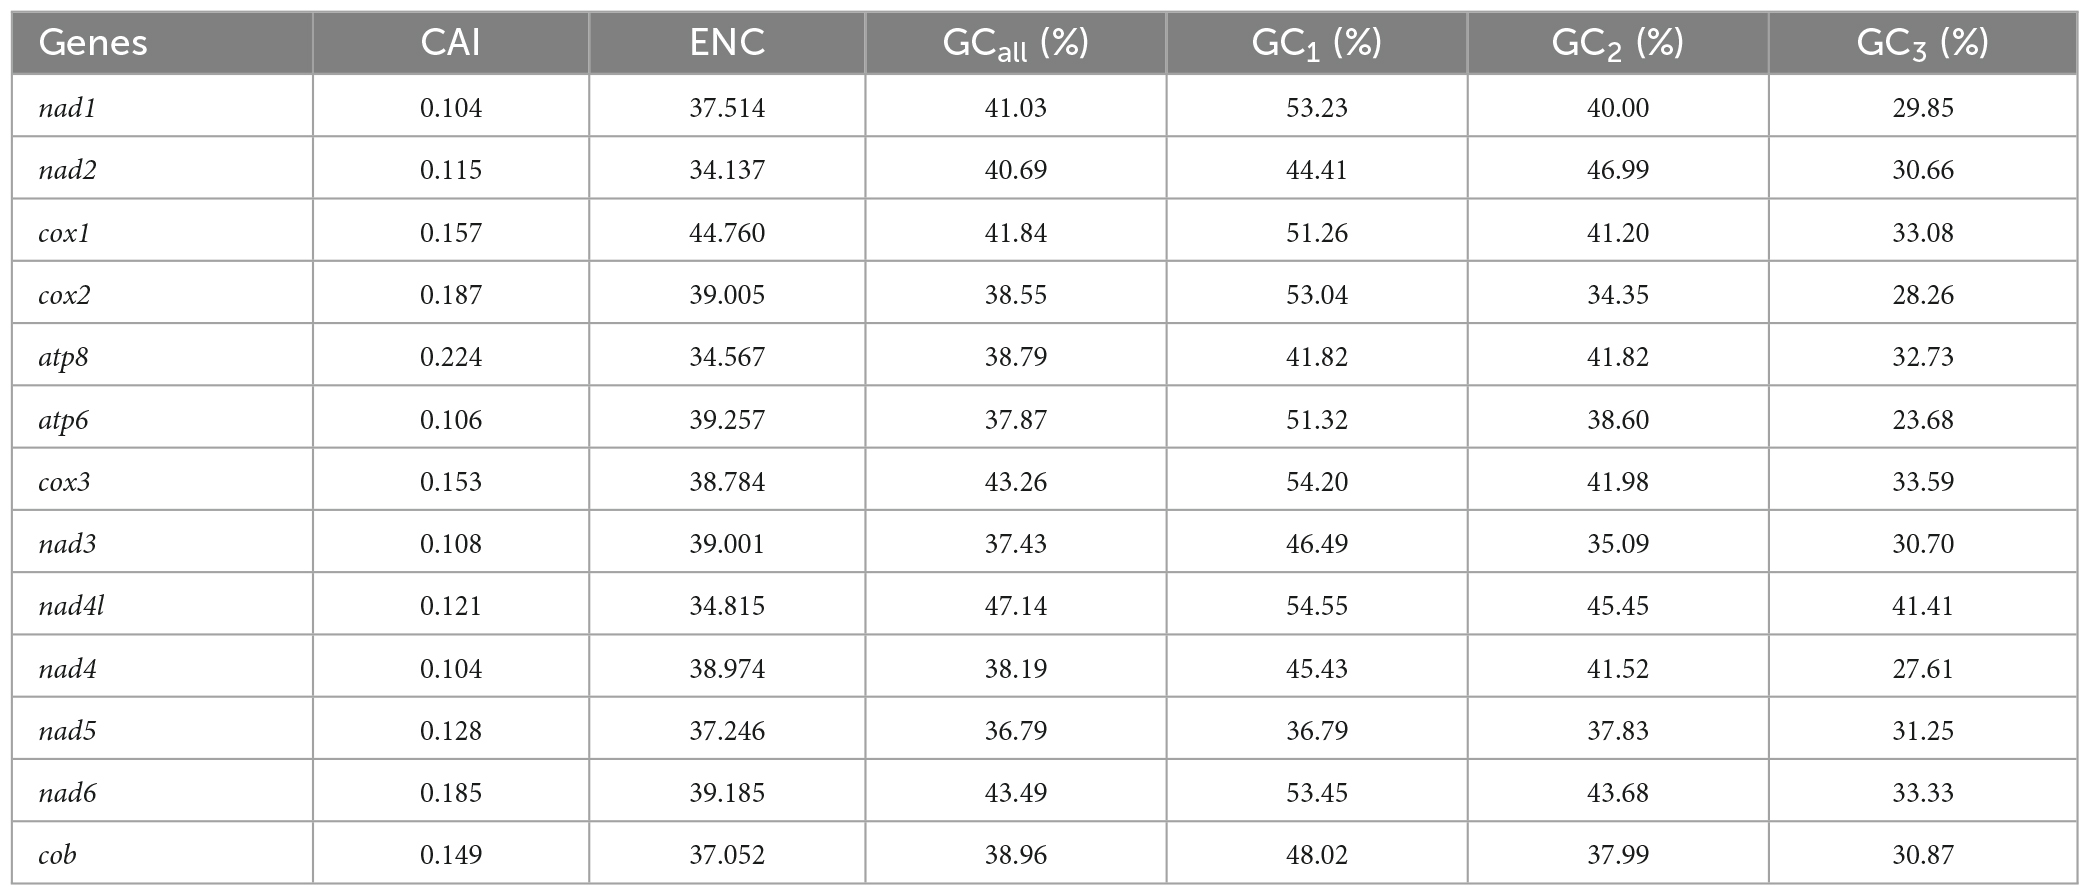
Table 4. Analysis of codon adaption index (CAI), effective number of codon (ENC) and GC content of the 13PCGs of O. salsburyi.
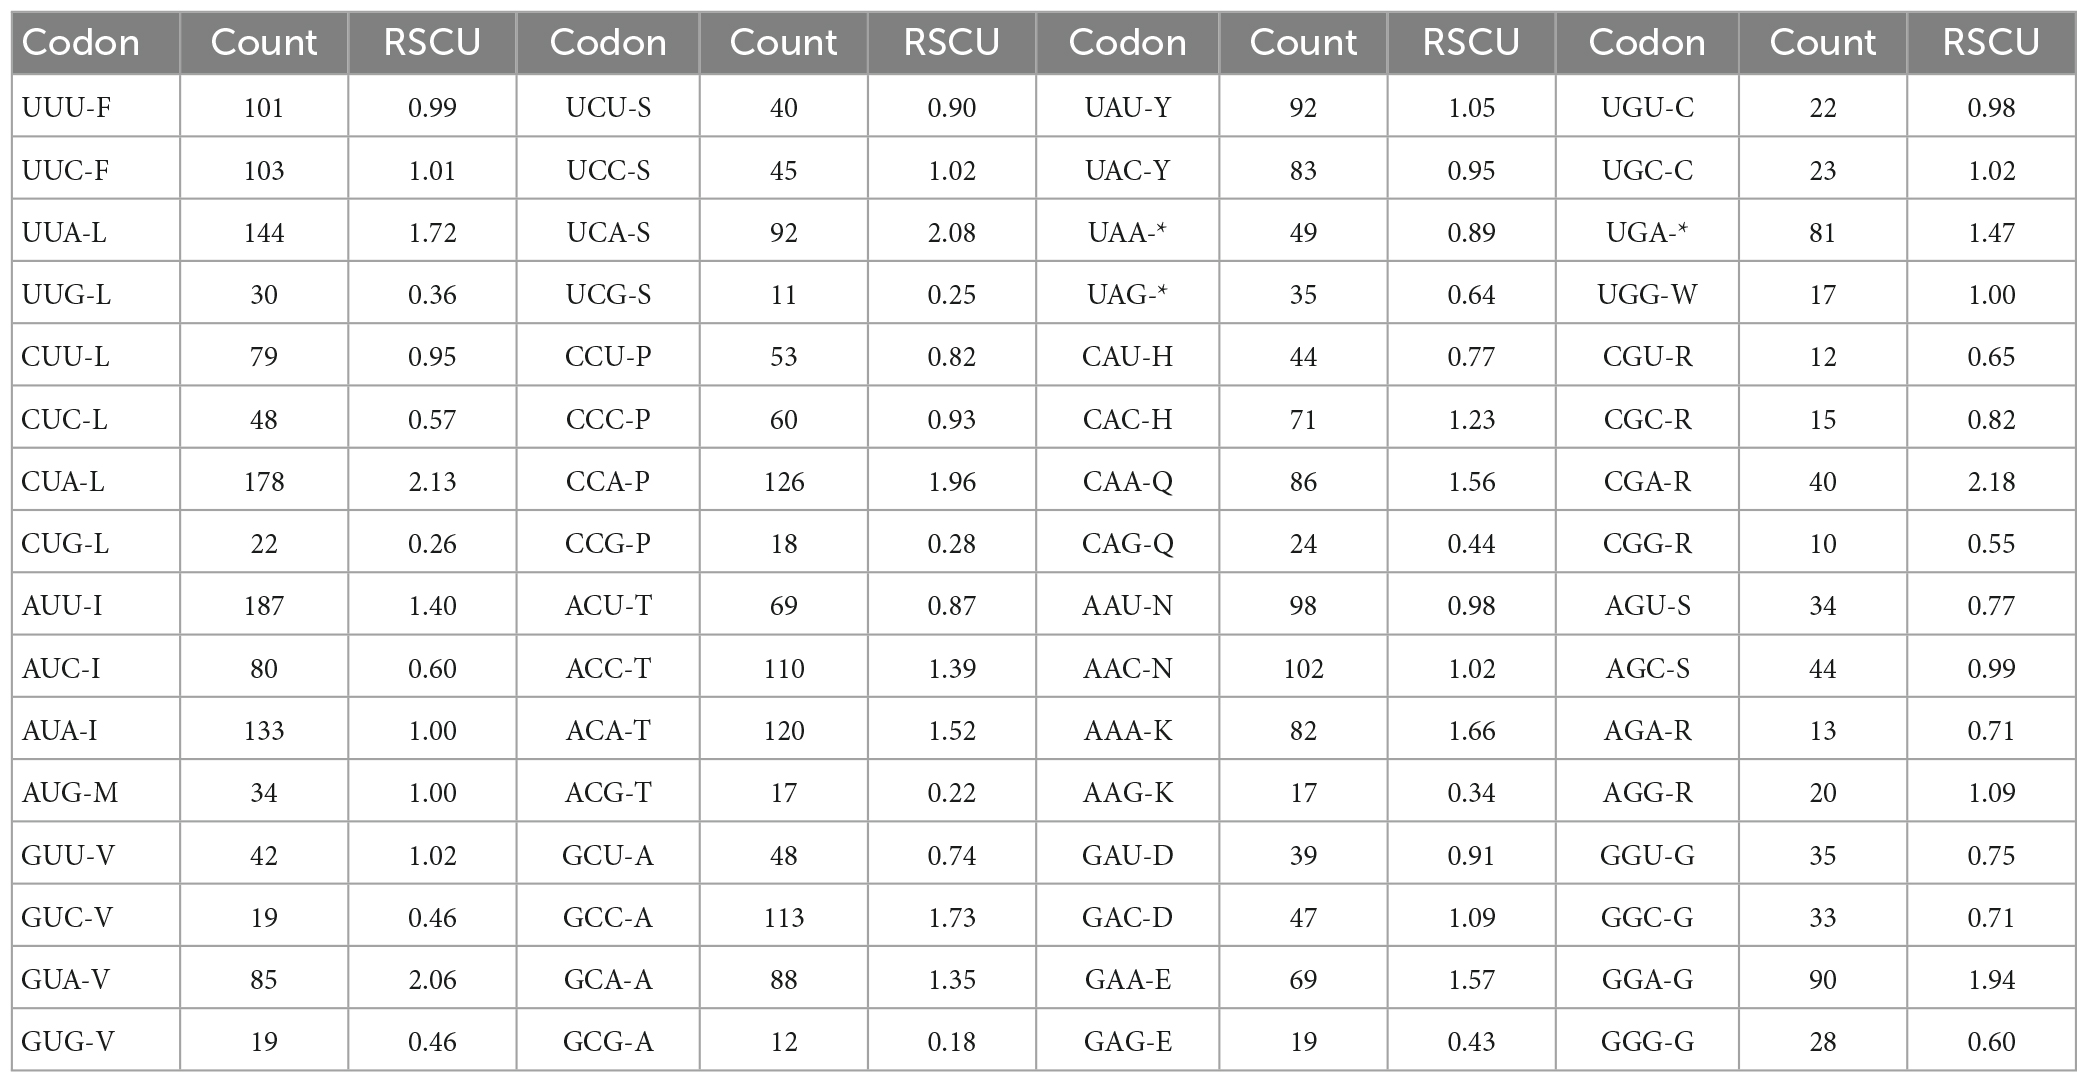
Table 5. The codon number and relative synonymous codon usage (RSCU) in O. salsburyi mitochondrial protein coding genes.
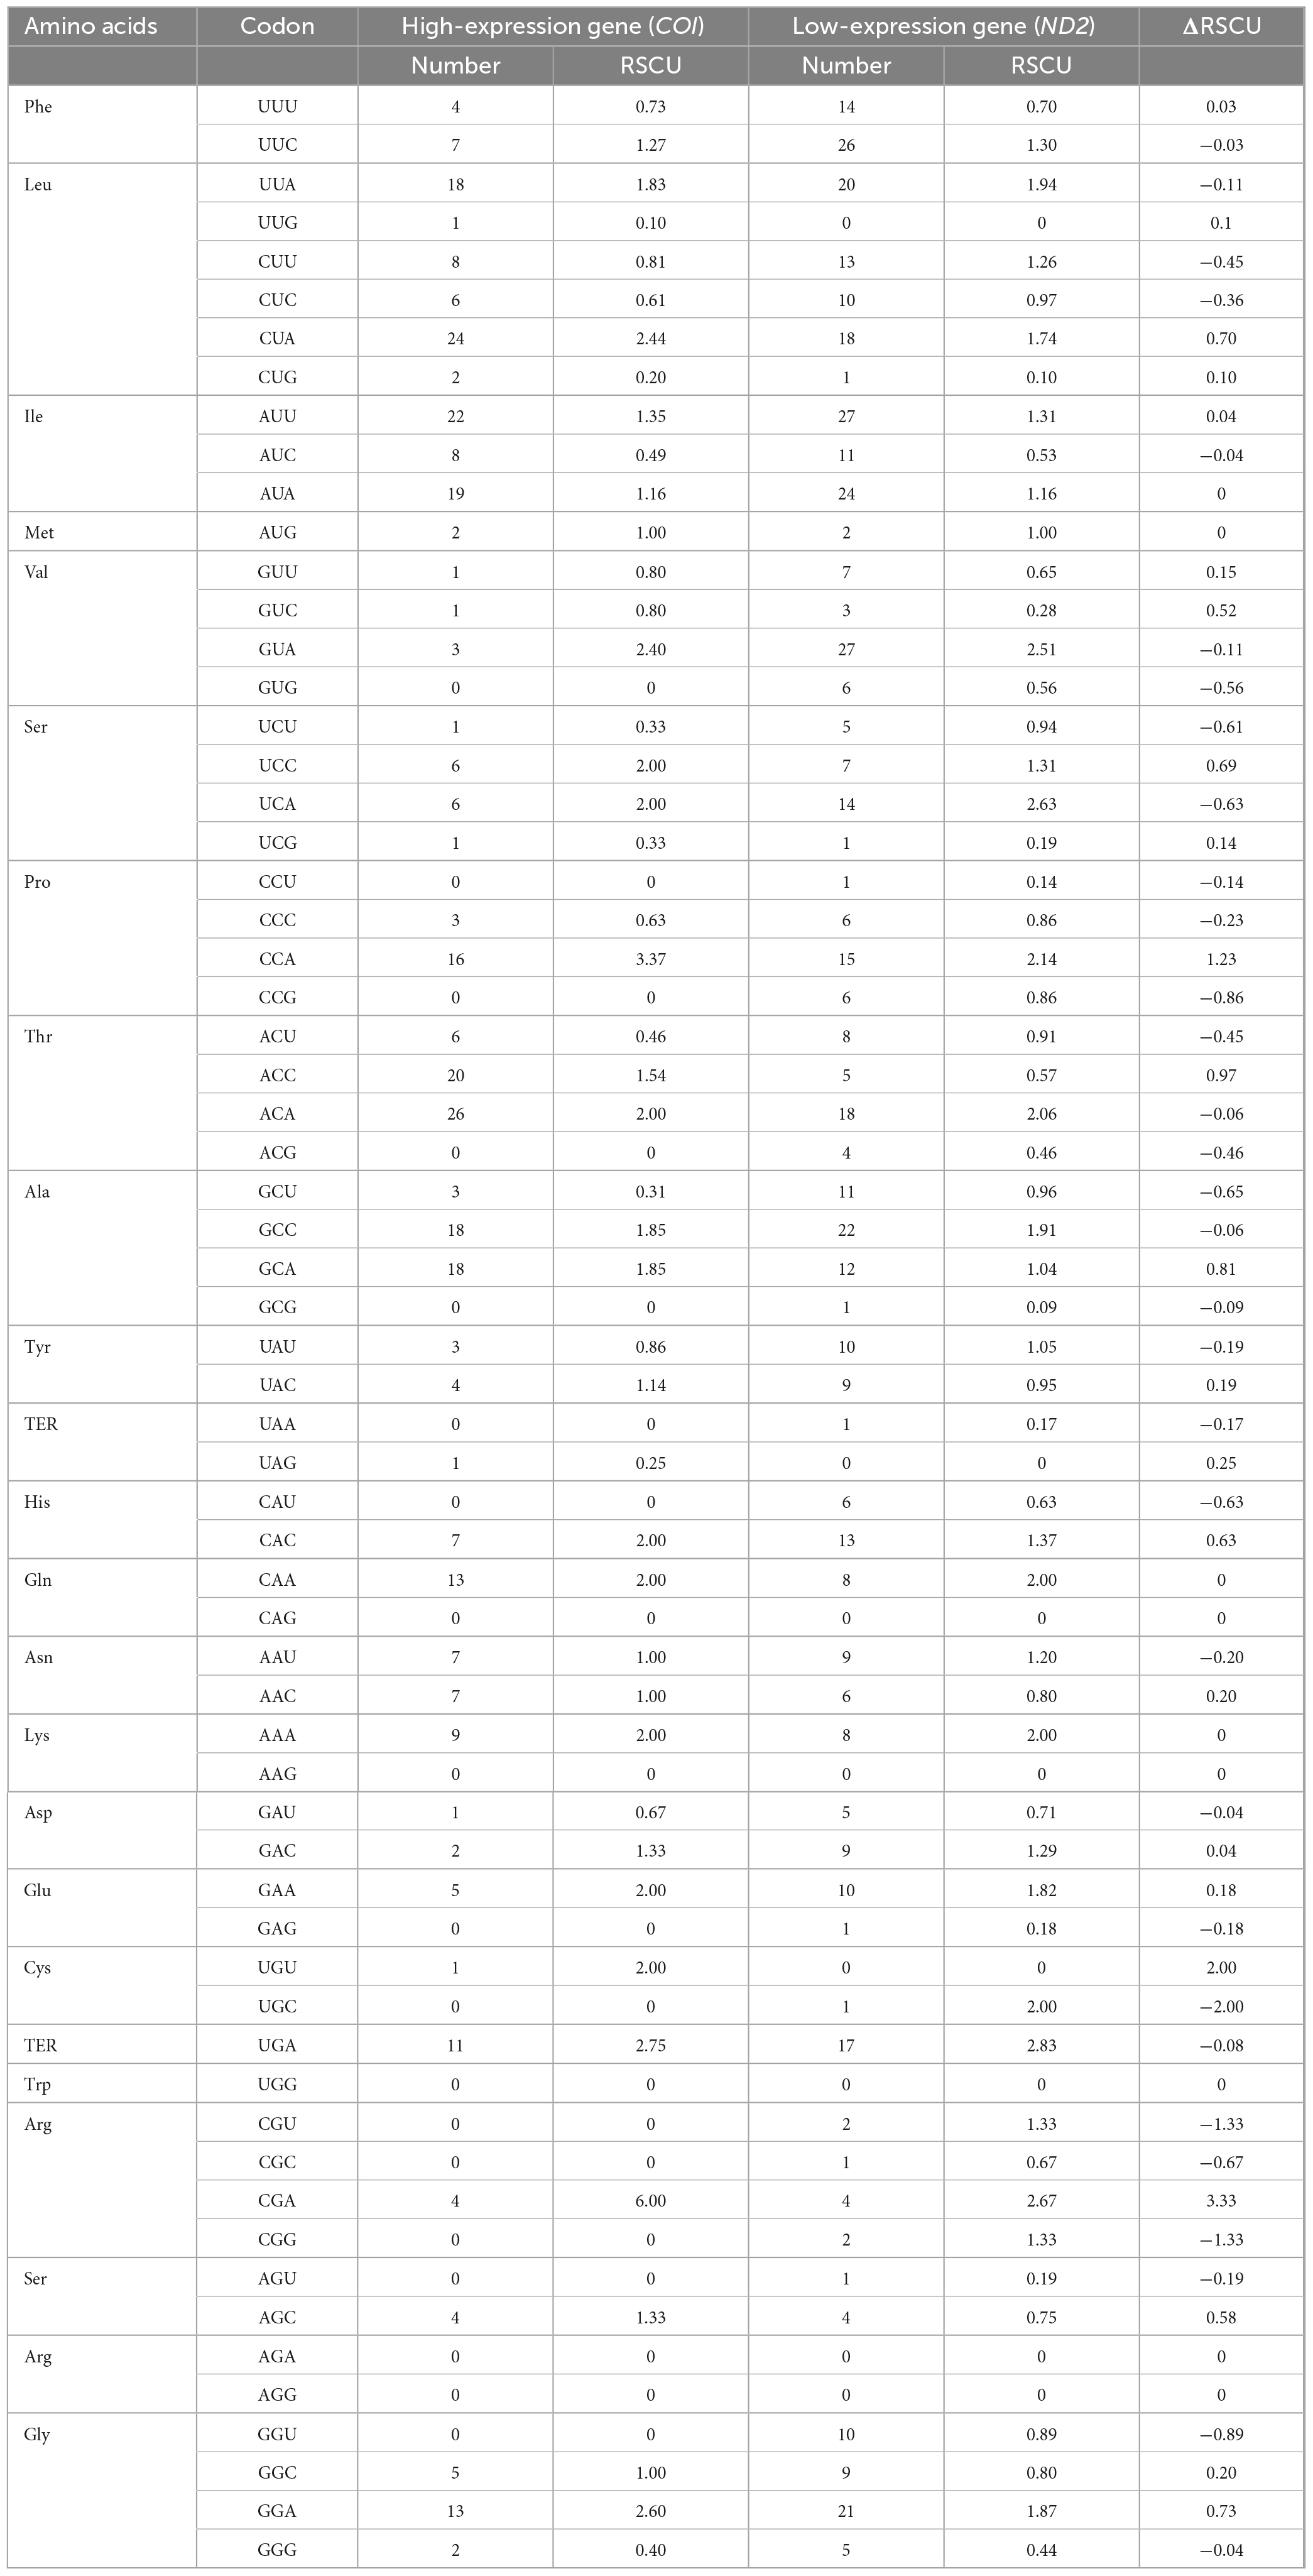
Table 6. Optimal codons analysis of the 13PCGs of O. salsburyi.
Phylogenetic analysis and divergence time estimation
To understand the phylogenetic relationship of O. salsburyi, a phylogenetic analysis was performed on O. salsburyi, together with 26 Cyprinidae species. The nucleotide sequences of 12 concatenated PCGs, excluding ND6, were used to construct ML and BI trees. The phylogenetic tree included nine genera of the subfamily Labeoninae, and both ML bootstrap and Bayesian posterior probability values were high, and the topological structure of the two trees were consistent and integrated into one tree (Figure 4). In terms of the tribe Osteochilini, the genus Crossocheilus and Epalzeorhynchos formed a closely related clade with a bootstrap value of 100 and Bayesian posterior probability value of 1, and every two genera were sister groups to each other. Likewise, the genus Henicorhynchus was the sister group of Lobocheilos. These results were consistent with the Yang’s previous research (Yang et al., 2012). The phylogenetic tree revealed that all 26 fishes were appropriately grouped at the genus level. O. salsburyi, along with O. hasseltii, O. melanopleurus, O. pentalineatus, and O. schlegelii formed a monophyletic Osteochilus cluster. Within this cluster, O. hasseltii and O. pentalineatus first formed a cluster and exhibited the closest relationship to each other, forming a cluster together with O. salsburyi. Additionally, the phylogenetic relationship between O. melanopleurus and O. schlegelii was relatively close, and the two species formed a major cluster. In addition, according to the dated topology, the analysis results of the divergence time showed that the Osteochilus species were still divided into two main clades. One cluster comprised O. salsburyi and O. hasseltii, which were grouped together with O. schlegelii, while the other cluster consisted of the remaining two Osteochilus species (O. melanopleurus and O. pentalineatus). According to the estimates provided in Figure 5, the Osteochilus fishes diverged during the Lower Cretaceous, approximately 205.98 million years ago (Mya). This period was a critical time for fish evolution, particularly for ray-finned fish, which became the dominant species in both freshwater and marine ecosystems (Friedman, 2015). The Upper Triassic period was especially important for fish diversification, laying the foundation for the many diverse fish groups that exist today. Whereafter, O. pentalineatus, O. salsburyi and O. hasseltii, as a cluster, were divided about 154.06 Mya, with the divergence time between O. pentalineatus and O. hasseltii occurring approximately 45.35 Mya during the Eocene epoch. In contrast, the divergence time of O. melanopleurus and O. schlegelii was approximately 142.86 Mya, occurring mainly in the late Jurassic and early Cretaceous. The teleostei first emerged during the Jurassic period and since the Cretaceous period, their families have continued to expand and establish themselves as dominant species in rivers, lakes, and seas. Many popular fish species such as grass carp, catfish, and yellow croaker belong to the teleostei family. Generally speaking, the topological structure of the phylogenetic tree was basically consistent with the evolutionary relationships between these Osteochilus species, indicating that traditional taxonomy and molecular classification were in agreement. Our analysis confirmed the monophyly of O. salsburyi and strongly supported its taxonomic status within the Osteochilus genus. This study was the first comprehensive report on the phylogenetic relationships and evolution history on O. salsburyi in detail, with the goal of providing assistance for the protection and sustainable development and utilisation of the species.
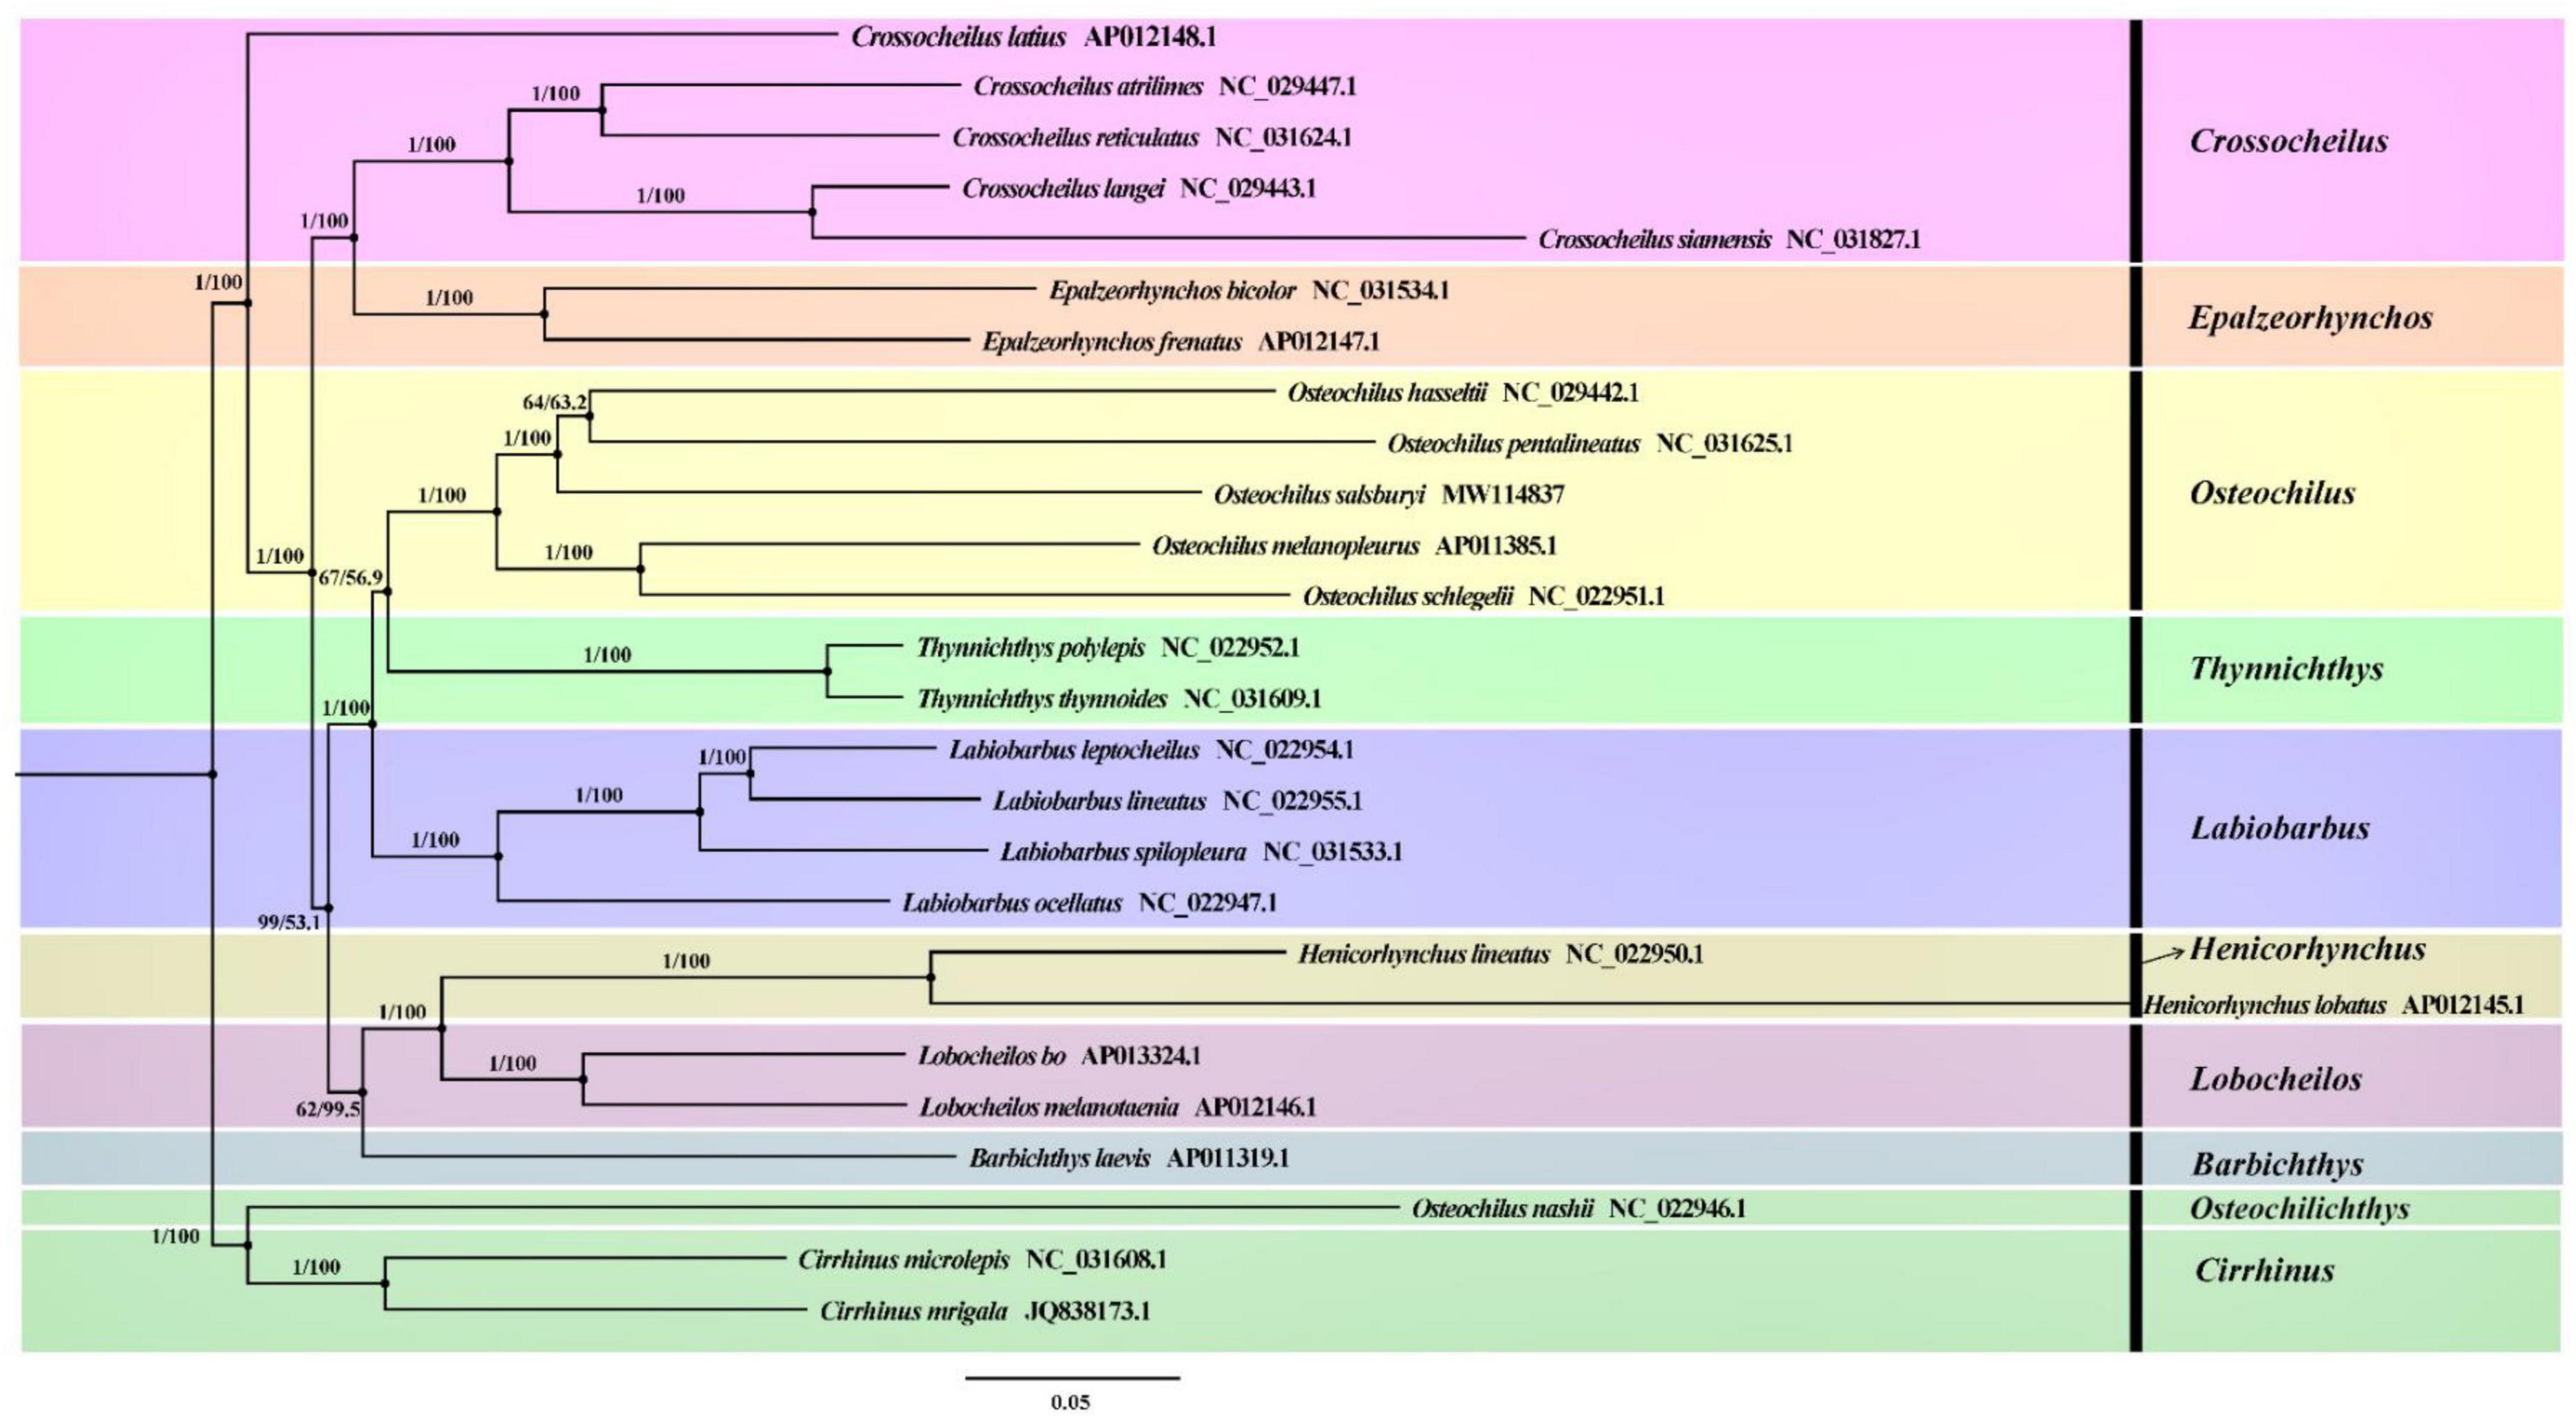
Figure 4. Phylogenetic trees derived from BI and ML analyses were constructed among 26 Cyprinidae species based on nucleotide sequences of the remaining 12 concatenated PCGs except ND6. The first numbers at each node are the bootstrap values of posterior probabilities, and the second number is ML bootstrap values based on nucleotide sequences.
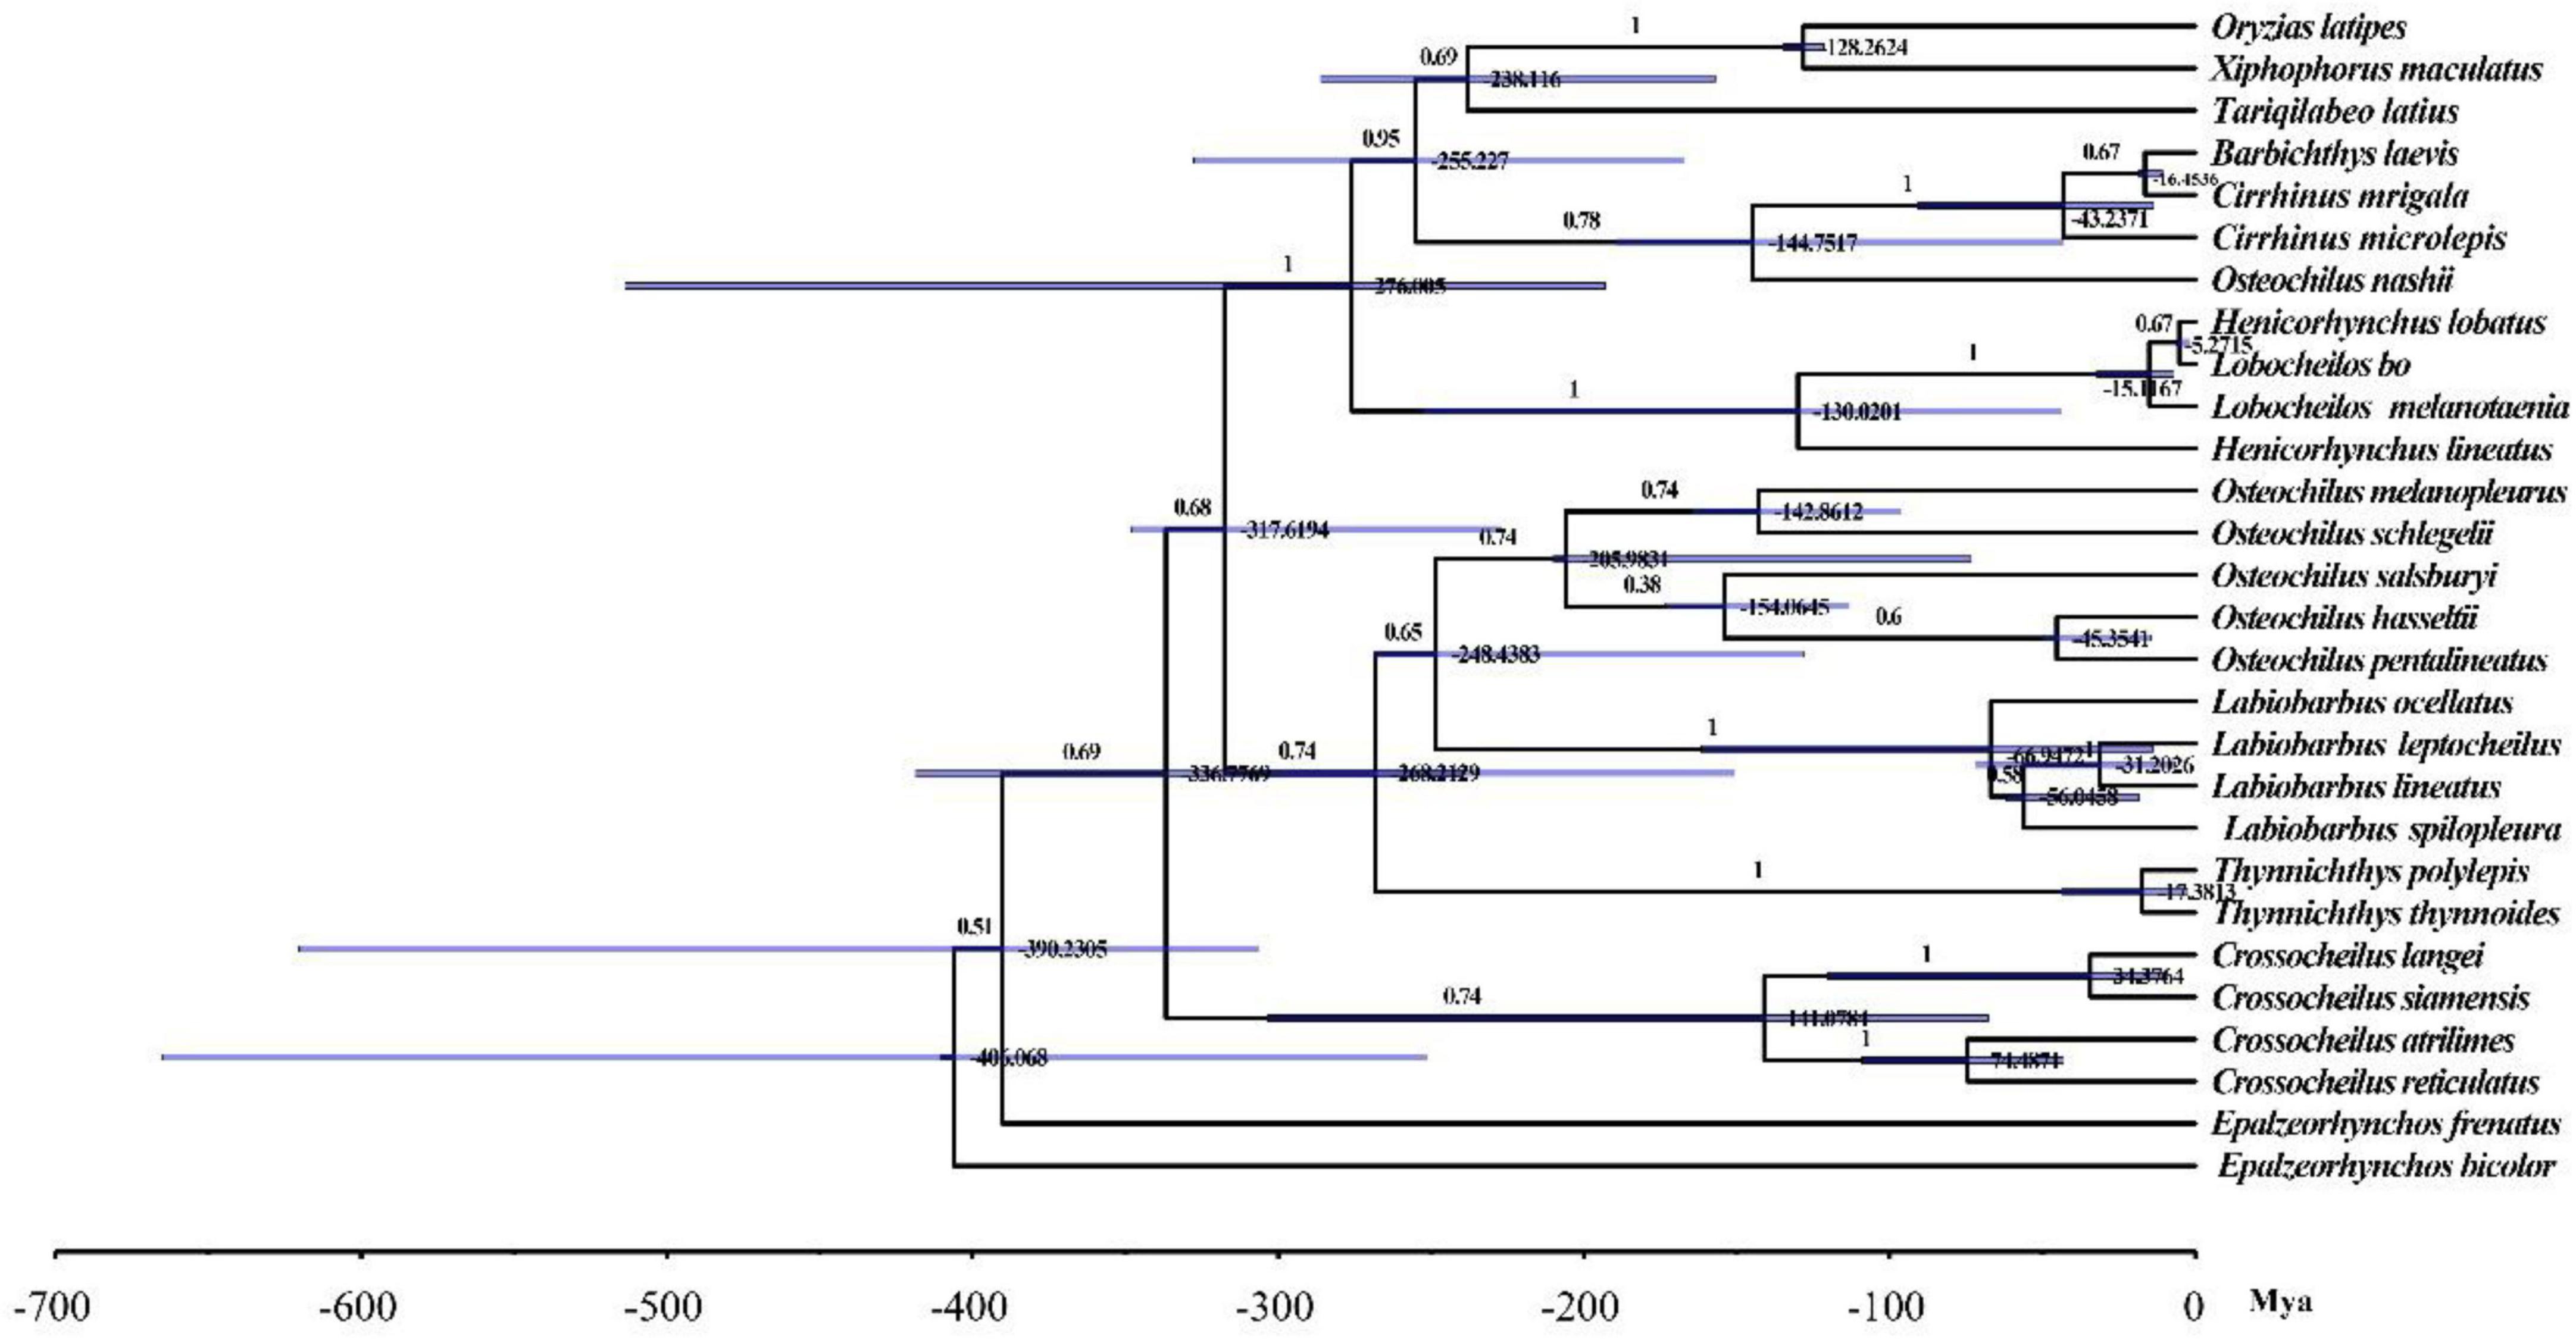
Figure 5. Divergence time estimates for Osteochilus based on the complete mitochondrial genomes. Numbers at nodes indicate age estimates for the major clades.
Conclusion
During our research, we conducted a thorough analysis of the promoters, terminators, and anti-codons of the 13 PCGs in O. salsburyi, O. hasseltii, O. melanopleurus, O. pentalineatus, and O. schlegelii. Additionally, we predicted the secondary structure of 22 typical tRNA genes and provided a detailed analysis of the OL region. Furthermore, we described in detail the codon number and relative synonymous codon usage of the PCGs in the five Osteochilus species and found a strong bias. Using the ΔRSCU method, we identified the optimal codons of the five Osteochilus species. In addition, the study reported for the first time the phylogenetic relationship of O. salsburyi mitogenome within the Cyprinidae family, and our results strongly supported that O. salsburyi was part of the Osteochilus genus. These findings are valuable in understanding the evolutionary biology and population genetic diversity of O. salsburyi.
Data availability statement
The datasets presented in this study can be found in online repositories. The names of the repository/repositories and accession number(s) can be found below: https://www.ncbi.nlm.nih.gov/genbank/, MW114837.
Ethics statement
This animal study was reviewed and approved by the Animal Care and Use Committee of Ningbo University.
Author contributions
CZ designed the experiment, analysed the data, prepared figures and tables, authored or reviewed drafts of the manuscript, and approved the final draft. SZ and ZT performed the experiments. DW authored or reviewed drafts of the manuscript. SX conceived and designed the experiments, contributed reagents, materials, and analysis tools, authored or reviewed drafts of the manuscript, approved the final draft, and provided funding. All authors read and approved the final manuscript.
Funding
This work was supported by the National Natural Science Foundation of China (31872586), the Open Project of Agriculture Ministry Key Laboratory of Healthy Freshwater Aquaculture, and Key Laboratory of Freshwater Aquaculture Genetic and Breeding of Zhejiang Province, China (ZJK201903), the Zhejiang Major Science Project (2019C02059), and by K. C. Wong Magna Fund in Ningbo University.
Acknowledgments
We sincerely thank Dr. Hanjing Liu of Sun Yat-sen University for her help in sampling.
Conflict of interest
The authors declare that the research was conducted in the absence of any commercial or financial relationships that could be construed as a potential conflict of interest.
Publisher’s note
All claims expressed in this article are solely those of the authors and do not necessarily represent those of their affiliated organizations, or those of the publisher, the editors and the reviewers. Any product that may be evaluated in this article, or claim that may be made by its manufacturer, is not guaranteed or endorsed by the publisher.
Supplementary material
The Supplementary Material for this article can be found online at: https://www.frontiersin.org/articles/10.3389/fevo.2023.1170927/full#supplementary-material
Footnotes
- ^ https://github.com/ndierckx/NOVOPlasty
- ^ http://ogdraw.mpimp-golm.mpg.de/
- ^ http://lowelab.ucsc.edu/tRNAscan-SE/index.html
- ^ http://www.bioinformatics.nl/emboss-explorer/
References
Angellotti, M. C., Bhuiyan, S. B., Chen, G., and Wan, X. (2007). CodonO: codon usage bias analysis within and across genomes. Nucleic Acids Res. 35, W132–W136. doi: 10.1093/nar/gkm392
Benson, G. (1999). Tandem repeats finder: a program to analyze DNA sequences. Nucleic Acids Res. 27, 573–580. doi: 10.1093/nar/27.2.573
Boore, J. L. (1999). Animal mitochondrial genomes. Nucleic Acids Res. 27, 1767–1780. doi: 10.1093/nar/27.8.1767
Bulmer, M. (1991). The selection-mutation-drift theory of synonymous codon usage. Genetics 129, 897–907. doi: 10.1093/genetics/129.3.897
Burland, T. G. (2000). DNASTAR’s lasergene sequence analysis software. Methods Mol. Biol. 132, 71–91. doi: 10.1385/1-59259-192-2:71
Cai, M. S., Cheng, A. C., Wang, M. S., Zhao, L. C., Zhu, D. K., Luo, Q. H., et al. (2009). Characterization of synonymous codon usage bias in the duck Plague virus UL35 gene. Intervirology 52, 266–278. doi: 10.1159/000231992
Cheng, Y., Xu, T., Jin, X., Shi, G., and Wang, R. (2012). The complete mitochondrial genome of silver croaker Argyrosomus argentatus (Perciforems; Sciaenidae): genome characterization and phylogenetic consideration. Mol. Biol. 46, 200–209. doi: 10.1134/S0026893312020215
Chung, H. H., Kamar, C. K. A., Lim, L. W. K., Roja, J. S. R., Liao, Y. S., Lam, T. T. Y., et al. (2020). Sequencing and characterization of complete mitogenome DNA of Rasbora tornieri (Cypriniformes: Cyprinidae: Rasbora). and its evolutionary significance. J. Genet. 99, 455–477. doi: 10.1007/s12041-020-01221-x
Clayton, D. A. (1991). Replication and transcription of vertebrate mitochondrial DNA. Annu. Rev. Cell Biol. 7, 453–478. doi: 10.1146/annurev.cb.07.110191.002321
Cui, L., Dong, Y., Liu, F., Gao, X., Zhang, H., Li, L., et al. (2017). The first two complete mitochondrial genomes for the family triglidae and implications for the higher phylogeny of scorpaeniformes. Sci. Rep. 7, 416–426. doi: 10.1038/s41598-017-01654-y
Darriba, D., Taboada, G. L., Doallo, R., and Posada, D. (2012). jModelTest 2: more models, new heuristics and parallel computing. Nat. Methods 9, 772–772. doi: 10.1038/nmeth.2109
Dierckxsens, N., Mardulyn, P., and Smits, G. (2016). NOVOPlasty: de novo assembly of organelle genomes from whole genome data. Nucleic Acids Res. 45:e18. doi: 10.1093/nar/gkw955
Friedman, M. (2015). The early evolution of ray-finned fishes. Palaeontology 58, 213–228. doi: 10.1111/pala.12150
Froese, R., and Pauly, D. (2020). FishBase. World Wide Web Electronic Publication. Available online at: https://fishbase.mnhn.fr/search.php (accessed 23 September 2021).
Greiner, S., Lehwark, P., and Bock, R. (2019). OrganellarGenomeDRAW (OGDRAW). version 1.3.1: expanded toolkit for the graphical visualization of organellar genomes. Nucleic Acids Res. 47, W59–W64. doi: 10.1093/nar/gkz238
Guindon, S., and Gascuel, O. (2003). A simple, fast, and accurate algorithm to estimate large phylogenies by maximum likelihood. Syst. Biol. 52, 696–704. doi: 10.1080/10635150390235520
Hixson, J. E., and Brown, W. M. (1986). A comparison of the small ribosomal RNA genes from the mitochondrial DNA of the great apes and humans: sequence, structure, evolution, and phylogenetic implications. Mol. Biol. Evol. 3, 1–18.
Ikemura, T. (1985). Codon usage and tRNA content in unicellular and multicellular organisms. Mol. Biol. Evol. 2, 13–34.
Kartavtsev, Y. P., Jung, S. O., Lee, Y. M., Byeon, H. K., and Lee, J. S. (2007). Complete mitochondrial genome of the bullhead torrent catfish, Liobagrus obesus (siluriformes, amblycipididae): genome description and phylogenetic considerations inferred from the cyt b and 16s rRNA genes. Gene 396, 13–27. doi: 10.1016/j.gene.2007.01.027
Katoh, K., Misawa, K., Kuma, K., and Miyata, T. (2002). MAFFT: a novel method for rapid multiple sequence alignment based on fast fourier transform. Nucleic Acids Res. 30, 3059–3066. doi: 10.1093/nar/gkf436
Kim, Y. J., Kweon, H. S., Kim, I. C., Lee, Y. M., Kim, J. M., and Lee, J. S. (2004). The complete mitochondrial genome of the floating goby, Gymnogobius petschiliensis (Perciformes, Gobiidae). Mol. Cells 17, 446–453.
Lavner, Y., and Kotlar, D. (2005). Codon bias as a factor in regulating expression via translation rate in the human genome. Gene 345, 127–138.
Lavrov, D. V., Brown, W. M., and Boore, J. L. (2000). A novel type of RNA editing occurs in the mitochondrial tRNAs of the centipede Lithobius forficatus. Proc. Natl. Acad. Sci. U S A. 97, 13738–13742. doi: 10.1073/pnas.250402997
Lim, L. W. K., Roja, J. S., Kamar, C. K. A., Chung, H. H., Liao, Y. S., Lam, T. T. Y., et al. (2019). Sequencing and characterization of complete mitogenome dna for Rasbora myersi (cypriniformes: cyprinidae: rasbora). and its evolutionary significance. Gene Rep. 17:100499.
Lowe, T. M., and Chan, P. P. (2016). tRNAscan-SE on-line: integrating search and context for analysis of transfer RNA genes. Nucleic Acids Res. 44, W54–W57. doi: 10.1093/nar/gkw413
Lynch, M. (1997). Mutation accumulation in nuclear, organelle, and prokaryotic transfer RNA genes. Mol. Biol. Evol. 14, 914–925.
Miya, M., and Nishida, M. (2000). Use of mitogenomic information in teleostean molecular phylogenetics: a tree-based exploration under the maximum-parsimony optimality criterion. Mol. Phylogenet. Evol. 17, 437–455.
Moreira, D. A., Buckup, P. A., Britto, M. R., Magalhaes, M. G. P., de Andrade, P. C. C., Furtado, C., et al. (2016). The complete mitochondrial genome of Corydoras nattereri (Callichthyidae: Corydoradinae). Neotrop. Ichthyol. 14:e150167.
Nakatani, M., Miya, M., Mabuchi, K., Saitoh, K., and Nishida, M. (2011). Evolutionary history of Otophysi (Teleostei), a major clade of the modern freshwater fishes: pangaean origin and Mesozoic radiation. BMC Evol. Biol. 11:177.
Oh, D.-J., Kim, J.-Y., Lee, J.-A., and Jung, Y.-H. (2007a). Complete mitochondrial genome of the multicolorfin rainbowfish Halichoeres poecilopterus (Perciformes. Labridae). Korean J. Genet. 29, 65–72.
Oh, D.-J., Kim, J.-Y., Lee, J.-A., Yoon, W.-J., Park, S.-Y., and Jung, Y.-H. (2007b). Complete mitochondrial genome of the rock bream Oplegnathus fasciatus (Perciformes, Oplegnathidae). with phylogenetic considerations. Gene 392, 174–180. doi: 10.1016/j.gene.2006.12.007
Ojala, D., Montoya, J., and Attardi, G. (1981). tRNA punctuation model of RNA processing in human mitochondrial. Nature 290, 470–474.
Peng, Z., Wang, J., and He, S. (2006). The complete mitochondrial genome of the helmet catfish Cranoglanis bouderius (Silurifonnes: Cranoglanididae). and the phylogeny of otophysan fishes. Gene 376, 290–297. doi: 10.1016/j.gene.2006.04.014
Prabhu, V. R., Arjun, M. S., Bhavana, K., Kamalakkannan, R., and Nagarajan, M. (2019). Complete mitochondrial genome of Indian mithun, Bos frontalis and its phylogenetic implications. Mol. Biol. Rep. 46, 2561–2566. doi: 10.1007/s11033-019-04675-0
Ronquist, F., Teslenko, M., van der Mark, P., Ayres, D. L., Darling, A., Hohna, S., et al. (2012). MrBayes 3.2: efficient bayesian phylogenetic inference and model choice across a large model space. Syst. Biol. 61, 539–542. doi: 10.1093/sysbio/sys029
Saccone, C., Pesole, G., and Sbisa, E. (1991). The main regulatory region of mammalian mitochondrial DNA: structure-function model and evolutionary pattern. J. Mol. Evol. 33, 83–91. doi: 10.1007/BF02100199
Salvato, P., Simonato, M., Battisti, A., and Negrisolo, E. (2008). The complete mitochondrial genome of the bag-shelter moth Ochrogaster lunifer (Lepidoptera, Notodontidae). BMC Genomics 9:331. doi: 10.1186/1471-2164-9-331
Sambrook, J., and Russell, D. (2001). Molecular Cloning: a Laboratory Manual, 3rd Edn. New York: Cold Spring Harbor Laboratory Press.
Sharp, P. M., and Li, W. H. (1987). The codon Adaptation Index–a measure of directional synonymous codon usage bias, and its potential applications. Nucleic acids Res. 15, 1281–1295. doi: 10.1093/nar/15.3.1281
Sharp, P. M., Tuohy, T. M. F., and Mosurski, K. R. (1986). Codon usage in yeast: cluster analysis clearly differentiates highly and lowly expressed genes. Nucleic Acids Res. 14, 5125–5143.
Simon, C., Buckley, T. R., Frati, F., Stewart, J. B., and Beckenbach, A. T. (2006). Incorporating molecular evolution into phylogenetic analysis, and a new compilation of conserved polymerase chain reaction primers for animal mitochondrial DNA. Annu. Rev. Ecol. Evol. Syst. 37, 545–579.
Stamatakis, A. (2014). RAxML version 8: a tool for phylogenetic analysis and post-analysis of large phylogenies. Bioinformatics 30, 1312–1313.
Tamura, K., Peterson, D., Peterson, N., Stecher, G., Nei, M., and Kumar, S. (2011). MEGA5: molecular evolutionary genetics analysis using maximum likelihood, evolutionary distance, and maximum parsimony methods. Mol. Biol. Evol. 28, 2731–2739.
Wang, C. H., Chen, Q., Lu, G. Q., Xu, J. W., Yang, Q. L., and Li, S. F. (2008). Complete mitochondrial genome of the grass carp (Ctenopharyngodon idella, Teleostei): insight into its phylogenic position within Cyprinidae. Gene 424, 96–101.
Wang, P. F., Ou, Y. J., Wen, J. F., and Li, J. E. (2016). The complete mitochondrial genome of Arius arius (Siluriformes: Ariidae). Mitochondrial DNA Part B Resour. 1, 551–552.
Wang, X., Wang, J., He, S., and Mayden, R. L. (2007). The complete mitochondrial genome of the Chinese hook snout carp Opsariichthys bidens (Actinopterygii: Cypriniformes). and an alternative pattern of mitogenomic evolution in vertebrate. Gene 399, 11–19.
Wei, H., Ma, H., Ma, C., Zhang, F., Wang, W., Chen, W., et al. (2016). The complete mitochondrial genome sequence and gene organization of Tridentiger trigonocephalus (Gobiidae: Gobionellinae). with phylogenetic consideration. Mitochondrial DNA Part A 27, 3725–3726.
Wolstenholme, D. R. (1992). Genetic novelties in mitochondrial genomes of multicellular animals. Curr. Opin. Genet. Dev. 2, 918–925.
Yang, L., Arunachalam, M., Sado, T., Levin, B. A., Golubtsov, A. S., Freyhof, J., et al. (2012). Molecular phylogeny of the cyprinid tribe Labeonini (Teleostei: Cypriniformes). Mol. Phylogenet. Evol. 65, 362–379.
Yu, F., Yu, J., Zhou, Y., Yan, J., Fang, Y., Wang, W. J., et al. (2016). Phylogenetic study of Ameiurus melas based on complete mitochondrial DNA sequence. mitochondrial DNA A DNA Mapp. Seq. Anal. 27, 4706–4707. doi: 10.3109/19401736.2015.1106511
Keywords: Osteochilus salsburyi, mitogenome, optimal codons, phylogeny, divergence time
Citation: Zhang C, Zhang S, Tian Z, Wang D and Xu S (2023) Identification of optimal codons and analysis of phylogenetic relationship in Osteochilus salsburyi (Teleostei: Cypriniformes) based on complete mitogenome. Front. Ecol. Evol. 11:1170927. doi: 10.3389/fevo.2023.1170927
Received: 21 February 2023; Accepted: 29 March 2023;
Published: 05 May 2023.
Edited by:
Su Xu, Qinghai Normal University, ChinaReviewed by:
Yuki Iwasaki, Nagahama Institute of Bio-Science and Technology, JapanMaria Kamilari, Hellenic Agricultural Organization (ELGO), Greece
Copyright © 2023 Zhang, Zhang, Tian, Wang and Xu. This is an open-access article distributed under the terms of the Creative Commons Attribution License (CC BY). The use, distribution or reproduction in other forums is permitted, provided the original author(s) and the copyright owner(s) are credited and that the original publication in this journal is cited, in accordance with accepted academic practice. No use, distribution or reproduction is permitted which does not comply with these terms.
*Correspondence: Shanliang Xu, xushanliang@nbu.edu.cn