Diversity of Deep-Sea Scale-Worms (Annelida, Polynoidae) in the Clarion-Clipperton Fracture Zone
 Paulo Bonifácio
 Lenka Neal3
  Lénaïck Menot
- 1Independent Researcher, Brest, France
- 2Ifremer, Centre Bretagne, REM EEP, Laboratoire Environnement Profond, Plouzané, France
- 3The Natural History Museum, London, United Kingdom
The polymetallic nodules lying on the seafloor of the Clarion-Clipperton Fracture Zone (CCFZ) represent over 30 billion metric tons of manganese. A single mining operation has potential to directly impact approximately 200 km2 of the seabed per year. Yet, the biodiversity and functioning of the bentho-demersal ecosystem in the CCFZ remain poorly understood. Recent studies indicate a high species diversity in a food-poor environment, although the area remains poorly sampled. Undersampling is aggravated by a combination of low densities of fauna and high habitat heterogeneity at multiple spatial scales. This study examines the Polynoidae, a diverse family of mobile polychaetes. Sampling with an epibenthic sledge and a remotely operated vehicle was performed during the cruise SO239 within the eastern CCFZ. Five areas under the influence of a sea surface productivity gradient were visited. Specimens were identified using morphology and DNA: (i) to provide a more comprehensive account of polynoid diversity within the CCFZ, (ii) to infer factors potentially driving alpha and beta diversity, and (iii) to test the hypothesis that epibenthic polychaetes have low species turnover and large species range. Patterns of species turnover across the eastern CCFZ were correlated with organic carbon fluxes to the seafloor but there was also a differentiation in the composition of assemblages north and south of the Clarion fracture. In contrast to the previous studies, patterns of alpha taxonomic and phylogenetic diversity both suggest that polynoid assemblages are the most diverse at Area of Particular Environmental Interest no. 3, the most oligotrophic study site, located north of the Clarion fracture. Without ruling out the possibility of sampling bias, the main hypothesis explaining such high diversity is the diversification of polynoid subfamily Macellicephalinae, in response to oligotrophy. We propose that macellicephalins evolved under extremely low food supply conditions through adoption of a semi-pelagic mode of life, which enabled them to colonise new niches at the benthic boundary layer and foster their radiation at great depths.
Introduction
Polymetallic nodules are potato-shaped structures varying in size and mineral concentration, and patchily distributed on the seafloor (Morgan, 2000). They are mainly composed of manganese and iron, but also copper, nickel, and cobalt (Hein and Petersen, 2013). The Clarion-Clipperton Fracture Zone (CCFZ), an area of ca. 6 million km2 of seabed in the central Pacific, has attracted increasing commercial interest. This largest polymetallic nodule field in the world sits between 4000 and 6000 m depth. The CCFZ potentially holds 34 billion metric tons of manganese, representing at least 25 trillion USD (Morgan, 2000; Volkmann et al., 2018). This area is managed by the International Seabed Authority (ISA), which issues exploration mining contracts. To date, 18 such contracts have been signed with the latest one in 2021 (International Seabed Authority, 2021). When moving from exploration to exploitation, a single mining operation could directly impact 182 km2 year–1 of seafloor to achieve a production of 2 Mt annually, while sediment plume re-deposition might indirectly increase the footprint of mining by a factor of two to five (Oebius et al., 2001; Glover and Smith, 2003; Volkmann and Lehnen, 2018). The ISA has approved a regional management plan that has designated nine zones each measuring 400 × 400 km, known as Areas of Particular Environmental Interest (APEIs). Such areas are protected from the mining activities and expected to be representative of the full range of biodiversity, ecosystem structure, and habitats within the management area (Lodge et al., 2014). These nine APEIs are located at the periphery of the CCFZ, however, their location is currently not completely supported by the scientific data. Unsupervised classification of benthic habitats based on derivatives of the GEBCO bathymetry, particulate organic carbon (POC) fluxes estimated from satellite data and nodule abundances derived from low-resolution kriging suggested that habitats in the network of APEIs are not fully representative of habitats within mineable areas (McQuaid et al., 2020). To provide quality knowledge for management and conservation strategies, we need to better constrain habitat distribution models, which in turn requires enhanced comprehension of the factors determining biodiversity patterns.
The CCFZ is a heterogeneous environment composed of abundant hills (approximately 200 m high), numerous seamounts, and nodule fields, which may explain why biodiversity appears to be richer than previously thought (Smith et al., 2008; Wedding et al., 2013; Glover et al., 2016). For example, a megafauna diversity assessment within APEI no. 6 found 129 morphospecies in a survey covering 15,840 m2 of seabed. Changes in assemblage composition were associated with variations in geomorphology and nodule abundance (Simon-Lledó et al., 2019). Beyond species restricted to hard substrates, the presence of nodules may also increase the diversity of macro-infauna at a local scale (De Smet et al., 2017; Bonifácio et al., 2020; Chuar et al., 2020). On a regional scale, northward and westward gradients of decreasing primary productivity are important drivers of variations in meiofaunal and macrofaunal community structure (Hauquier et al., 2019; Bonifácio et al., 2020). The structure of megafaunal assemblages is also highly variable at a 100-km scale although the influence of productivity gradients is not as clear (Simon-Lledó et al., 2020).
Understanding the ecology of benthic communities in the CCFZ is however still impaired by the incomplete diversity assessment. For polychaetes, a species-rich group at abyssal depths representing 36–55% of total macrofaunal abundances (Hessler and Jumars, 1974; Hecker and Paul, 1979; De Smet et al., 2017; Chuar et al., 2020), the incomplete species inventories can be attributed to undersampling, species lumping and sampling inaccuracy. Undersampling is visible at all scales. At local scale, the species rarefaction curve did not level off after extensive sampling of 54 box-cores at Domes A in the western and most oligotrophic site of the CCFZ (Wilson, 2017; Washburn et al., 2021). In the eastern CCFZ, a total of 30 box-cores across four contract zones and one APEI yielded 275 species of which 49% were singletons (Bonifácio et al., 2020). Moreover, most polychaete species remain undescribed (only 5–10% of collected polychaete species were identified to named species; Glover et al., 2002) and the recent combination of morphological and molecular criteria to delineate species suggests that morphology significantly underestimates the magnitude of biodiversity (Janssen et al., 2015; Bonifácio and Menot, 2018). Sampling needs to be more comprehensive because polychaetes encompass a large range of sizes and life modes, from minute infaunal to large epibenthic and commensal species (Hutchings, 1998). In the CCFZ, polychaete assemblages are sampled with a box core, in accordance with the recommendations issued by the ISA (ISBA/25/LTC/6/Rev.1, International Seabed Authority, 2020). While macro-infaunal polychaetes are quantitatively and accurately sampled with a box core (Hessler and Jumars, 1974), large epifaunal and commensal species are not. Such groups are better targeted by trawls and epibenthic sledges (EBS). Among the poorly sampled polychaetes, EBS samples showed that the family Polynoidae is a highly diverse yet poorly studied group at abyssal depths (Schüller et al., 2009; Guggolz et al., 2018; Bonifácio and Menot, 2018).
Of all polychaetes, Polynoidae is one of the most diverse families, both in the number of genera and species (868 valid species; Read and Fauchald, 2021). Polynoids belong to a group of organisms called scale-worms (Aphroditiformia), distinguishable by their scale-like dorsal elytra. Of the eight subfamilies of Polynoidae recognised by Bonifácio and Menot (2018) and followed in this study, the subfamily Macellicephalinae appears to be restricted to the deep sea, the deep Antarctic shelf, and submarine caves (Pettibone, 1985b; Neal et al., 2018b; Bonifácio and Menot, 2018). In a census of deep-sea polychaete species, Paterson et al. (2009) counted 91 polynoid species (12% of total polychaete records) below 2000 m depth with 15 polynoid species below 4000 m depth (hadal depths), 13 of these belonging to Macellicephalinae, including the deepest known polynoid found at 10,190 m depth (Kirkegaard, 1956). According to Bonifácio and Menot (2018), the subfamily Macellicephalinae forms a monophyletic group characterized by the loss of the lateral antennae compared to other polynoid subfamilies, which bear two lateral and one median antennae. Within the Macellicephalinae, which currently contains 121 species (Read and Fauchald, 2021), a monophyletic clade of 15 species, the so-called Anantennata clade, also lost the median antenna. Macellicephalins seem to have been particularly successful in colonizing and radiating in the deep sea (Uschakov, 1982; Levenstein, 1984; Bonifácio and Menot, 2018). Numerous genera are endemic to deep-sea chemosynthetic ecosystems such as hydrothermal vents and cold seeps (Pettibone, 1983; Chevaldonné et al., 1998; Hatch et al., 2020), whereas others were successful in colonizing pelagic deep-sea, nodule fields, abyssal depths, and even trenches (Pettibone, 1976, 1985a,b; Bonifácio and Menot, 2018). Predating the discovery of hydrothermal vents, Levenstein (1984) studied macellicephalin distribution around the world and pointed out that the Pacific Ocean hosts a high rate of diversity with 21 of the 40 species (known at that time) and 15 endemic species.
From EBS and remotely operated vehicle (ROV) samples collected during the SO239 cruise across the eastern half of the CCFZ (Martínez Arbizu and Haeckel, 2015), Bonifácio and Menot (2018) described 17 new polynoid species, of which 16 were macellicephalins, with many remaining undescribed. In the present study, we aim to provide a more comprehensive account of polynoid diversity within the CCFZ and improve our understanding of macellicephalin species radiation in the deep sea. Additionally, we aim to further test hypotheses regarding the drivers of species turnover in the CCFZ. Based on quantitative box-core sampling, Bonifácio et al. (2020) showed a high species turnover among infaunal polychaete assemblages across the eastern CCFZ, attributing it to variations in trophic inputs and barriers to dispersal. In particular, the Clarion fracture was hypothesized to limit dispersal between the APEI no. 3 to the north and the core of the CCFZ to the south. Dispersal ability has also been advocated as a driver of differential distribution patterns between polychaete and isopods as well as among isopod families in the CCFZ (Janssen et al., 2015, 2019; Brix et al., 2020). By focusing on polynoids, we aspired to test whether mobile epifaunal polychaetes would show lower species turnover and greater species ranges than the more sedentary infaunal polychaete assemblages.
Materials and Methods
Clarion-Clipperton Fracture Zone
Within the Equatorial Pacific Ocean, the CCFZ is bordered by the Clarion fracture to the north, the Clipperton Fracture to the south, the Kiribati islands to the west, and Mexico to the east (Figure 1). As part of the JPI Oceans project “Ecological aspects of deep-sea mining,” the EcoResponse cruise SO239 on board the RV Sonne covered the eastern part of the CCFZ from March 9 to April 30, 2015 (Martínez Arbizu and Haeckel, 2015). Sampling took place within four exploration contract areas and the APEI no. 3 at water depths ranging from 4000 to 5000 m (Figure 1). While the ISA administers the APEIs, the exploration contracts were issued by ISA to the Federal Institute for Geosciences and Natural Resources of Germany (BGR); the InterOceanMetal Joint Organization (IOM); the G-TEC Sea Mineral Resources NV (GSR); and the Institut Français de Recherche pour l’Exploitation de la Mer (Ifremer). Only 243 km of distance separates BGR and IOM areas whereas 1440 km separates BGR and Ifremer or APEI no. 3.
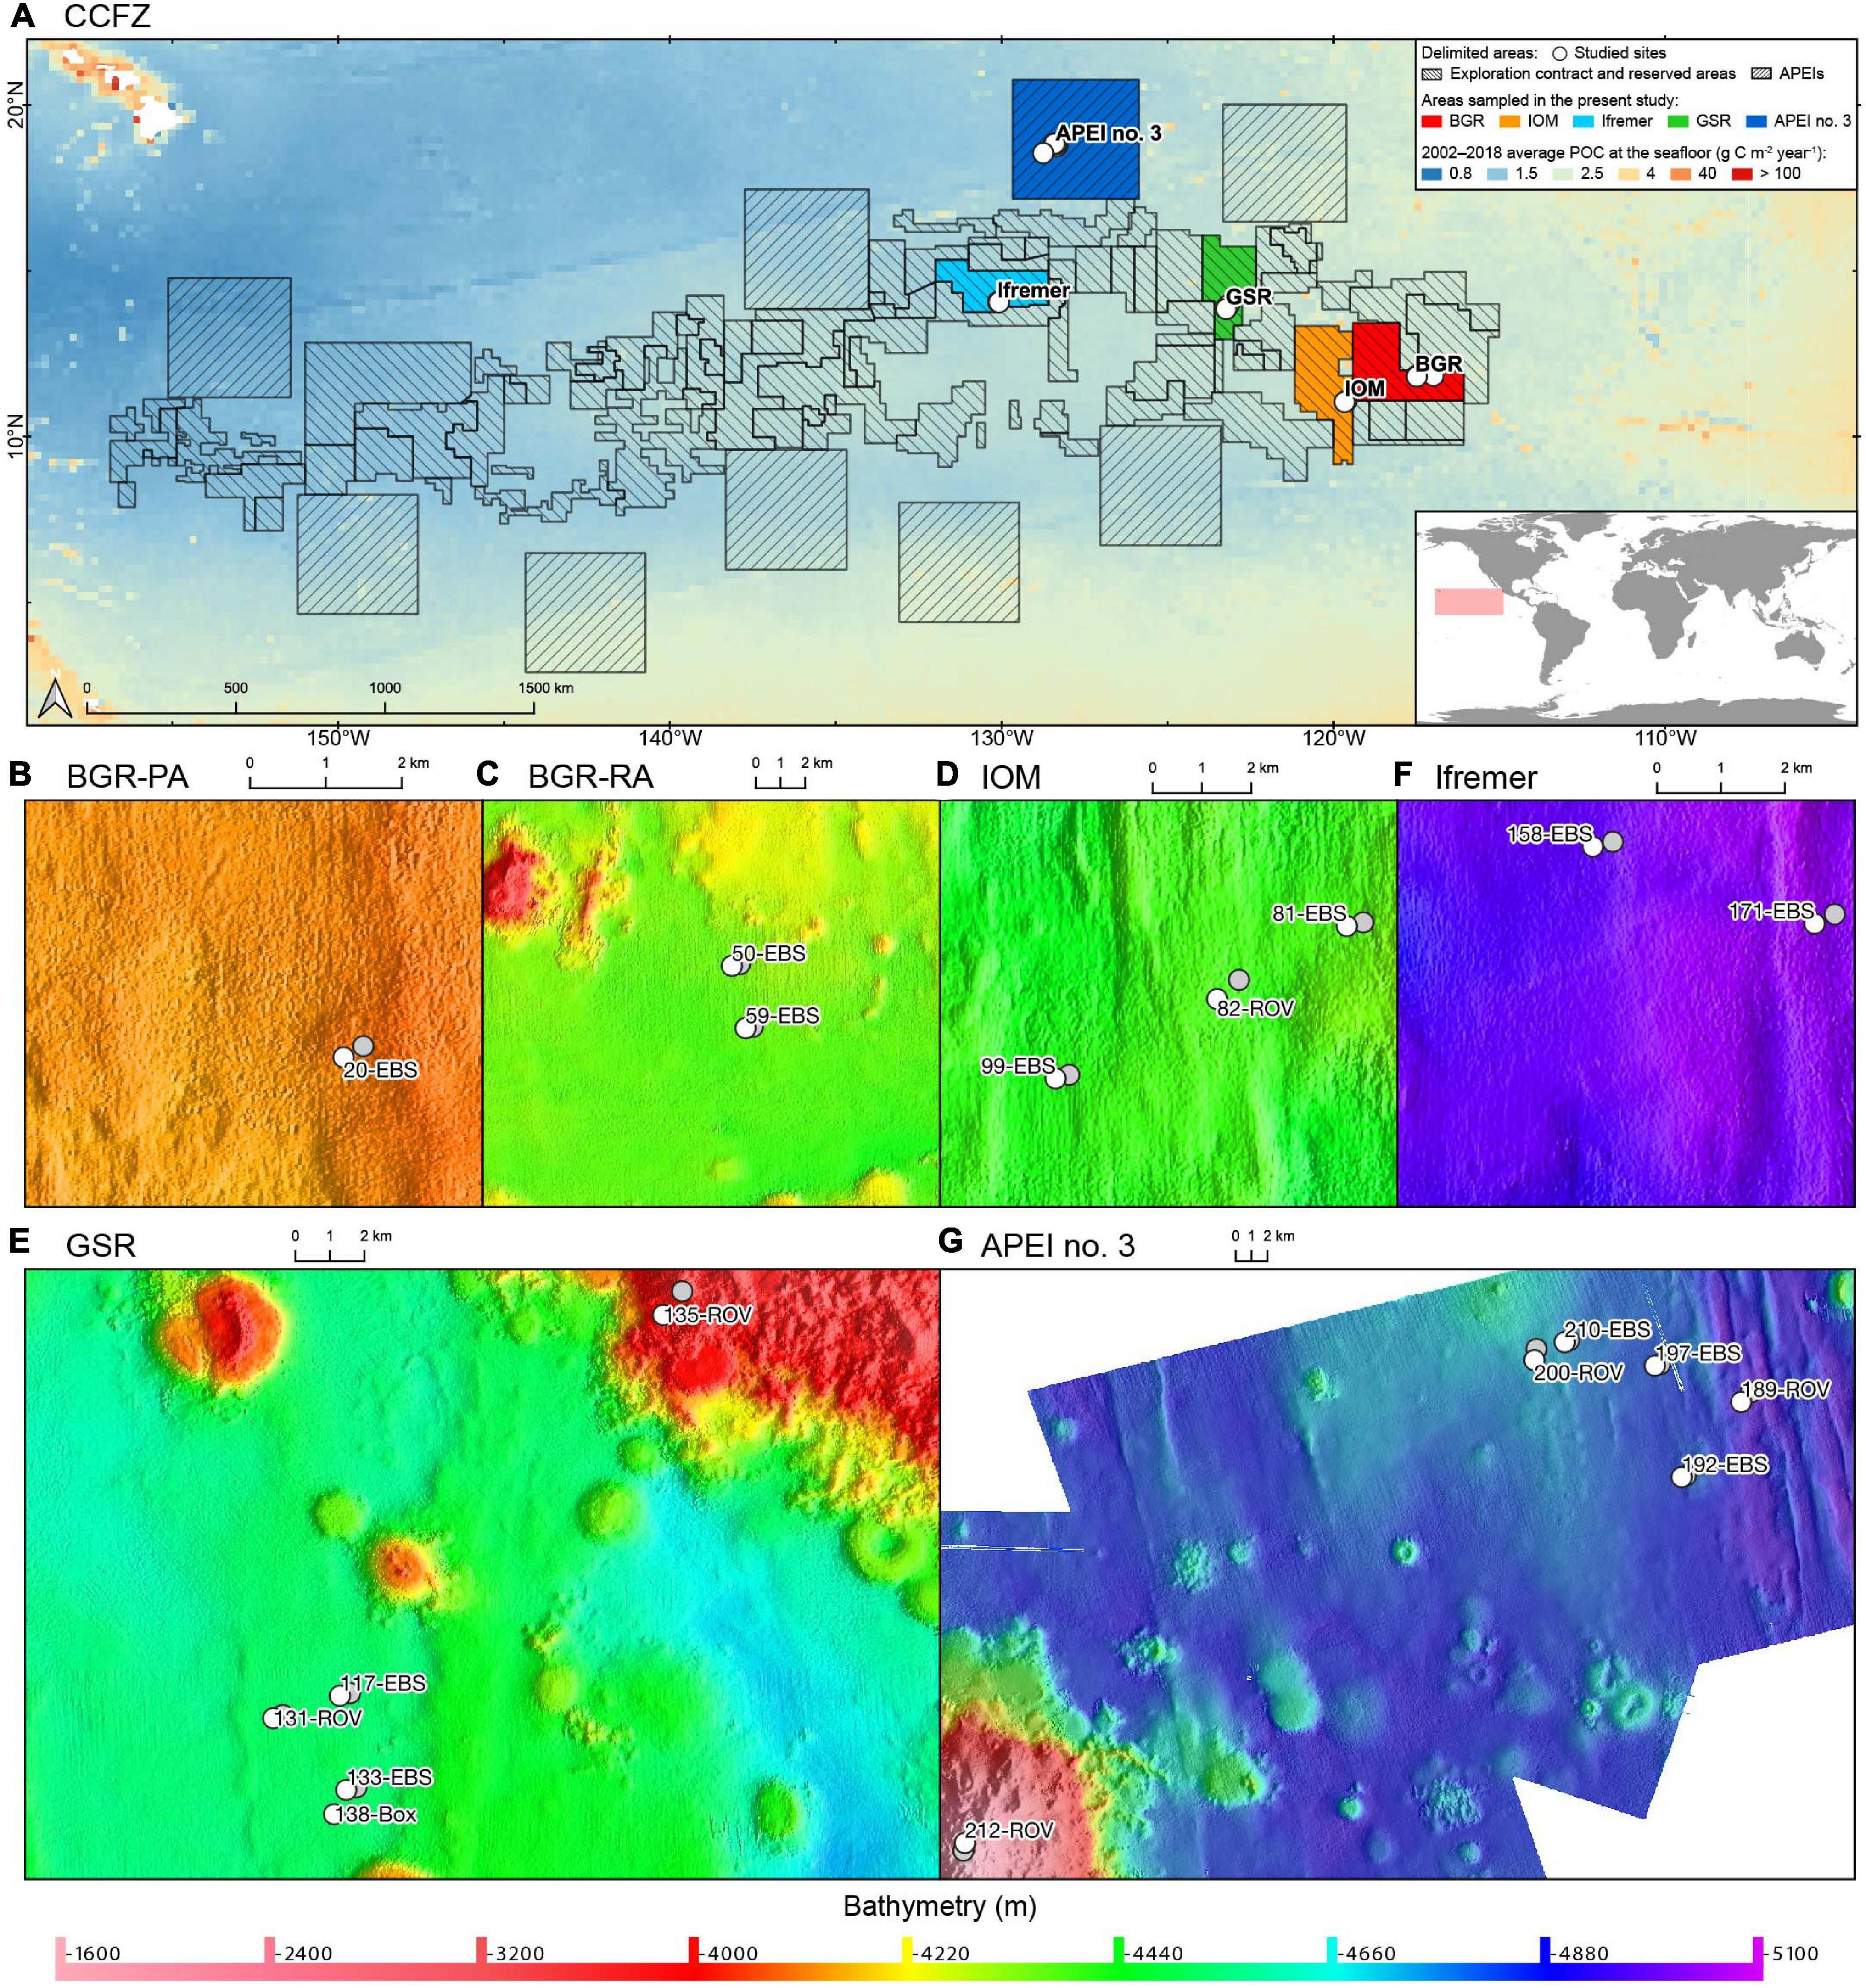
Figure 1. (A) Map of the nodule exploration contract areas, reserved areas and Areas of Particular Environmental Interest (APEIs) in the Clarion-Clipperton Fracture Zone (CCFZ) showing the sampled areas (in color). The background map shows the average particulate organic carbon (POC) flux at the seafloor during the 2002–2018 period estimated by Bonifácio et al. (2020). The sampled areas are enlarged in the following panels: BGR (B,C), IOM (D), GSR (E), Ifremer (F) and APEI no. 3 (G), with start positions in white and end positions in grey. Each has a detailed local hydro-acoustic map based on the multibeam system EM122 (Martínez Arbizu and Haeckel, 2015; Greinert, 2016) in the background.
Sampling Strategy
The overarching aim of the sampling strategy was to cover the whole range of biodiversity of benthic communities, crossing all faunal size groups (from meio- to megafauna) and habitats (from soft-sediments with no nodules to basalt on seamounts). A variety of methods were used to collect biological samples from large and qualitative EBS samples to smaller and quantitative box-core samples and targeted samples with a ROV.
The EBS (Brenke, 2005) consists of a supra- and epibenthic net with cod ends of 300 μm each and an opening and closing mechanism. A total of 12 EBS were recovered but only eight were fully examined (Table 1). The ROV Kiel 6000 fitted with various sampling tools was also used to recover benthic macrofauna (Figure 1). One of the features employed was the bio-box, a large box in which megafaunal specimens collected with the manipulator arm were stored. The United States Naval Electronics Laboratory (USNEL) spade box corer of 0.25 m2 (Hessler and Jumars, 1974) is proven to be an accurate and quantitative tool for benthic biological studies.
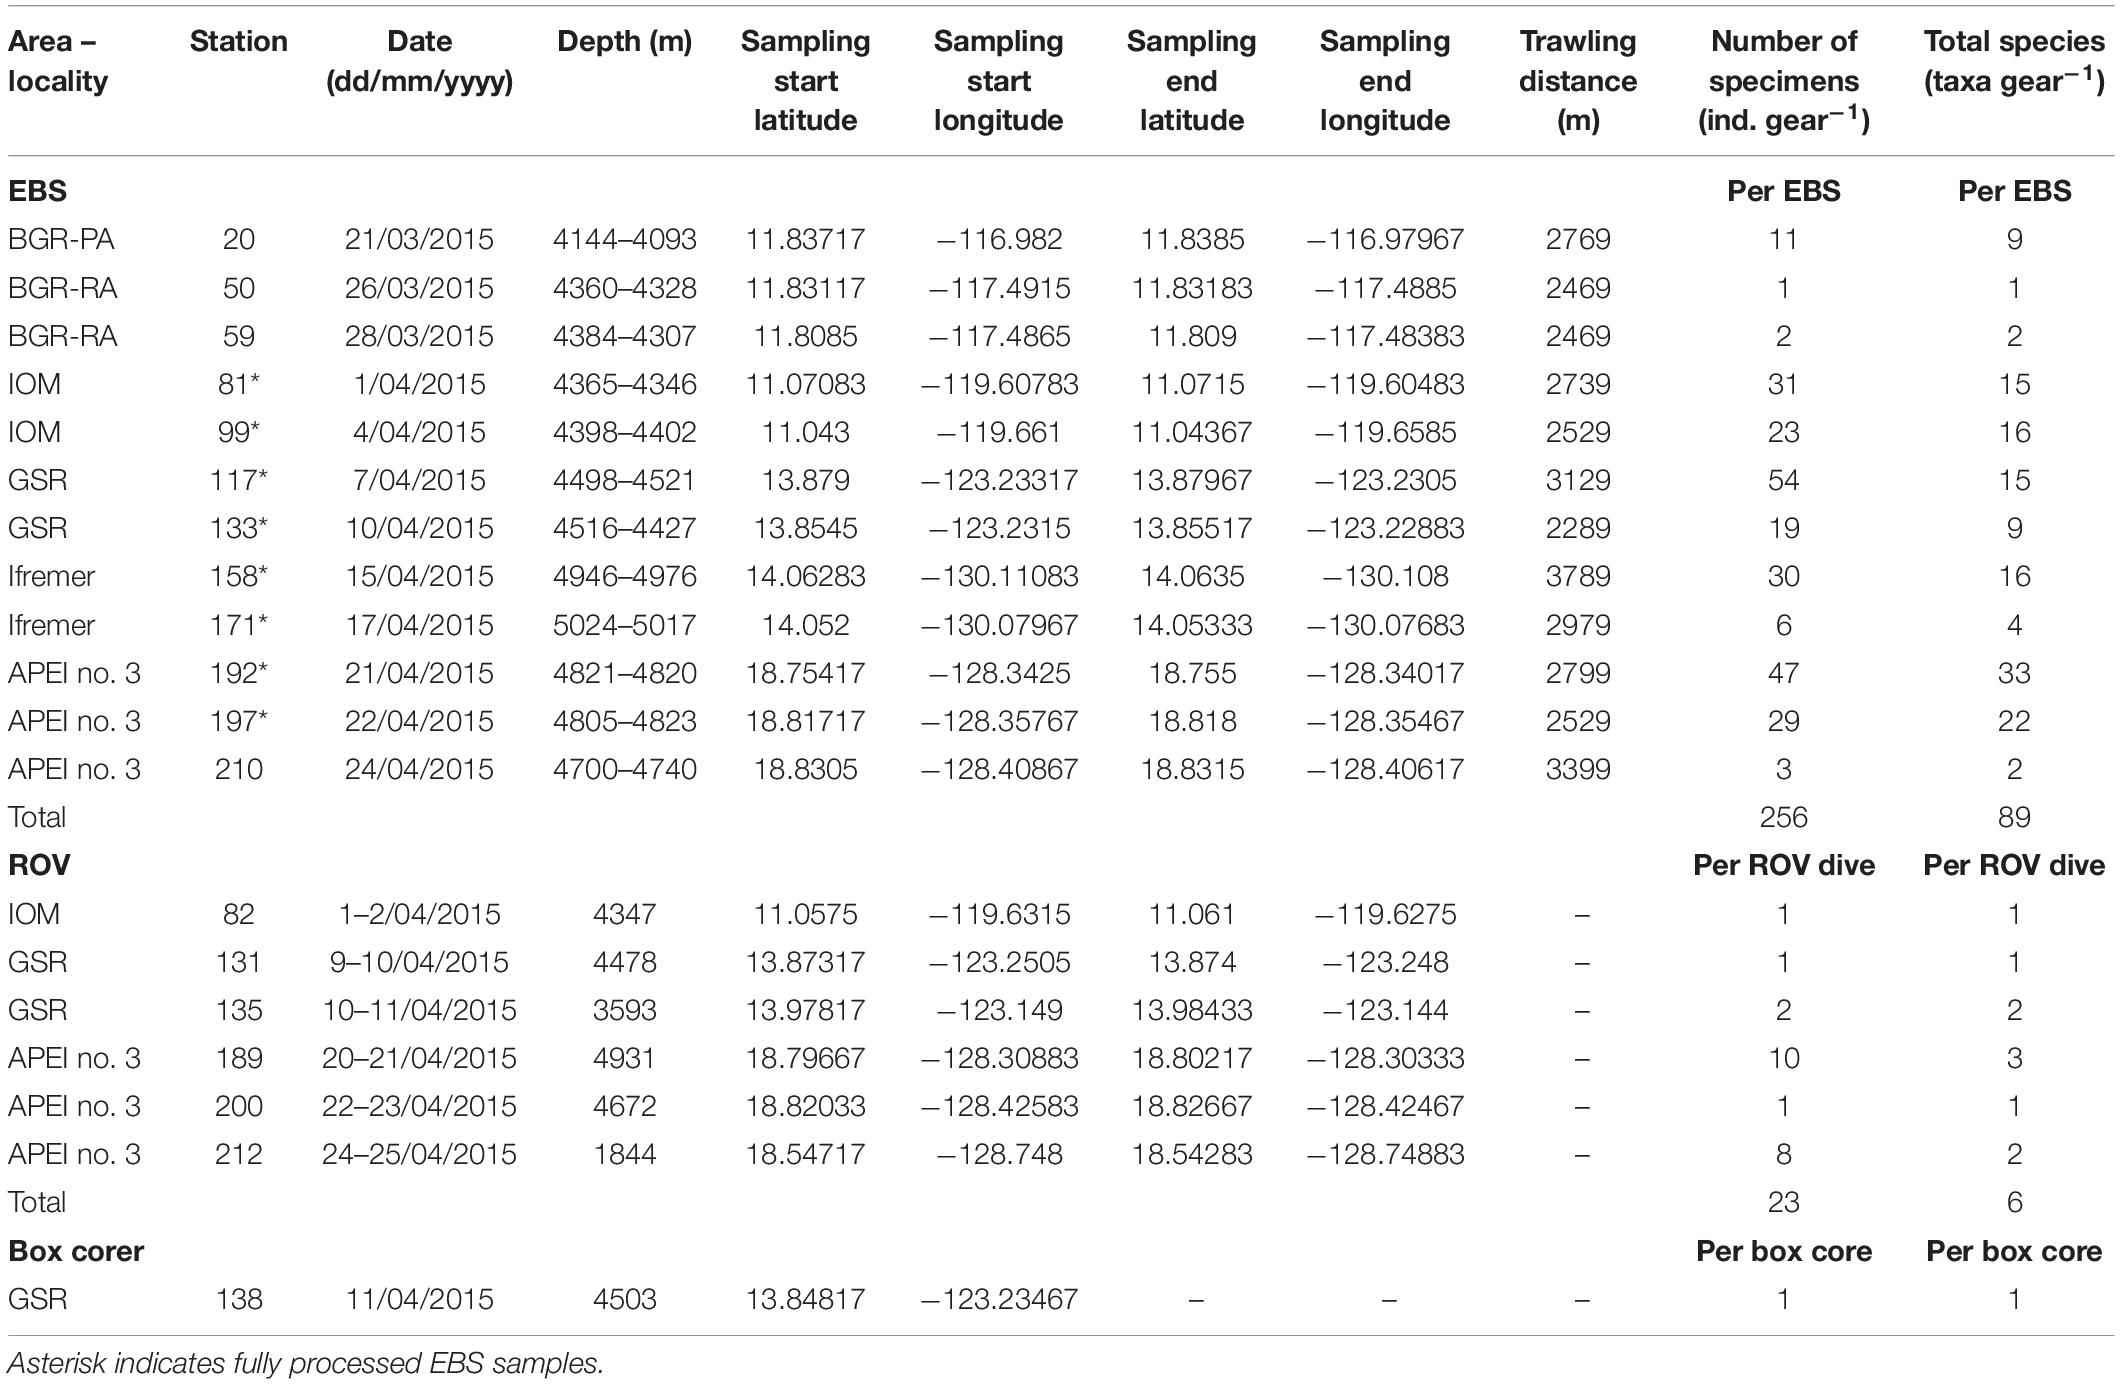
Table 1. Details of sampling sites, total number of polynoid specimens (ind., individuals), and number of polynoid species collected from epibenthic sledges (EBS), box corer, and ROV deployments across the eastern Clarion-Clipperton Fracture Zone during the SO239 cruise.
Polynoids were recovered from box corer and EBS deployments, as well as from the ROV bio-box. Polynoids were not intentionally sampled using the ROV but were most likely associated with the collected sponges or corals. Once on board, the megafauna specimens were sorted from the bio-box and the water was sieved through a 300 μm mesh in a cold room (full methods in Martínez Arbizu and Haeckel, 2015). Polynoids were sorted from the sieved residues.
Sieving and sorting were performed on board. The samples were maintained in cold seawater (4°C) and sieved through a 300 μ mesh in a cold room. All specimens from ROV sampling and some specimens from box corer and EBS sampling were sorted alive. The upper 10 cm of the box-core sample was sliced into three layers (0–3, 3–5, and 5–10 cm), the first was sieved on board in the cold room with cold seawater (4°C) whereas the deeper layers were fixed in formalin for 48–96 h, preserved in 96% ethanol and sorted back on land (for detailed processing of box corer sampling, see Bonifácio et al., 2020). Sieving residues from the EBS samples were preserved in 96% ethanol at −20°C. The ethanol was changed after 24–48 h and the sieved residues were then sorted on board under ice. The collected polychaetes were fixed/preserved in cold (−20°C) 80% ethanol and stored at −20°C. In the laboratory (on land), a few parapodia or small pieces of tissue were dissected, preserved in cold 96% ethanol, and stored at −20°C for molecular extraction.
Molecular Methods
Briefly, the DNA was extracted from sampled tissues using a NucleoSpin Tissue kit (Macherey-Nagel). Two mitochondrial genes (i.e., COI, cytochrome c oxidase subunit I; and 16S) and one nuclear gene (18S) were amplified using the following primers: polyLCO, polyHCO, LCO1490, and HCO2198 for COI (Folmer et al., 1994; Carr et al., 2011); Ann16SF and 16SbrH for 16S (Palumbi, 1996; Sjölin et al., 2005); and 18SA, 18SB, 620F, and 1324R for 18S (Medlin et al., 1988; Cohen et al., 1998; Nygren and Sundberg, 2003) for 18S. The polymerase chain reaction (PCR) mixtures were prepared as suggested for the Green GoTaq® by the manufacturers. The profile of temperature was as follows: 95°C/240 s – [94°C/30 s – 52°C/60 s – 72°C/75 s (for COI and 16S) or 180 s (for 18S) for 35 cycles (for 16S or 18S) or for 40 cycles (for COI)] – 72°C/480 s. PCR products which resulted in bands of expected size after electrophoresis on 1% agarose gel, were sent to the MacroGen Europe Laboratory in Amsterdam (Netherlands) to be sequenced with the same set of primers.
Overlapping sequence fragments (forward and reverse) were assembled into consensus sequences using Geneious Pro 8.1.7 2005–2015 (Biomatters Ltd.). For COI, the sequences were translated into amino-acid alignments and checked for stop codons to avoid pseudogenes.
Newly assembled sequences were blasted in GenBank to check for contamination. Each set of genes was aligned separately using: MAAFT (Katoh et al., 2002) for 16S and 18S; and MUSCLE (Edgar, 2004) for COI. All sequences obtained in this study have been deposited in BOLD1 (Ratnasingham and Hebert, 2007) or GenBank2.
Integrative Taxonomy
The specimens were examined under a Leica M125 stereomicroscope and a Nikon Eclipse E400 microscope. Only the specimens with heads were counted and morphologically identified using deep-sea polynoid fauna bibliography (Pettibone, 1976; Uschakov, 1982; Bonifácio and Menot, 2018), to the lowest taxonomic level possible (morphospecies). The naming of morphospecies is consistent with previous studies (Bonifácio and Menot, 2018; Bonifácio et al., 2020). Naming refers to the Ifremer code of the specimen, which served as a reference for morphological characters defined in the diagnosis of the morphospecies (similar to type material). For specimens that could not be morphologically discriminated, the principle of the phylogenetic species concept was applied. Through this approach, the genetic divergence among specimens belonging to the same species (intraspecific) is smaller than the divergence among specimens from different species (interspecific) (Hebert et al., 2003b). This creates a gap between intraspecific and interspecific variations when plotted in a distribution of pairwise divergences among all sequences. When data were insufficient to define a barcode gap, molecular operational taxonomic units (MOTUs) were recognised using a threshold of 97 or 99% similarity between COI and 16S sequences, respectively (Hebert et al., 2003a,b). Hereafter, for the sake of simplicity, we use the term species to refer to the lowest taxonomic resolution achieved by using this combination of morphospecies and MOTU concepts.
Environmental Data
The environmental data used are those compiled by Bonifácio et al. (2020) from previous studies (Volz et al., 2018a; Hauquier et al., 2019) which are publicly available (Hauquier et al., 2017; Volz et al., 2018b,c,d,e,f,g). Sediment samples were recovered from the same areas as biological samples during the same cruise, using a multi-corer or a gravity corer (see Martínez Arbizu and Haeckel, 2015 for details). Hauquier et al. (2019) reported data for clay fraction (<4 μm), silt fraction (4–63 μm), total nitrogen (TN in weight per cent), total organic carbon (TOC in weight per cent), and chloroplastic pigment equivalents (CPE in μg ml–1). Volz et al. (2018a) reported POC flux (POC, mg C m–2 d–1) at the seafloor for all areas (eastern CCFZ). This POC flux at the seafloor was used as a proxy for food supply to benthic communities.
Data Analysis
Phylogenetic Analyses
Maximum likelihood and Bayesian phylogenetic analyses were run for two datasets. The first dataset included all 428 sequences (COI, 16S, and 18S) from 238 specimens collected by all types of gear from all study sites. Two sigalionids [Neoleanira tetragona (Örsted, 1845) and Sthenelais boa (Johnston, 1833)] were chosen as outgroups. The phylogenetic analyses aimed at providing a comprehensive account of known polynoid diversity in the eastern CCFZ. The second dataset was limited to specimens collected from the fully processed EBS samples and included 156 sequences (COI, 16S, and 18S) from 81 species. N. tetragona was used as an outgroup. The phylogenetic analyses were run to compute phylogenetic diversity indices (see below).
The three genes were combined in a partitioned dataset with SequenceMatrix (Vaidya et al., 2011). The maximum likelihood analyses were carried out using Randomized Axelerated Maximum Likelihood (RAxML v.8.2.10; Stamatakis, 2014) on XSEDE with rapid bootstrapping (1000 iterations). The Bayesian phylogenetic analyses were achieved using MrBayes v.3.2.6 on XSEDE (Ronquist et al., 2012) with 60,000,000 generations in which every 1000 generation chain was sampled and 25% discarded as burn-in. TRACER v.1.7.1 (Rambaut et al., 2018) was used to check the convergence chain runs. Both phylogenetic analyses were computed in CIPRES Science Gateway (Miller et al., 2010). Node support is given as a maximum likelihood bootstrap and Bayesian posterior probability values. The tree files were plotted using RStudio environment or FigTree v.1.4.23.
Alpha and Beta Phylogenetic Diversity (PD)
Phylogenetic diversity was assessed using Faith’s PD (Faith, 1992). PD is the most widely used phylogenetic diversity measure and is defined as the sum of branch lengths of a phylogenetic tree connecting all species in a given assemblage. Similar to species richness, Faith’s PD is also dependent on sample size and inventory completeness (Hsieh and Chao, 2017). We thus used sample-size-based rarefaction and extrapolation curves to compare PD between polynoid assemblages (Hsieh and Chao, 2017). Extrapolations were computed for a sample twice the size of the empirical sample. The 95% confidence intervals were computed using a bootstrap method with 200 replications. For PD, the phylogenetic ultrametric tree was pruned to only reflect species with at least one sequence present in the entire dataset (i.e., without outgroup species or specimens without a sequence).
Unweighted (presence/absence) UniFrac metric (Lozupone et al., 2006) was computed to assess beta phylogenetic diversity between assemblages. The metric measures the difference between assemblages based on the unique branch length (branch leading to another tip in the same sample) over the total branch length observed among assemblages. UniFrac metric ranges from 0 (i.e., no unique branch, all the terminals on the tree are shared among all assemblages) to 1 (i.e., only unique branches, the terminals leading to another tip are not shared between assemblages). Ordination of samples based on UniFrac distance metric was performed using Principal Coordinate Analysis (PCoA; Gower, 1966). PCoA, also known as metric multidimensional scaling, is an ordination method similar to PCA but that can handle semimetric and non-metric dissimilarity measures (Borcard et al., 2018). Furthermore, a correlation between UniFrac distance and geographical distance was sought to test for a distance decay of phylogenetic similarity between polynoid assemblages. The UpSet plots were used to illustrate the distribution of rare, widely distributed and common species across the CCFZ. Haplotype networks were constructed considering the infinite site model and a pairwise uncorrected distance between mitochondrial (COI or 16S genes) haplotypes, and the quantitative distribution of haplotypes within putative populations (sampling site).
Alpha and Beta Taxonomic Diversity
Diversity patterns were analysed using rarefaction curves based on the total number of individuals from fully examined EBS samples (Hurlbert, 1971; Gotelli and Colwell, 2001). Based on this rarefied dataset, the expected number of species was calculated for 12 (ES12) and 35 (ES35) individuals for comparison with previous studies. Non-parametric and abundance-based estimators included Chao1 and an abundance-based coverage estimator (ACE; O’Hara, 2005; Chiu et al., 2014).
A Hypergeometric Principal Component Analysis (H-PCA) was used to describe variations in assemblage composition between fully examined EBS samples. The H-PCA relies on Chord-Normalized Expected Species Shared (CNESS) distance (Trueblood et al., 1994; Gallagher, 1999), which is computed from probabilities of species occurrence in random draws of m individuals. The CNESS distance thus allows rarefying samples to a similar number of individuals, limiting the bias due to different sample sizes. Low values of m give high weight to dominant species whereas high values of m give high weight to rare species. To choose the value of m, distance matrices are computed for all possible values of m, then Kendall’s τ correlations are calculated between each of these matrices and both matrices for m = 1 and m = m max (minimum sample total). The value of m used for calculation is the one that gives correlation with CNESS m = 1 which is roughly equivalent to its correlation with CNESS m = m max. The CNESS distance, which provides an objective trade-off between giving weight to either dominant or rare species was preferred over the Euclidean distance classically used in PCA, which gives high weight to abundant species, and a Chi-square distance classically used in Correspondence Analysis that gives high weight to rare species (Legendre and Gallagher, 2001). CNESS is also a metric distance, which contrary to semimetrics such as the Bray–Curtis dissimilarity, respects the relative distance between samples and can be plotted in the Euclidean space of a PCA. The influence of environmental variables on assemblage patterns was explored by fitting clay fraction, silt fraction, TN, TOC, CPE, and POC flux at the seafloor onto the PCA ordination (envfit function in R library Vegan). The accuracy of fit of each variable was tested with a permutation test (n = 999). This post hoc explanation of ordination axes was preferred over a constrained multivariate analysis such as a Redundancy Analysis (RDA). RDA involves multiple linear regressions of species abundance data, but our data are not truly quantitative. For comparison with previous studies and to evaluate the distance decay of taxonomic similarity between assemblages, the New Normalized Expected Species Shared (NNESS; Trueblood et al., 1994; Gallagher, 1999) was also computed. NNESS is a similarity measure, which as for CNESS is computed on rarefied samples (Trueblood et al., 1994; Gallagher, 1999).
All analyses were conducted with R language (R Core Team., 2020) using RStudio (R Studio Team., 2020) and the following specific packages or functions: adespatial (Dray et al., 2020), ade4 (Dray and Dufour, 2007), ape (Paradis and Schliep, 2019), BiodiversityR (Kindt and Coe, 2005), Biostrings (Pagès et al., 2017), dplyr (Wickham et al., 2020), fossil (Vavrek, 2011), geiger (Pennell et al., 2014), ggplot2 (Wickham, 2016), ggtree (Yu et al., 2017), iNextPD (Hsieh and Chao, 2017), ness (Menot, 2019), pegas (Paradis, 2010), picante (Kembel et al., 2010), reshape2 (Wickham, 2007), treeio (Wang et al., 2020), UpSetR (Conway et al., 2017), and vegan (Oksanen et al., 2016).
Results
Diversity and Distribution
A total of 280 polynoid specimens were sampled along the five areas studied within the eastern CCFZ, of which 256 specimens were collected with the EBS, 23 with the ROV and one from a box-core sample (Tables 1, 2). The combination of morphological examination and DNA sequencing enabled the identification of all but five poorly preserved specimens for which DNA sequencing was unsuccessful. The success rate of the DNA sequencing varied according to the targeted genes. COI sequences were obtained from 136 specimens, 16S sequences from 217 specimens, and 18S sequences from 68 specimens. Collectively, 238 specimens were successfully sequenced for at least one of the targeted genes (Figure 2) while 38 specimens were sequenced for all three genes and 107 specimens were sequenced for at least two of the studied genes.
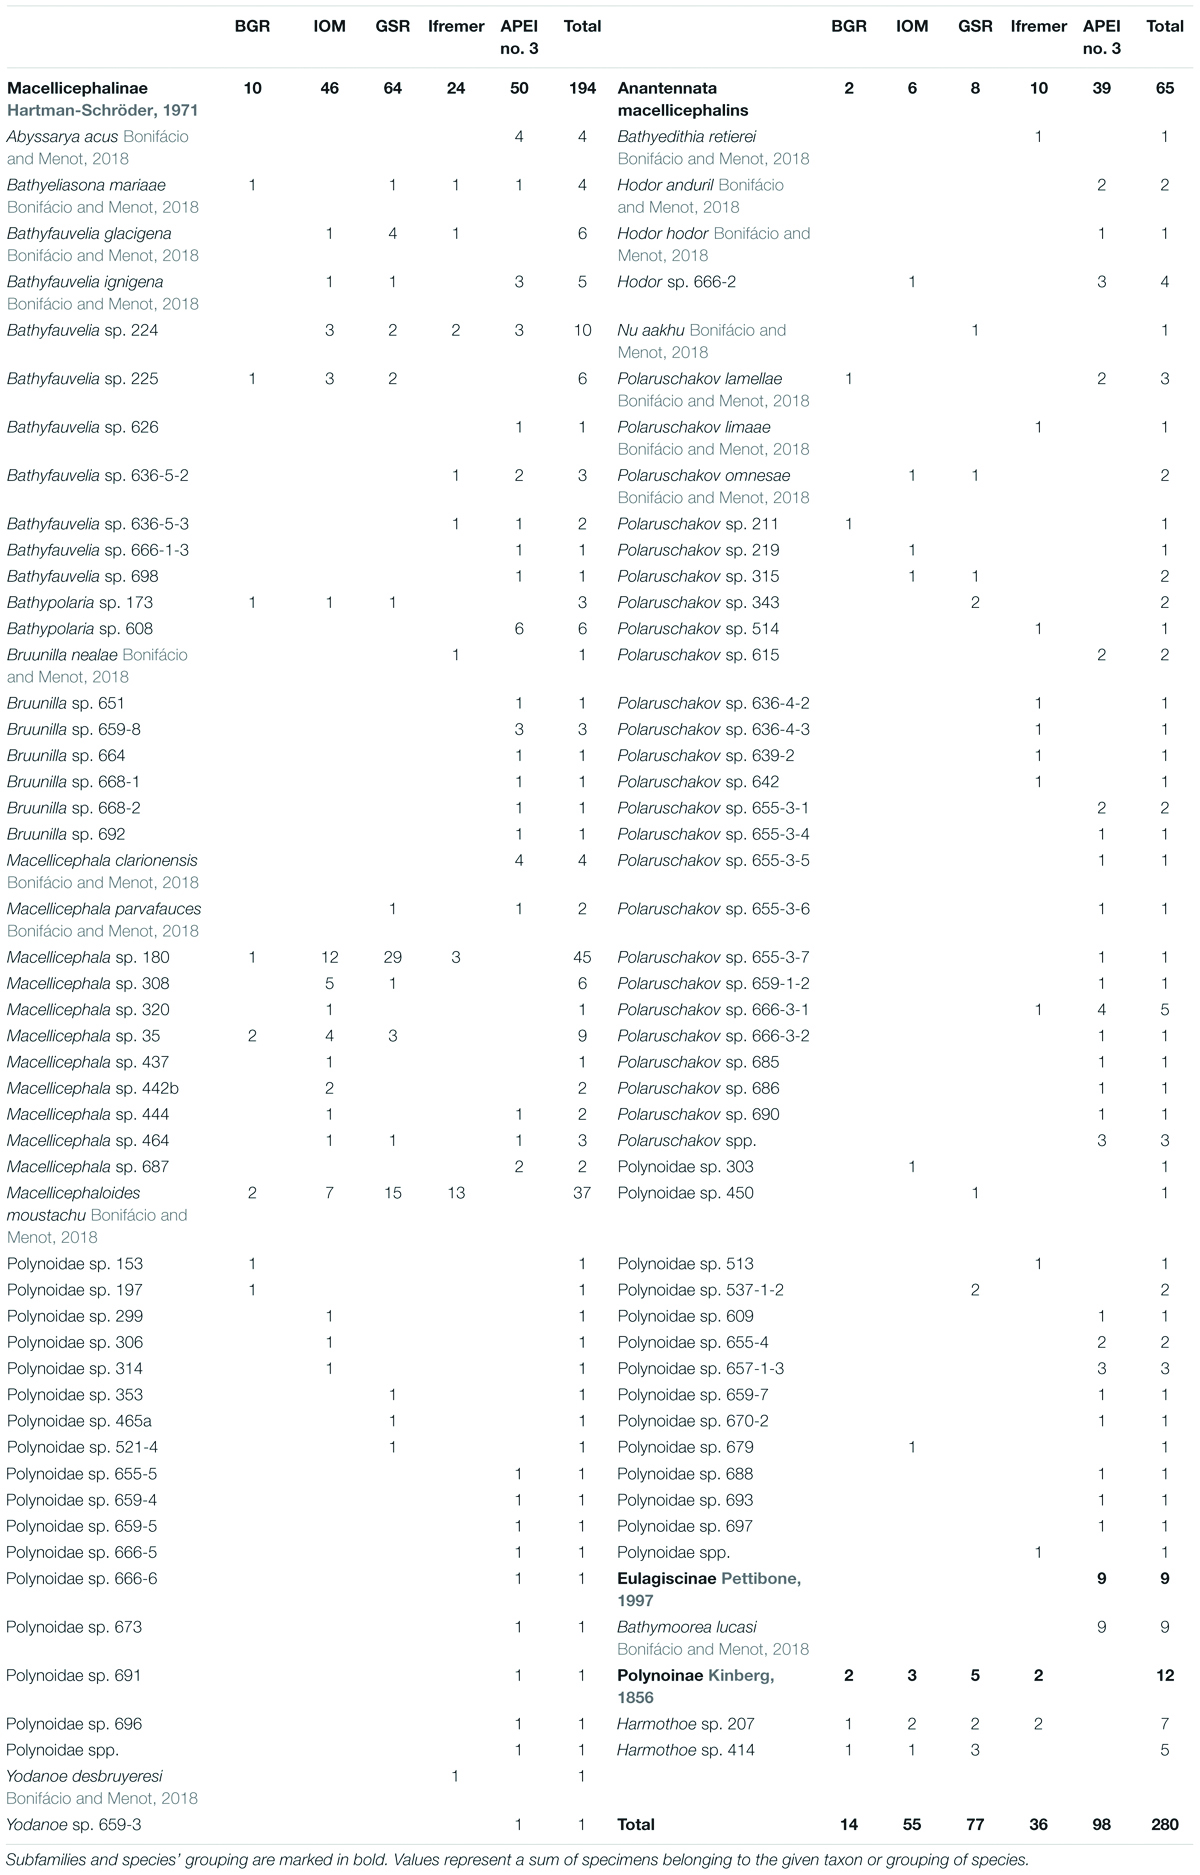
Table 2. Species list and total number of specimens per study area of Polynoidae sampled during the SO239 cruise in the eastern Clarion-Clipperton Fracture Zone.
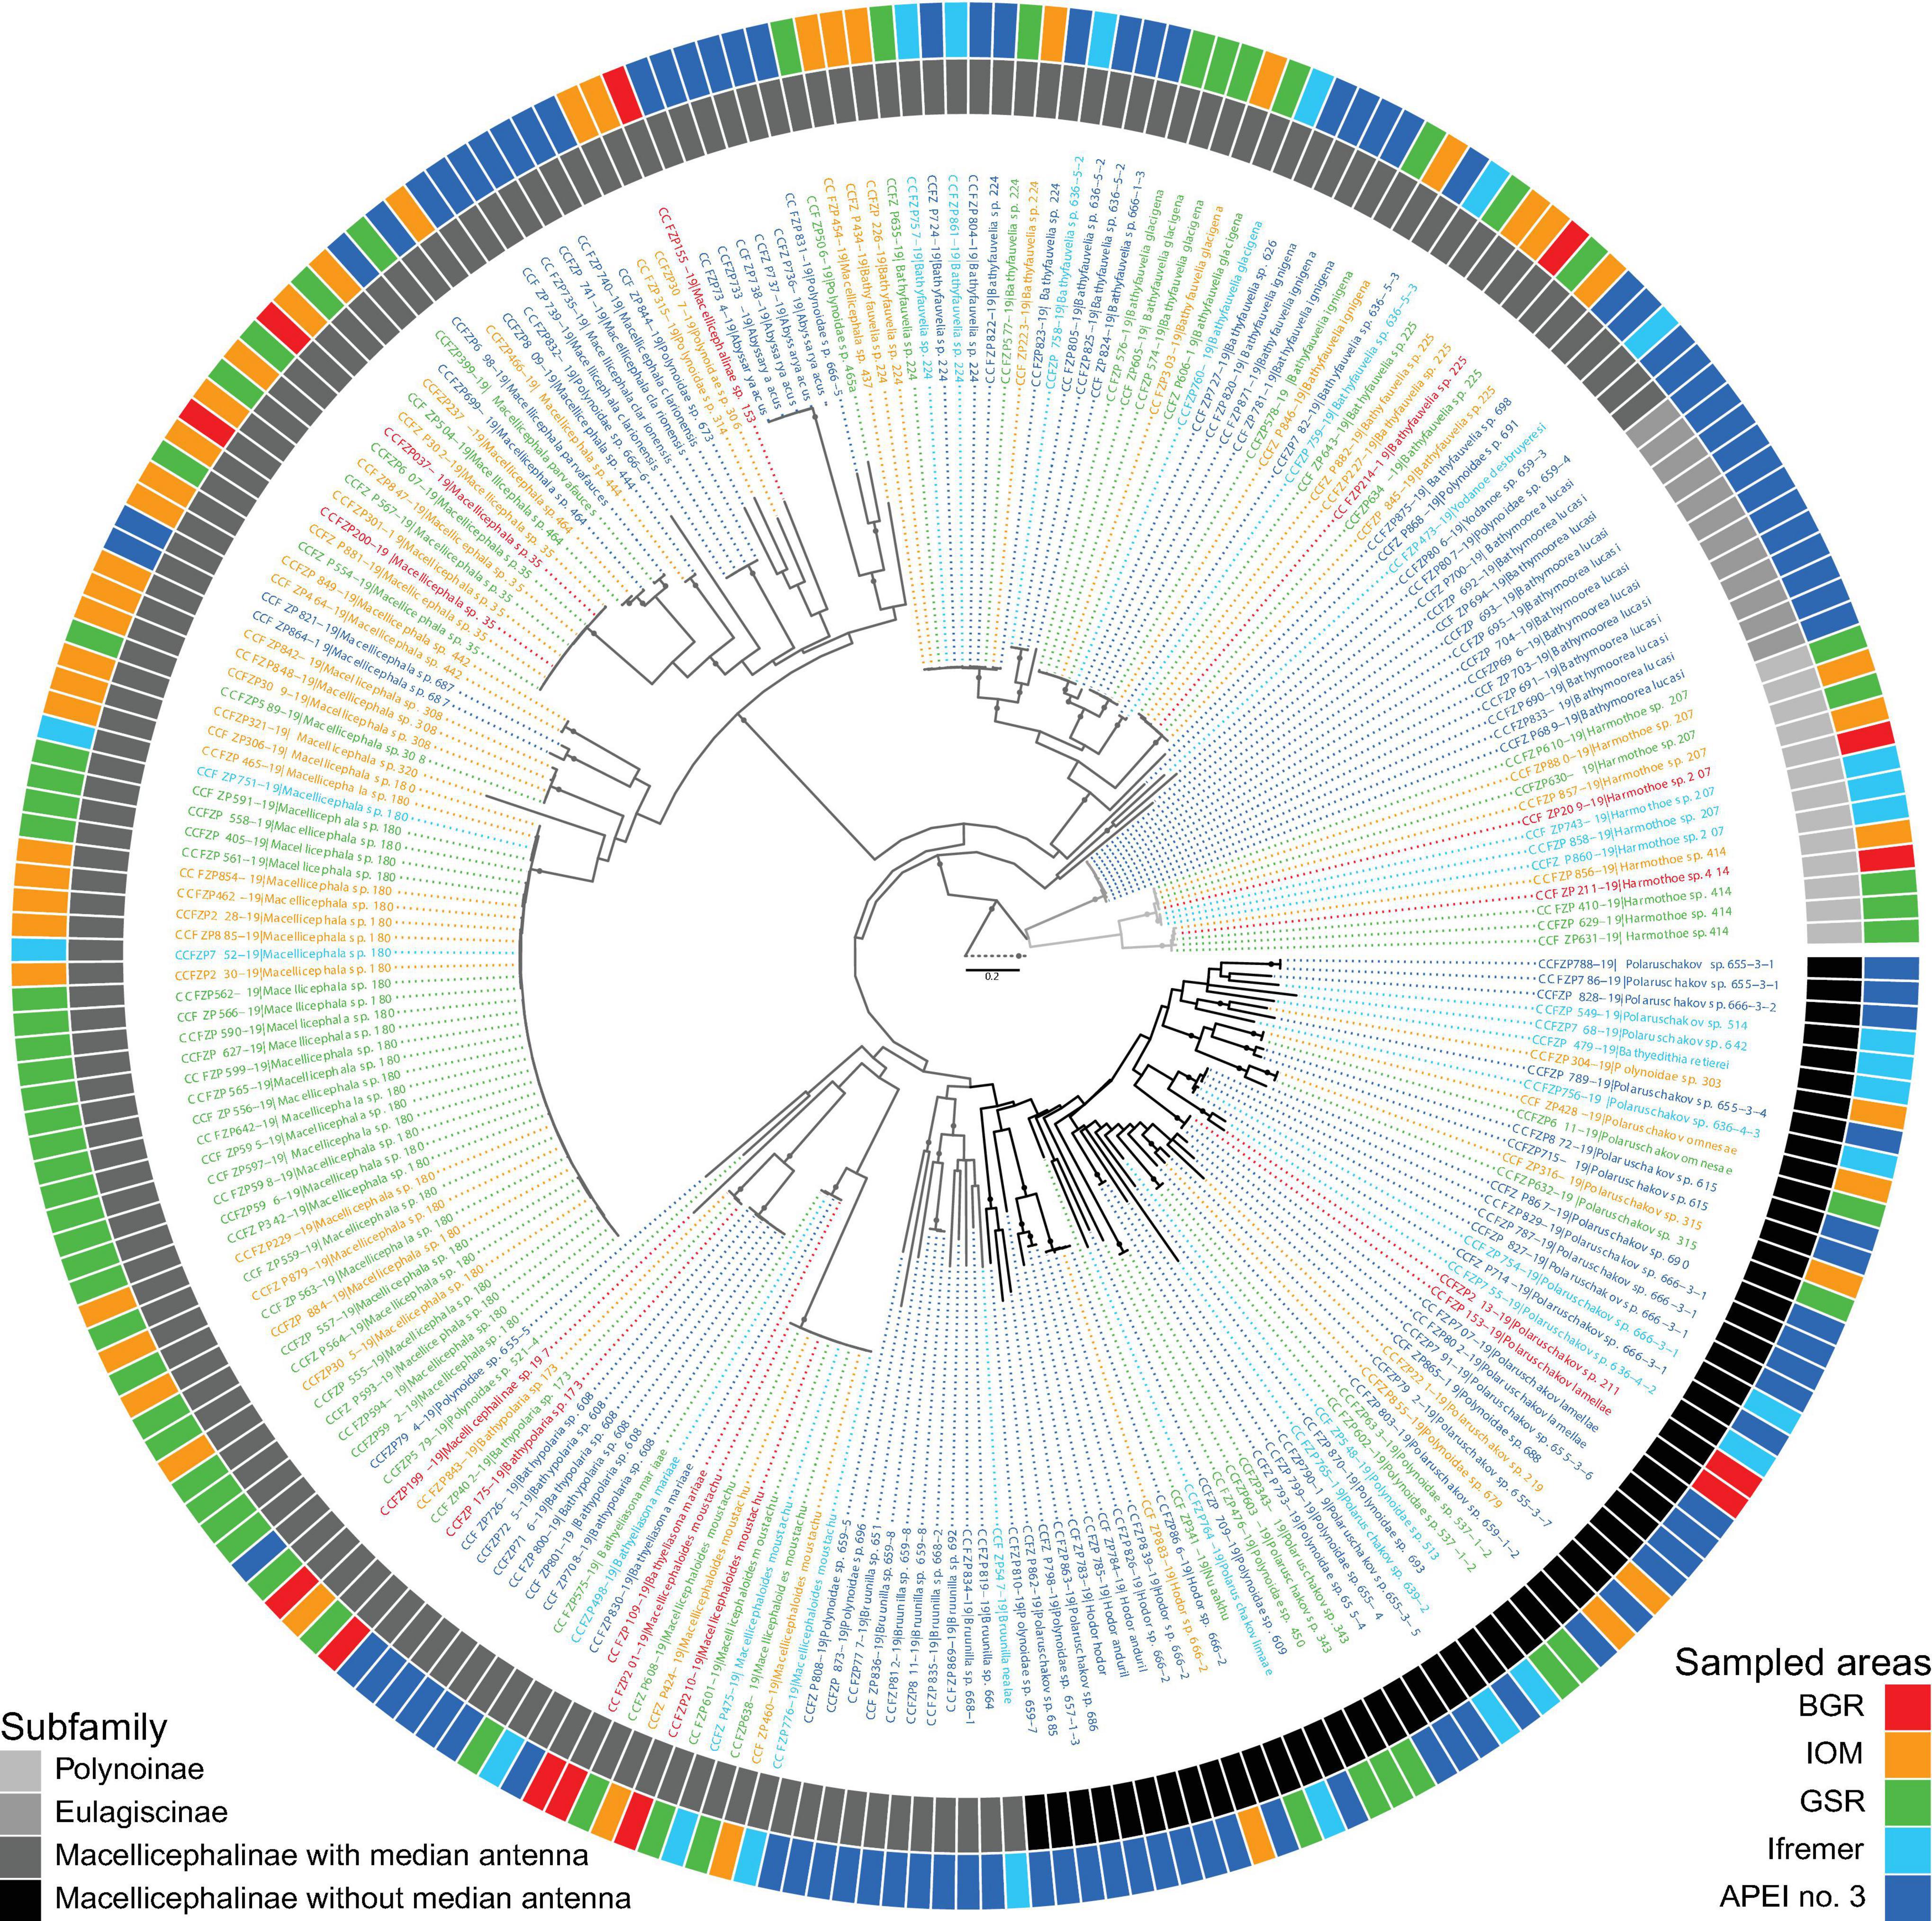
Figure 2. Maximum likelihood inference of polynoid phylogeny based on concatenated gene data (COI, 16S, and 18S) showing distribution of each sequence within the eastern CCFZ. Some species and respective DNA data were already published by Bonifácio and Menot (2018). Dataset includes all sequences of specimens from ROV, EBS, and box corer. Colors indicate subfamilies or sampled area. Circles on branches represent bootstrap supports ≥90%. Bayesian inference has not converged to the stationary distribution (not presented).
The identified polynoids (275 specimens) accounted for 95 species belonging to the subfamilies Eulagiscinae, Polynoinae, and Macellicephalinae (Figure 2 and Table 2). Eulagiscinae was represented by nine specimens belonging to the same species, Bathymoorea lucasi, which was found only at APEI no. 3. Polynoinae was represented by 12 specimens belonging to two species (Harmothoe sp. 207 and Harmothoe sp. 414) found at BGR, IOM, GSR and Ifremer areas (Figure 2). Macellicephalinae was the most abundant and diverse group with 259 specimens (92.5% of total number of specimens) belonging to 92 species (Figure 2 and Table 2). Within Macellicephalinae, a clade called Anantennata was also abundant and surprisingly very diverse with 65 specimens belonging to 42 species (Figure 2). Anantennata corresponded to 25.1% of the total number of specimens and 45.6% of the total number of macellicephalin species. Of the 11 genera identified, the following were the most abundant (>10% of the total number macellicephalin specimens) and/or diverse: Macellicephala with 77 specimens (29.7%) and 11 species; Polaruschakov with 38 specimens (14.7%) and 24 species; Macellicephaloides with 37 specimens of Macellicephaloides moustachu; and Bathyfauvelia with 35 specimens (13.5%) and nine species. The most abundant species was Macellicephala sp. 180 with 45 specimens (16.1% of the total number of polynoid specimens). The identification of 38 specimens (29 species) remained incomplete due to poor conservation or no fit within currently recognised genera. Eight specimens probably belong to new genera and 21 were identified at least as Anantennata.
The UpSet plot (Figure 3) shows that 74 species were restricted to only one area with 59 species represented by a single specimen (Table 2). These singletons accounted for 62.1% of the total number of species and 21.1% of the total number of polynoid specimens. Seventeen species were sampled at two or three areas whereas only five species were recovered from four areas. No species was common to all five studied areas. APEI no. 3 was the most species-rich zone, with 55 species in total, of which 80% were unique to this site, a percentage that drops to a maximum of 52.7% for the other sites within the CCFZ. Interestingly, the two most abundant species Macellicephala sp. 180 and Macellicephaloides moustachu together representing 29% of the total number of specimens were widely distributed in all areas except APEI no. 3.
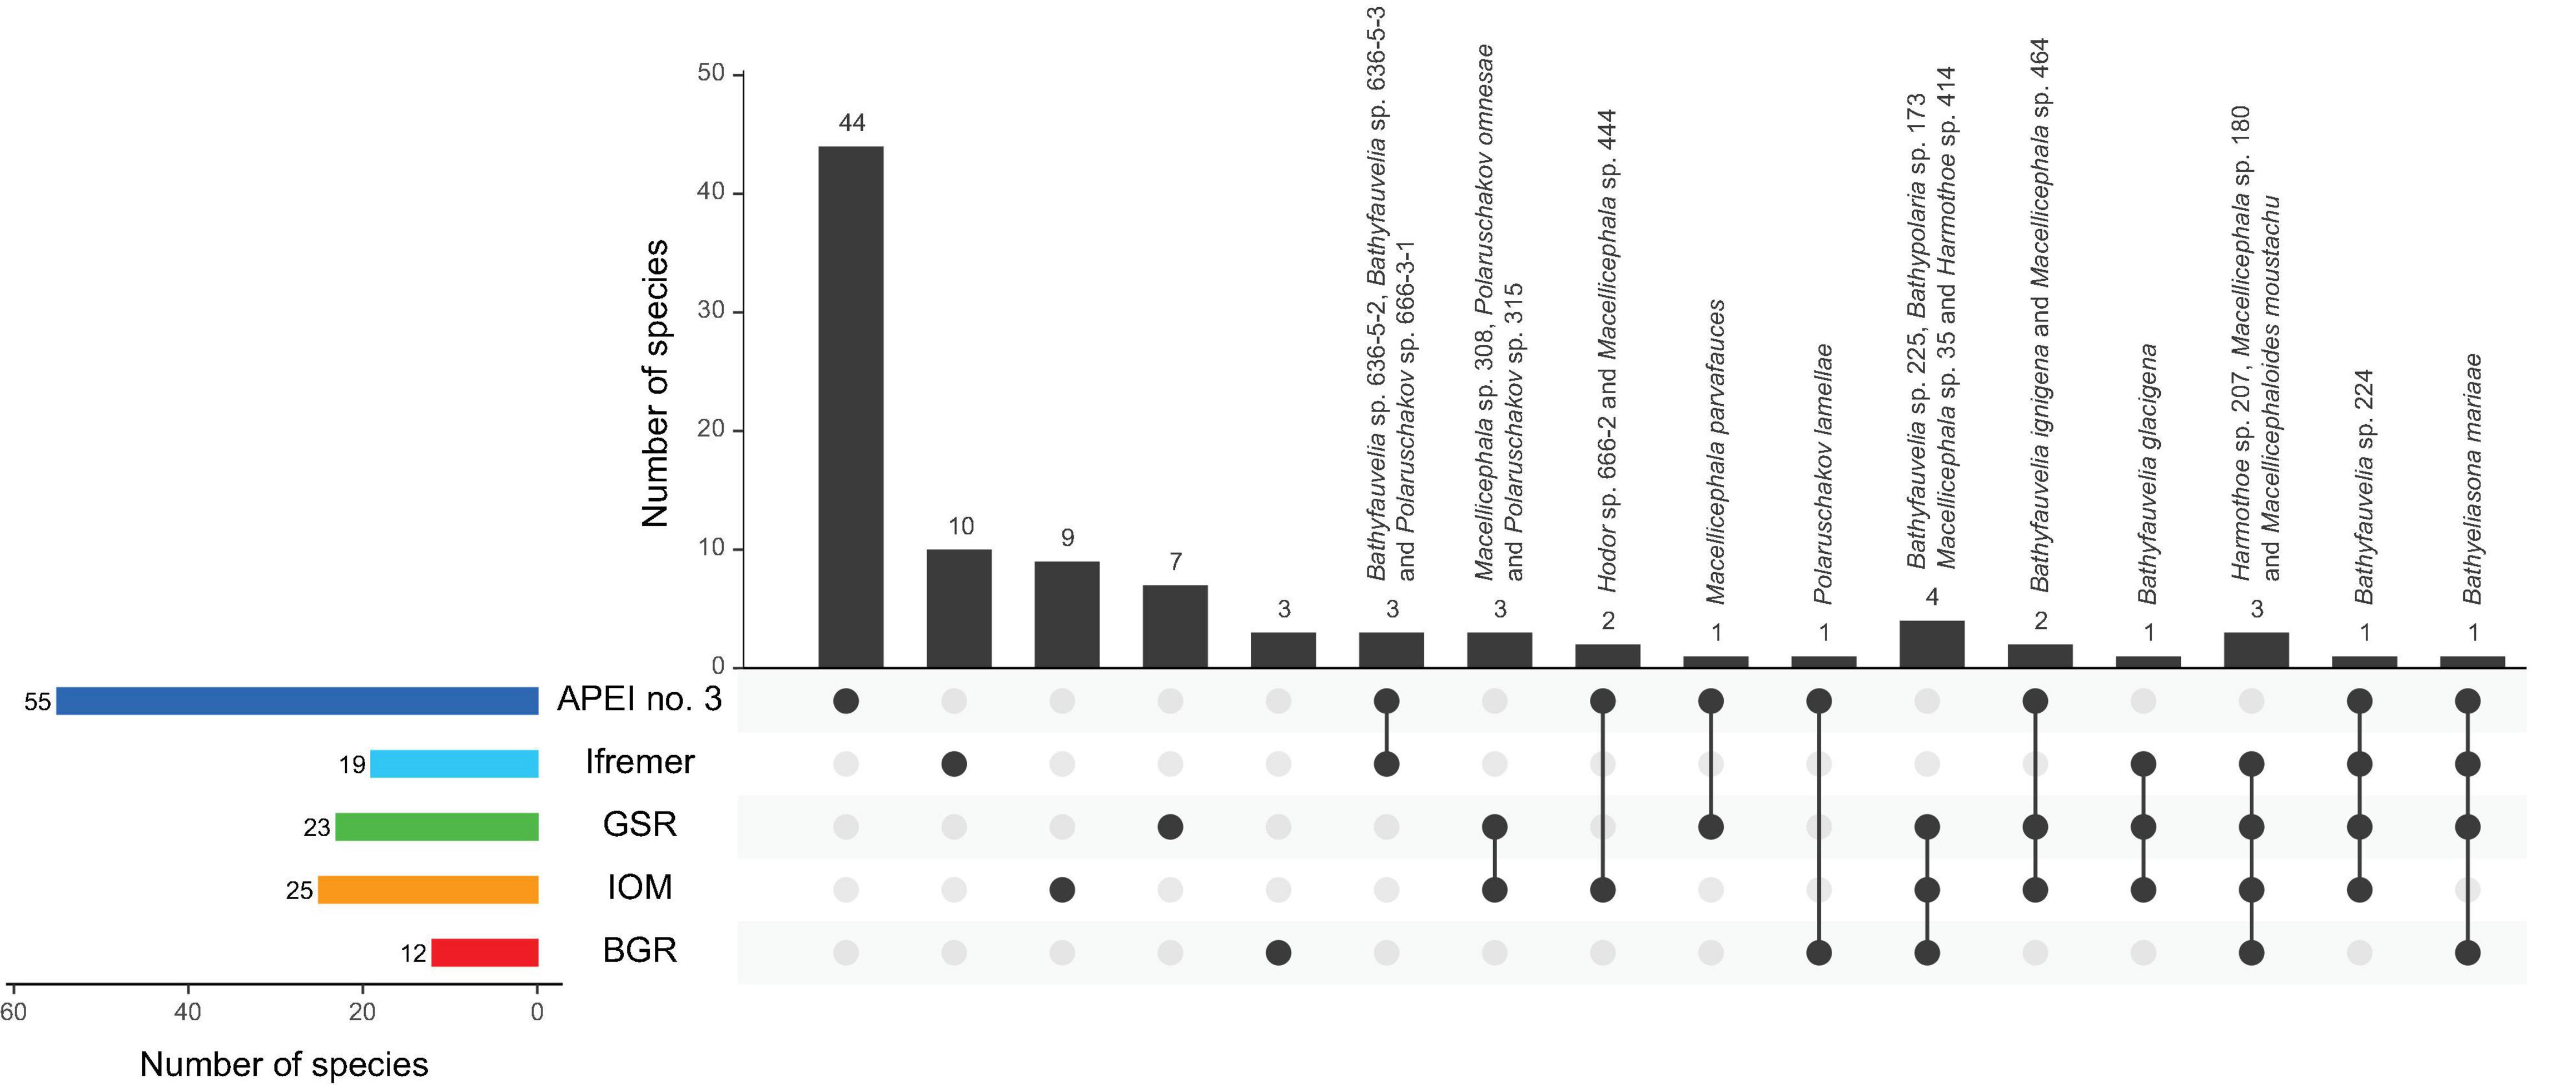
Figure 3. UpSet plot showing the intersection of species distribution along sampled areas within the eastern CCFZ. Horizontal (colored) bars present total number of species for corresponding areas with vertical (black) bars presenting restricted (dots) or shared species (linked dots). Shared species are indicated.
The relationships among DNA sequences within putative populations were explored for two relatively abundant and widely distributed species. The haplotype networks for Bathyfauvelia sp. 224 and Macellicephala sp. 180 based on sampled sites (putative populations) showed relatively high numbers of haplotypes separated mostly by one or a few mutational steps (Figure 4). The data did not show phylogeographic structure.
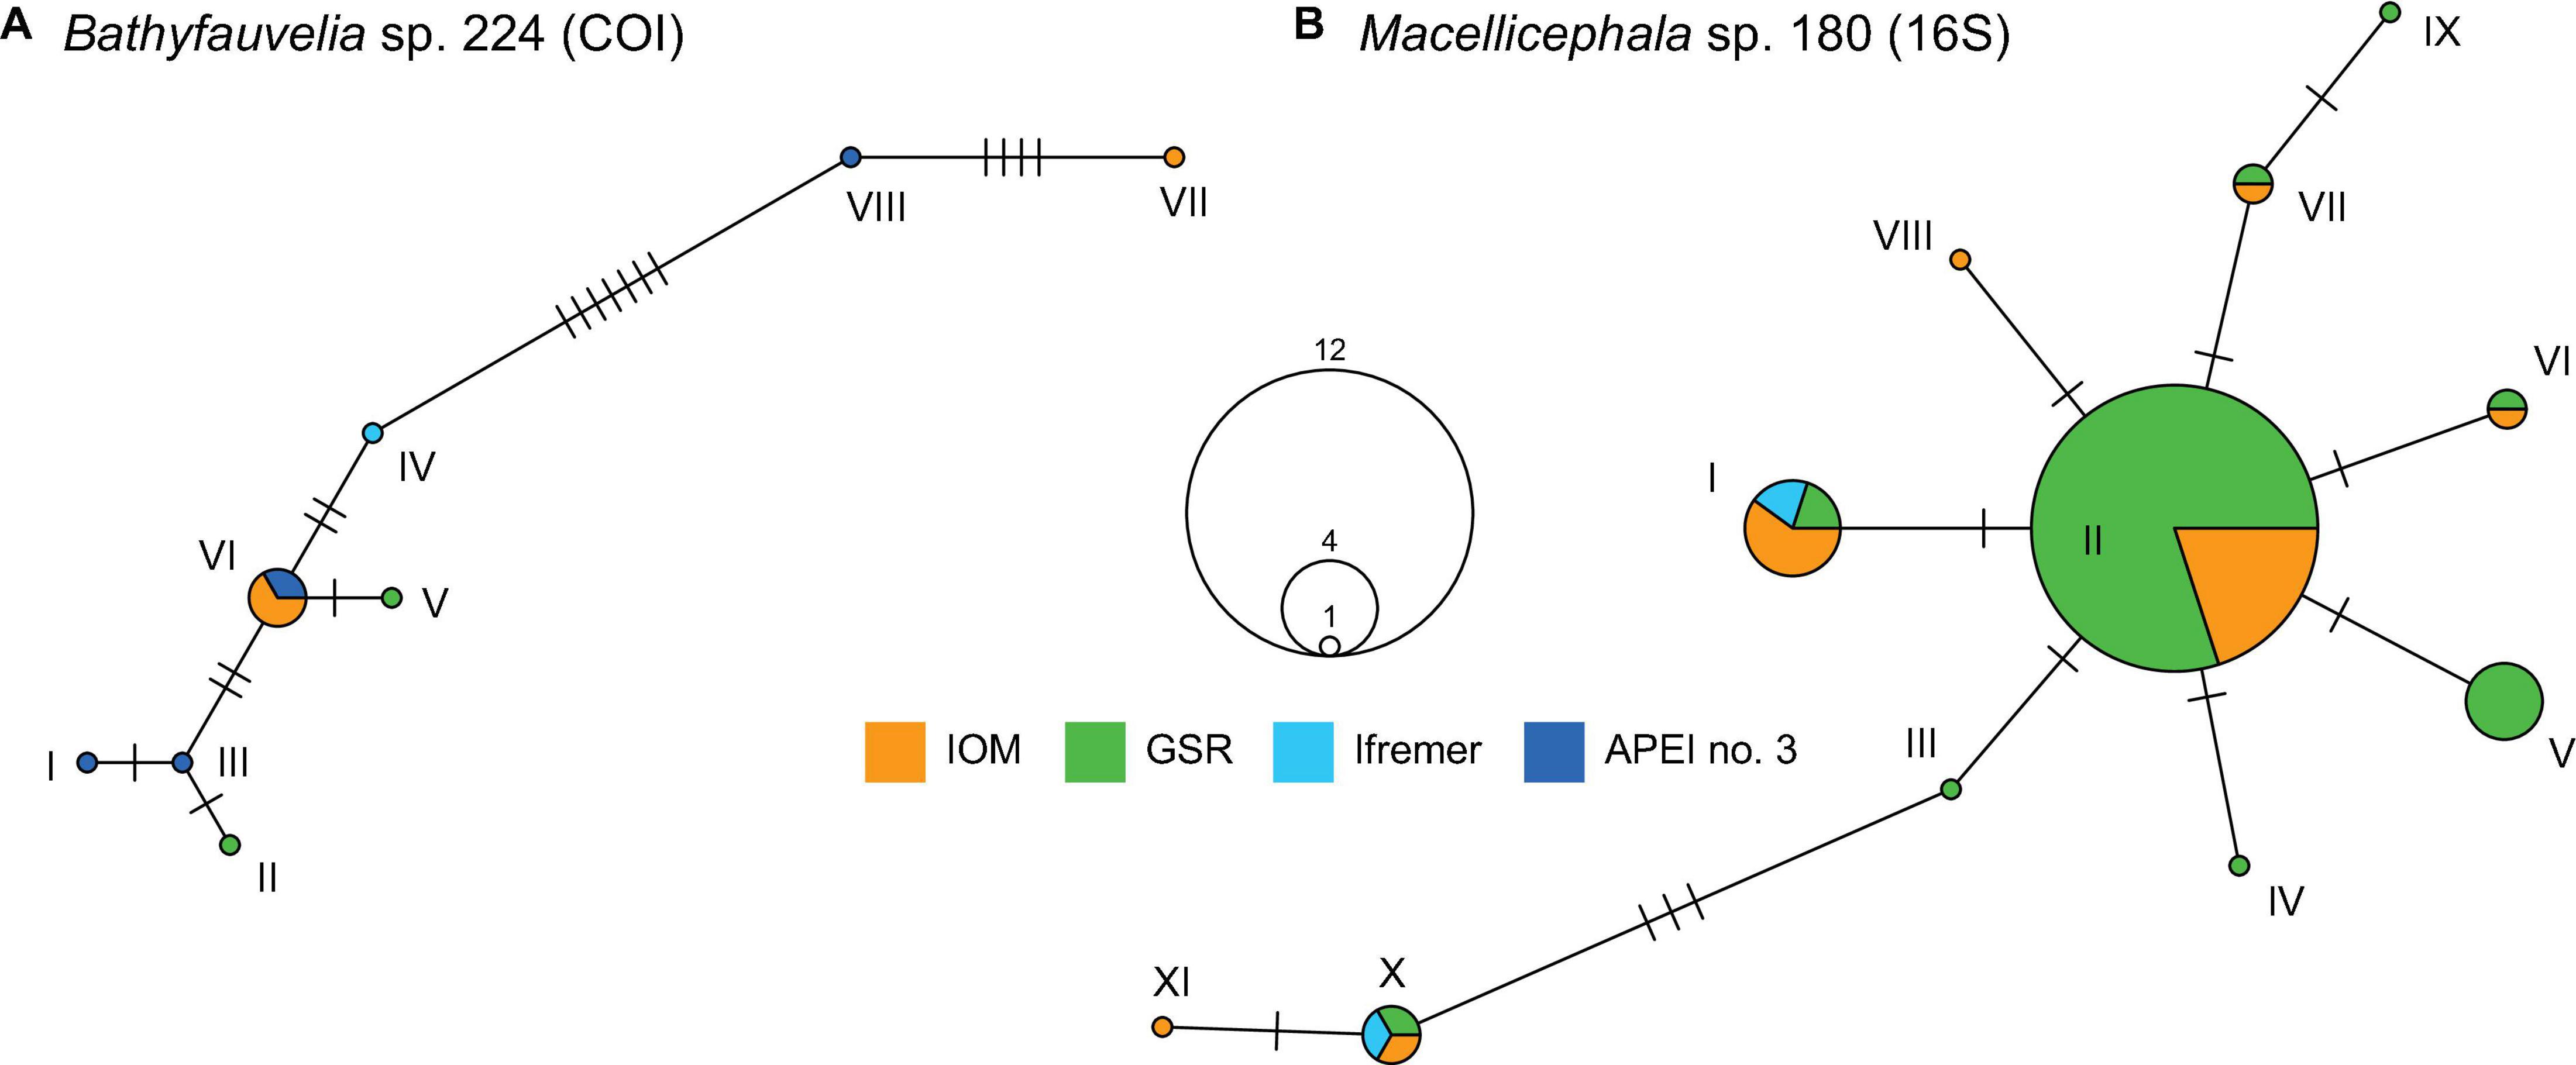
Figure 4. Haplotype networks for Bathyfauvelia sp. 224 (10 sequences) based on COI gene (A) and for Macellicephala sp. 180 (36 sequences) based on 16S gene (B). Each roman number indicates one haplotype with colors indicating sampling areas and dashes indicating mutational steps between haplotypes. Circle size is proportional to the number of samples observed for a specific haplotype.
Polynoidae Assemblages
The structure of polynoid assemblages was analysed from eight fully processed EBS samples from IOM, GSR, Ifremer, and APEI no. 3 areas totalling 239 specimens (Table 1). The proportion among subfamilies varied among the sites (Figure 5). The subfamily Macellicephalinae was dominant while the subfamily Polynoinae was represented by a few specimens at IOM, GSR, and Ifremer areas. Within the subfamily Macellicephalinae, the proportion of the Anantennata group (Macellicephalinae without median antenna) showed a two to fivefold increase at APEI no. 3.
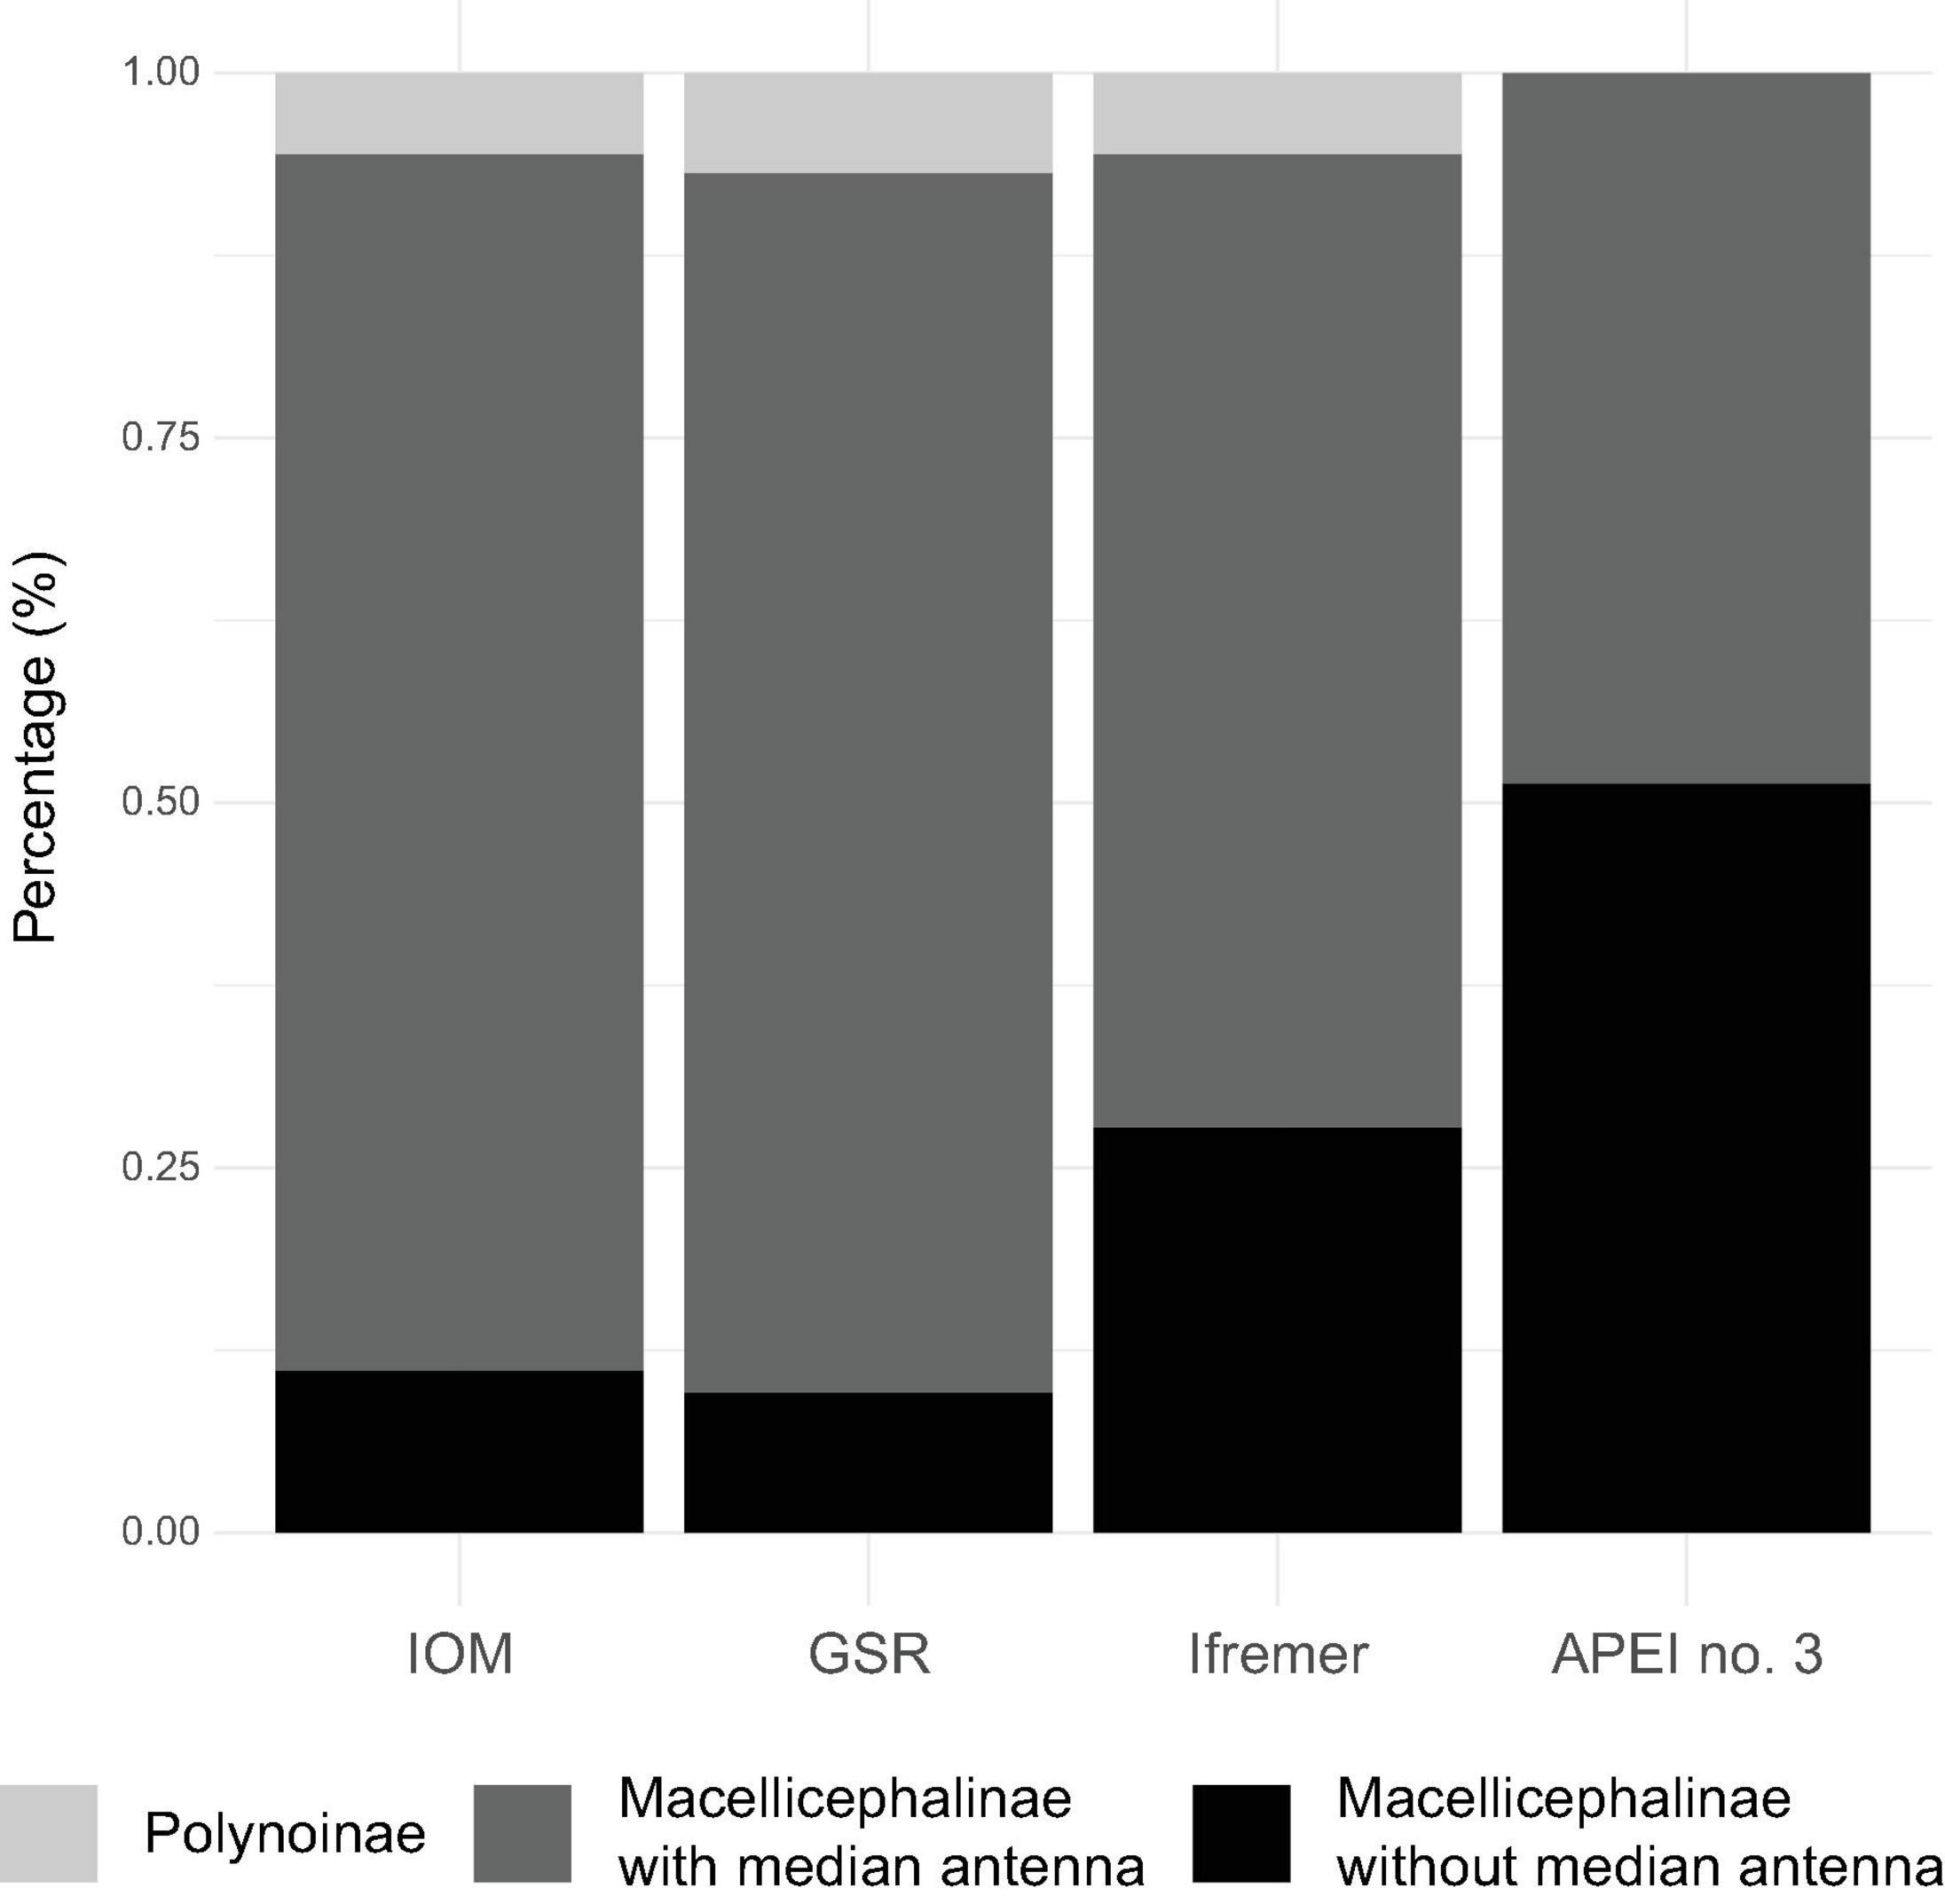
Figure 5. Bar chart of the relative abundance of two polynoid subfamilies – Polynoinae and Macellicephalinae, and within Macellicephalinae with median antenna only or no antennae (i.e., the “Anantennata clade”). Comparisons of data from fully processed EBS samples from the IOM, GSR, Ifremer, and APEI no. 3 study areas.
Taxonomic Diversity
Of the 239 specimens, 234 were identified to species (Table 3). In the case of five poorly preserved specimen, DNA sequencing was not successful, preventing any identification. Based on an integrative taxonomy, 84 species were recognised. The total number of species showed high variability between areas and no clear trend. A total of 24 species were identified at IOM area from 54 individuals, 19 species at GSR area from 73 individuals, 19 species at Ifremer from 35 individuals, and 49 species identified at APEI no. 3 from 72 individuals (Table 3). Species rarefaction curves (individual-based) did not reach an asymptote at any sampled area and suggested higher diversity at APEI no. 3 (Figure 6A). The results also suggest that the diversity at Ifremer and IOM areas is similar and possibly higher than at the GSR area. The non-parametric estimation of species richness followed the same patterns as rarefaction curves, showing the highest values at APEI no. 3 (123 species with Chao1; Table 3). The richness estimates computed by Chao1 and ACE for APEI no. 3 are four to five times higher than for the GSR area, which presented a similar sample size. When data from the four areas were pooled, the rarefaction curve did not level-off (Figure 6C). The non-parametric estimation of species richness at this regional scale yielded estimates ranging from 176 to 202 polynoid species for Chao1 and ACE estimators respectively.

Table 3. Observed species richness (Sobs) and individual-based estimators of polynoid species richness for each sampled area and for the eastern CCFZ (pooled areas) from the fully processed EBS samples.
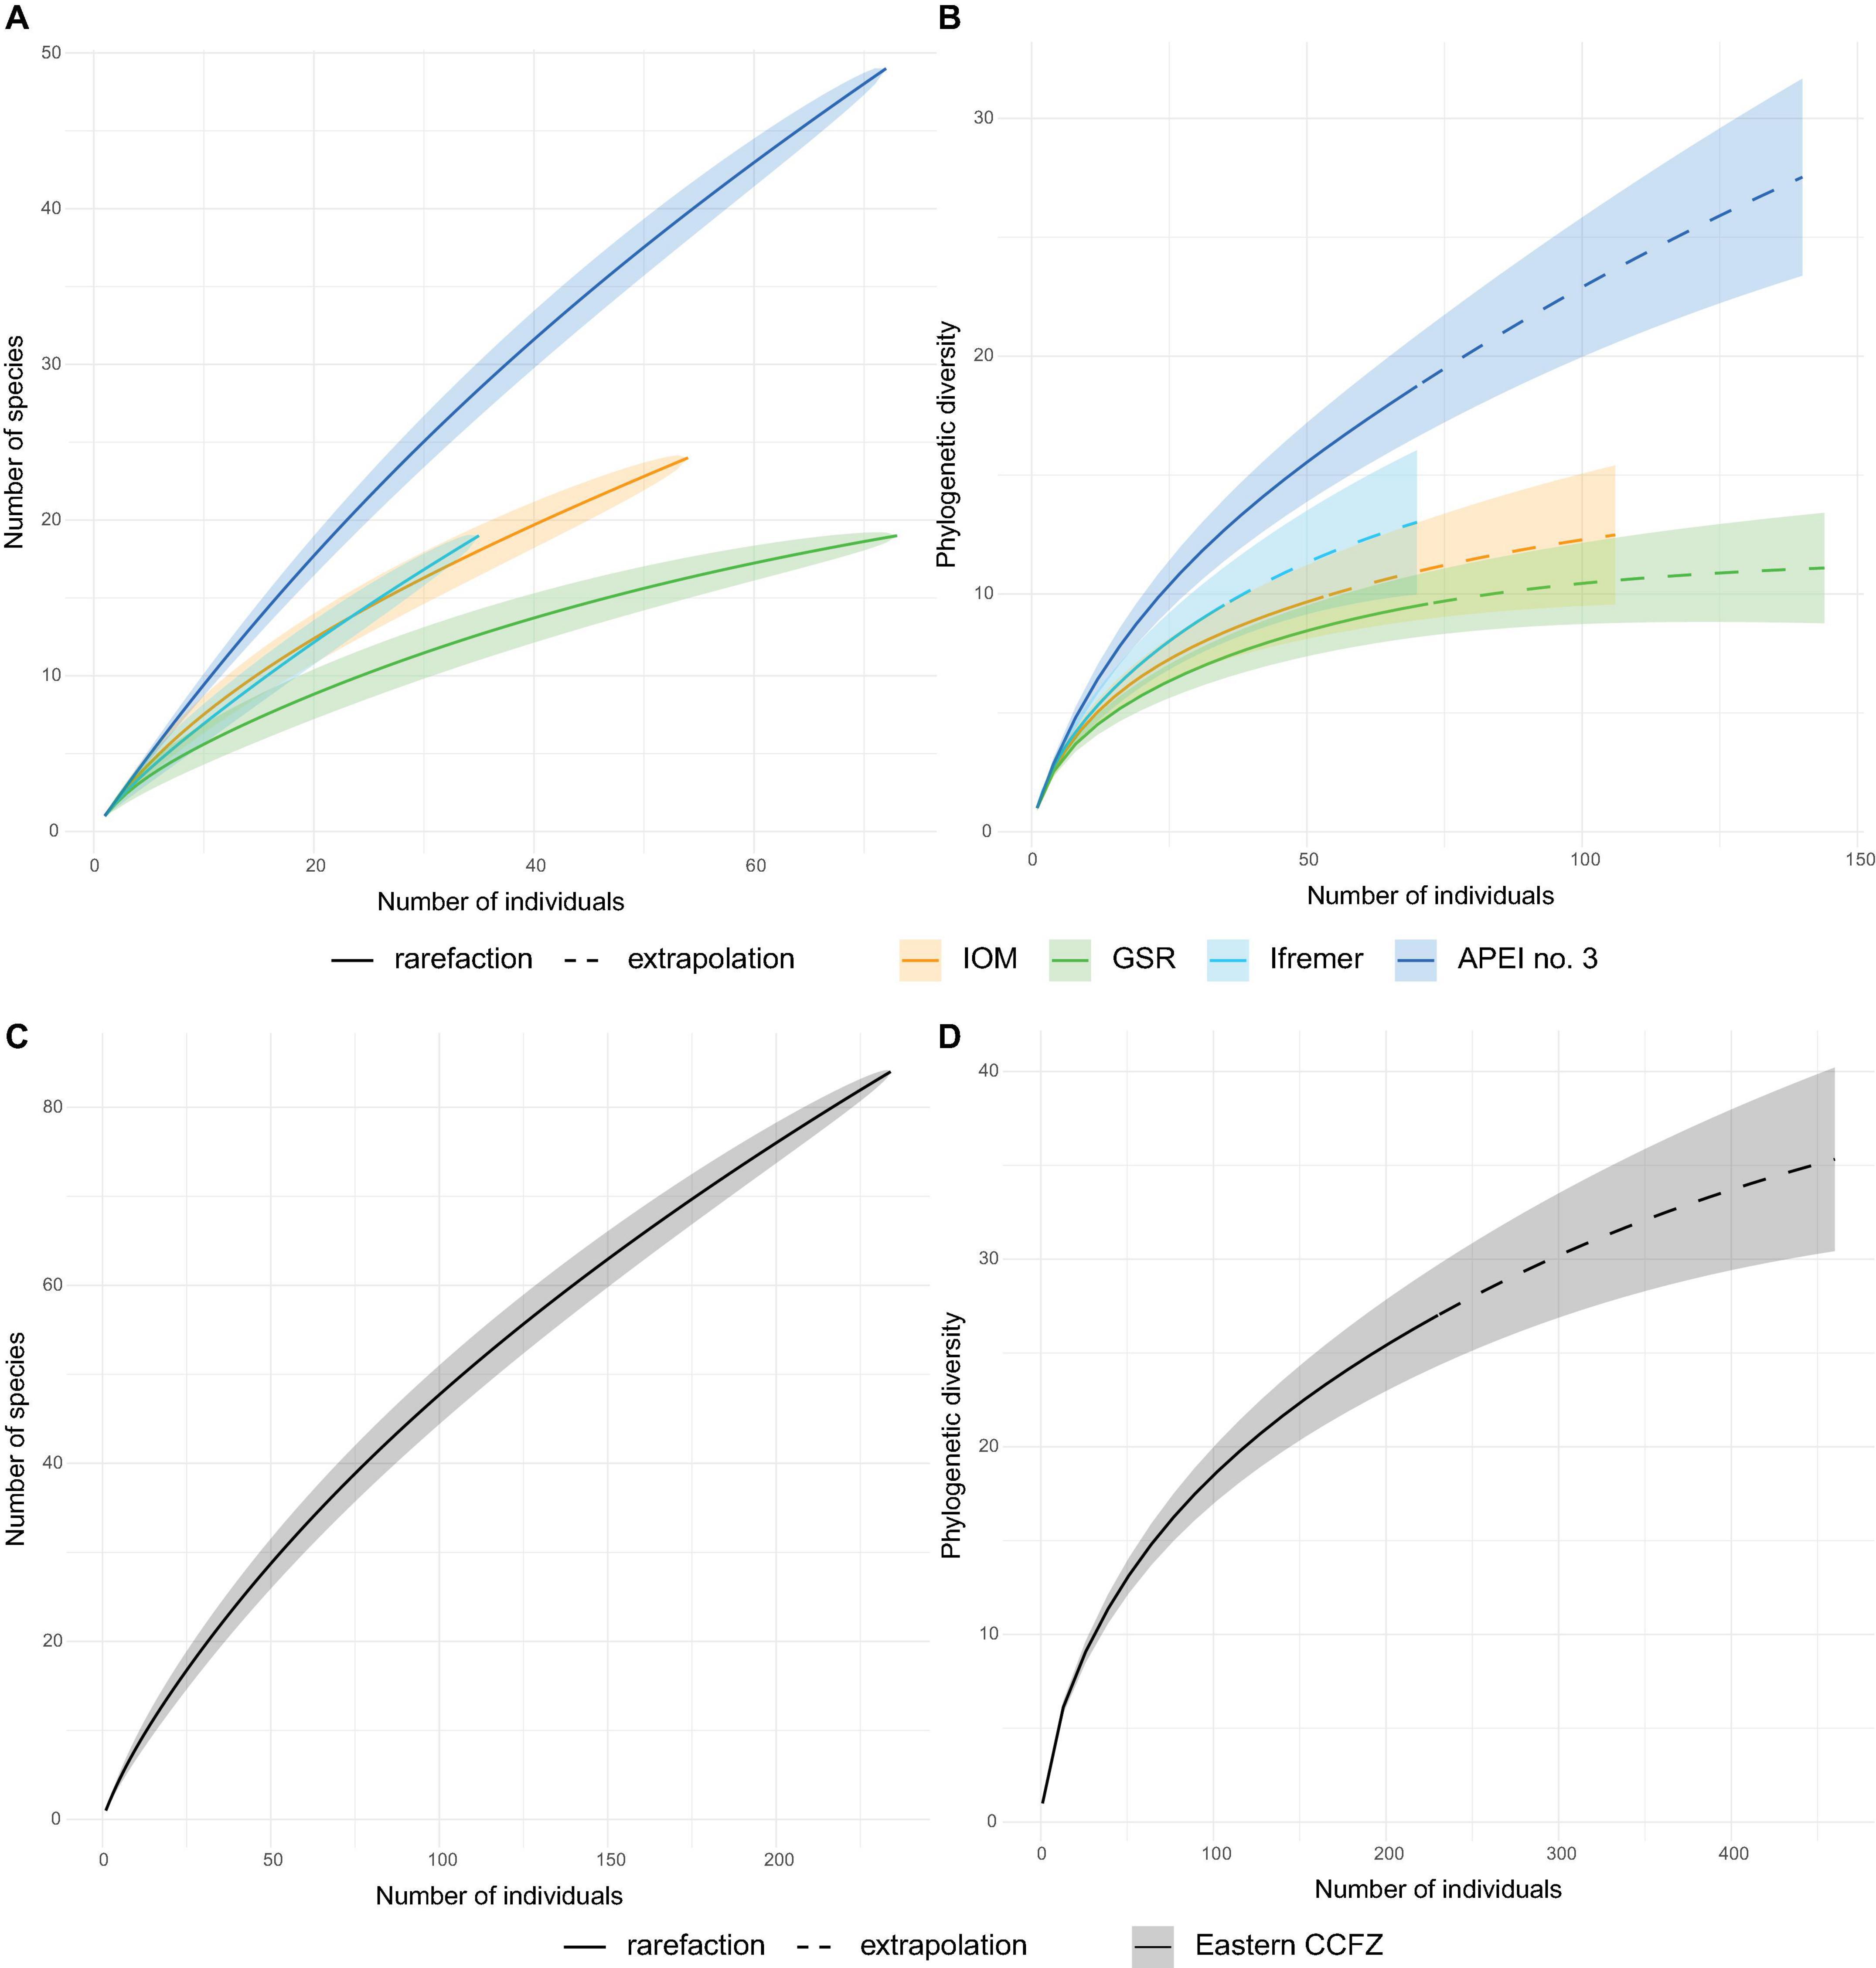
Figure 6. Individual-based rarefaction curves of fully processed EBS samples based on species richness for each sampled area (A) and for the eastern CCFZ (pooled areas, C); and based on phylogenetic diversity for each sampled area (B), and for the eastern CCFZ (pooled areas, D).
The ordination of EBS samples in the two first axes of an H-PCA based on polynoid assemblage structure is illustrated in Figure 7A. The first two axes explained 61% of total variance in the composition of polynoid assemblage (Figure 7A). The first axis explained 40% of total variance and discriminated eastern areas (IOM and GSR) from APEI no. 3. The second axis, explaining 21% of total variance, discriminated the Ifremer area, and particularly one EBS sample. TOC was identified (post hoc) as the environmental variable most significantly related (p < 0.01) to the first axis (Figure 7A). POC, silt and clay were also significantly related to the first axis (p < 0.05). The ordination of species (Figure 7A) showed that Macellicephala sp. 180 and Macellicephaloides moustachu were the species most characteristic in eastern areas (particularly in IOM and GSR for the first, and in GSR and Ifremer for the second).
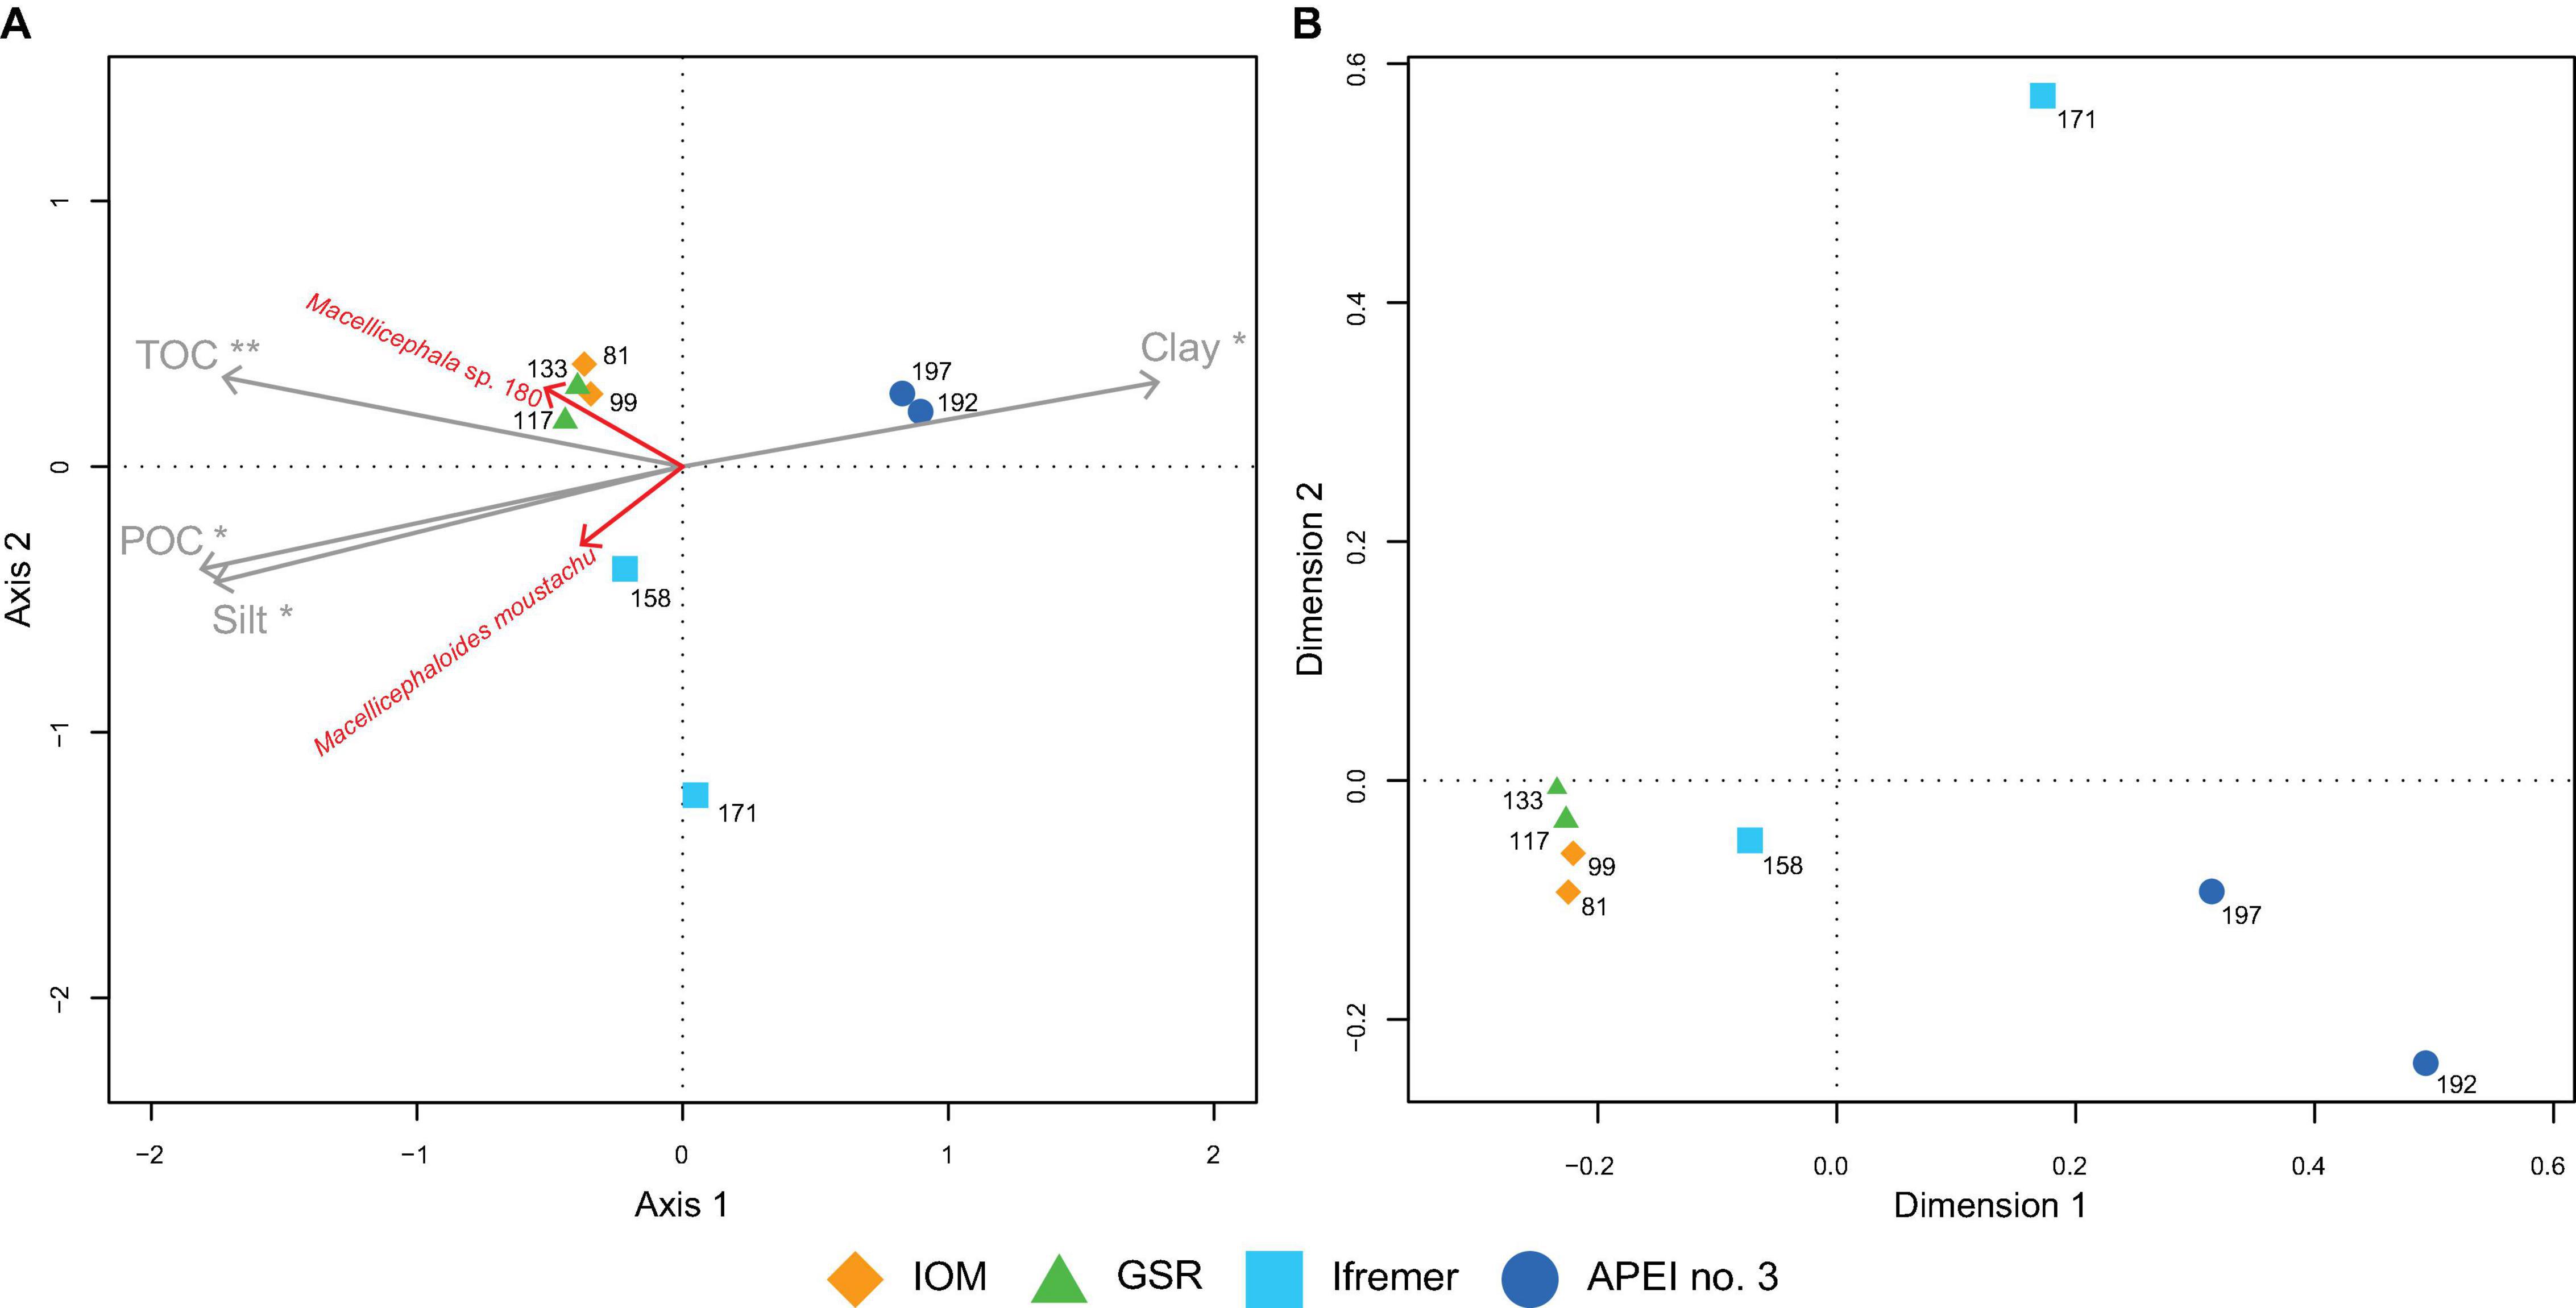
Figure 7. Ordination plot of polynoid assemblages from fully processed EBS samples. (A) H-PCA biplot based on the Chord-Normalized Expected Species Shared (CNESS with m = 3) distance of species (scaling 2) with variables significantly correlated to the projected points (post hoc envfit permutation test) and showing species contributing most to two first axes (A, scaling 2). Significance codes: **p < 0.01 and *p < 0.05. (B) PCoA plot based on UniFrac phylogenetic distances.
The relationship between distance and assemblage similarity showed no significant correlation (R2 = 0.12, p = 0.49; Supplementary Figure 1A) but two groups of pairwise comparisons can be highlighted. The three pairwise comparisons between exploration contracts and APEI no. 3 consistently show the lowest values of similarity, irrespective of distance. For pairwise comparison among the three exploration contracts, similarity decreases with distance but the correlation is not statistically significant (R2 = 0.84, p = 0.26; Supplementary Figure 1C).
Phylogenetic Diversity
Out of the 239 specimens recovered from fully examined EBS, 230 were sequenced and identified to one of the 80 species represented in the phylogenetic tree. Maximum likelihood and Bayesian inference resulted in very similar phylogenetic trees (Supplementary Figure 2). For phylogenetic diversity analyses, the distance between species in the Bayesian inference tree has been considered. The rarefaction curves of the Faith phylogenetic diversity showed significantly higher diversity in APEI no. 3 than Ifremer, GSR, and IOM areas (Figure 6B). The same pattern was observed for the estimated asymptotes where APEI no. 3 was expected to have two to three times higher diversity (Table 4). Pooling of samples from the four areas did not result in rarefaction curve levelling off either (Figure 6D).
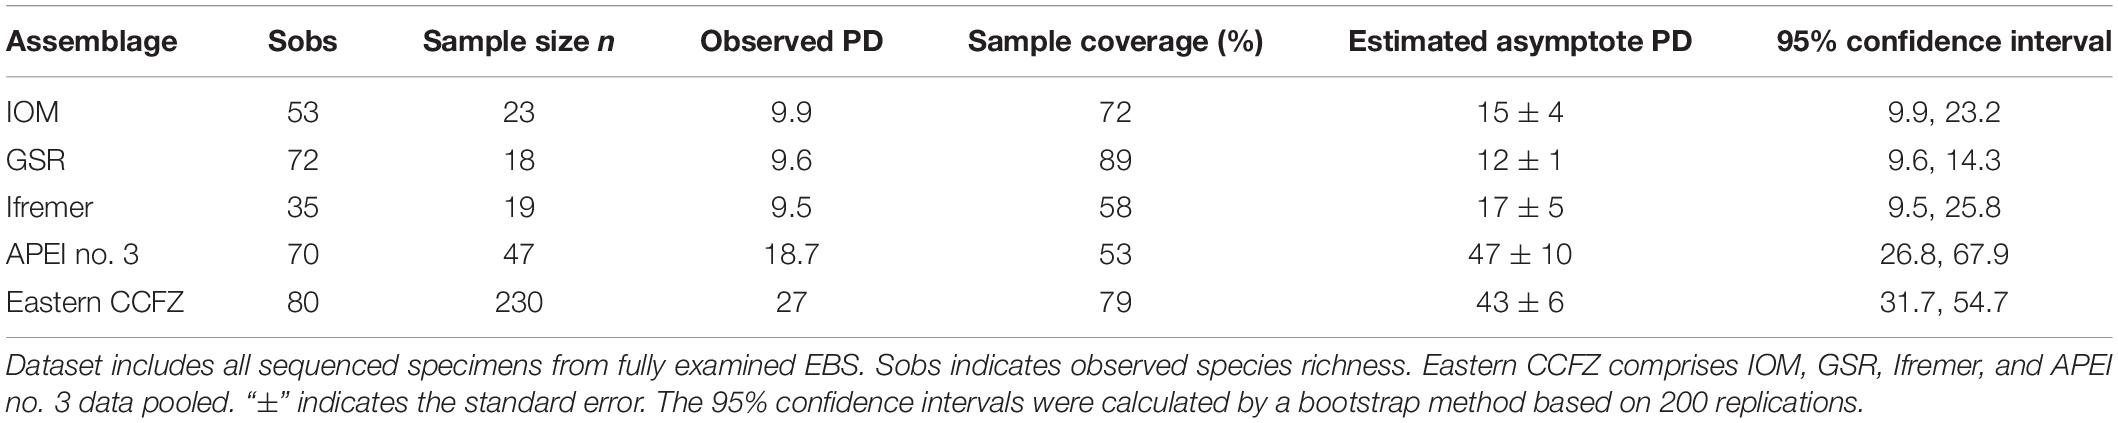
Table 4. Individual-based phylogenetic diversity (PD) of polynoid assemblages.
The PCoA based on phylogenetic distance showed similar patterns to the H-PCA ordination (Figure 7B). APEI no. 3 was discriminated from southern areas, and Ifremer separated from GSR and IOM, which are closely related.
The phylogenetic distance showed no relationship with geographic distance (R2 = 0.10, p = 0.54; Supplementary Figure 1B). Two groups of pairwise comparison were evident, as previously found with taxonomic similarity. Pairwise comparison with the APEI no. 3 had the highest phylogenetic distances irrespective of geographic distances while pairwise comparison among exploration contracts showed a pattern of increasing phylogenetic distance as a function of geographic distance. This pattern was however not statistically significant (R2 = 0.84, p = 0.26; Supplementary Figure 1D).
Discussion
Causes of Polynoid Species Turnover in the Clarion-Clipperton Fracture Zone
Taxonomic and phylogenetic beta diversity patterns were similar for polynoid assemblages across the eastern CCFZ. The composition of polynoid assemblages discriminated the eastern (i.e., IOM and GSR) from the western areas (i.e., Ifremer and APEI no. 3). It was also possible to notice clear differences between the Ifremer and APEI no. 3. These patterns in species turnover resemble those already reported among the same sampling sites for infaunal polychaetes (Bonifácio et al., 2020), tanaids (Błażewicz et al., 2019), and nematodes (Hauquier et al., 2019). So far, the three main processes evoked to explain these patterns were food inputs, sediment grain size, and a barrier to dispersal.
Conflicting Patterns of Community Structure Along a Gradient of Surface Primary Productivity
Sea surface primary productivity decreases from south-east to north-west across the eastern CCFZ with POC fluxes ranging from 1.54 mg C m–2 d–1 at IOM to 1.07 mg C m–2 d–1 at APEI no. 3 (Volz et al., 2018a). In previous studies, beyond species turnover, the influence of food inputs on community structure was supported by positive correlations between POC fluxes and the abundance or taxonomic richness of infauna (Błażewicz et al., 2019; Hauquier et al., 2019; Bonifácio et al., 2020). However, here, the highest species richness of polynoids was found at APEI no. 3, the most oligotrophic site. The EBS used in this study, while very efficient in sampling the poorly known vagile epifauna (Brandt and Schnack, 1999), is a qualitative sampler contrary to the box corer used to sample infauna. Diversity data extrapolated from EBS trawls should thus be interpreted with caution. Yet, without ruling out the sample bias, a high number of specimens and species of polynoids at APEI no. 3, driven mainly by Macellicephalinae, might also be explained by adaptations to oligotrophy (see below).
The Influence of Sediment Grain Size – Fact or Artefact?
In addition to low POC flux, the sediments at APEI no. 3 were characterised by a lower average grain size, higher clay content and lower porosity (Volz et al., 2018a; Hauquier et al., 2019). Higher contents of finer sediments have been postulated to increase sediment shear strength making it more difficult for fauna to burrow (Trueman et al., 1966). Chuar et al. (2020) pointed out that sediment shear strength may impact negatively infaunal abundance in the OMS area located at the south-eastern end of the CCFZ. Together with low food input, inhospitable sediments may thus have contributed to the low abundance of infaunal polychaetes, tanaids, and nematodes at APEI no. 3 (Błażewicz et al., 2019; Hauquier et al., 2019; Bonifácio et al., 2020). In turn, the low infaunal standing stock may increase the relative availability of resources to epifaunal communities. Like polynoids, isopods from EBS samples also showed a number of specimens and species similar to or even higher at APEI no. 3 than at the southern areas (Ifremer, GSR, IOM, and BGR; Brix et al., 2020). Contrasting patterns in community structure between infaunal and epifaunal assemblages at APEI no. 3 are thus consistent for different taxonomic groups. However, sampling bias cannot be ruled out, as sediment heterogeneity may influence the sampling efficiency of an EBS (Guggolz et al., 2018). At APEI no. 3, the higher clay content might have facilitated sediment flushing through the nets, limiting sediment clogging and increasing the effective sampling time, contrary to southern sites where the EBS mesh would have filled up faster.
Clarion Fracture, a True Barrier to Dispersal?
The pairwise comparisons of taxonomic and phylogenetic composition show that the polynoid assemblage from APEI no. 3 is systematically the most different from all other assemblages, regardless of geographic distance between sites. This may suggest that the Clarion fracture is a biogeographic barrier between the northern APEI no. 3 and the southern exploration contract areas (Ifremer, GSR, IOM, and BGR). This fracture represents a long and narrow submarine mountain range displaying peak-and-trough patterns with up to 1800 m of difference in elevation (Hall and Gurnis, 2005).
Ridges and fractures can work as physiographic barriers affecting the dispersal of different taxa to a lesser or greater degree. For example, the Mid-Atlantic Ridge (MAR) allows the dispersal of nematodes of the genus Acantholaimus (Lins et al., 2018), copepods of the genus Mesocletodes (Menzel et al., 2011) and isopods of the family Munnopsidae (Bober et al., 2018), but is mostly impermeable to isopods of the families Macrostylidae, Desmosomatidae, and Nannoniscidae (Bober et al., 2018). Polychaetes did not show a clear pattern in the permeability of the MAR as a barrier (Guggolz et al., 2018). Guggolz et al. (2018) examined the distribution of polychaetes and species composition of spionids and polynoids along the Vema Fracture Zone across the MAR. They observed significant changes in species composition across the MAR and suggested them to be the result of limited dispersal potential and different habitat characteristics. Only six of 32 polynoid species crossed the MAR (Guggolz et al., 2018).
Based on our CCFZ samples, 11 of 96 polynoid species (10%) were found on both sides of the Clarion Fracture Zone, which is a much higher proportion of faunal sharing than for infaunal polychaetes (1%; Bonifácio et al., 2020) or infaunal tanaidaceans (0%; Błażewicz et al., 2019), in the same order of magnitude as isopods sampled with an EBS (5%; Brix et al., 2020), and still lower than scavenging amphipods (90%; Patel et al., 2020). For isopods, variations in species ranges across the CCFZ were attributed to variable swimming habits, and thus dispersal abilities (Brix et al., 2020; Janssen et al., 2015). Among the most abundant species of polynoids, Bathyfauvelia sp. 224 (10 specimens) remarkably occurs on both sides of the fracture while Macellicephaloides moustachu (37 specimens), and Macellicephala sp. 180 (45 specimens) were clearly restricted to south of the fracture. The subfamily Macellicephalinae, which is dominant among deep-sea polynoids, shows morphological characters that facilitate a benthopelagic lifestyle (see below). However, M. moustachu has been described as having very thin neurochaetae which would evidently affect its ability to swim, and may have contributed to limit its distribution south of the Clarion fracture. This species also has morphological structures attached to the body that may potentially be related to reproduction (Bonifácio and Menot, 2018).
The life cycle of polynoids is mostly known from shallow water species, which have generally a planktotrophic larval development (Giangrande, 1997). A few species in the deep sea are however assumed to undergo lecithotrophic development (Glover et al., 2005), a more suitable condition in oligotrophic waters (Tyler and Young, 1999). External brooding of eggs under the dorsal elytra has also been observed in polynoids of the Antarctic shelf (Gambi et al., 2001). Species from the CCFZ also showed swollen or sac-like structures on the dorsal side, which may be linked to reproduction (Bonifácio and Menot, 2018).
Overall, the benthopelagic lifestyle of some deep-sea polynoids combined with the planktotrophic larval development inherited from their shallow-water relatives might explain the relatively large geographic ranges of Polynoidae at community scale in the CCFZ, with 10% of species shared between north and south of the Clarion fracture. However, this is still a low sharing proportion, considering that the purpose of APEI no. 3 is to preserve representative biodiversity of benthic communities within the CCFZ (Wedding et al., 2013). Further, while some polynoids radiated in the deep sea, much remains to be learned about their reproduction and mode of life.
Enhanced Diversity at Great Depths Potentially Related to Low Food Input and Mode of Life
In a global census of abyssal polychaetes (Paterson et al., 2009), polynoids represented the most species-rich family with 91 species out of a total of 768 polychaete species occurring below 2000 m depth. In addition, 13 out of the 15 species occurring below 4000 m depth belonged to the subfamily Macellicephalinae. Interrogation of the Ocean Biodiversity Information System yielded 125 valid species of polynoids below 2000 m depth (OBIS, 2020). The Macellicephalinae (sensu Bonifácio and Menot, 2018) is the most species-rich deep-sea subfamily with 70 species, followed by Polynoinae with 41 species. The depth ranges of OBIS records differ for these two subfamilies. For 311 valid species of Polynoinae, the depth range varies from 0 to 5400 m depth, with a median at 21 m; while for 89 valid species of Macellicephalinae the depth range varies from 298 to 10,180 m, with a median at 2451 m. In total, 121 species are currently described within Macellicephalinae (36 genera) including only 15 Anantennata (Read and Fauchald, 2021), with the recent additions of 37 new species and four new genera (Bonifácio and Menot, 2018; Jimi et al., 2018; Neal et al., 2018a; Zhang et al., 2018; Zhou et al., 2018; Lindgren et al., 2019; Wu et al., 2019; Hatch et al., 2020; Kolbasova et al., 2020).
Our results (including 16 named species from Bonifácio and Menot, 2018) indicate the presence of at least 92 Macellicephalinae species with 42 being Anantennata in the eastern CCFZ, in the north-east Pacific. In the Atlantic Ocean, Guggolz et al. (2018) were able to identify eight Anantennata species among the 31 Macellicephalinae species recognised. Macellicephalins are thus polychaetes thriving in cold and dark environments that have successfully colonised deep-sea habitats such as chemosynthetic ecosystems (hydrothermal vents and cold seeps; Pettibone, 1983; Chevaldonné et al., 1998; Hatch et al., 2020), trenches (Levenstein, 1971; Pettibone, 1976), manganese nodules (Bonifácio and Menot, 2018), and the deep Antarctic shelf (Neal et al., 2018a,b) but also analogous shallow water habitats such as submarine caves (Pettibone, 1985b).
Macellicephalins differ from other polynoid subfamilies in having lost their antennae. Polynoids from shallow waters typically possess two lateral and one median antennae, whereas macellicephalins have either only a median antenna or no antennae at all. Macellicephalins without antennae form a monophyletic group (i.e., the “Anantennata clade”; Bonifácio and Menot, 2018). Macellicephalinae probably originated from short-body polynoids such as Bathymoorea (Eulagiscinae), a morphology that is reminiscent of macellicephalins from chemosynthetic habitats (a robust body, thick elytra and short body appendages; Desbruyères and Hourdez, 2000) and is likely associated with a basal position within Macellicephalinae (Bonifácio and Menot, 2018).
Deep-sea, polar and cave-endemic macellicephalins not living in chemosynthetic habitats share mostly distinct morphological characters such as a soft body, delicate elytra, loss of eyes, relatively thin, flattened and long chaetae, elongated parapodia, and sometimes extremely long dorsal cirri or reduction of jaws (Uschakov, 1977, 1982; Bonifácio and Menot, 2018; Gonzalez et al., 2018). Pettibone (1985a) also observed some of these morphological characters specific for pelagic life in Natopolynoe kensmithi Pettibone, 1985a which was described to be abundant not only on the seafloor but also swimming up to 10 m above it. Some Macellicephalinae seem to be benthopelagic, swimming in near-bottom water in search of food (Knox, 1959; Pettibone, 1976; Uschakov, 1977, 1982). Other studies, examining megafauna, have also recorded macellicephalins swimming in the water column (Smith and Hamilton, 1983; Rybakova et al., 2019). Some macellicephalins also have elongated papillae on their pharynx, assumed to be helpful in rapid capture of small suspended particles, a character also shared with the pelagic family Alciopidae (Pettibone, 1976; Uschakov, 1982). Evidence presented so far supports the hypothesis of Gonzalez et al. (2018) of a secondary pelagic mode of life as a deep-sea adaptation in polynoids. These authors also suggested that scale worms living in aphotic environments (i.e., submarine caves and the deep-sea) are subjected to the “darkness syndrome” promoting morphological and behavioral changes such as loss of eyes, elongation of appendages and shifting to swimming behavior.
Elongated appendages could provide an evolutionary advantage in two ways for deep-sea polynoids. Firstly, cirri elongation increases the surface area thus contributing to attainment of neutral buoyancy (Gonzalez et al., 2018). Secondly, cirri elongation could increase their sensitivity to prey detection. By removing the sensory appendages in Harmothoe species, Daly (1972) showed that the ability to locate a source of vibrations is an important factor in feeding behavior. His experiments further suggested that palps provide the worm with contact exploration of the object and chemical information (e.g., if suitable as prey or not) whereas dorsal cirri were responsible for relaying chemical information and vibration source location (Daly, 1972). Therefore, the elongation of appendages in deep-sea polynoids could represent an adaptation of the subfamily Macellicephalinae to food limitation by increasing the access to food (invasion of new niches) and prey detection.
The swimming behavior in Macellicephalinae was likely the key to exploitation of new trophic resources, unavailable to worms with a benthic lifestyle. This rare semi-pelagic mode of life within polynoids has been well-documented for a Polynoinae species, Bylgides sarsi (Kinberg in Malmgren, 1866), which rises above the bottom to mid-water during the night, escaping the poor oxygen conditions close to the bottom and feeding on small pelagic crustaceans or scavenging dead planktonic organisms on the bottom (Pettibone, 1993). Evolution of similar behavior may have enabled macellicephalins to explore benthic and pelagic niches in the deep sea, particularly within hadal depths where they are the most characteristic and diverse polychaetes (Paterson et al., 2009; Jamieson, 2015).
Conclusion
Variations in epibenthic polynoid assemblages across the CCFZ show similarities with other faunal groups in that species turnover covaries with POC flux and thus food supply. A major difference from the infaunal pattern (Bonifácio et al., 2020) is that species richness was similar to or even higher at APEI no. 3, the most oligotrophic site located north of the Clarion fracture, in comparison to other exploration mining areas to the south. This unexpected pattern may result from sampling bias, but could also be due to: (i) higher shear strength of APEI no. 3 sediments making them less hospitable to infauna to the benefit of epifauna and (ii) evolutionary adaptations of macellicephalins towards a benthopelagic life strategy under oligotrophic conditions in the deep sea. The difference in species composition and community structure at APEI no. 3 brings into question the key principles of the APEI network, as this area appears not representative of the biogeography and habitat of the broader region (Wedding et al., 2013). However, such a conclusion is tentative, given the limited sampling within this APEI.
The polynoids in the CCFZ are highly diverse, with most diversity confined to the subfamily Macellicephalinae, which has particularly radiated in the deep sea. Together with the results of Bonifácio and Menot (2018) from the same areas in the CCFZ, our results increase the number of known Macellicephalinae species worldwide. We have newly identified 42 Anantennata species whereas only eight species have been described worldwide prior to our visit in 2015. This number indicates, how underestimated macellicephalin diversity currently is. Other questions remain unanswered as well: Do they have a pattern of vertical movement? Is the elongation of appendages driven by swimming behavior or prey detection? How do they interact with other species? How do they reproduce and disperse?
Data Availability Statement
DNA sequences are available in BOLD (https://dx.doi.org/10.5883/DS-POLYNOID; Bonifácio, 2021) and GenBank. The total number of specimens and species data examined in the present study with respective BOLD IDs and GenBank accession numbers are available in the PANGAEA database (https://doi.org/10.1594/PANGAEA.926674; Bonifácio et al., 2021).
Author Contributions
LM was responsible for the project planning and sampling design. All authors carried out the sampling and the subsequent sample processing on board. PB was responsible for the identification of Polynoidae and data analysis. All authors involved in data interpretation and preparation of the manuscript.
Funding
This study received funding from the Ifremer programme “Ressources Minérales Marines” (REMIMA), the JPI Oceans pilot action “Ecological Aspects of Deep-Sea Mining,” and the European Union Seventh Framework Programme (FP7/2007–2013) under the MIDAS project, grant agreement no. 603418.
Conflict of Interest
The authors declare that the research was conducted in the absence of any commercial or financial relationships that could be construed as a potential conflict of interest.
Publisher’s Note
All claims expressed in this article are solely those of the authors and do not necessarily represent those of their affiliated organizations, or those of the publisher, the editors and the reviewers. Any product that may be evaluated in this article, or claim that may be made by its manufacturer, is not guaranteed or endorsed by the publisher.
Acknowledgments
We are grateful to Pedro Martínez, the crew of the RV Sonne, the team of the ROV Kiel 6000 and all people who participated in the field sampling and sample processing during the SO239 cruise. Many thanks for sample processing to Stefanie Kaiser, Sarah Schnurr and Ana Hilário; and to Emmanuelle Omnes for assistance with DNA extraction and amplification. Special thanks to Helena Wiklund and Thomas Dahlgren who initiated PB in phylogenetic and connectivity studies. We are thankful to Alison Chalm for the English editing. Finally, we extend our sincere thanks to Erica Goetze and the two referees for their critical reviews and helpful comments on the manuscript.
Supplementary Material
The Supplementary Material for this article can be found online at: https://www.frontiersin.org/articles/10.3389/fmars.2021.656899/full#supplementary-material
Supplementary Figure 1 | Distance decay of New Normalized Expected Species Shared (NNESS) between IOM, GSR, Ifremer, and APEI no. 3 (A) and the same areas excluding APEI no. 3 (C). Distance decay of UniFrac phylogenetic distance between IOM, GSR, Ifremer, and APEI no. 3 (B) and the same areas excluding APEI no. 3 (D).
Supplementary Figure 2 | Molecular phylogenetic relationship among sampled polynoid species based on concatenated genes (COI, 16S, and 18S) and performed with maximum-likelihood (A) and Bayesian inference (B) analyses. Outgroup (sigalionid species) colored in gray. Node values indicate the maximum-likelihood bootstrap (A) and Bayesian posterior probabilities (B).
Footnotes
- ^ http://www.boldsystems.org
- ^ https://www.ncbi.nlm.nih.gov/genbank/
- ^ http://tree.bio.ed.ac.uk/software/figtree/
References
Błażewicz, M., Jóźwiak, P., Menot, L., and Pabis, K. (2019). High species richness and unique composition of the tanaidacean communities associated with five areas in the Pacific polymetallic nodule fields. Prog. Oceanogr. 176:102141. doi: 10.1016/j.pocean.2019.102141
Bober, S., Brix, S., Riehl, T., Schwentner, M., and Brandt, A. (2018). Does the Mid-Atlantic Ridge affect the distribution of abyssal benthic crustaceans across the Atlantic Ocean? Deep Sea Res. Part II Top. Stud. Oceanogr. 148, 91–104. doi: 10.1016/j.dsr2.2018.02.007
Bonifácio, P. (2021). Polynoidae from Clarion-Clipperton Fracture Zone sampled during SONNE cruise SO239. Bold 2021:5883. doi: 10.5883/DS-POLYNOID
Bonifácio, P., and Menot, L. (2018). New genera and species from the Equatorial Pacific provide phylogenetic insights into deep-sea Polynoidae (Annelida). Zool. J. Linn. Soc. 185, 555–635. doi: 10.1093/zoolinnean/zly063
Bonifácio, P., Martínez Arbizu, P., and Menot, L. (2020). Alpha and beta diversity patterns of polychaete assemblages across the nodule province of the eastern Clarion-Clipperton Fracture Zone (equatorial Pacific). Biogeosciences 17, 865–886. doi: 10.5194/bg-17-865-2020
Bonifácio, P., Neal, L., Omnes, E., and Menot, L. (2021). Polychaete fauna belonging to family Polynoidae of the Clarion-Clipperton Fracture Zone sampled during SONNE cruise SO239. Pangaea 2021:926674. doi: 10.1594/PANGAEA.926674
Borcard, D., Gillet, F., and Legendre, P. (2018). Numerical Ecology With R. Cham: Springer International Publishing, doi: 10.1007/978-3-319-71404-2
Brandt, A., and Schnack, K. (1999). Macrofaunal abundance at 79°N off East Greenland: opposing data from epibenthic-sledge and box-corer samples. Polar Biol. 22, 75–81. doi: 10.1007/s003000050392
Brenke, N. (2005). An epibenthic sledge for operations on marine soft bottom and bedrock. Mar. Technol. Soc. J. 39, 10–21. doi: 10.4031/002533205787444015
Brix, S., Osborn, K. J., Kaiser, S., Truskey, S. B., Schnurr, S. M., Brenke, N., et al. (2020). Adult life strategy affects distribution patterns in abyssal isopods – implications for conservation in Pacific nodule areas. Biogeosciences 17, 6163–6184. doi: 10.5194/bg-17-6163-2020
Carr, C. M., Hardy, S. M., Brown, T. M., Macdonald, T. A., and Hebert, P. D. N. (2011). A tri-oceanic perspective: dna barcoding reveals geographic structure and cryptic diversity in canadian polychaetes. PLoS ONE 6:e22232. doi: 10.1371/journal.pone.0022232
Chevaldonné, P., Jollivet, D., Feldman, R. A., Desbruyères, D., Lutz, R. A., and Vrijenhoek, R. C. (1998). Commensal scale-worms of the genus Branchipolynoe (Polychaeta: Polynoidae) at deep-sea hydrothermal vents and cold seeps. Cah. Biol. Mar. 39, 347–350.
Chiu, C.-H., Wang, Y.-T., Walther, B. A., and Chao, A. (2014). An improved nonparametric lower bound of species richness via a modified good-turing frequency formula: An improved nonparametric lower bound of species richness. Biom. 70, 671–682. doi: 10.1111/biom.12200
Chuar, C. H., Tong, S. J. W., Chim, C. K., Wong, H. P. S., and Tan, K. S. (2020). Abyssal macrofaunal community structure in the polymetallic nodule exploration area at the easternmost region of the clarion-clipperton fracture zone, pacific ocean. Deep Sea Res. Part 1 Oceanogr. Res. Pap. 161:103284. doi: 10.1016/j.dsr.2020.103284
Cohen, B. L., Gawthrop, A., and Cavalier–Smith, T. (1998). Molecular phylogeny of brachiopods and phoronids based on nuclear–encoded small subunit ribosomal RNA gene sequences. Phil. Trans. R. Soc. Lond. B 353, 2039–2061. doi: 10.1098/rstb.1998.0351
Conway, J. R., Lex, A., and Gehlenborg, N. (2017). UpSetR: an R package for the visualization of intersecting sets and their properties. Bioinformatics 33, 2938–2940. doi: 10.1093/bioinformatics/btx364
Daly, J. M. (1972). The ability to locate a source of vibrations as a prey−capture mechanism in Harmothoë imbricata (Annelida Polychaeta). Mar. Freshw. Behav. Physiol. 1, 305–322. doi: 10.1080/10236247209386906
De Smet, B., Pape, E., Riehl, T., Bonifácio, P., Colson, L., and Vanreusel, A. (2017). The Community structure of deep-sea macrofauna associated with polymetallic nodules in the eastern part of the Clarion-Clipperton Fracture Zone. Front. Mar. Sci. 4:103. doi: 10.3389/fmars.2017.00103
Desbruyères, D., and Hourdez, S. (2000). A new species of scale-worm (Polychaeta: Polynoidae), Lepidonotopodium atalantae sp nov., from the East Pacific Rise at 13°N and 9°50’N. Cah. Biol. Mar. 41, 47–54.
Dray, S., Bauman, D., Blanchet, G., Borcard, D., Clappe, S., Guenard, G., et al. (2020). adespatial: Multivariate Multiscale Spatial Analysis. Available online at: https://CRAN.R-project.org/package=adespatial (accessed April 07, 2021).
Dray, S., and Dufour, A.-B. (2007). The ade4 Package: Implementing the Duality Diagram for Ecologists. J. Stat. Soft. 22:04. doi: 10.18637/jss.v022.i04
Edgar, R. C. (2004). MUSCLE: multiple sequence alignment with high accuracy and high throughput. Nucleic Acids Res. 32, 1792–1797. doi: 10.1093/nar/gkh340
Faith, D. P. (1992). Conservation evaluation and phylogenetic diversity. Biol. Conserv. 61, 1–10. doi: 10.1016/0006-3207(92)91201-3
Folmer, O., Black, M., Hoeh, W., Lutz, R., and Vrijenhoek, R. (1994). DNA primers for amplification of mitochondrial cytochrome c oxidase subunit I from diverse metazoan invertebrates. Mol. Mar. Biol. Biotechnol. 3, 294–299.
Gallagher, E. (1999). Compah Documentation. Available online at: http://citeseerx.ist.psu.edu/viewdoc/download?doi=10.1.1.9.1334&rep=rep1&type=pdf (accessed June 18, 2021).
Gambi, M., Patti, F., Micaletto, G., and Giangrande, A. (2001). Diversity of reproductive features in some Antarctic polynoid and sabellid polychaetes, with a description of Demonax polarsterni sp. n. (Polychaeta, Sabellidae). Polar Biol. 24, 883–891. doi: 10.1007/s003000100287
Giangrande, A. (1997). Polychaete reproductive patterns, life cycles and life histories: an overview. Oceanogr. Mar. Biol. 35, 323–386.
Glover, A., Dahlgren, T., Taboada, S., Paterson, G., Wiklund, H., Waeschenbach, A., et al. (2016). The london workshop on the biogeography and connectivity of the clarion-clipperton zone. RIO 2:e10528. doi: 10.3897/rio.2.e10528
Glover, A., Smith, C., Paterson, G., Wilson, G., Hawkins, L., and Sheader, M. (2002). Polychaete species diversity in the central Pacific abyss: local and regional patterns, and relationships with productivity. Mar. Ecol. Prog. Ser. 240, 157–170. doi: 10.3354/meps240157
Glover, A. G., Goetze, E., Dahlgren, T. G., and Smith, C. R. (2005). Morphology, reproductive biology and genetic structure of the whale-fall and hydrothermal vent specialist, Bathykurila guaymasensis Pettibone, 1989 (Annelida: Polynoidae). Mar. Ecol. 26, 223–234. doi: 10.1111/j.1439-0485.2005.00060.x
Glover, A. G., and Smith, C. R. (2003). The deep-sea floor ecosystem: current status and prospects of anthropogenic change by the year 2025. Environ. Conserv. 30, 219–241. doi: 10.1017/S0376892903000225
Gonzalez, B. C., Worsaae, K., Fontaneto, D., and Martínez, A. (2018). Anophthalmia and elongation of body appendages in cave scale worms (Annelida: Aphroditiformia). Zool. Scr. 47, 106–121. doi: 10.1111/zsc.12258
Gotelli, N. J., and Colwell, R. K. (2001). Quantifying biodiversity: procedures and pitfalls in the measurement and comparison of species richness. Ecol. Lett. 4, 379–391. doi: 10.1046/j.1461-0248.2001.00230.x
Gower, J. C. (1966). Some distance properties of latent root and vector methods used in multivariate analysis. Biometrika 53:325. doi: 10.2307/2333639
Greinert, J. (2016). Swath sonar multibeam EM122 bathymetry during SONNE cruise SO239 with links to raw data files. Pangaea 2016:859456. doi: 10.1594/PANGAEA.859456
Guggolz, T., Lins, L., Meißner, K., and Brandt, A. (2018). Biodiversity and distribution of polynoid and spionid polychaetes (Annelida) in the vema fracture zone, tropical north atlantic. Deep Sea Res. Part II Top. Stud. Oceanogr. 148, 54–63. doi: 10.1016/j.dsr2.2017.07.013
Hall, C. E., and Gurnis, M. (2005). Strength of fracture zones from their bathymetric and gravitational evolution. J. Geophys. Res. 110:B01402. doi: 10.1029/2004JB003312
Hartman-Schröder, G. (1971). “Teil 58. Annelida, Borstenwürmer, Polychaeta,” in Die Tierwelt Deutschlands und der angrenzenden Meeresteile nach ihren Merkmalen und nach ihrer Lebensweise, eds M. Dahl and F. Peus (Stuttgart: Gustav Fischer Verlag Jena), 1–594.
Hatch, A. S., Liew, H., Hourdez, S., and Rouse, G. W. (2020). Hungry scale worms: Phylogenetics of Peinaleopolynoe (Polynoidae, Annelida), with four new species. Zookeys 932, 27–74. doi: 10.3897/zookeys.932.48532
Hauquier, F., Macheriotou, L., Bezerra, T. N., Egho, G., Martínez Arbizu, P., and Vanreusel, A. (2019). Distribution of free-living marine nematodes in the Clarion–Clipperton Zone: implications for future deep-sea mining scenarios. Biogeosciences 16, 3475–3489. doi: 10.5194/bg-16-3475-2019
Hauquier, F., Macheriotou, L., Vanreusel, A., Janssen, F., and Boetius, A. (2017). Sedimentary parameters from multicorer and ROV pushcore samples during SONNE cruise SO239. Mariene Biologie, Universiteit Gent. Pangaea 2017:873272. doi: 10.1594/PANGAEA.873274
Hebert, P. D. N., Cywinska, A., Ball, S. L., and deWaard, J. R. (2003a). Biological identifications through DNA barcodes. Proc. R. Soc. Lond. B 270, 313–321. doi: 10.1098/rspb.2002.2218
Hebert, P. D. N., Ratnasingham, S., and de Waard, J. R. (2003b). Barcoding animal life: cytochrome c oxidase subunit 1 divergences among closely related species. Proc. R. Soc. Lond. B 270:25. doi: 10.1098/rsbl.2003.0025
Hecker, B., and Paul, A. Z. (1979). “Abyssal Community Structure of the Benthic Infauna of the Eastern Equatorial Pacific: DOMES Sites A, B, and C,” in Marine Geology and Oceanography of the Pacific Manganese Nodule Province, eds J. L. Bischoff and D. Z. Piper (Boston, MA: Springer), 287–308. doi: 10.1007/978-1-4684-3518-4_8
Hein, J. R., and Petersen, S. (2013). “The geology of Manganese nodules,” in Deep Sea Minerals: Manganese Nodules, a Physical, Biological, Environmental and Technical Review, eds Y. Beaudoin and E. Baker (Nouméa: Secretariat of the Pacific Community).
Hessler, R. R., and Jumars, P. A. (1974). Abyssal community analysis from replicate box cores in the central North Pacific. Deep- Sea Res. Oceanogr. Abstr. 21, 185–209. doi: 10.1016/0011-7471(74)90058-8
Hsieh, T. C., and Chao, A. (2017). Rarefaction and extrapolation: making fair comparison of abundance-sensitive phylogenetic diversity among multiple assemblages. Syst. Biol. 66, 100–111. doi: 10.1093/sysbio/syw073
Hurlbert, S. H. (1971). The nonconcept of species diversity: a critique and alternative parameters. Ecology 52, 577–586. doi: 10.2307/1934145
Hutchings, P. (1998). Biodiversity and functioning of polychaetes in benthic sediments. Biodivers. Conserv. 7, 1133–1145. doi: 10.1023/A:1008871430178
International Seabed Authority. (2021). Minerals: Polymetallic Nodules. Available online at: https://www.isa.org.jm/exploration-contracts/polymetallic-nodules (accessed June 18, 2021).
International Seabed Authority (2020). ISBA/25/LTC/6/Rev.1: Recommendations for the Guidance of Contractors for the Assessment of the Possible Environmental Impacts Arising From Exploration for Marine Minerals in the Area. Kingston: International Seabed Authority.
Jamieson, A. (2015). The Hadal Zone: Life in the Deepest Oceans. Cambridge, MA: Cambridge University Press, doi: 10.1017/CBO9781139061384
Janssen, A., Kaiser, S., Meißner, K., Brenke, N., Menot, L., and Martínez Arbizu, P. (2015). A reverse taxonomic approach to assess macrofaunal distribution patterns in abyssal pacific polymetallic nodule fields. PLoS ONE 10:e0117790. doi: 10.1371/journal.pone.0117790
Janssen, A., Stuckas, H., Vink, A., and Arbizu, P. M. (2019). Biogeography and population structure of predominant macrofaunal taxa (Annelida and Isopoda) in abyssal polymetallic nodule fields: implications for conservation and management. Mar. Biodivers. 49, 2641–2658. doi: 10.1007/s12526-019-00997-1
Jimi, N., Fujiwara, Y., and Kajihara, H. (2018). New annelid species from the deepest known whale-fall environment: Bathykermadeca thanatos sp. nov. (Annelida: Polynoidae). Zootaxa 4450:575. doi: 10.11646/zootaxa.4450.5.4
Johnston, G. (1833). Illustration in British Zoology. Mag. Nat. Hist. J. Zool. Bot. Mineral. Geol. Meteorol. 34, 320–324.
Katoh, K., Misawa, K., Kuma, K., and Miyata, T. (2002). MAFFT: a novel method for rapid multiple sequence alignment based on fast Fourier transform. Nucleic Acids Res. 30, 3059–3066. doi: 10.1093/nar/gkf436
Kembel, S. W., Cowan, P. D., Helmus, M. R., Cornwell, W. K., Morlon, H., Ackerly, D. D., et al. (2010). Picante: R tools for integrating phylogenies and ecology. Bioinformatics 26, 1463–1464. doi: 10.1093/bioinformatics/btq166
Kindt, R., and Coe, R. (2005). Tree Diversity Analysis. A Manual and Software for Common Statistical Methods for Ecological and Biodiversity Studies. Nairobi: World Agroforestry Centre (ICRAF).
Kinberg, J. G. H. (1856). Nya slägten och arter af Annelider. Öfversigt af kongl. Vetensk. Akadem. Förhhand. 12, 381–388.
Kirkegaard, J. B. (1956). Benthic Polychaeta from depths exceeding 6000 meters. Galathea Rep. 2, 63–78.
Knox, G. (1959). Pelagic and benthic polychaetes of the central Arctic Basin. Geophys. Res. Pap. 63, 105–114.
Kolbasova, G., Kosobokova, K., and Neretina, T. (2020). Bathy- and mesopelagic Annelida from the Arctic Ocean: description of new, redescription of known and notes on some “cosmopolitan” species. Deep Sea Res. Part 1 Oceanogr. Res. Pap. 165:103327. doi: 10.1016/j.dsr.2020.103327
Legendre, P., and Gallagher, E. D. (2001). Ecologically meaningful transformations for ordination of species data. Oecologia 129, 271–280. doi: 10.1007/s004420100716
Levenstein, R. Y. (1971). A new polychaete species of the genus Macellicephaloides from the Aleutian Trench. J. Fish Res. Board Can. 28, 1429–1431. doi: 10.1139/f71-220
Levenstein, R. Y. (1984). On the ways of the formation of the deep-sea polychaete fauna of the family Polynoidae. Proc. First Int. Polychaete Conf. 1984, 72–85.
Lindgren, J., Hatch, A. S., Hourdez, S., Seid, C. A., and Rouse, G. W. (2019). Phylogeny and biogeography of Branchipolynoe (Polynoidae, Phyllodocida, Aciculata, Annelida), with descriptions of five new species from methane seeps and hydrothermal vents. Diversity 11:153. doi: 10.3390/d11090153
Lins, L., da Silva, M. C., Neres, P., Esteves, A. M., and Vanreusel, A. (2018). Testing deep-sea biodiversity paradigms on abyssal nematode genera and Acantholaimus species. Deep Sea Res. Part II Top. Stud. Oceanogr. 148, 208–222. doi: 10.1016/j.dsr2.2016.12.005
Lodge, M., Johnson, D., Le Gurun, G., Wengler, M., Weaver, P., and Gunn, V. (2014). Seabed mining: international seabed authority environmental management plan for the clarion–clipperton zone. A partnership approach. Mar. Policy 49, 66–72. doi: 10.1016/j.marpol.2014.04.006
Lozupone, C., Hamady, M., and Knight, R. (2006). UniFrac – An online tool for comparing microbial community diversity in a phylogenetic context. BMC Bioinforma. 7:371. doi: 10.1186/1471-2105-7-371
Malmgren, A. J. (1866). Nordiska hafs-annulater. Öfversigt af kÃűniglich vetenskapsakademiens förhandlingar. Stockholm 22, 355–410.
Martínez Arbizu, P., and Haeckel, M. (2015). RV SONNE Fahrtbericht/cruise report SO239: EcoResponse assessing the ecology, connectivity and resilience of polymetallic nodule field systems, balboa (Panama) - Manzanillo (Mexico). Geomar. Rep. 25:204. doi: 10.3289/GEOMAR_REP_NS_25_2015
McQuaid, K. A., Attrill, M. J., Clark, M. R., Cobley, A., Glover, A. G., Smith, C. R., et al. (2020). Using habitat classification to assess representativity of a protected area network in a large, data-poor area targeted for deep-sea mining. Front. Mar. Sci. 7:558860. doi: 10.3389/fmars.2020.558860
Medlin, L., Elwood, H. J., Stickel, S., and Sogin, M. L. (1988). The characterization of enzymatically amplified eukaryotic 16S-like rRNA-coding regions. Gene 71, 491–499. doi: 10.1016/0378-1119(88)90066-2
Menot, L. (2019). ness: hypergeometric standardization and probabilistic measures of similarity for community ecology. Zenodo 2019:3254750. doi: 10.5281/ZENODO.3254750
Menzel, L., George, K. H., and Arbizu, P. M. (2011). Submarine ridges do not prevent large-scale dispersal of abyssal fauna: a case study of Mesocletodes (Crustacea, Copepoda, Harpacticoida). Deep Sea Res. Part 1 Oceanogr. Res. Pap. 58, 839–864. doi: 10.1016/j.dsr.2011.05.008
Miller, M. A., Pfeiffer, W., and Schwartz, T. (2010). Creating the CIPRES Science Gateway for Inference of Large Phylogenetic Trees. in 2010 Gateway Computing Environments Workshop (GCE). New Orleans, LA: IEEE, 1–8. doi: 10.1109/GCE.2010.5676129
Morgan, C. L. (2000). “Resource Estimates of the Clarion-Clipperton Manganese Nodule Deposits,” in Handbook of Marine Mineral Deposits, ed. D. S. Cronan (Milton Park: Routledge), 145–170. doi: 10.1201/9780203752760
Neal, L., Brasier, M. J., and Wiklund, H. (2018a). Six new species of Macellicephala (Annelida: Polynoidae) from the Southern Ocean and south Atlantic with re-description of type species. Zootaxa 4455:1. doi: 10.11646/zootaxa.4455.1.1
Neal, L., Linse, K., Brasier, M. J., Sherlock, E., and Glover, A. G. (2018b). Comparative marine biodiversity and depth zonation in the Southern Ocean: evidence from a new large polychaete dataset from Scotia and Amundsen seas. Mar. Biodiv. 48, 581–601. doi: 10.1007/s12526-017-0735-y
Nygren, A., and Sundberg, P. (2003). Phylogeny and evolution of reproductive modes in Autolytinae (Syllidae, Annelida). Mol. Phylogenet. Evol. 29, 235–249. doi: 10.1016/S1055-7903(03)00095-2
OBIS (2020). Ocean Biodiversity Information System. Intergovernmental Oceanographic Commission of UNESCO. Available online at https://www.obis.org (accessed June 18, 2021).
Oebius, H. U., Becker, H. J., Rolinski, S., and Jankowski, J. A. (2001). Parametrization and evaluation of marine environmental impacts produced by deep-sea manganese nodule mining. Deep Sea Res. Part II Top. Stud. Oceanogr. 48, 3453–3467. doi: 10.1016/S0967-0645(01)00052-2
O’Hara, R. B. (2005). Species richness estimators: how many species can dance on the head of a pin? J. Anim. Ecol. 74, 375–386. doi: 10.1111/j.1365-2656.2005.00940.x
Oksanen, J., Blanchet, F. G., Friendly, M., Kindt, R., Legendre, P., McGlinn, D., et al. (2016). vegan: Community Ecology Package. R package version 2.4-3. Vienna: R Foundation for Statistical Computing.
Örsted, A. S. (1845). Fortegnelse over Dyr, samlede i Christianiafjord ved Drobak fra 21–24 Juli, 1844. Naturhistorisk Tidsskrift, Köbenhavn Ser. 2, 400–427.
Pagès, H., Aboyoun, P., Gentleman, R., and DebRoy, S. (2017). Biostrings: Efficient manipulation of biological strings. Bioconductor 2017:18129. doi: 10.18129/B9.BIOC.BIOSTRINGS
Palumbi, S. R. (1996). “The polymerase chain reaction,” in Molecular Systematics, eds D. M. Hillis, C. Moritz, and B. K. Mable (Sunderland, MA: Sinauer Associates), 205–247.
Paradis, E. (2010). Pegas: an R package for population genetics with an integrated-modular approach. Bioinformatics 26, 419–420. doi: 10.1093/bioinformatics/btp696
Paradis, E., and Schliep, K. (2019). Ape 5.0: an environment for modern phylogenetics and evolutionary analyses in R. Bioinformatics 35, 526–528. doi: 10.1093/bioinformatics/bty633
Patel, T., Robert, H., D’Udekem, D., Acoz, C., Martens, K., De Mesel, I., et al. (2020). Biogeography and community structure of abyssal scavenging Amphipoda (Crustacea) in the Pacific Ocean. Biogeosciences 17, 2731–2744. doi: 10.5194/bg-17-2731-2020
Paterson, G. L. J., Glover, A. G., Barrio Froján, C. R. S., Whitaker, A., Budaeva, N., Chimonides, J., et al. (2009). A census of abyssal polychaetes. Deep Sea Res. Part II Top. Stud. Oceanogr. 56, 1739–1746. doi: 10.1016/j.dsr2.2009.05.018
Pennell, M. W., Eastman, J. M., Slater, G. J., Brown, J. W., Uyeda, J. C., FitzJohn, R. G., et al. (2014). Geiger v2.0: an expanded suite of methods for fitting macroevolutionary models to phylogenetic trees. Bioinformatics 30, 2216–2218. doi: 10.1093/bioinformatics/btu181
Pettibone, M. H. (1976). Revision of the genus macellicephala mcintosh and the subfamily macellicephalinae hartmann-schröder (polychaeta: polynoidae). Smithson. Contr. Zool. 229, 1–71. doi: 10.5479/si.00810282.229
Pettibone, M. H. (1983). A new scale worm (Polychaeta: Polynoidae) from the hydrothermal rift-area off western Mexico at 21°N. Proc. Biol. Soc. Wash. 96, 392–399.
Pettibone, M. H. (1985a). New genera and species of deep sea macellicephalinae and harmothoinae galapagos and western mexico at 21°n and from the santa catalina channel. Proc. Biol. Soc. Wash. 98, 740–757.
Pettibone, M. H. (1985b). Polychaete worms from a cave in the Bahamas and from experimental wood panels in deep water of the North Atlantic (Polynoidae, Macellicephalinae, Harmothoinae). Proc. Biol. Soc. Wash. 98, 127–149.
Pettibone, M. H. (1993). Revision of some species referred to Antinoe, Antinoella, Antinoana, Bylgides, and Harmothoe (Polychaeta: Polynoidae: Harmothoinae). Smithson. Contr. Zool. 545, 1–41. doi: 10.5479/si.00810282.545
Pettibone, M. (1997). Revision of the scaleworm genus Eulagisca McIntosh (Polychaeta: Polynoidae) with the erection of the subfamily Eulagiscinae and the new genus Paraeulagisca. Proc. Biol. Soc. Wash. 110, 537–551.
R Core Team. (2020). R: A Language and Environment for Statistical Computing. Vienna: R Foundation for Statistical Computing.
Rambaut, A., Drummond, A. J., Xie, D., Baele, G., and Suchard, M. A. (2018). Posterior summarization in bayesian phylogenetics using Tracer 1.7. Syst. Biol. 67, 901–904. doi: 10.1093/sysbio/syy032
Ratnasingham, S., and Hebert, P. D. N. (2007). BARCODING: bold: The Barcode of Life Data System: barcoding. Mol. Ecol. Notes 7, 355–364. doi: 10.1111/j.1471-8286.2007.01678.x
Read, G. B., and Fauchald, K. (2021). World Polychaeta database. Polynoidae Kinberg, 1856. Available online at: http://www.marinespecies.org/aphia.php?p=taxdetails&id=939 (accessed June 05, 2021).
Ronquist, F., Teslenko, M., van der Mark, P., Ayres, D. L., Darling, A., Höhna, S., et al. (2012). MrBayes 3.2: Efficient Bayesian phylogenetic inference and model choice across a large model space. Syst. Biol. 61, 539–542. doi: 10.1093/sysbio/sys029
Rybakova, E., Kremenetskaia, A., Vedenin, A., Boetius, A., and Gebruk, A. (2019). Deep-sea megabenthos communities of the Eurasian Central Arctic are influenced by ice-cover and sea-ice algal falls. PLoS One 14:e0211009. doi: 10.1371/journal.pone.0211009
Schüller, M., Ebbe, B., and Wägele, J.-W. (2009). Community structure and diversity of polychaetes (Annelida) in the deep Weddell Sea (Southern Ocean) and adjacent basins. Mar. Biodiv. 39, 95–108. doi: 10.1007/s12526-009-0009-4
Simon-Lledó, E., Bett, B. J., Huvenne, V. A. I., Schoening, T., Benoist, N. M. A., Jeffreys, R. M., et al. (2019). Megafaunal variation in the abyssal landscape of the Clarion Clipperton Zone. Prog. Oceanogr. 170, 119–133. doi: 10.1016/j.pocean.2018.11.003
Simon-Lledó, E., Pomee, C., Ahokava, A., Drazen, J. C., Leitner, A. B., Flynn, A., et al. (2020). Multi-scale variations in invertebrate and fish megafauna in the mid-eastern Clarion Clipperton Zone. Prog. Oceanogr. 187:102405. doi: 10.1016/j.pocean.2020.102405
Sjölin, E., Erséus, C., and Källersjö, M. (2005). Phylogeny of Tubificidae (Annelida, Clitellata) based on mitochondrial and nuclear sequence data. Mol. Phylogenet. Evol. 35, 431–441. doi: 10.1016/j.ympev.2004.12.018
Smith, C., Deleo, F., Bernardino, A., Sweetman, A., and Arbizu, P. (2008). Abyssal food limitation, ecosystem structure and climate change. Trends Ecol. Evol. 23, 518–528. doi: 10.1016/j.tree.2008.05.002
Smith, C. R., and Hamilton, S. C. (1983). Epibenthic megafauna of a bathyal basin off southern California: patterns of abundance, biomass, and dispersion. Deep Sea Res. Part A Oceanogr. Res. Pap. 30, 907–928. doi: 10.1016/0198-0149(83)90048-1
Stamatakis, A. (2014). RAxML version 8: a tool for phylogenetic analysis and post-analysis of large phylogenies. Bioinformatics 30, 1312–1313. doi: 10.1093/bioinformatics/btu033
Trueblood, D. D., Gallagher, E. D., and Gould, D. M. (1994). Three stages of seasonal succession on the Savin Hill Cove mudflat, Boston Harbor. Limnol. Oceanogr. 39, 1440–1454. doi: 10.4319/lo.1994.39.6.1440
Trueman, E. R., Brand, A. R., and Davis, P. (1966). The effect of substrate and shell shape on the burrowing of some common bivalves. J. Molluscan Stud. 37, 97–109. doi: 10.1093/oxfordjournals.mollus.a064983
Tyler, P. A., and Young, C. M. (1999). Reproduction and dispersal at vents and cold seeps. J. Mar. Biol. Ass. 79, 193–208. doi: 10.1017/S0025315499000235
Uschakov, P. V. (1977). “Phylogenetic relationship in the family Polynoidae (Polychaeta),” in Essays on the Polychaetous Annelids in Memory of Dr. Olga Hartman, eds D. Reish and K. Fauchald (Los Angeles: Allan Hancock Foundation), 29–38.
Uschakov, P. V. (1982). Fauna of the USSR. (2)1: Polychaetes. Polychaetes of the suborder Aphroditiformia of the Arctic Ocean and the Northwestern Part of the Pacific Ocean. Families Aphroditidae and Polynoidae. Moscow: NAUKA, Academy of Sciences of the USSR, Zoological Institute.
Vaidya, G., Lohman, D. J., and Meier, R. (2011). SequenceMatrix: concatenation software for the fast assembly of multi-gene datasets with character set and codon information. Cladistics 27, 171–180. doi: 10.1111/j.1096-0031.2010.00329.x
Vavrek, M. (2011). fossil: palaeoecological and palaeogeographical analysis tools. Palaeontol. Electron. 14:2011.
Volkmann, S. E., Kuhn, T., and Lehnen, F. (2018). A comprehensive approach for a techno-economic assessment of nodule mining in the deep sea. Miner. Econ. 31, 319–336. doi: 10.1007/s13563-018-0143-1
Volkmann, S. E., and Lehnen, F. (2018). Production key figures for planning the mining of manganese nodules. Mar. Georesour. Geotechnol. 36, 360–375. doi: 10.1080/1064119X.2017.1319448
Volz, J. B., Mogollón, J. M., Geibert, W., Arbizu, P. M., Koschinsky, A., and Kasten, S. (2018a). Natural spatial variability of depositional conditions, biogeochemical processes and element fluxes in sediments of the eastern Clarion-Clipperton Zone, Pacific Ocean. Deep Sea Res. Part A Oceanogr. Res. Pap. 140, 159–172. doi: 10.1016/j.dsr.2018.08.006
Volz, J. B., Mogollón, J. M., Geibert, W., Martinez Arbizu, P., Koschinsky, A., and Kasten, S. (2018b). Total organic carbon contents of sediment cores retrieved during R/V SONNE cruise SO239 in the BGR area. Pangaea 2018:894854. doi: 10.1594/PANGAEA.894854
Volz, J. B., Mogollón, J. M., Geibert, W., Martinez Arbizu, P., Koschinsky, A., and Kasten, S. (2018c). Total organic carbon contents of sediment cores retrieved during R/V SONNE cruise SO239 in the IOM area. Pangaea 2018:894858. doi: 10.1594/PANGAEA.894858
Volz, J. B., Mogollón, J. M., Geibert, W., Martinez Arbizu, P., Koschinsky, A., and Kasten, S. (2018d). Total organic carbon contents of sediment cores retrieved during R/V SONNE cruise SO239 in the GSR area. Pangaea 2018:894855. doi: 10.1594/PANGAEA.894855
Volz, J. B., Mogollón, J. M., Geibert, W., Martinez Arbizu, P., Koschinsky, A., and Kasten, S. (2018e). Total organic carbon contents of sediment cores retrieved during R/V SONNE cruise SO239 in the IFREMER-1 area. Pangaea 2018:894856. doi: 10.1594/PANGAEA.894856
Volz, J. B., Mogollón, J. M., Geibert, W., Martinez Arbizu, P., Koschinsky, A., and Kasten, S. (2018f). Total organic carbon contents of sediment cores retrieved during R/V SONNE cruise SO239 in the IFREMER-2 area. Pangaea 2018:894857. doi: 10.1594/PANGAEA.894857
Volz, J. B., Mogollón, J. M., Geibert, W., Martinez Arbizu, P., Koschinsky, A., and Kasten, S. (2018g). Total organic carbon contents of sediment cores retrieved during R/V SONNE cruise SO239 in the APEI3 area. Pangaea 2018:894795. doi: 10.1594/PANGAEA.894795
Wang, L.-G., Lam, T. T.-Y., Xu, S., Dai, Z., Zhou, L., Feng, T., et al. (2020). Treeio: an r package for phylogenetic tree input and output with richly annotated and associated data. Mol. Biol. Evol. 37, 599–603. doi: 10.1093/molbev/msz240
Washburn, T. W., Menot, L., Bonifácio, P., Pape, E., Błażewicz, M., Bribiesca-Contreras, G., et al. (2021). Patterns of macrofaunal biodiversity across the clarion-clipperton zone: an area targeted for seabed mining. Front. Mar. Sci. 8:250. doi: 10.3389/fmars.2021.626571
Wedding, L. M., Friedlander, A. M., Kittinger, J. N., Watling, L., Gaines, S. D., Bennett, M., et al. (2013). From principles to practice: a spatial approach to systematic conservation planning in the deep sea. Proc. R. Soc. B. 280:20131684. doi: 10.1098/rspb.2013.1684
Wickham, H. (2007). Reshaping Data with the reshape Package. J. Stat. Soft. 21:12. doi: 10.18637/jss.v021.i12
Wickham, H., François, R., Henri, L., and Müller, K. (2020). dplyr: A Grammar of Data Manipulation. Available online at: https://CRAN.R-project.org/package=dplyr (accessed June 18, 2021).
Wilson, G. D. F. (2017). Macrofauna abundance, species diversity and turnover at three sites in the Clipperton-Clarion Fracture Zone. Mar. Biodiv. 47, 323–347. doi: 10.1007/s12526-016-0609-8
Wu, X., Zhan, Z., and Xu, K. (2019). Two new and two rarely known species of Branchinotogluma (Annelida: Polynoidae) from deep-sea hydrothermal vents of the Manus Back-Arc basin, with remarks on the diversity and biogeography of vent polynoids. Deep Sea Res. Part 1 Oceanogr. Res. Pap. 149:103051. doi: 10.1016/j.dsr.2019.05.011
Yu, G., Smith, D. K., Zhu, H., Guan, Y., and Lam, T. T. (2017). Ggtree: an r package for visualization and annotation of phylogenetic trees with their covariates and other associated data. Methods Ecol. Evol. 8, 28–36. doi: 10.1111/2041-210X.12628
Zhang, Y., Chen, C., and Qiu, J.-W. (2018). Sexually dimorphic scale worms (annelida: polynoidae) from hydrothermal vents in the okinawa trough: two new species and two new sex morphs. Front. Mar. Sci. 5:112. doi: 10.3389/fmars.2018.00112
Keywords: diversity and distribution, Clarion-Clipperton Fracture Zone, nodule province, scale-worms, Polychaeta, diversification
Citation: Bonifácio P, Neal L and Menot L (2021) Diversity of Deep-Sea Scale-Worms (Annelida, Polynoidae) in the Clarion-Clipperton Fracture Zone. Front. Mar. Sci. 8:656899. doi: 10.3389/fmars.2021.656899
Received: 21 January 2021; Accepted: 19 July 2021;
Published: 25 August 2021.
Edited by:
Erica Goetze, University of Hawai‘i at Mânoa, United StatesReviewed by:
Gustavo Fonseca, Federal University of São Paulo, BrazilPat Hutchings, Australian Museum, Australia
Copyright © 2021 Bonifácio, Neal and Menot. This is an open-access article distributed under the terms of the Creative Commons Attribution License (CC BY). The use, distribution or reproduction in other forums is permitted, provided the original author(s) and the copyright owner(s) are credited and that the original publication in this journal is cited, in accordance with accepted academic practice. No use, distribution or reproduction is permitted which does not comply with these terms.
*Correspondence: Paulo Bonifácio, bonif@me.com