Combining Imaging Flow Cytometry and Molecular Biological Methods to Reveal Presence of Potentially Toxic Algae at the Ural River in Kazakhstan
 Yersultan Mirasbekov1†
  Aigerim Abdimanova1†
  Kuanysh Sarkytbayev1†
  Kanat Samarkhanov1,2
  Aidyn Abilkas1,3 Daria Potashnikova4 Galina Arbuz1 Zhanpeis Issayev5
  Ivan A. Vorobjev1,3 Dmitry V. Malashenkov6*
  Natasha S. Barteneva1,3,7*
- 1Department of Biology, School of Sciences and Humanities, Nazarbayev University, Nur-Sultan, Kazakhstan
- 2Xinjiang Institute of Ecology and Geography, University of Chinese Academy of Sciences, Beijing, China
- 3Laboratory of Biophotonics and Imaging, National Laboratory Astana, Nazarbayev University, Nur-Sultan, Kazakhstan
- 4Department of Cell Biology and Histology, Lomonosov Moscow State University, Moscow, Russia
- 5Core Facilities, Nazarbayev University, Nur-Sultan, Kazakhstan
- 6Department of General Ecology and Hydrobiology, Lomonosov Moscow State University, Moscow, Russia
- 7The Environmental Research and Efficiency Cluster (EREC), Nazarbayev University, Nur-Sultan, Kazakhstan
Algal blooms occur in freshwater bodies throughout the world, often leading to fish kills. Cases of these kills along the Ural River were reported in 2018–2019, involving significant amount of sturgeon in fish farming areas. In this study, the analysis of algal samples from the delta of the Ural River up to 100 km inland was carried out from August to December 2019 using imaging flow cytometry (IFC), molecular biological, and microscopic techniques. We identified the filamentous cyanobacteria Cuspidothrix issatschenkoi, Dolichospermum cf. flos-aquae, Dolichospermum cf. macrosporum, Pseudanabaena limnetica, and Planktothrix spp. as the dominant potentially toxic phytoplankton species, and we also found minor quantities of Cylindrospermopsis raciborskii. For the first time, molecular phylogenetic investigations of field clones of cyanobacteria from Ural River were carried out to establish the taxa of the dominant species and to identify the presence of genes encoding toxins. The complementary analysis with nanopore-based next-generation sequencing overlapped with the results of IFC and was instrumental in revealing minor cyanobacteria taxa. Real-time PCR analysis and sequencing indicated the presence of Microcystis and ADA-clade spp. as well as genes associated with the production of microcystin (mcyE) and the algal neurotoxin saxitoxin (sxtA) originating from cyanobacteria. These findings suggest that toxin-producing cyanobacteria could become a threat in the Ural River near Atyrau, which can significantly affect aquaculture in the region.
Introduction
The incidence and intensity of harmful algal blooms (HABs) as well as the associated economic impact have increased worldwide with warming water temperatures in recent years (Paerl and Paul, 2012; Jeppesen et al., 2017; Griffith and Gobler, 2020; Wells et al., 2020; Fernandes-Salvador et al., 2021). HABs are complex events typically caused by multiple factors occurring simultaneously, may threaten ecosystems, and lead to the degradation of water quality for recreation, drinking, and aquaculture (Heisler et al., 2008; Oliver et al., 2012; Jeppesen et al., 2017) with further changes in temperature, nutrient load, and oxygenation of aquatic environments. The toxin production by certain cyanobacteria (e.g., Dolichospermum circinalis, Cylindrospermopsis raciborskii, and Microcystis aeruginosa) during algal blooms causes the accumulation of toxins in the tissues of fresh- and saltwater mussels, fish, and mammals (Rapala et al., 1997; Codd et al., 2005; Wilson et al., 2005; Carmichael, 2008; Mihali et al., 2009; Oliver et al., 2012; De Pace et al., 2014; Gibble et al., 2016; Li et al., 2016; Luerling et al., 2017; Meriluoto et al., 2017; Chernova et al., 2019). The harmful effects can be caused by either direct effects from toxins or changes in the water chemistry, such as oxygen depletion or hydrogen sulfide production (Eriksson et al., 1986; Tornazo et al., 1990). Together with nutrients, the temperature is considered an essential factor in the growth, metabolism of cyanobacteria (Reynolds, 2008), and the adaptation of invasive potentially toxic cyanobacterial species, particularly Cylindrospermopsis (=Raphidiopsis) raciborskii (Padisák, 1997; Thomas and Litchman, 2016). In the last decade, the increasing contamination of freshwater bodies by anthropogenic pollution, as well as the upward temperature gradient have had major effects on further expansion of cyanobacteria in freshwater bodies (Sukenik et al., 2015). Although most studies are focused on the seasonal algal blooms in summer and spring seasons, cold weather and winter cyanobacterial blooms have been documented throughout the literature (Naselli-Flores et al., 2007; Babanazarova et al., 2013; Wejnerowski et al., 2018). Water temperature directly affects rates of respiration, photosynthesis, and algal growth in aquatic ecosystems (Regier et al., 1990). The link between temperature and toxin production by cyanobacteria remains elusive and is governed by the complex interaction among all environmental factors.
Importantly, improving the ability to monitor and detect HABs and cyanobacterial toxins are required for better documentation and understanding of algal blooms and the prevention of their effects on fisheries and farmed aquaculture (Shumway, 1990; Pearl and Tucker, 1995; GEOHAB, 2001; Ramsdell et al., 2005; Anderson et al., 2012). Strong species-specific interactions between the environment and phytoplankton communities make HAB predictions difficult (Griffith and Gobler, 2020). Monitoring programs for HABs were developed initially for marine HABs and generally relied on the microscopic identification and manual time-consuming counting of phytoplankton (Anderson et al., 2012). The inability of conventional flow cytometry to determine species composition is one of the major reasons why flow cytometry could not be adopted as a standard tool for monitoring harmful algae (Rutten et al., 2005). In the HAB monitoring and research, there are several different approaches to identify causative species and relevant toxins, including the development of nucleic-based biosensors in microarray and real-time polymerase-chain reaction (PCR) formats (Dierks-Horn et al., 2011; rev. McPartlin et al., 2017), imaging flow cytometry (IFC) (Buskey and Hyatt, 2006; Campbell et al., 2010, 2013), and satellite analysis-based algorithms. The FlowCAM (Yokogawa Fluid Imaging Technologies, United States) is an imaging flow cytometer designed to characterize microplankton size range particles (Sieracki et al., 1998) and used by different research groups for semi-automated monitoring of algal blooms (Buskey and Hyatt, 2006; Lehman et al., 2013; Dashkova et al., 2017). FlowCAM software have been allowed to discriminate and quantitate different potentially toxic algae within complex natural assemblages, including Microcystis colonies (Buskey and Hyatt, 2006; Lehman et al., 2013, 2017; Sukenik et al., 2015; Graham et al., 2018; Kurobe et al., 2018; Mirasbekov et al., 2021).
In common HAB monitoring strategies, the number of field samples required to be analyzed by light microscopy for taxonomical species identification dramatically reduces the possibilities of early detection of HAB initiation and dispersion phases (Antonella and Luca, 2013). In addition, the optical-based methods of identifying toxic cyanobacteria (light microscopy or IFC) do not differentiate toxin-producing from non-toxin-producing species. By taking in the account these limitations of traditional imaging approaches (microscopy and cytometry) in monitoring programs, molecular methods have been implemented for detection of pre-bloom algal abundances. That includes many real-time PCR protocols to monitor toxic cyanobacteria (rev. Martins and Vasconcelos, 2011). Identifying and quantifying of the potentially toxic species present may not suffice to estimate the potential toxic risk, because not all of the strains may produce toxins. Screening based on molecular targeting is more precise and sensitive with advantage of distinguishing non-toxic and toxic strains (Pearson and Neilan, 2008). Within most important cyanotoxins, PCR-based methods were used to identify toxic genotypes of cyanobacteria-producing microcystins, cylindrospermopsin, paralytic shellfish toxins (PSTs), anatoxins, and other toxins (Pomati et al., 2000; Foulds et al., 2002; Vaitomaa et al., 2003; Kurmayer and Christiansen, 2010; Pearson et al., 2010; Martins and Vasconcelos, 2011; Antonella and Luca, 2013). Microcystin production has been the most studied between cyanobacteria and is well known among several genera of cyanobacteria, including Microcystis, Anabaena, Pseudoanabaena, Planktothrix, and others (Kurmayer and Christiansen, 2010; Pearson et al., 2010). Cylindrospermopsin (CYN) is the second most widely occurring hepatotoxin produced by cyanobacteria species, including C. raciborskii and Aphanizomenon/Cuspidothrix spp. (Pearson et al., 2010). Several species of freshwater filamentous cyanobacteria have been reported to produce PSTs (saxitoxins) (Humpage et al., 1984; Mahmood and Carmichael, 1986). Although initially thought to be rare, cyanobacterial anatoxin-a (ANTX) has been detected in many freshwater habitats (Bruno et al., 2016; Ballot et al., 2018). Real-time PCR protocols can be helpful in defining the presence of toxic cyanobacteria genotypes during bloom- and non-bloom seasons (Martins and Vasconcelos, 2011; Antonella and Luca, 2013). However, molecular probes and PCR primers are designed for specific targets and may overlook unknown members of an algal community. In freshwater cyanobacteria research, next-generation sequencing (NGS) has been recently used to assess the general diversity mostly based on 16S rRNA gene amplicons analysis (Liao et al., 2016; Woodhouse et al., 2016; Lezcano et al., 2017; Scherer et al., 2017). Lately, the portable MinION device offered a unique solution for dinoflagellates HAB microbiome research (Hatfield et al., 2020). Recently released, the Oxford Nanopore MinION device (United Kingdom) is a third-generation portable sequencing platform valuable for applications with a large number of samples or where portability is more important than increased error rate (5–15%, Pfeiffer et al., 2018) (Castro-Wallace et al., 2017; Johnson et al., 2017; Gowers et al., 2019; Burton et al., 2020). However, only a few studies focused on harmful algae in water bodies combining NGS assessment with toxic genotype analysis by real-time PCR (Fortin et al., 2015; Lee et al., 2015).
Although most studies are focused on the seasonal algal blooms in summer and spring seasons, cold-weather and winter cyanobacterial blooms have been documented throughout the literature (Naselli-Flores et al., 2007; Babanazarova et al., 2013; Wejnerowski et al., 2018). Water temperature directly affects rates of respiration, photosynthesis, and algal growth in aquatic ecosystems (Regier et al., 1990; Joehnk et al., 2008). The link between temperature and toxin production by cyanobacteria remains elusive and is governed by the complex interaction among all environmental factors. It was found that the highest toxin contents, such as microcystin (MC), cylindrospermopsin, and other toxic compounds, are not associated with temperature conditions most favorable for cyanobacteria growth (Saker and Griffiths, 2000 for cylindrospermopsin; Savadova et al., 2018 for MC).
In this work, a combination of high-resolution IFC, NGS, and PCR-based methods were used to evaluate the presence of potentially toxic cyanobacteria along the Ural River, including the places of recent fish kills. Initial detection and identification of potentially toxic algae was done with IFC, and then confirmed with molecular methods. This combination of methodological approaches will be a valuable way to determine the presence and frequency of potentially toxic detectable cyanobacteria. Additionally, metagenomic analysis with the Nanopore sequencing platform provided an alternative, complementary way to identify and characterize potential harmful algae strains.
Materials and Methods
Water Sampling
Ural River is the third river in terms of its length among European rivers, and it flows from the Ural mountains to the delta of the Caspian Sea. The temperature in this area can be as low as −38°C and as high as 46°C (Kazhydromet Climate Monitoring Bulletin, 2016). This project had covered the region of the river within the borders of Atyrau city, upstream from the city border (100 km away), and downstream to the delta of the Caspian Sea. The sampling sites are illustrated in Figure 1, and they were assigned as follows: S1 Delta > S2 Channel > S3 Ship > S4 low Peretaska > S5 Balykshy > S6 Peretaska > S7 Oil refinery water intake-ANPZ > S8 Atyrau Su Arnasy > S9 Geolog > S10 Almaly > S11 Saraishyk > S12 low Makhambet > S13 upper Makhambet > S14 Ural River 100 km (distances are as follows: S1–S2 14.8 km; S2–S3 21.2 km; S3–S4 9.2 km; S4–S5 8.6 km; S5–S6 2.1 km; S6–S7 1.6 km; S7–S8 6.7 km; S8–S9 5.1 km; S9–S10 16 km; S10–S11 45 km; S11–S12 23.2 km; S12–S13 17.5 km; S13–S14 24.6 km) The samples were collected across the length of the river in August–December 2019, noting that sampling in October and December was limited by two sampling points at Peretaska duct, near a local cogeneration plant and oil refinery.
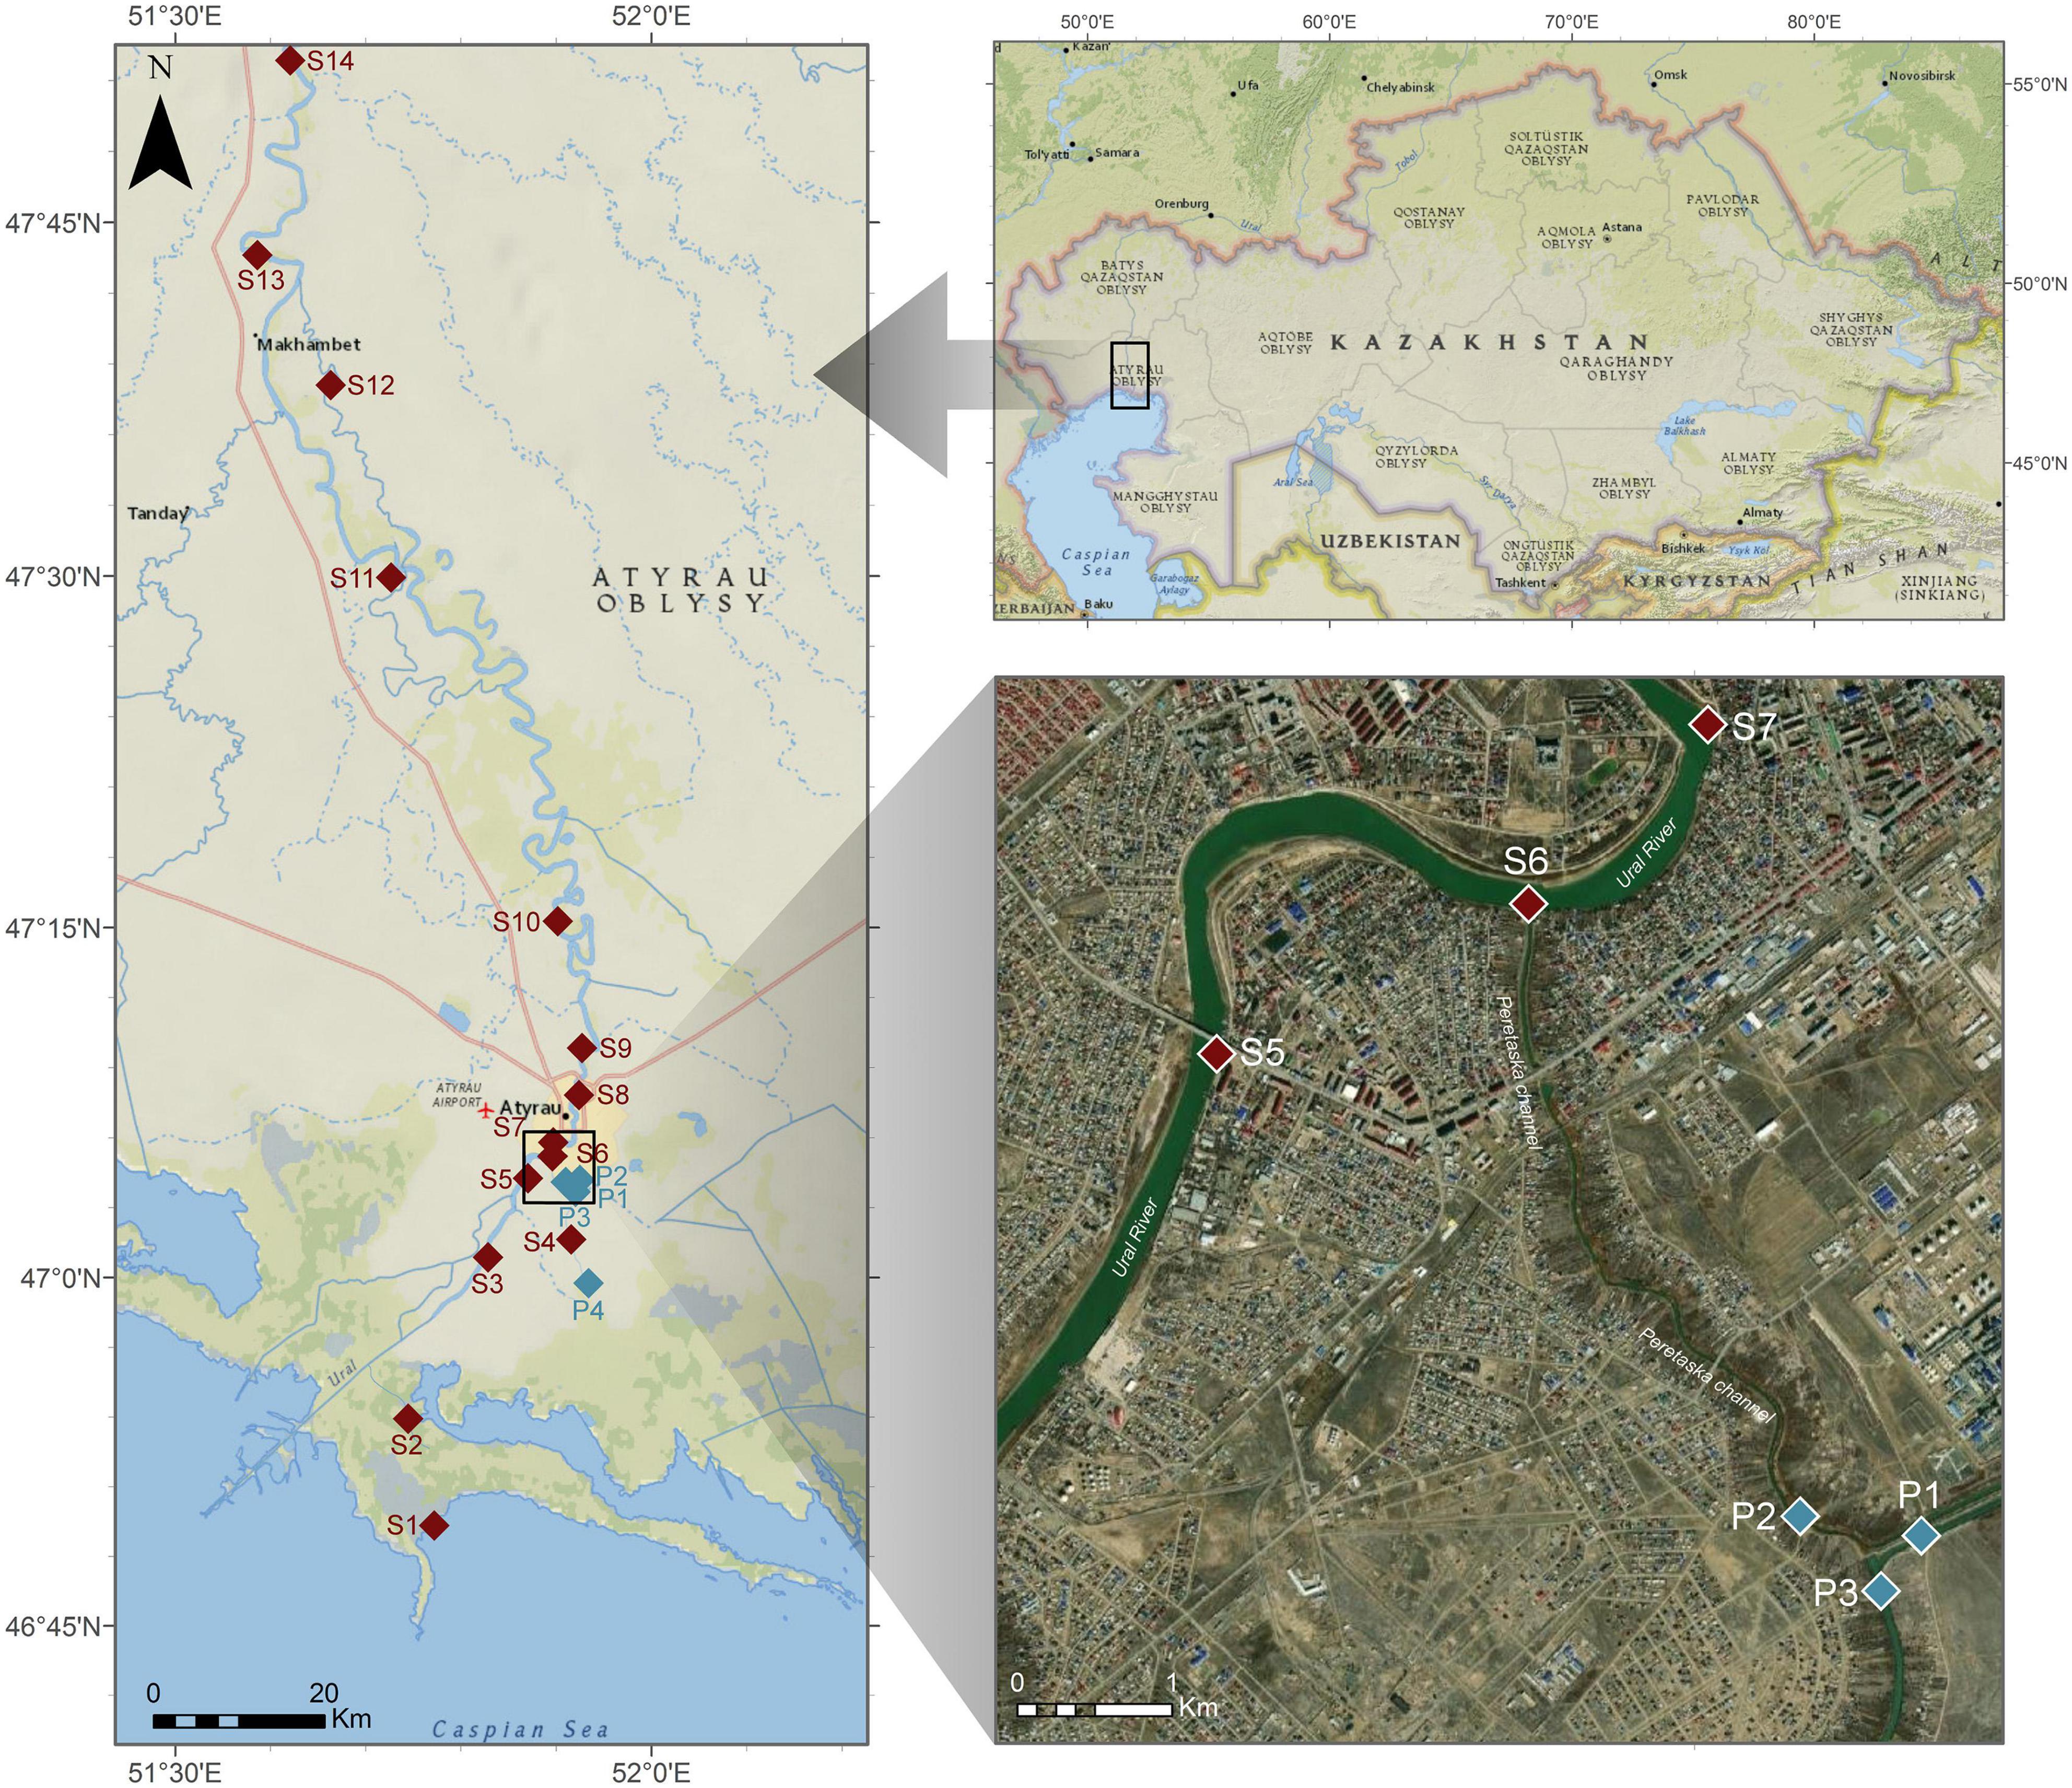
Figure 1. Representation of sampling points on the Ural River. Sampling points from S1 to S3 were taken near the Ural delta, sampling points S4–S9 were taken within the city boundaries, where most of the fish die-off happened at the end of 2018–beginning 2019, sampling points S10–S14 were taken above the city boundaries upstream of the Ural River. Sampling points P1–P4 are taken during October 2019 expedition.
Shortly, the surface water sampling was carried out, and samples for IFC analysis of the phytoplankton communities and hydrochemistry were collected at each location in plastic 5-L bottles from surface water horizon (0.5 m depth) in plastic 5-L bottles. Water turbidity was checked by the Secchi disk. Phytoplankton samples were fixed in triplicates with different fixators: paraformaldehyde (0.5%), glutaraldehyde (0.5%), and Lugol’s solution. Fresh, live samples were preserved in the cold box until delivered to the laboratory and then kept in the refrigerator at 4°C. Water parameters such as dissolved oxygen, salinity, conductivity, temperature, and total dissolved solids at the sampling site were measured on-site. The phosphate concentration was calculated by the standard molybdate method (Motomizu et al., 1983).
Satellite Data Analysis
Land surface temperature is one of the physical observation remote sensing parameters which are of great importance for different disciplines, such as environmental studies, hydrology, etc., which contributes to a better understanding of energy and water exchange. NASA’s Landsat mission has collected a huge amount of relatively high spatial resolution thermal data as it has a thermal infrared (TIR) sensor onboard since 1984 (Barsi et al., 2003). In this study, Landsat 8 data were used on Atyrau city to retrieve land surface temperature for recent dates as it is the source of new images. Landsat 8 has two thermal bands with a spatial resolution of 100 m and a 16-day revisit time (Rozenstein et al., 2014). The data included bands 4, 5, and 10 of scenes LC08_L1TP_166027_20181201_20181211_01_T1 (December 01, 2018), LC08_L1TP_167027_20181208_20181211_01_T1 (December 08, 2018), LC08_L1TP_167027_20190314_2019032 5_01_T1 (March 14, 2019), and LC08_L1TP_167027_2 0191211_20191217_01_T1 (December 01, 2019).
The Land Surface Temperature Calculation
The main workflow is based on the algorithms proposed by Chander and Markham (2003), Chander et al. (2009), and Walawender et al. (2012). Band ten from Landsat 8 images was used to calculate the top of the atmospheric radiance (TOR) first, and then it was converted into the at-sensor temperature. In parallel, the red and the near-infrared bands were used to calculate NDVI. The NDVI was used to calculate the ground emissivity. Both derivatives were integrated into the final land surface temperature products for each date. The time series covering the period between December 2018 and December 2019 were processed using Python 3 codes.
Ion Chromatography
To determine the ionic composition of water, ion chromatography technique (IC) was used. Before the IC analysis, samples were filtered with 0.22 μm cellulose acetate filters using a vacuum pump. The analysis of fluoride, chloride, nitrite, bromide, nitrate, phosphate, and sulfate ions in water samples was performed using a Dionex ICS-6000 HPIC system (Thermo Fisher Scientific, Waltham, MA, United States) equipped with a conductivity detector, two chromatographic columns: for the separation of cations and anions, and Chameleon 6.0 software. Anion separation was carried out using a Dionex IonPac AS11-HC-4 μm capillary, analytical, and guard column (2 × 250 mm) and 30 mmol potassium hydroxide solution as eluent. To determine the cations, we used a Dionex IonPac CS12A-5 mSm IC column (3 × 150 mm). A calibration chart was built from 1 to 30 ppb; the correlation coefficient was 0.998. Quality control was acquired at 15 ppb with 40 times diluted samples.
Ultra High-Performance Liquid Chromatography Coupled With Diode Array Detection
An UHPLC-diode array detection (DAD) method was chosen because it can quickly confirm the presence of microcystin (MC-LR) and nodularin in aqueous samples (Rapala et al., 2002; Thuret-Benoist et al., 2019). The UHPLC system used was an Ultimate 3000 instrument (Thermo Fisher Scientific, United States) equipped with DAD detector. UV-spectra were drawn from 200 to 300 nm. Separation of the toxins was achieved on reversed-phase C18 analytical column thermostated at 35°C. Both the aqueous, water (A), and organic, acetonitrile (B), mobile phases contained 0.025% trifluoroacetic acid (TFA). The following linear gradient program was used: 0 min 70% A, 1.2 min 70% A, 6.2 min 30% A, 7 min 0% A, 7.4 min 70% A; stop time 10 min. The sample injection volume was 5 μl. The flow rate was 0.350 ml/min. For identification of cyanotoxins in water samples, we used standards of MC-LR and nodularin (Thermo Fisher Scientific, United States) with a concentration of 500 μg/L. Stock solution of the toxins was prepared in methanol and stored at −20°C. For solid-phase extraction (SPE), C18 cartridges HyperSep Phenyl, 500 mg (Thermo Fisher Scientific, United States) were used. All solvents (distilled water, methanol, and acetonitrile) were UHPLC gradient grade. TFA was at least of analytical reagent grade. The filtered samples were passed through a SPE cartridge. Analytes were eluted from the solid phase with a small amount of 90:10 methanol:reagent water (v/v). The extract were concentrated to dryness by evaporation with SP Genevac Rocket Synergy 2 evaporator (SP Inc., Anchorage, AK, United States), and then adjusted to a 1-ml volume with 90:10 methanol:reagent water (v/v). The HPLC method was optimized by using ultrapure grade water with diluted MC-LR and nodularin standards (Thermo Fisher Scientific, United States).
Light Microscopy
For the morphological identification of organisms, samples were analyzed with a Leica DM2500 microscope (Leica, Wetzlar, Germany) with ×100, ×200, and ×400 magnifications. The plankton organisms were classified at the genus level and species level, where possible. Dolichospermum and Aphanizomenon/Cuspidothrix could not always be determined to species level because of the lack of akinetes that are a key feature in the morphological identification of nostocalean cyanobacteria. In such cases, the Dolichospermum spp. were classified according to the filament type as “curved” or “straight.”
Imaging Flow Cytometry
Cell abundance was counted using FlowCAM VS-4 (Yokogawa Fluid Imaging Technologies, United States). A mixture of 5, 10, and 25 μm size beads (Yokogawa Fluid Imaging Technologies, United States) was used for the calibration of the instrument. The FlowCAM was run in autoimage and/or laser-triggered mode using a ×10 objective and a 100-μl flow cell. The results from the FlowCAM were analyzed using VisualSpreadsheet software version 4.0 (Yokogawa Fluid Imaging Technologies, United States). Classification of the dominant genera of phytoplankton was conducted using a semi-manual mode of the software and manual selection of the representative training set of images. To create the subsets within the classification process, statistical filtering, which takes the highest score value as a threshold, was used. Each run of statistical filtering chooses particles with the value of likeness higher than the threshold value. The results of the automated classification were manually rechecked in case of erroneous or missed particles. Classification included subsets of the following major cyanobacterial genera: Dolichospermum, Microcystis, Pseudanabaena, Aphanizomenon/Cuspidothrix, Cylindrospermopsis, and Sphaerospermopsis (representative images in Figure 2).
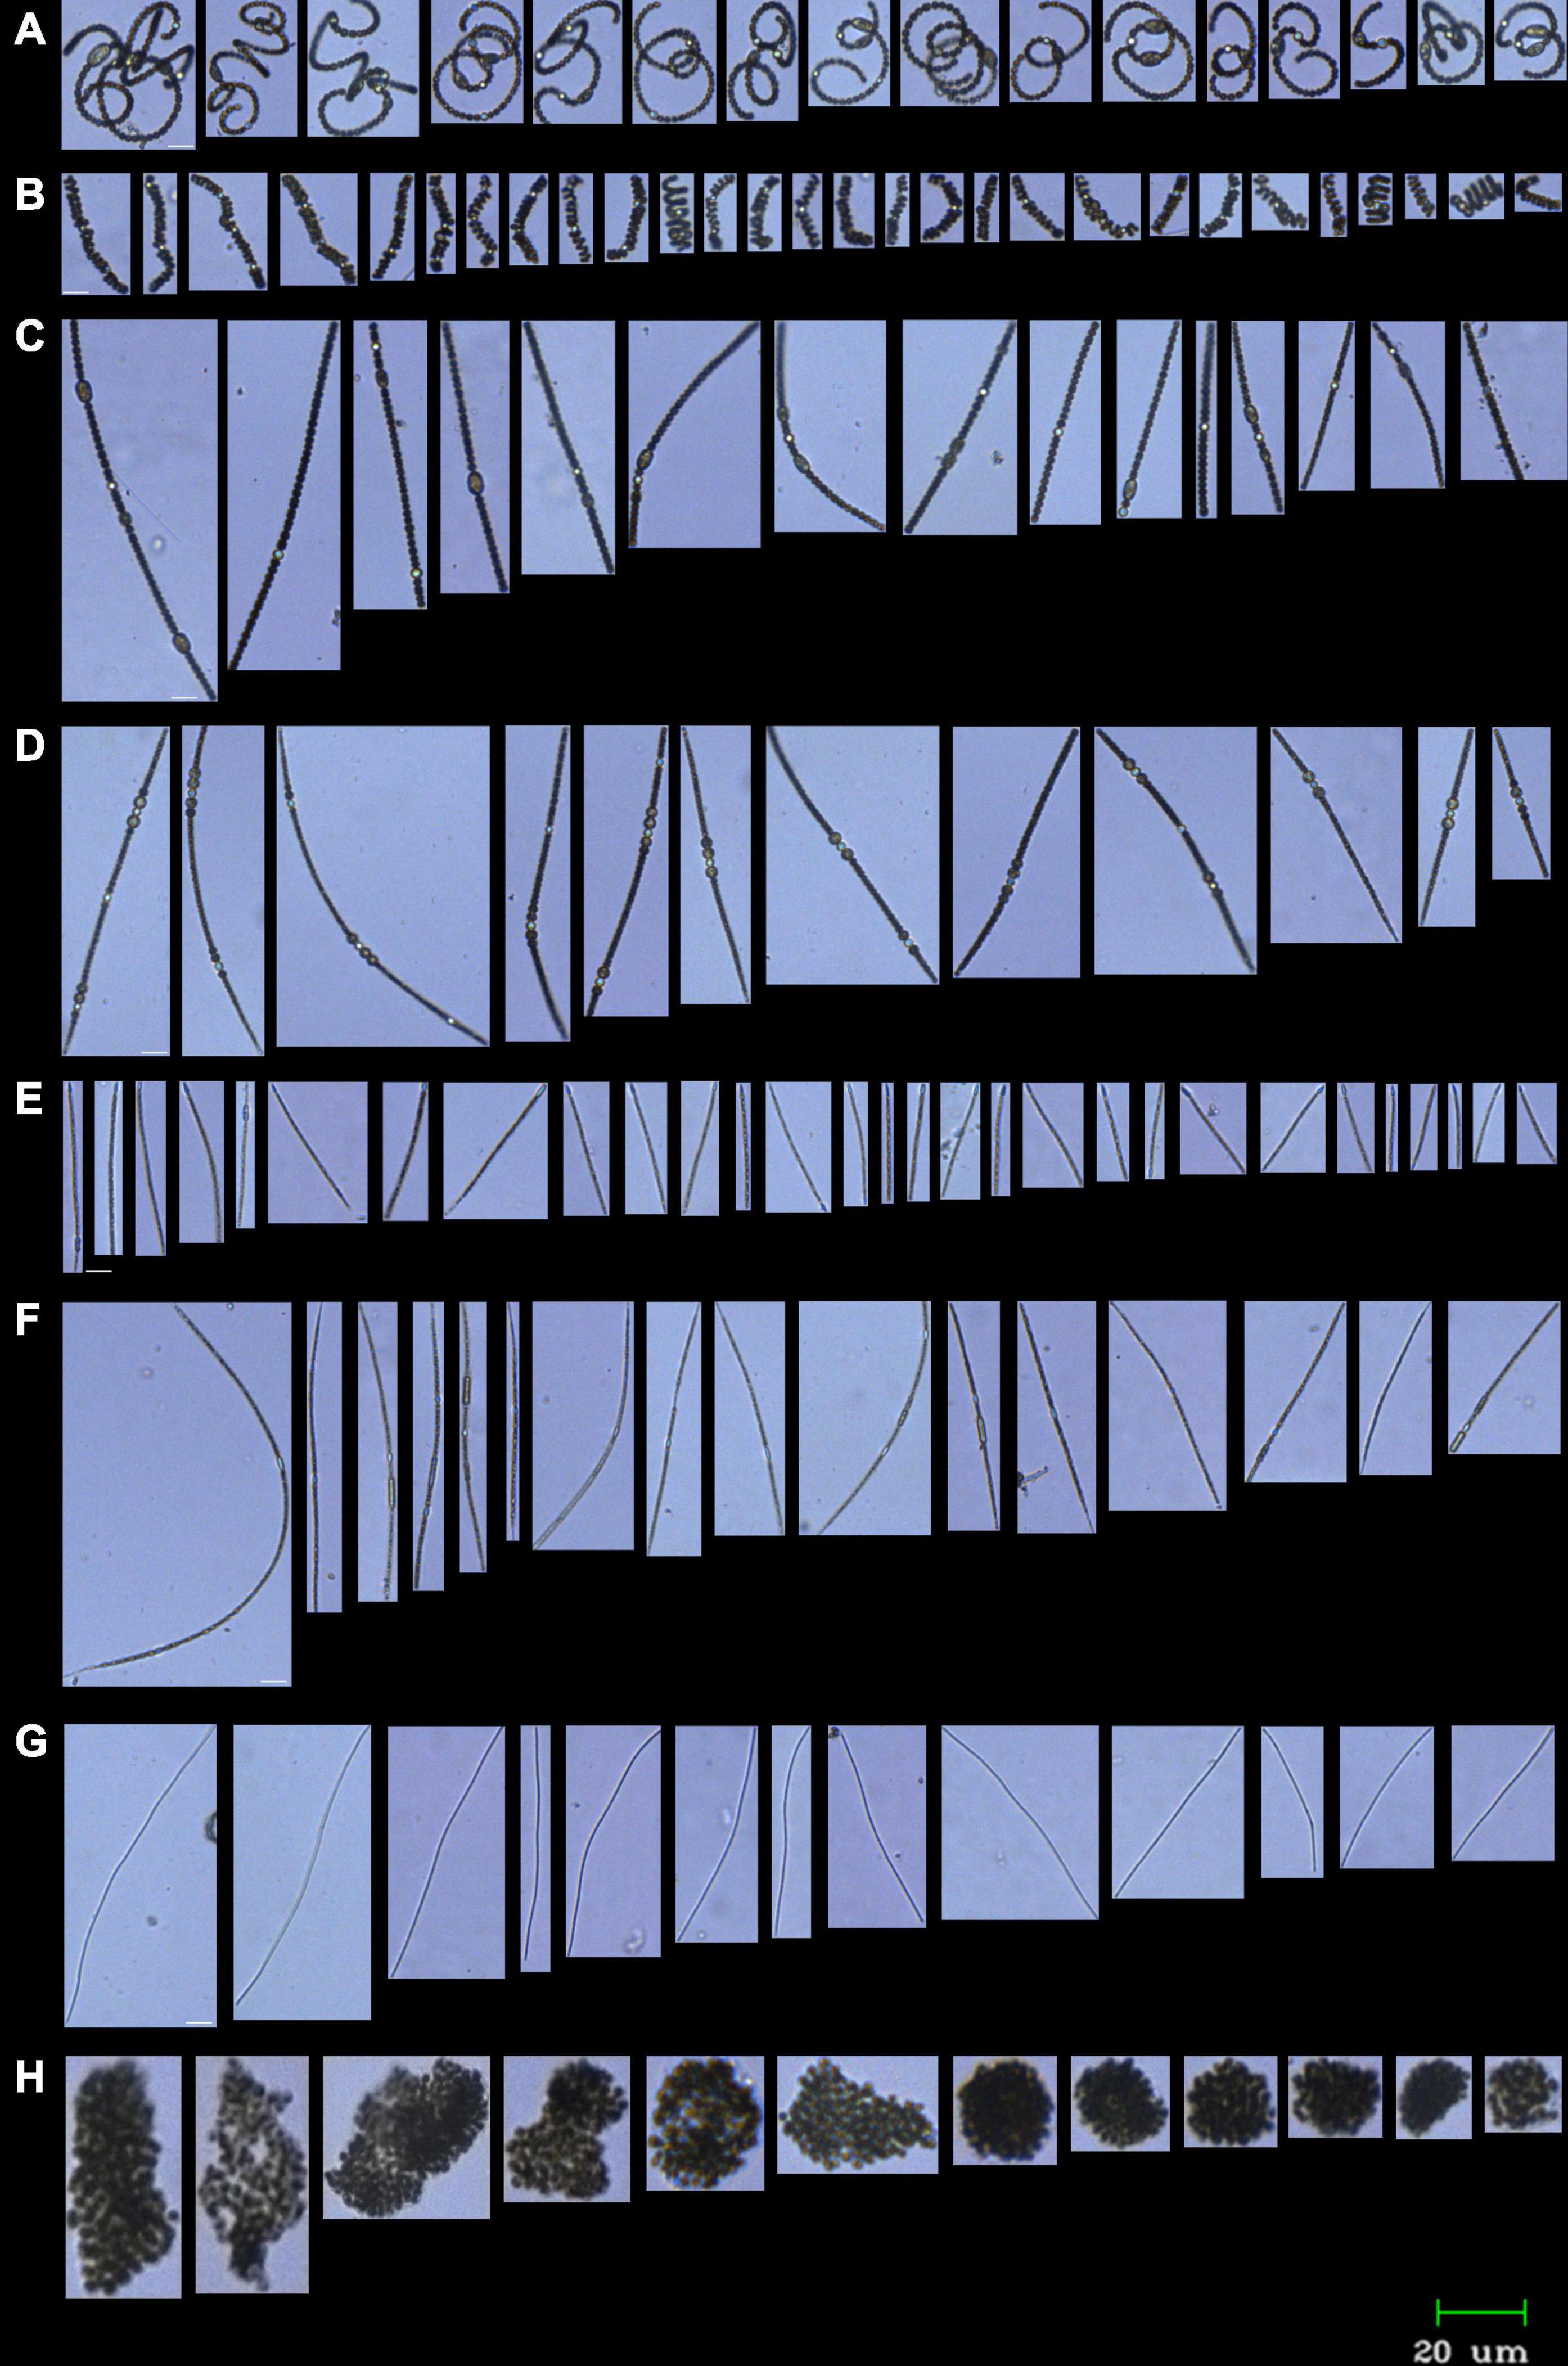
Figure 2. FlowCAM image galleries of most abundant cyanobacteria in River Ural in August 2019. Samples preserved with 0.5% glutaraldehyde; ×10 objective, 100 μm flow cell. (A,B) Curved Dolichospermum filaments (A Dolichospermum cf. flos-aquae, B Dolichospermum cf. compactum); (C) straight Dolichospermum filaments (Dolichospermum cf. macrosporum); (D) Sphaerospermopsis aphanizomenoides; (E) Cylindrospermopsis raciborskii; (F) Cuspidothrix issatschenkoi; (G) Pseudanabaena limnetica; (H) Microcystis sp. Scale bar, 20 μm.
MinION Sequencing
Based on FlowCAM IFC analysis, water samples from five different Ural River locations were selected for NGS. More specifically, samples were taken from the delta of river Ural, inside Atyrau town line (Peretaska artificial stream), and near Makhambet village in August 2019 field expedition. DNA extraction was performed using PowerWater DNA Isolation Kit (Qiagen, United States). The resulting DNA concentrations were in a range of 2–10 ng/μl as defined by measurement with a Nanodrop spectrophotometer (Thermo Fisher Scientific, United States) set at 260 nm. The methodology was adapted from manufacturer’s instructions in the protocol library of Oxford Nanopore Technologies website. The 16S Barcoding Kit (SQK-RAB204) was used for library preparation, which included PCR reactions and attachment of sequencing adapters. The former procedure was performed by preparation of reaction mixture that included nuclease-free water (14 μl), DNA sample (10 ng, diluted with nuclease-free water to reach 10 μl), DreamTaq Hot Start PCR Master Mix (25 μl), and 16S barcode primer at 10 μM (1 μl). There were 12 different 16S barcodes, and they were assigned for defined samples from Ural River. For instance, Barcode 01 was used for the sample site S1. The thermocycler was set for the following parameters: 1 min at 95°C, followed by 25 cycles with 20 s at 95°C, 30 s at 55°C, 2 min at 65°C for and ended by a final extension of 5 min at 65°C. PCR products were then cleaned up by AMPure XP beads (Beckman Coulter, United States), and the mixture of PCR products (with different barcodes) was prepared. The sequencing adapters were added to this mixture and incubated for 5 min in room temperature. After the library preparation, the DNA library was mixed with loading beads and sequencing buffer (provided by the manufacturer). The MinION device was used for sequencing with flow cell R9.4. DNA library was transferred to the flow cell according to the manufacturer’s recommendations, and sequencing run continued for about 14 h. The basecalling was turned on during the run, and the produced data (Fastq files) were analyzed by EPI2ME cloud-based data analysis platform. The “Fastq 16S r2020.04.06” workflow was used to build 16S classification taxonomy.
PCR Analysis of Toxic Cyanobacteria in Ural River Environmental Samples
Based on FlowCAM IFC analysis, water samples from five different locations in the Ural River were selected for molecular analysis (labeled as samples S1, S4, S6, S12, and S13). Primers were designed for the identification of microcystin synthetase gene E (mcyE), the aspartate aminotransferase domain for saxitoxin synthesis (sxtA), amidinotransferase gene for cylindrospermopsin synthesis (cyrA), and genes for the biosynthetic production of anatoxin-a (anaC), according to Vaitomaa et al. (2003), Al-Tebrineh et al. (2012), and Rantala-Ylinen et al. (2011). Primers are listed in Table 1, and their parameters were verified by OligoAnalyzer Tool (Integrated DNA Technologies, Coralville, IA, United States).
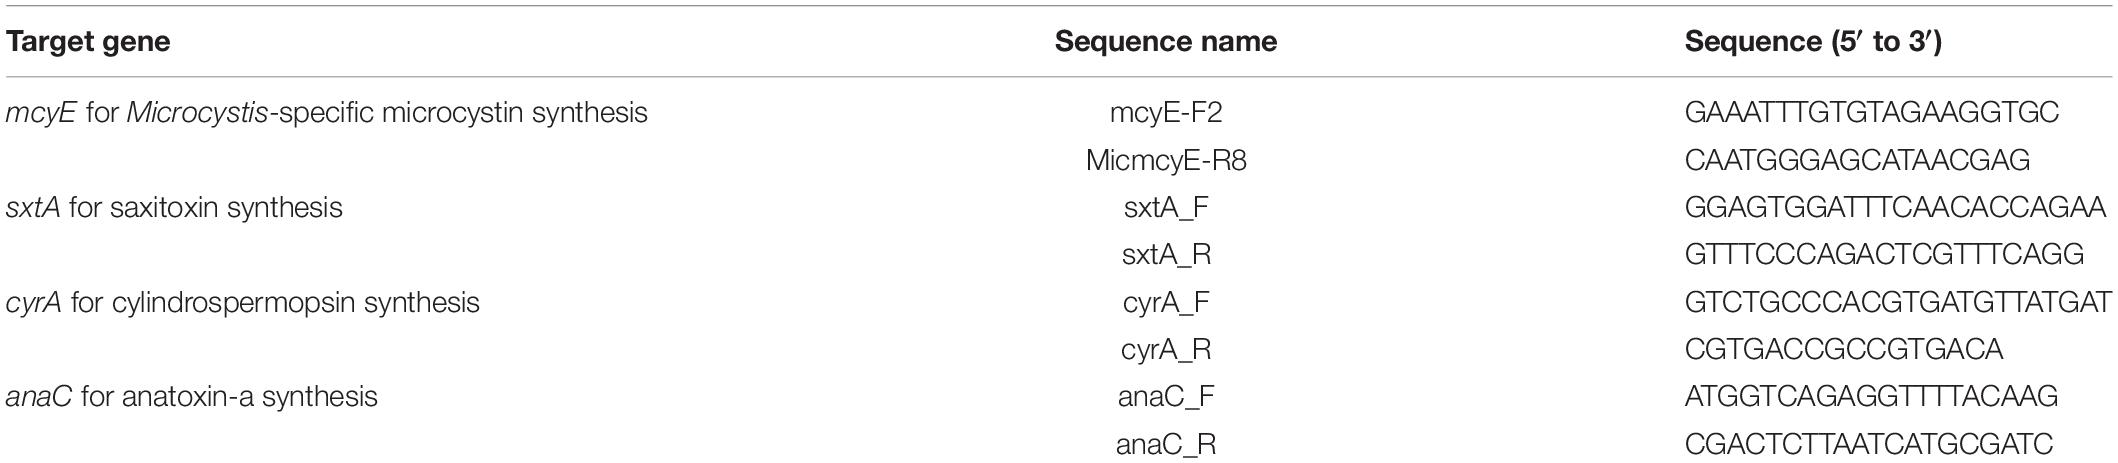
Table 1. List of consensus primers used in the study.
The end-point PCR was performed by mixing of 3 μl of the extracted DNA sample, 25 μl of DreamTaq Hot Start PCR Master Mix, 0.5 μl of each primer (10 μM), and dH2O up to a final reaction volume of 50 μl. All reaction tubes were transferred to a thermocycler (Bio-Rad, Hercules, CA, United States) for a 3-min initial denaturation step at 95°C. That was followed by 40 reaction cycles, with one cycle consisting of 30 s at 95°C, 30 s at temperature depending on Tm of primers, and 60 s at 72°C. The PCR steps were followed by a final extension step at 72°C for 5 min. Length of PCR products were analyzed by DNA electrophoresis using 1% agarose gel with SYBR Safe DNA Gel Stain (Life Sciences, United States). Samples with PCR products were purified and sequenced. The resulted DNA sequences were used for the identification of Microcystis-specific toxin synthase genes. Sanger sequencing was performed by commercial entity (Evrogen, RF).
Real-Time PCR
The real-time SYBR Green I qPCR was performed using the Bio-Rad CFX96 Touch Real-Time PCR instrument (Bio-Rad, United States). All reagents were provided by Syntol (Moscow, Russian Federation) and used according to the manufacturer’s protocol. The reaction volume of 20 μl included 5 μl of extracted DNA [concentration range of 2–10 ng/μl as defined by measurement with a Nanodrop spectrophotometer (Thermo Fisher Scientific, United States)], 5 μl of nuclease-free water, 2.5 μl of vortexed MgCl2 solution, 2.5 μl of dNTP, 2.5 μl of SYBR Green buffer, 1 μl of each primer (10 μM), and 0.5 μl of SynTaq-polymerase. The reaction protocol included an initial denaturation step at 95°C for 3 min, and 40 cycles of denaturation (30 s, 95°C), annealing (30 s, Tm of primers), and extension (60 s, 72°C) were followed by melting curve assessment. Each reaction was performed in triplicates. Microcystis genome DNA extracted from toxic strain served as a positive control, and a no-DNA reaction well served as a negative control.
Statistical Analysis
Multivariate analysis techniques provide appropriate statistical tools for analysis of environmental parameters and their effects on ecological communities (Greenacre and Primicerio, 2013). The principal component analysis (PCA) was performed to identify the significant environmental conditions influencing distribution detected by IFC cyanobacterial genera in Ural River sampling sites. The analysis was performed using STATISTICA vs. 8 (StatSoft, Tulsa, OK, United States). Environmental parameters included temperature, pH, conductivity, solids (referred as TDS), dissolved oxygen (referred as DO), and NO3– and NH4+ concentrations as explanatory data (Supplementary File 1). Correlations between the abundances of different cyanobacteria and environmental factors were analyzed by Spearman correlation analysis (STATISTICA vs. 8, StatSoft, United States).
Results
Sample Sites Description and Environmental Parameters
Sampling sites S1–S3 were located downstream the Ural River, closer to the Caspian Sea basin. Sampling sites S4–S9 were located within the city area, and sampling sites S10–S14 were located upstream 20–100 km away from the city. The main hotbed of the fish kills was in the urban region of the city, starting from sampling point S5 Balykshy until sampling point S9 Geolog. The area corresponds to the residential districts of the city, as well as the industrial districts. For instance, there is an artificially created water channel called Peretaska (S6), the main purpose of which is water intake by the local thermal power station and oil refinery. Water then exits at a higher temperature (from our measurements at 30°C on October 10 and 26°C on December 24, 2019) and is returned to the upper part of the Peretaska, which then heads in the direction of the Caspian Sea. The temperature difference between the upper and lower Peretaska is significant. Water in the upper part of the Peretaska channel differs from that in the Ural River in terms of its greenish color and high turbidity. The river flow is minimal and unobservable. Sampling points S4–S8 are located near the industrial areas, while S9 Geolog is a residential area near the border of the city.
By applying the satellite analysis approach described in the section “Materials and Methods,” we derived the land surface temperature of the study, referring to the four dates indicated above. Results demonstrate a strong thermal anomaly near Atyrau’s power plant and oil refinery on December 1 and 8, 2018 (Figures 3A,B) and December 2019 (Figure 3D), while images acquired in the spring show a significant decrease in the surface temperature for the same area (Figure 3C). Furthermore, the locations of a fish kill in December 2018 and 2019 were mapped and combined with the land surface temperature map, derived from the images acquired by Landsat 8 on December 1, 2018 (closer to the date of initial fish kills).
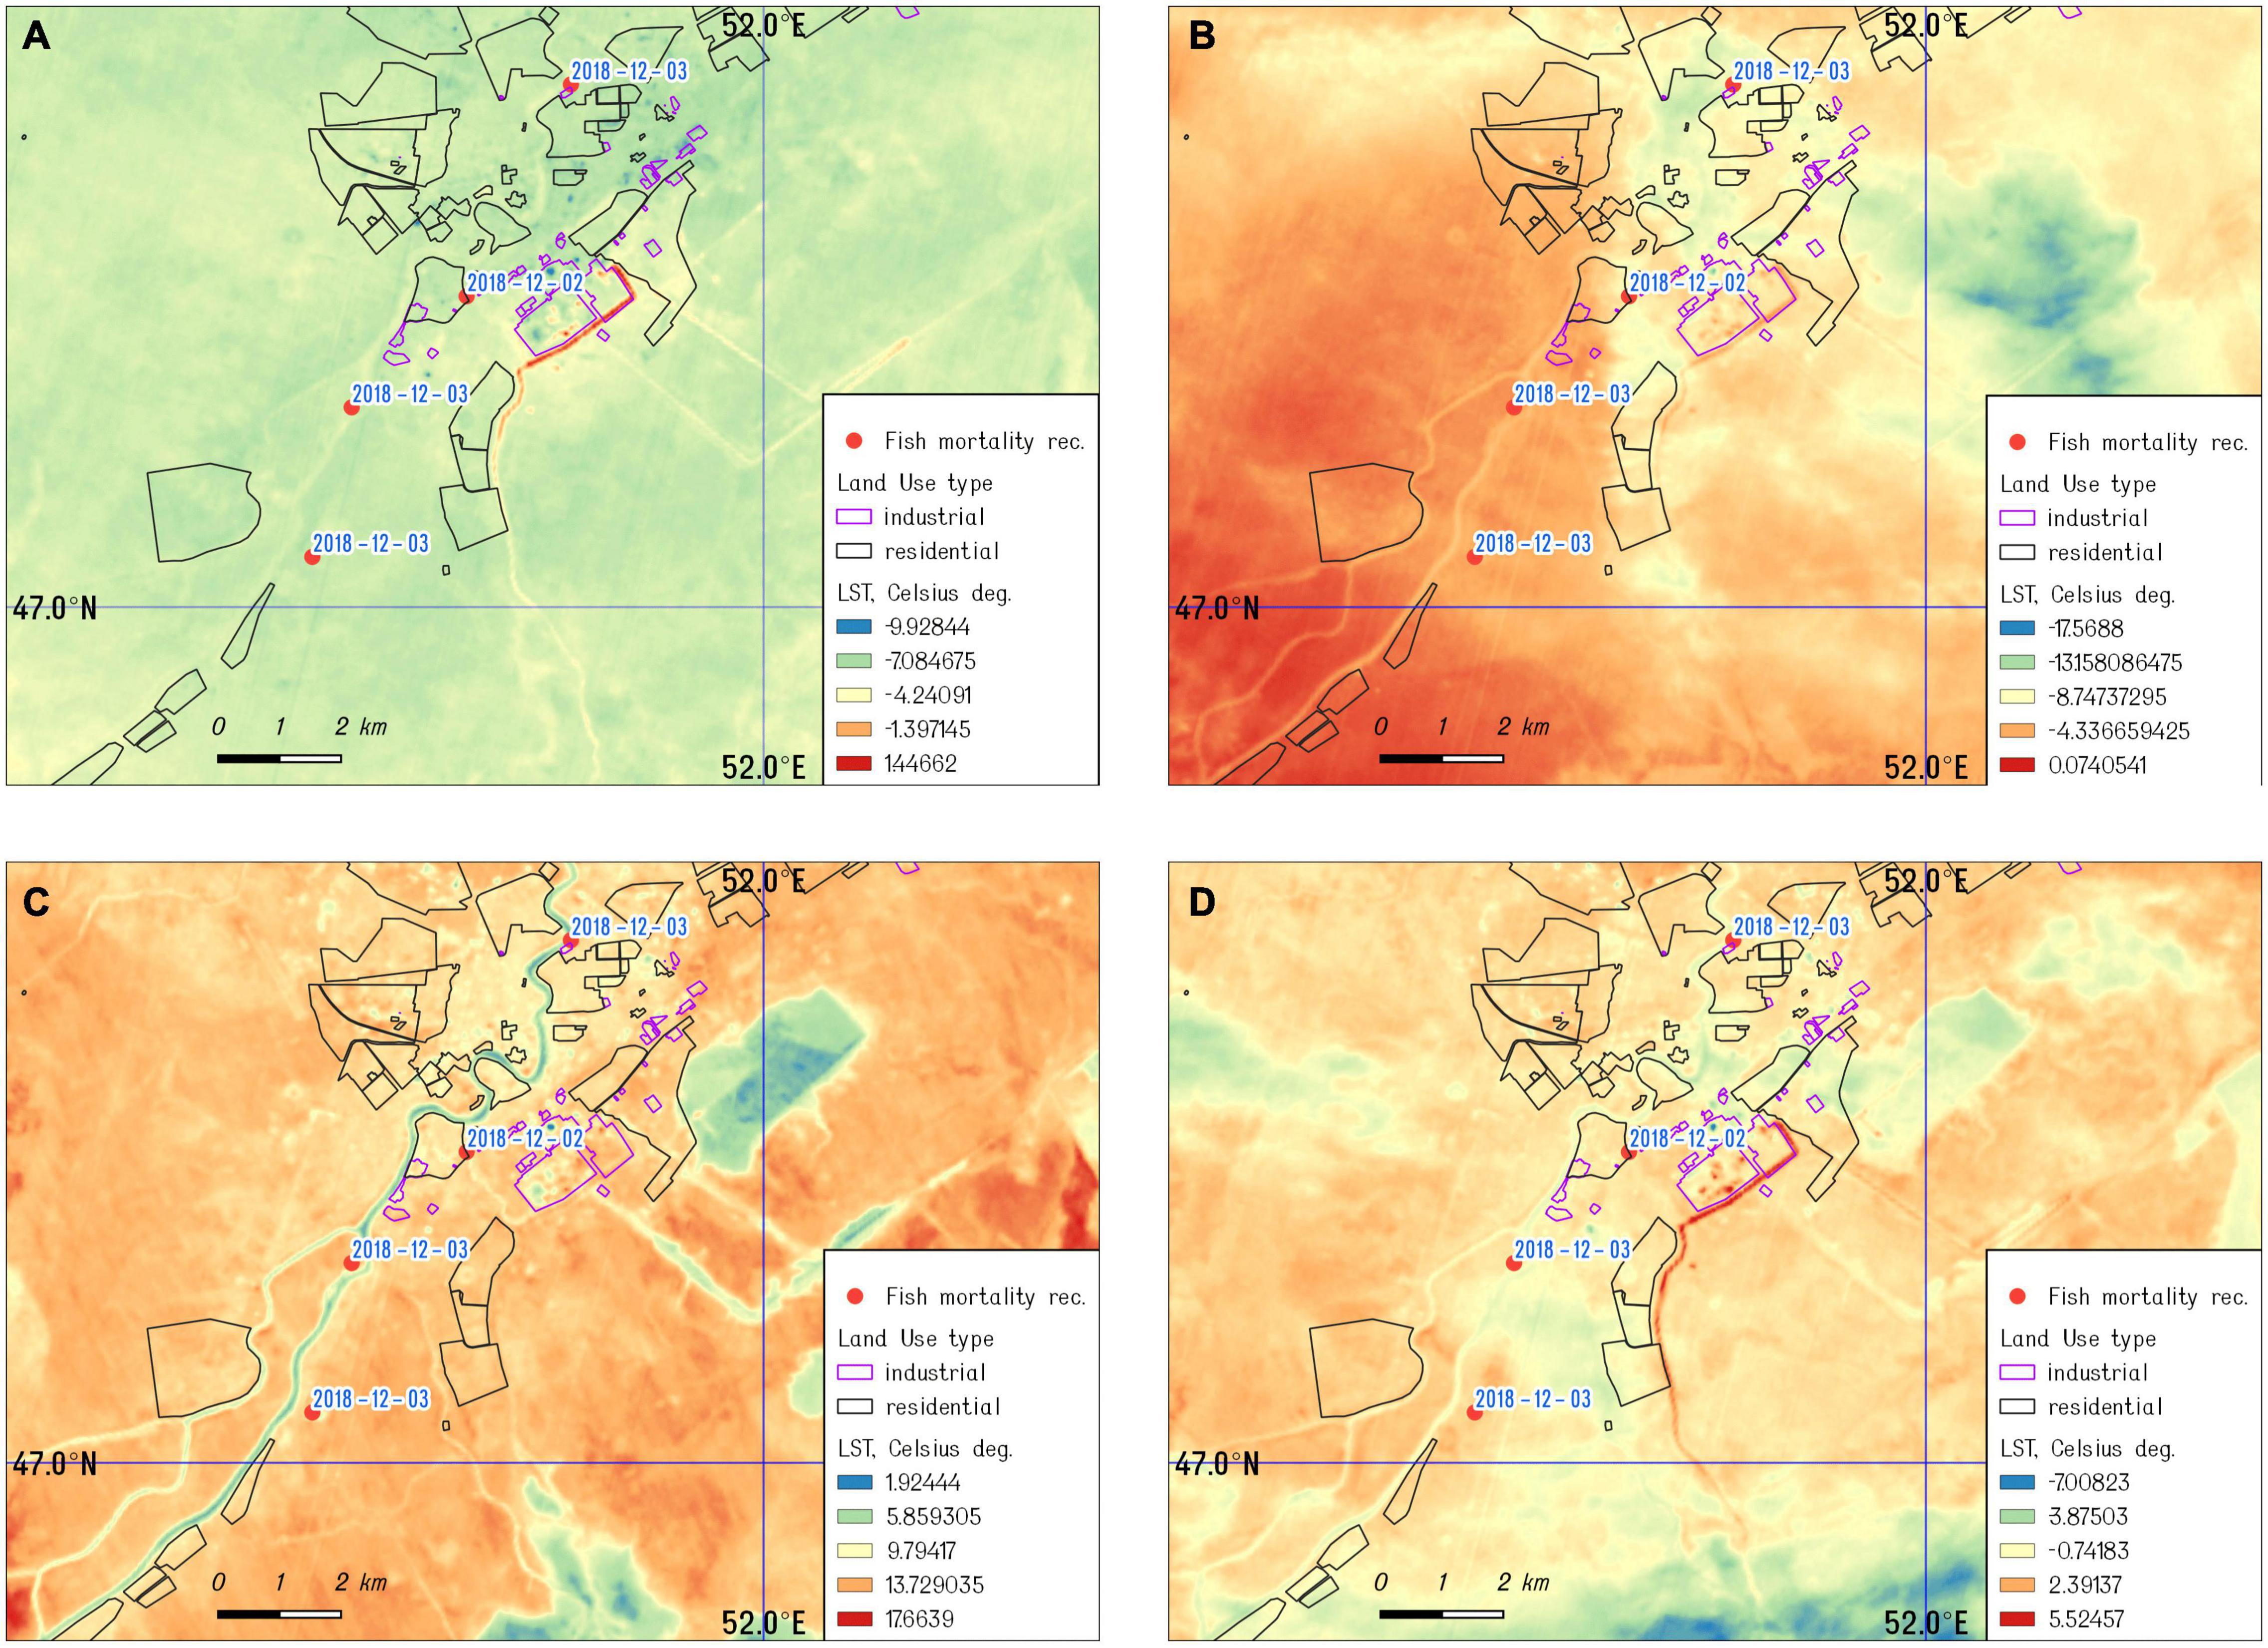
Figure 3. The land surface temperature of the study area: (A) December 01, 2018; (B) December 08, 2018; (C) March 14, 2019; and (D) December 01, 2019.
The detailed information on ion concentration is provided in Supplementary File 1. The highest concentration of nitrates in water was detected in the artificial water duct S6 Peretaska at 4.69 mg/L of water leading to the cogeneration plant. Accordingly, the oil refining plant’s water intake system from the Ural River directly corresponds to the sampling site S7 Oil Refinery Water Intake, where a nitrate concentration of 3.92 mg/L was detected. Phosphate concentrations were slightly increased in the Peretaska locations than the Ural River (Atyrau Su) location. Oxygen concentrations were significantly low in the Peretaska duct (6.5 mg/L). No differences in chloride concentrations between Peretaska sites and the Ural River were detected in water samples in August–December 2019.
Identification and Abundances of Potential Toxic Algae in the River Ural Region
We have identified the cyanobacteria Cylindrospermopsis (=Raphidiopsis) raciborskii, Sphaerospermopsis aphanizomenoides, Dolichospermum spp., Aphanizomenon/Cuspidothrix spp., and Pseudanabaena limnetica as dominant potentially toxic phytoplankton species in the Ural River using light microscopy and IFC (Figure 2). The genera of these potentially toxic cyanobacteria were earlier described as forming algal blooms with the capability of releasing life-threatening toxic compounds (e.g., Codd et al., 2005; Paerl and Otten, 2013; Rastogi et al., 2015). According to the classification results, the most abundant species of potentially toxic cyanobacteria in the Ural River were Dolichospermum and Aphanizomenon/Cuspidothrix spp. Sampling site S1 is the delta of the Caspian Sea, which correspondingly encountered the lowest abundance of cells and a higher water salinity of 0.42%. The S2 channel sampling site is a shallow artificial channel connecting the Caspian Sea to the Ural River with brackish water (0.15%) and a higher abundance of the target species.
The abundance of cells of potentially toxic algae was high in the mouth of the river duct Peretaska, an area with low circulation rates and increased water temperature. The parameters of water in the S6 Peretaska site included a heightened NO3 concentration (4.69 mg) and a slight increase compared with the sampling point temperature (23°C) at the Ural River. The low Peretaska was low in biodiversity, and Dolichospermum spp. was most abundant among potential harmful algae with a cell count equal to 10 filaments/ml. The temperature of this sampling site was 30°C in August and October and decreased to 26°C by the end of December.
The maximum number of cells of Aphanizomenon/Cuspidothrix spp. reached almost 900 particles/ml at the S11 Saraishyk sampling site (Figure 4; Supplementary File 2). The site was distinguished by the high NH4 content in the water (1.19 mg/L). In addition, both the S11 Saraishyk and S10 Almaly sites showed low numbers of C. raciborskii. The S12 low Mahambet site had a high concentration of NH4 (3.25 mg/L) and is the only sampling point where Microcystis sp. was detected by IFC.
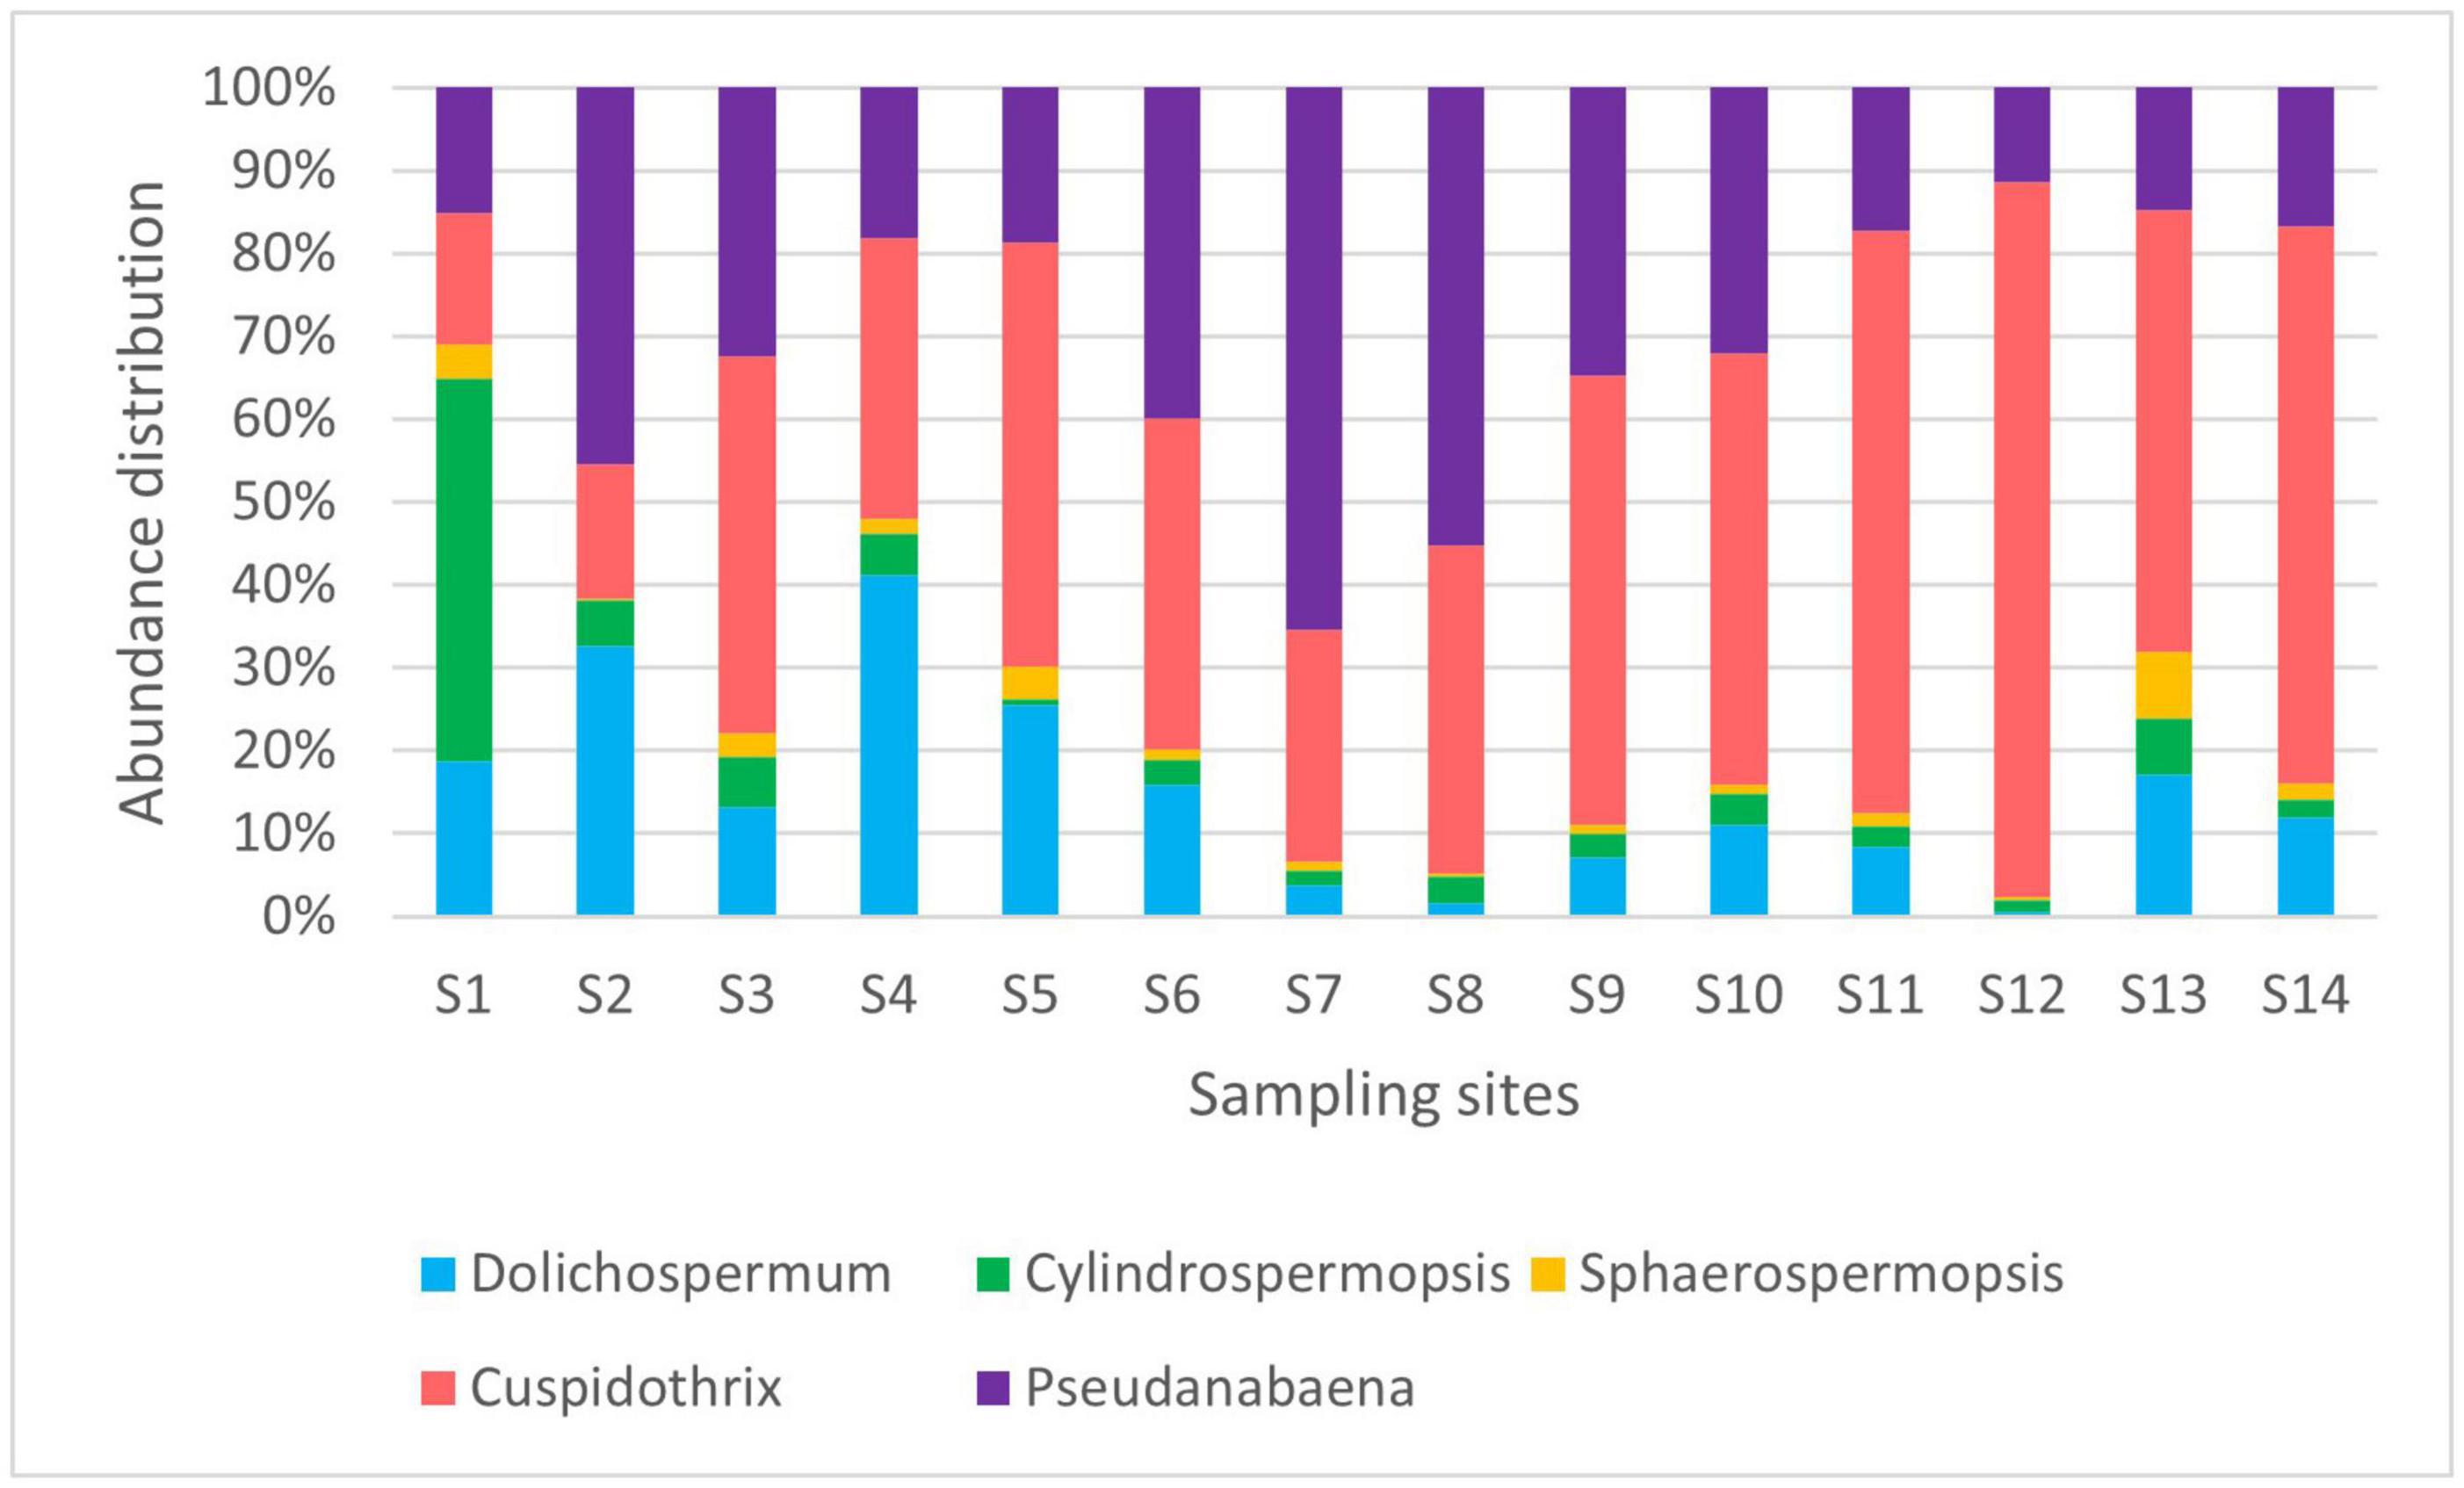
Figure 4. Relative abundances of potentially toxic cyanobacteria (August 2019).
The PCA was conducted with environmental parameters (e.g., pH, temperature, DO, conductivity; NO3–, NH4+) (Figure 5). Two principal components with the highest percentages were shown on the plots, which explained 51.7 and 21.62% of variations. For variance analysis, the appearance of Aphanizomenon/Cuspidotrix sp. was positively correlated with DO (r = 0.612, p < 0.05; Spearman), and Microcystis sp. positively correlated with NH4+ (r = 0.426; Spearman). Moreover, there are significant positive correlation between Dolichospermum, Aphanizomenon/Cuspidotrix, and Pseudoanabaena spp. (r = 0.685; r = 0.765; r = 0.726, p < 0.05, Spearman) which are belonging to ADA-clade (Driscoll et al., 2018; Teikari et al., 2019; Oesterholm et al., 2020), as well as Dolichospermum and Sphaerospermopsis sp. and C. raciborskii (r = 0.726; r = 0.792; p < 0.05, Spearman).
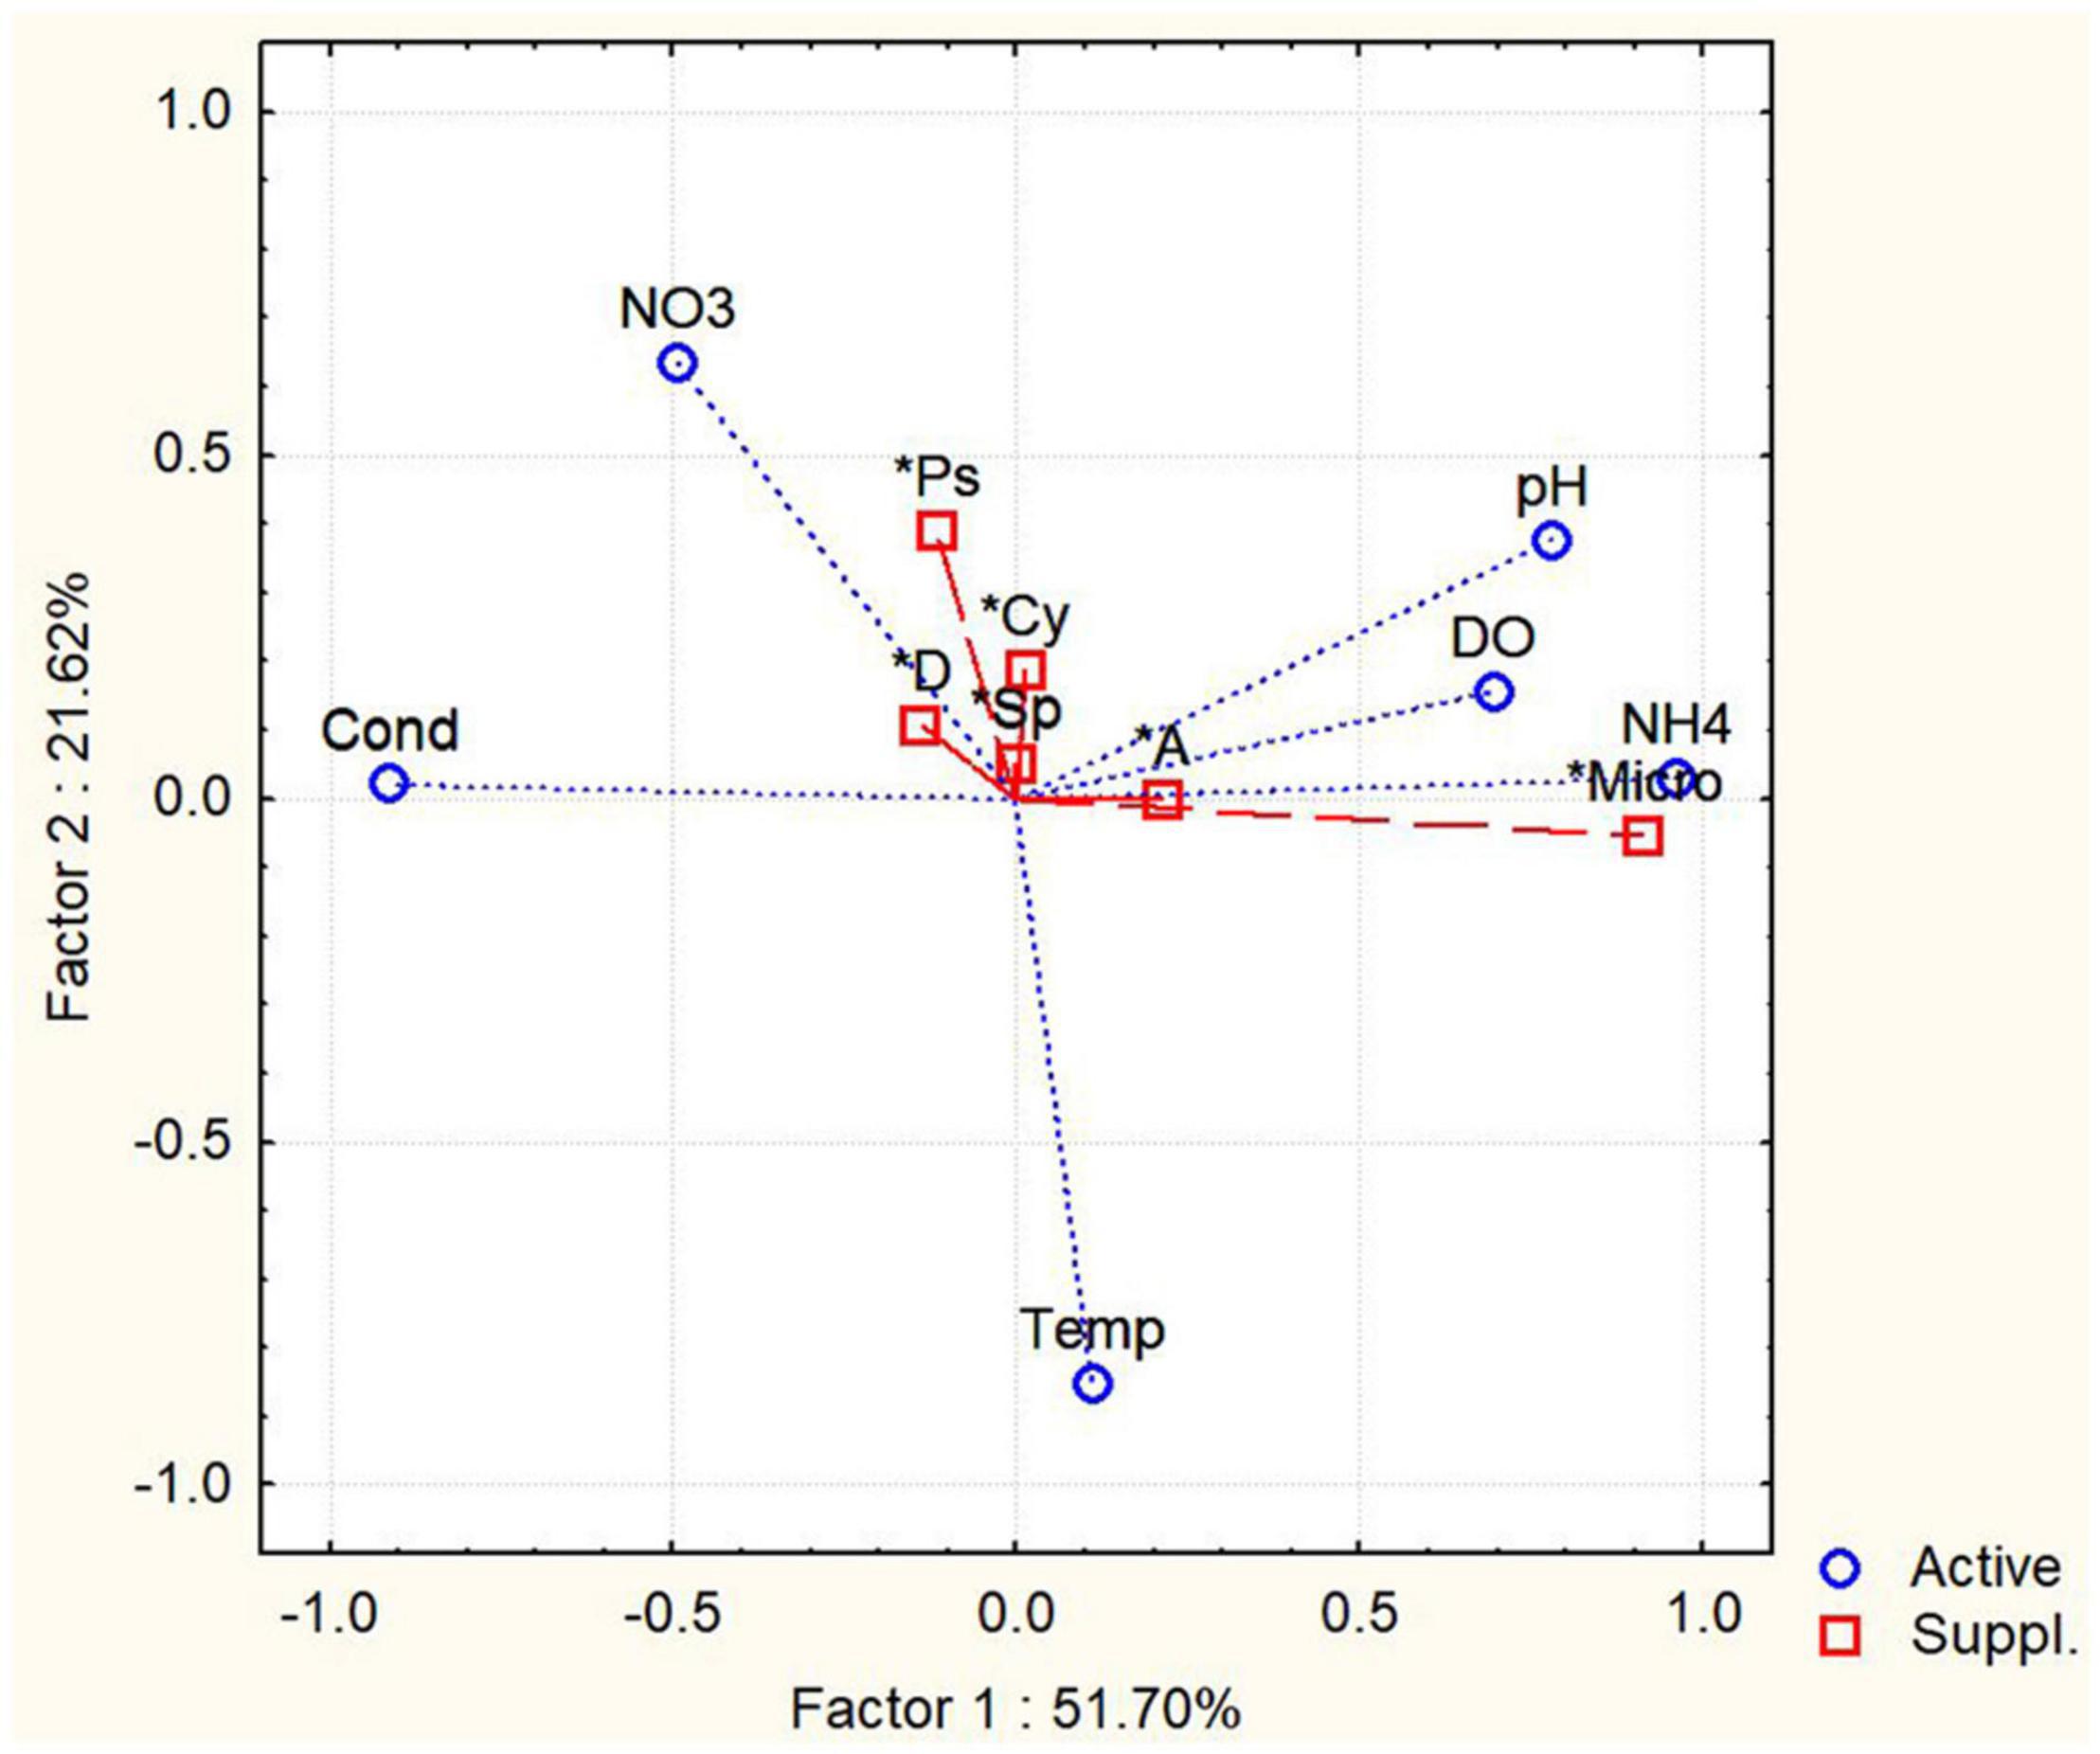
Figure 5. Principal component analysis (PCA) of abundances of potentially toxic cyanobacteria and environmental factors. Temp, temperatures; Cond, conductivity; NO3, concentration of nitrates; NH4, ammonium concentration; Micro, Microcystis sp.; A, Aphanizomenon/Cuspidotrix sp.; D, Dolichospermum sp.; Sp, Sphaerospermopsis sp.; Cy, Cylindrospermopsis raciborskii.
MinION-Based Sequencing
After the sequencing run of 14 h, it resulted in 1,088,000 passed reads with a total yield of 1.6 gigabase pairs of sequencing data. The average sequence length was 1,485 base pairs with an average quality score of 9.29. The 16S amplicon analysis in EPI2ME platform resulted in 896,029 classified reads with an average accuracy of 84%, 864,719 of which were used in the further taxonomic analysis in sample sites S1, S4, and S12. The raw sequences from nanopore-based NGS analysis had a significantly higher error rate compared with short-read sequencers, similar to findings by other researchers (Pfeiffer et al., 2018). Large variations in the raw number of reads between different sampling points were observed. The classification was represented by matches in NCBI database (Altschul et al., 1997), and the number of sequencing reads was interpreted to the estimated relative abundance of species in sample sites of the Ural River. Figure 6 illustrates the relative phylogenetic distribution at the phyla level. The data shows that S1 (Delta) was abundant with cyanobacterial organisms, while the sampling site of S4 (low Peretaska) was mainly inhabited by Proteobacteria and Firmicutes, respectively. A more detailed exploration of cyanobacterial phylum also indicated differences in the distribution within these sites (Figure 7). The species-level identification with cyanobacterial origin yielded from one (S4) up to 63 different matches (S1) in NCBI database. According to relative abundance data of these species, Planktothrix spp. were predominant, and low quantities of Microcystis spp. were also identified at the S12 site. Potentially toxic algae Nodularia spumigena was identified by NGS but not by IFC as the most abundant among cyanobacterial species at S1 (delta) site.
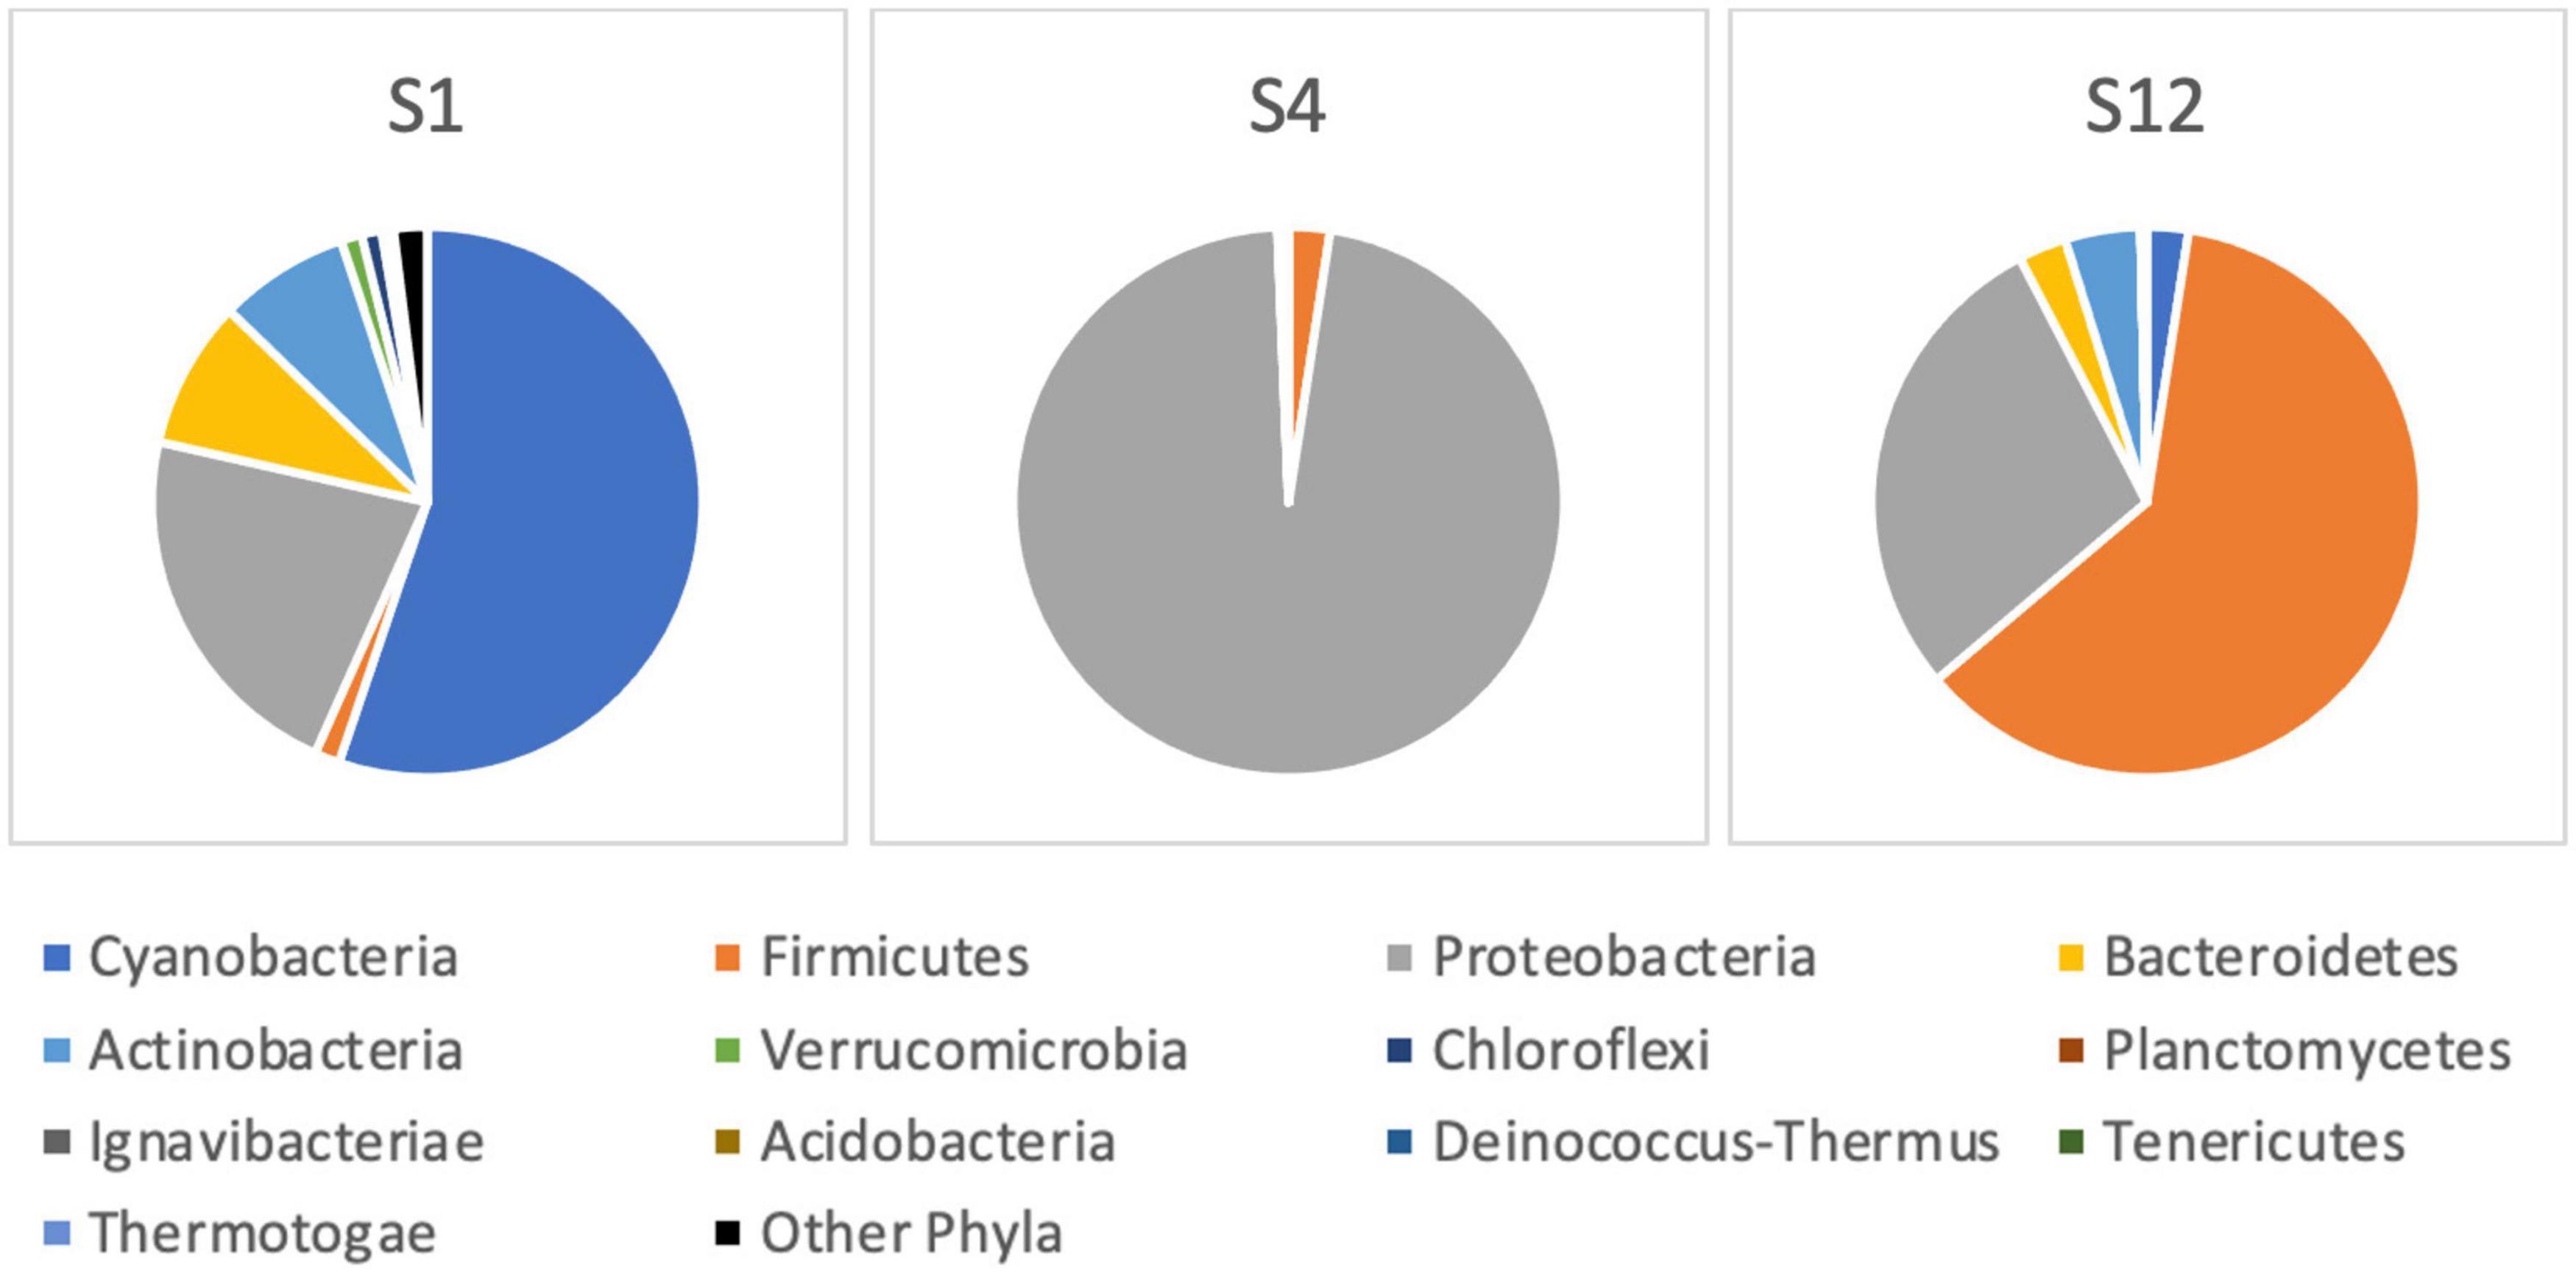
Figure 6. Bacterial community composition at the phylum level based on 16S rRNA next-generation sequencing at the Ural River S1, S4, and S12 sites.
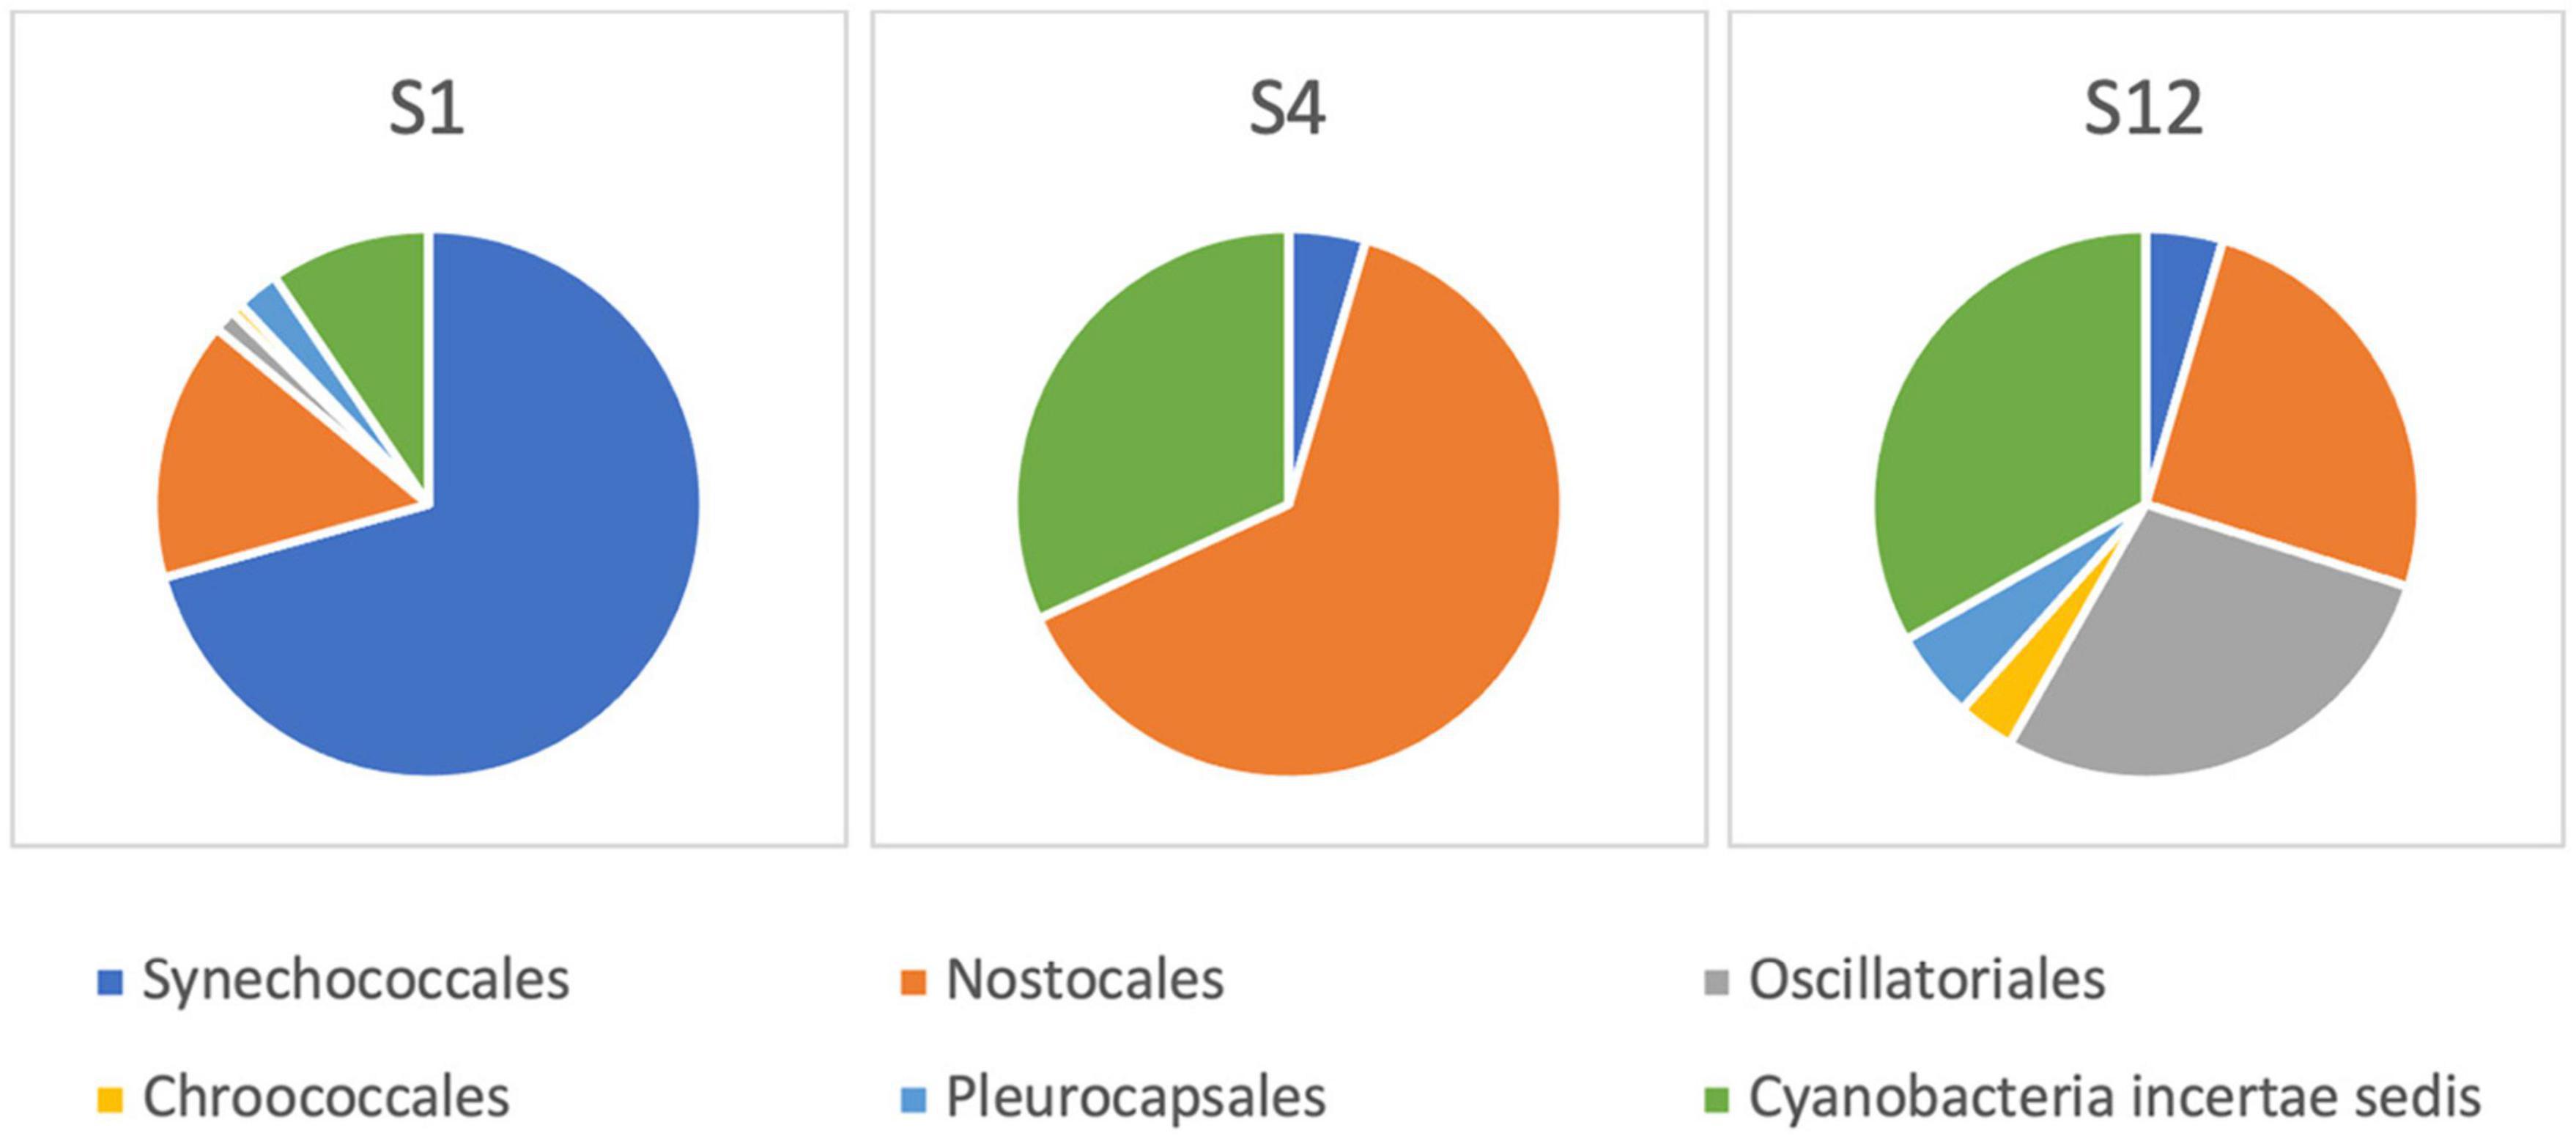
Figure 7. Cyanobacterial community composition based on 16S rRNA next-generation sequencing at the Ural River S1, S4, and S12 sites.
Identification of Toxic Genes in Cyanobacteria Using PCR Methods
Polymerase-chain reaction analysis was used to identify Microcystis-specific mcyE gene according to the primer design provided by Vaitomaa et al. (2003). The genome assembly of M. aeruginosa NIES-843 (Kaneko et al., 2007) was used to find an expected sequence of PCR products. Its size was 247 base pairs, and only S12 sample had a corresponding significant band. The semi-quantitative analysis by SYBR Green I real-time PCR revealed the presence of this gene in sample sites S1 and S12, assessed by the similar melt peak as in positive control. The relative gene abundance data was standardized (ratio-based) by concentration of input DNA extract. Sample S1 contained 2.05-fold more mcyE gene per nanograms of total DNA than the S12 sample.
The PCR amplification of the sxtA gene had an expected size of 148 base pairs (Rantala-Ylinen et al., 2011) and only sample S13 showed the positive band in the following size range. To validate the presence of this toxin production gene, the real-time PCR analysis was performed with positive control of standards from multiplex qPCR kit (Phytoxigene CyanoDTecTM Toxin Genes Test; Diagnostic Technology, United States). The results showed specific amplification of the sxtA gene only in sample S13. The relative sxtA gene abundance in site S13 was considerably small with a 1.23 × 10⁻⁴-fold difference, when compared with positive control. However, as the positive control from the kit had a known concentration of 100,000 copies/μl, it allowed us to estimate the concentration in S13 sample to 36.8 copies per μl of the extracted total DNA sample.
The presence of cylindrospermopsin (cyrA) and anatoxin (anaC) genes was not identified by the abovementioned PCR methods. To sum up, the mcyE was detected at the environmental samples from S1 and S12 sample sites, below Makhambet village, and the delta of Ural River location, respectively, and sxtA gene was detected at S13, upper Makhambet site.
Sanger Sequencing of PCR Products
Polymerase-chain reaction products were purified and sequenced using the forward primer of Microcystis-specific mcyE gene (Evrogen, Moscow, Russian Federation). Resulted sequence data for S1 and S12 are presented in Table 2. Sequencing of samples from S4, S6, and S13 sites did not produce any DNA data of cyanobacterial origin.
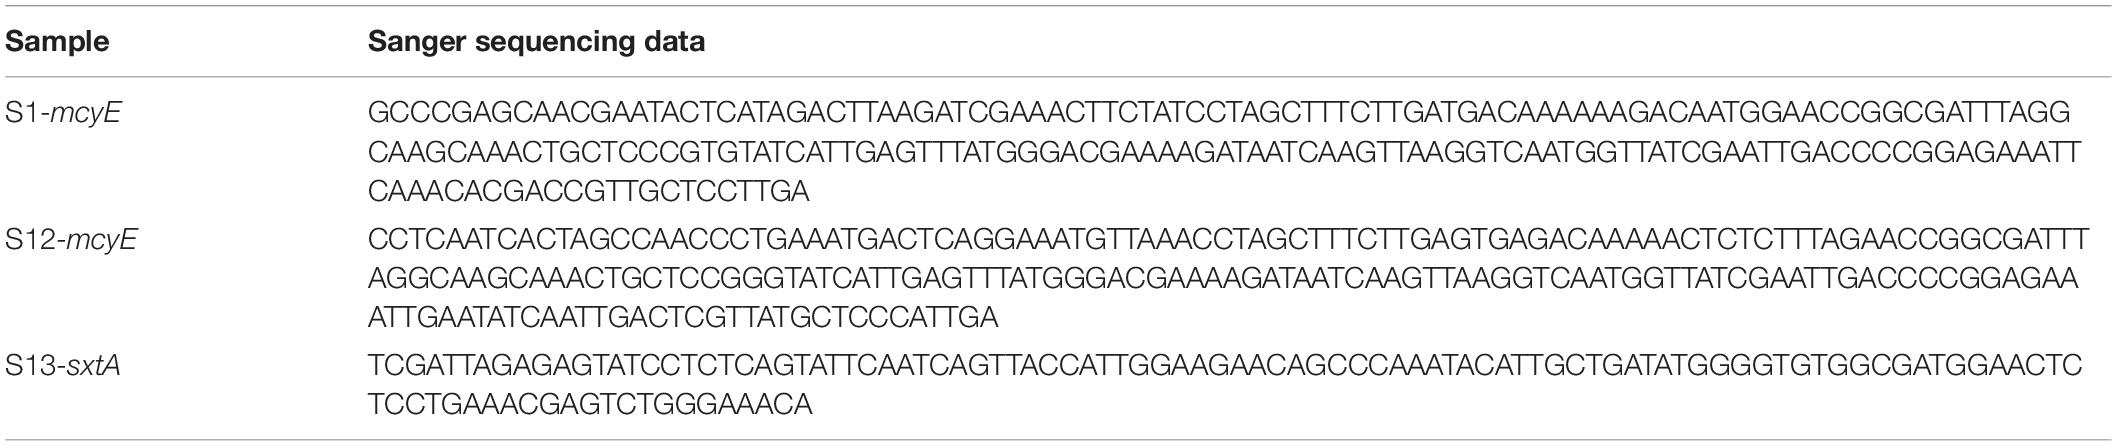
Table 2. List of DNA sequences of PCR products from Ural River sampling sites.
Sequence data was analyzed via BLAST algorithm, and the best matches for the two sites are shown in Table 3. The sequence homology analysis in NCBI nucleotide database revealed that PCR products from Ural delta (S1) and low Makhambet (S12) matched with Microcystis-specific mcyE gene with a percentage identity between 88 and 96%, and S13 sample (upper Makhambet) matched with ADA-clade spp. sxtA gene (99%).
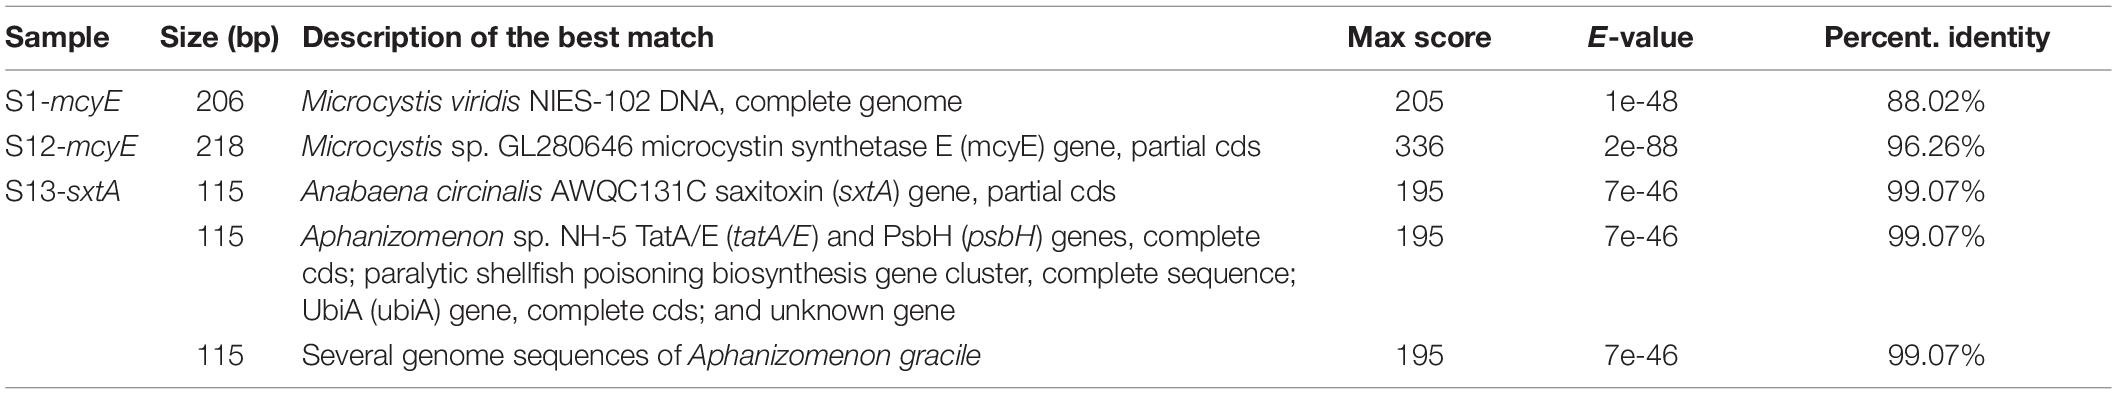
Table 3. Origin and identification of mcyE and sxtA genes in environmental samples from the Ural River.
Discussion
CyanoHABs are very complex phenomena and early detection and tracking cyanotoxin producers and predicting of the bloom dynamics remain as unsolved challenges for water managers and aquaculture farmers. From December 2018 through March 2019, the significant mortality of farmed sturgeon and other fish species were reported in the Ural River near the town of Atyrau, Kazakhstan, with initial findings of dead fish in the artificial duct of the Peretaska channel, which supplies water to the local power plant and oil refinery. The Peretaska duct was an initial point of a huge fish die-off on the Ural River and aquaculture fish farms in December 2018 (>100 tons of artificially grown sturgeon), and a small fish die-off was observed in December 2019. The temperature anomaly registered by Landsat 8 in this area (Figures 3A,B,D) is supported by in situ measurements of water temperature in the Peretaska duct below the oil refinery and cogeneration plant. The decrease in temperature in March 2019 coincides with a temporary interruption to the biological treatment plant at the oil refinery due to preventive maintenance (Figure 3C). The thermal discharge from power plants leads to an elevation in temperature of the receiving waters (Li et al., 2011) and promotes phytoplankton growth and algal blooms, particularly in cold seasons (Hickman and Klarer, 1975; Jiang et al., 2012, 2019a, b). Thermal discharge plumes near power plants are thermally dynamic environments with strong influences on aquatic organisms. Many scientists report decreasing diversity of aquatic communities, functional and species richness, and even large mortality events of benthos invertebrates near discharge sites or in discharge channels (Suresh et al., 1993; Chuang et al., 2009; Teixeira et al., 2009; de Szechy et al., 2017; Lee et al., 2018; Khosravi et al., 2019). It seems that a shift in temperature is more important than exact temperature numbers, emphasizing a possible role of toxins in quorum sensing. The number of different toxins may increase with changes in growth conditions and temperature shifts (Kleinteich et al., 2012).
In our field expedition, we found a number of potentially toxic cyanobacteria species originally using FlowCAM-based IFC (supported by light microscopy), including invasive C. raciborskii, along all of the 100-km stretch of the Ural River–from the delta S1 sampling point up to S14. C. raciborskii is a cyanobacterium species with a well-known invasive origin (Padisák, 1997; Moreira et al., 2011), and causes increasing concern because of its potential toxicity (Briand et al., 2004). The presence of C. raciborskii was occasionally reported in the region close to the Northern Caspian Sea (Kazakhstan) starting in the twentieth century (Padisák, 1997). However, in the current study, we did not identify the presence of genes encoding cylindrospermopsin in the field samples.
The cyanobacterial blooms are often composed from non-toxic and toxic strains within morphologically identical species, and the reports of multicyanotoxin co-occurrence are becoming increasingly common (Graham et al., 2010; Pitois et al., 2018). The initial choice of detailed analysis of sampling points for the presence of toxic algae was made with IFC, followed by NGS and PCR-based molecular methods. We choose to use a combination of optical methods (IFC) and NGS because the classical optical-based morphological methods may not provide sufficient identification resolution (Eiler et al., 2013; Xiao et al., 2014; Zimmerman et al., 2015; Dzhembekova et al., 2017; Parulekar et al., 2017). Moreover, the traditional cyanobacterial taxonomy has been based on morphological features, but this classification is revised with an accumulation of molecular sequence data (Komárek et al., 2014; Hugenholtz et al., 2021). The taxonomic classification was done with a 16S NCBI database, however, the choice of database may have an effect on the results of taxonomic identification (Park and Won, 2018; Rizal et al., 2020; Winand et al., 2020). Metabarcoding based on 16S rRNA gene revealed a moderately diverse cyanobacterial community at S12 and S1 sampling points, and only a few cyanobacterial species were found at the S4 point (Figure 6) where the heated water stream of the artificial Peretaska channel (30°C, October 2019) was represented mostly by Proteobacteria and Firmicutes. Proteobacteria are always present in high-temperature ecosystems and often the dominating phylum in hot springs (Chan et al., 2017; Panda et al., 2017; Adjeroud et al., 2020), as the diversity and richness of microbial communities in thermal springs are negatively affected by temperature (Chan et al., 2017). In the winter, due to the thermal discharge, the temperature in the Peretaska channel remains high (26°C; December 2019); however, it becomes more permissible for cyanobacteria and other microalgae, which may lead to algal blooming. Temperature increase caused by thermal discharge from power plants may promote phytoplankton growth and blooms, particularly in cold seasons (Jiang et al., 2019a, b).
The structure of the cyanobacterial distribution in the field samples defined by NGS analysis suggested the predominance of filamentous Planktothrix sp. and N. spumigena in the brackish S1 sampling point. NGS results together with IFC confirmed a predominant presence of Planktothrix sp. as well as the presence of low abundant Microcystis sp. at the S12 sampling point (low Makhambet). Although there are still common concerns about the nanopore-technology accuracy, mobile sequencing with MinION has already been transformative for bacterial and viral pathogen outbreaks (Quick et al., 2015, 2016; Boykin et al., 2019) and in the context of freshwater analysis (Reddington et al., 2020). We used MinION-based sequencing to complement IFC information on the presence of potentially toxic cyanobacteria at sampling points and found that nanopore amplicon sequencing allowed us to get extended information about the presence of even minor quantities of cyanobacterial genera. Thus, at the S1 sampling point, the predominance of Planktothrix sp. and a presence of minor quantities of N. spumigena were confirmed by 16S rRNA gene metagenomics, but not by IFC. However, a number of experimental intricacies should be addressed using this approach related to the DNA extraction yields and sample filtrate volumes and database incompleteness that can be curated by adding local species (Abad et al., 2016).
As 16S rRNA-based NGS only provides identification of potentially toxic algae, PCR was required to confirm the presence of toxigenic cyanobacteria species utilizing toxin synthesis genes. Field samples from S12 and S13 (near Makhambet village) demonstrated the presence of strains expressing mcyE or sxtA genes identified by traditional and real-time PCR. Data from real-time PCR as well as data from Sanger sequencing suggested that low abundant Microcystis sp. was the only microcystin producer at the S12 sampling point (low Makhambet), and toxigenic ADA-clade spp. were detected at S13 (upper Makhambet) sampling point (Figure 4 and Table 3). This is in line with other studies, which found that the ADA-clade is a highly significant component of cyanobacterial HABs (Dreher et al., 2021), and dominant microcystin producer is not necessarily the predominant cyanobacterial species in the water stream (Dadheech et al., 2014; Lee et al., 2015; Scherer et al., 2017). In summary, our study demonstrates that potentially toxic cyanobacteria including toxigenic strains widely distributed in Ural River waters. We hypothesize that the presence of potentially toxigenic cyanobacteria in side channels of the Ural River can lead to yearly seasonal fish kills depending on the floods dynamics and winter temperature shifts.
After our manuscript submission to the journal, another fish kill happened in this region (May 02–09, 2021; Baksay) (in the water bodies temporarily connected to Ural River main stream during spring river flooding). The results of UHPLC/DAD analysis of water samples taken a few days later confirmed the presence of MC-LR and nodularin in the water probes (Supplementary File 2).
Conclusion
During our field study of the Ural River in August–December 2019, we documented the occurrence of potentially toxigenic cyanobacteria in Ural River from the brackish-water delta up to 100 km. Aphanizomenon/Cuspidothrix spp., Dolichospermum spp. (most likely D. cf. flos-aquae and D. cf. macrosporum), and, in some locations, Planktothrix sp. and Microcystis sp. were dominant phytoplankton species, and we also found minor quantities of C. raciborskii. The presence in the field samples of toxigenic genotypes (mcyE+, sxtA+) was confirmed by real-time PCR and Sanger sequencing. The complementary analysis with nanopore sequencing showed potential for using portable and fast NGS for real-time monitoring and research of harmful algae, but currently, a taxonomic identification is still limited by the availability of suitable databases and cost. A combination of IFC with molecular methods demonstrates a potential for monitoring algal blooms and can lay a foundation for addressing these risks in aquaculture and river management of the Ural River region. We, therefore, suggest that the monitoring of toxic algae levels in the Ural River should continue based on the potential of combined IFC and NGS approach among others and on the construction of Ural River-specific database of toxigenic cyanobacteria taxa.
Data Availability Statement
The datasets presented in this study can be found in online repositories. The names of the repository/repositories and accession number(s) can be found below: NCBI BioProject [accession: PRJNA714785].
Author Contributions
AAbd, KuS, YM, and NB conducted the field expeditions, collected and analyzed data, and contributed to the funding acquisition. YM, AAbd, KuS, KaS, DP, IV, DM, and NB performed the methodology. YM, KuS, AAbd, AAbi, KaS, DP, GA, ZI, IV, DM, and NB contributed to the data curation and data analysis. KaS contributed to the satellite data analysis. NB performed the supervision of the project. NB and YM wrote a first draft of the manuscript. All of the authors wrote, read, edited, and reviewed a manuscript.
Funding
The study was funded by Nazarbayev University grant FDCRGP #110119FD4513 to NB and a research grant to AAbd and KuS from FRIP Program of Young Researchers Alliance. DM was partly working under FPGEC Interdisciplinary Scientific and Educational School of MSU, and IV was supported by MES #AP05134153/GF4.
Conflict of Interest
The authors declare that the research was conducted in the absence of any commercial or financial relationships that could be construed as a potential conflict of interest.
Acknowledgments
We are indebted to Zhasulan Kuzhekov (passed away in January 2020) for his help with field expeditions to Ural River. We are very grateful to the Core Facilities of Nazarbayev University for access to instrumentation, to Yekaterina Dyachenko from Bioline for help with Leica software, and to Veronika Dashkova, Nazarbayev University for training AAbd on FlowCAM imaging cytometer.
Supplementary Material
The Supplementary Material for this article can be found online at: https://www.frontiersin.org/articles/10.3389/fmars.2021.680482/full#supplementary-material
References
Abad, D., Albaina, A., Aguirre, M., Laza-Martínez, A., Uriarte, I., Iriarte, A., et al. (2016). Is metabarcoding suitable for estuarine plankton monitoring? A comparative study with microscopy. Mar. Biol. 163, 1–13. doi: 10.1007/s00227-016-2920-0
Adjeroud, M., Escuder-Rodriguez, J.-J., Gonzalez-Siso, M.-I., and Kecha, M. (2020). Metagenomic investigation of bacterial and archaeal diversity of Hammam Essalihine hot spring from Khenchela, Algeria. Geomicrobiol. J. 37, 804–817. doi: 10.1080/01490451.2020.1783035
Al-Tebrineh, J., Pearson, L. A., Yasar, S. A., and Neilan, B. A. (2012). A multiplex qPCR targeting hepato-and neurotoxigenic cyanobacteria of global significance. Harmful Algae 15, 19–25. doi: 10.1016/j.hal.2011.11.001
Altschul, S. F., Madden, T. L., Schäffer, A. A., Zhang, J., Zhang, Z., Miller, W., et al. (1997). Gapped BLAST and PSI-BLAST: a new generation of protein database search programs. Nucleic Acids Res. 25, 3389–3402. doi: 10.1093/nar/25.17.3389
Anderson, D. M., Cembella, A. D., and Hallegraeff, G. M. (2012). Progress in understanding harmful algal blooms paradigm shifts and new technologies for research, monitoring, and management. Annu. Rev. Mar. Sci. 4, 143–176. doi: 10.1146/annurev-marine-120308-081121
Antonella, P., and Luca, G. (2013). The quantitative real-time PCR applications in the monitoring of marine harmful algal bloom (HAB) species. Environ. Sci. Pollut. Res. 20, 6851–6862. doi: 10.1007/s11356-012-1377-z
Babanazarova, O., Sideley, S., and Schischeleva, S. (2013). The structure of winter phytoplankton in Lake Nero, Russia, a hypertrophic lake dominated by Planktothrix-like Cyanobacteria. Aquat. Biosyst. 9:18. doi: 10.1186/2046-9063-9-18
Ballot, A., Scherer, P. I., and Wood, S. A. (2018). Variability in the anatoxin gene clusters of Cuspidothrix issatschenkoi from Germany, New Zealand, China and Japan. PLoS One 13:e0200774.
Barsi, J. A., Barker, J. L., and Schott, J. R. (2003). “An atmospheric correction parameter calculator for a single thermal band earth-sensing instrument,” in Proceedings of the IGARSS 2003 International Geoscience and Remote Sensing Symposium, Toulouse. doi: 10.1109/igarss.2003.1294665
Boykin, L. M., Sseruwagi, P., Alicai, T., Ateka, E., Mohammed, I. U., and Stanton, J. L. (2019). Tree lab: portable genomics for early detection of plant viruses and pests in Sub-Saharan Africa. Genes 10:632. doi: 10.3390/genes10090632
Briand, J. F., Leboulanger, C., Humbert, J. F., Bernard, C., and Dufuor, P. (2004). Cylindrospermopsis raciborskii (Cyanobacteria) invasion at mid-latitudes: selection, wide physiological tolerance, or global warming? J. Phycol. 40, 231–238. doi: 10.1111/j.1529-8817.2004.03118.x
Bruno, M., Ploux, O., Metcalf, J. S., Mejean, A., Pawlik-Skowronska, B., and Furey, A. (2016). “Anatoxin-a, Homoanatoxin-a, and Natural Analogues,” in Handbook of Cyanobacterial Monitoring and Cyanotoxin Analysis, eds J. Meriluoto, L. Spoof, and G. A. Codd (Chichester: Wiley & Sons), 138–147.
Burton, A. S., Stahl, S. E., John, K. K., Jain, M., Juul, S., Turner, D. J., et al. (2020). Off Earth identification of bacterial populations using 16S rDNA nanopore sequencing. Genes 11:76. doi: 10.3390/genes11010076
Buskey, E. J., and Hyatt, C. J. (2006). Use of the FlowCAM for semi-automated recognition and enumeration of red tide cells (Karenia brevis) in natural plankton samples. Harmful Algae 5, 685–692. doi: 10.1016/j.hal.2006.02.003
Campbell, L., Henrichs, D. W., Olson, R. J., and Sosik, H. M. (2013). Continuous automated imaging-in-flow cytometry for detection and early warning of Karenia brevis blooms in the Gulf of Mexico. Environ. Sci. Pollut. Res. 20, 6896–6902. doi: 10.1007/s11356-012-1437-4
Campbell, L., Olson, R. J., Sosik, H. M., Abraham, A., Henrichs, D. W., Hyatt, C. J., et al. (2010). First harmful Dinophysis (Dinophyceae, Dinophysiales) bloom in the US is revealed by automated imaging flow cytometry. J. Phycol. 46, 66–75. doi: 10.1111/j.1529-8817.2009.00791.x
Carmichael, W. W. (2008). A world overview – one hundred twenty seven years of research on toxic cyanobacteria–where do we go from here? Adv. Exp. Med. Biol. 619, 105–125.
Castro-Wallace, S. L., Chiu, C. Y., John, K. K., Stahl, S. E., Rubins, K. H., McIntyre, A. B. R., et al. (2017). Nanopore DNA sequencing and genome assembly on the International Space Station. Sci. Rep. 7:18022. doi: 10.1038/s41598-017-18364-0
Chan, C. S., Chan, K.-G., Ee, R., Hong, K.-W., Urbieta, M. S., Donati, E. R., et al. (2017). Effects of physico-chemical factors on prokaryotic biodiversity in Malaysian circumneutral hot springs. Front. Microbiol. 8:2152. doi: 10.3389/fmicb.2017.01252
Chander, G., and Markham, B. (2003). Revised Landsat-5 TM radiometric calibration procedures and postcalibration dynamic ranges. IEEE Transact. Geosci. Remote Sens. 41, 2674–2677. doi: 10.1109/TGRS.2003.818464
Chander, G., Markham, B. L., and Helder, D. L. (2009). Summary of current radiometric calibration for Landsat MSS, TM, ETM+, and EO-1 ALI sensors. Remote Sens. Environ. 113, 893–903. doi: 10.1016/j.rse.2009.01.007
Chernova, E., Sidelev, S., Russkikh, I., Voyakina, E., and Zhakovskaya, Z. (2019). First observation of microcystin- and anatoxin-producing cyanobacteria in the easternmost part of the Gulf of Finland (the Baltic Sea). Toxicon 157, 18–24. doi: 10.1016/j.toxicon.2018.11.005
Chuang, Y.-L., Yang, H.-H., and Lin, H.-J. (2009). Effects of a thermal discharge from a nuclear power plant on phytoplankton and periphyton in subtropical coastal waters. J. Sea Res. 61, 197–205. doi: 10.1016/j.seares.2009.01.001
Codd, G. A., Lindsay, J., Young, F. M., Morrison, L. F., and Metcalf, J. S. (2005). “Harmful cyanobacteria,” in Harmful Cyanobacteria, eds J. Huisman, H. C. P. Matthijs, and P. M. Visser (Dordrecht: Springer).
Dadheech, P. K., Selmeczy, G. B., Vasas, G., Padisák, J., Arp, W., Tapolczai, K., et al. (2014). Presence of potential toxin-producing cyanobacteria in an oligo-mesotrophic lake in Baltic Lake District, Germany: an ecological, genetic and toxicological survey. Toxins 6, 2912–2931. doi: 10.3390/toxins6102912
Dashkova, V., Malashenkov, D., Poulton, N., Vorobjev, I., and Barteneva, N. (2017). Imaging flow cytometry for phytoplankton analysis. Methods 112, 188–200. doi: 10.1016/j.ymeth.2016.05.007
De Pace, R., Vita, V., Bucci, M. S., Gallo, P., and Bruno, M. (2014). Microcystin contamination in sea mussel farms from the Italian Southern Adriatic Coast following cyanobacterial blooms in an artificial reservoir. J. Ecosystems 2014:374027. doi: 10.1155/2014/374027
de Szechy, M. T. M., de Souza Koutsoukos, V., and de Moura Barboza, C. (2017). Long-term decline of brown algal assemblages from southern Brazil under the influence of a nuclear power plant. Ecol. Indic. 80, 258–267. doi: 10.1016/j.ecolind.2017.05.019
Dierks-Horn, S., Metfies, K., Jaeckel, S., and Medlin, L. K. (2011). The ALGADEC device: a semi-automated rRNA biosensor for the detection of toxic algae. Harmful Algae 10, 395–401. doi: 10.1016/j.hal.2011.02.001
Dreher, T. W., Davis, E. W. II, and Mueller, R. S. (2021). Complete genomes derived by directly sequencing freshwater bloom populations emphasize the significance of the genus level ADA clade within the Nostocales. Harmful Algae 103:102005. doi: 10.1016/j.hal.2021.102005
Driscoll, C. B., Meyer, K. A., Šulčius, S., Brown, N. M., Dick, G. J., Timinskas, A., et al. (2018). A closely-related clade of globally distributed bloom-forming cyanobacteria within the Nostocales. Harmful Algae 77, 93–107. doi: 10.1016/j.hal.2018.05.009
Dzhembekova, N., Urusizaki, S., Moncheva, S., and Ivanova, P. (2017). Applicability of massively parallel sequencing on monitoring harmful algae at Varna Bay in the Black Sea. Harmful Algae 68, 40–51. doi: 10.1016/j.hal.2017.07.004
Eiler, A., Drakare, S., Bertilsson, S., Pernthaler, J., Peura, S., Rofner, C., et al. (2013). Unveiling distribution patterns of freshwater phytoplankton by a next generation sequencing based approach. PLoS One 8:e53516. doi: 10.1371/journal.pone.0053516
Eriksson, J. E., Meriluoto, J. A. O., and Lindholm, T. (1986). “Can cyanobacterial toxins accumulate in aquatic food chains,” in Proceedings of the 4th International Symposium on Microbial Ecology, Ljubliana, 655–658.
Fernandes-Salvador, J. A., Davidson, K., Sourisseau, M., Revilla, M., Schmidt, W., Clarke, D., et al. (2021). Current status of forecasting toxic harmful algae for the North-East Atlantic shellfish aquaculture industry. Front. Mar. Sci. 8:666583. doi: 10.3389/fmars.2021.666583
Fortin, N., Munoz-Ramos, V., Bird, D., Lévesque, B., Whyte, L. G., and Greer, C. W. (2015). Toxic cyanobacterial bloom triggers in Missisquoi Bay, Lake Champlain, as determined by next-generation sequencing and quantitative PCR. Life 5, 1346–1380. doi: 10.3390/life5021346
Foulds, I. V., Granacki, A., Xiao, C., Krull, U. J., Castle, A., and Horgen, P. A. (2002). Quantification of microcystin-producing cyanobacteria and E. coli in water by 5’-nuclease PCR. J. Appl. Microbiol. 93, 825–834.
GEOHAB (2001). “Global ecology and oceanography of harmful algal blooms programme,” in Science Plan, eds P. Glibert and G. Pitcher (Baltimore, MD: SCOR).
Gibble, C. M., Peacock, M. B., and Kudela, R. M. (2016). Evidence of freshwater algal toxins in marine shellfish: implications for human and aquatic health. Harmful Algae 59, 59–66. doi: 10.1016/j.hal.2016.09.007
Gowers, G.-O. F., Vince, O., Charles, J.-H., Klarenberg, I., Ellis, T., and Edwards, A. (2019). Entirely off-grid and solar-powered DNA sequencing of microbial communities during an ice cap traverse expedition. Genes 10:902. doi: 10.3390/genes10110902
Graham, J. L., Loftin, K. A., Meyer, M. T., and Ziegler, A. C. (2010). Cyanotoxin mixtures and taste-and-odor compounds in cyanobacterial blooms from the Midwestern United States. Environ. Sci. Technol. 44, 7361–7368. doi: 10.1021/es1008938
Graham, M. D., Cook, J., Graydon, J., Kinniburgh, D., Nelson, H., Pilieci, S., et al. (2018). High-resolution imaging particle analysis of freshwater cyanobacterial blooms. Limnol. Oceanogr. Methods 16, 669–679. doi: 10.1002/lom3.10274
Greenacre, M., and Primicerio, R. (2013). Multivariate Analysis of Ecological Data. (Bilbao: Foundacion BBVA), 331.
Griffith, A. W., and Gobler, C. J. (2020). Harmful algal blooms: a climate change co-stressor in marine and freshwater ecosystems. Harmful Algae 91:101590. doi: 10.1016/j.hal.2019.03.008
Hatfield, R. G., Batista, F. M., Bean, T. P., Fonseca, V. G., Santos, A., Turner, A. D., et al. (2020). The application of Nanopore sequencing technology to the study of Dinoflagellates: a proof-of-concept study for rapid sequence-based discrimination of potentially harmful algae. Front. Microbiol. 11:844. doi: 10.3389/fmicb.2020.00844
Heisler, J., Glibert, P. M., Burkholder, J. M., Andersond, D. M., Cochlane, W., Dennison, W. C., et al. (2008). Euthrophication and harmful algal blooms: a scientific consensus. Harmful Algae 8, 3–13. doi: 10.1016/j.hal.2008.08.006
Hickman, M., and Klarer, D. M. (1975). The effect of the discharge of thermal effluent from a power station on the primary productivity of an epiphytic algal community. Br. Phycol. J. 10, 81–91. doi: 10.1080/00071617500650081
Hugenholtz, P., Chuvochina, M., Oren, A., Paks, D. H., and Soo, R. M. (2021). Prokaryotic taxonomy and nomenclature in the age of big sequence data. ISME J. doi: 10.1038/s41396-021-00941-x [Epub ahead of print].
Humpage, A. R., Rositano, J., Bretag, A. H., Brown, R., Baker, P. D., Nicholson, B. C., et al. (1984). Paralytic shellfish poisons from Australian cyanobacterial blooms. Aust. J. Mar. Freshw. Res. 45, 761–771.
Jeppesen, E., Søndergaard, M., and Liu, Z. (2017). Lake restoration and management in a climate change perspective: an introduction. Water 9:122. doi: 10.3390/w9020122
Jiang, Z.-B., Chen, Q.-Z., Zeng, J.-N., Liao, Y.-B., Shou, L., and Liu, J. (2012). Phytoplankton community distribution in relation to environmental parameters in three aquaculture systems in a Chinese subtropical euthrophic bay. Mar. Ecol. Progr. Ser. 446, 73–89. doi: 10.3354/meps0949
Jiang, Z., Du, P., Liao, Y., Lio, Q., Chen, Q., Shou, L., et al. (2019a). Oyster farming control on phycoplankton bloom promoted by thermal discharge from a power plant in a eutrophic, semi-enclosed bay. Water Res. 159, 1–9. doi: 10.1016/j.watres.2019.04.023
Jiang, Z., Gao, Y., Chen, Y., Du, P., Zhu, X., Liao, Y., et al. (2019b). Spatial heterogeneity of phytoplankton community shaped by a combination of anthropogenic and natural forcings in a long narrow bay in the East China Sea. Eastuar. Coast. Shelf Sci. 217, 250–261. doi: 10.1016/j.ecss.2018.11.028
Joehnk, K. D., Huisman, J., Sharples, J., Sommeijer, B., Visser, P. M., and Stroom, J. M. (2008). Summer heatwaves promote blooms of harmful cyanobacteria. Glob. Change Biol. 14, 495–512. doi: 10.1111/j.1365-2486.2007.01510.x
Johnson, S. S., Zaikova, E., Goerlitz, D. S., Bai, Y., and Tighe, S. W. (2017). Real-time DNA sequencing in the Antarctic dry valleys using the Oxford Nanopore sequencer. J. Biomol. Tech. 28, 2–7. doi: 10.7171/jbt.17-2801-009
Kaneko, T., Nakajima, N., Okamoto, S., Suzuki, I., Tanabe, Y., Tamaoki, M., et al. (2007). Complete genomic structure of the bloom-forming toxic cyanobacterium Microcystis aeruginosa NIES-843. DNA Res. 14, 247–256. doi: 10.1093/dnares/dsm026
Kazhydromet Climate Monitoring Bulletin (2016). www.kazhydromet.kz (russ.)
Khosravi, M., Nasrolahi, A., Shokri, M. R., Dobretsov, S., and Pansch, C. (2019). Impact of warming on biofouling communities in the Northern Persian Gulf. J. Thermal Biol. 85:102403. doi: 10.1016/j.jtherbio.2019.102403
Kleinteich, J., Wood, S. A., Küpper, F. C., Camacho, A., Quesada, A., Frickey, T., et al. (2012). Temperature-related changes in polar cyanobacterial mat diversity and toxin production. Nat. Clim. Change 2, 356–360. doi: 10.1038/nclimate1418
Komárek, J., Kaštovský, J., Mareš, J., and Johansen, J. (2014). Taxonomic classification of cyanoprokaryotes (cyanobacterial genera) 2014, using a polyphasic approach. Preslia 86, 295–335.
Kurmayer, R., and Christiansen, G. (2010). The genetic basis of toxin production in cyanobacteria. Freshw. Rev. 2, 31–50. doi: 10.1608/FRJ-2.1.2
Kurobe, T., Lehman, P. W., Haque, M. E., Sedda, T., Lesmeister, S., and Teh, S. (2018). Evaluation of water quality during successive severe drought years within Microcystis blooms using fish embryo toxicity tests for the San Francisco Estuary, California. Sci. Total Environ. 610-611, 1029–1037. doi: 10.1016/j.scitotenv.2017.07.267
Lee, P. W., Tseng, L.-C., and Hwang, J.-S. (2018). Comparison of mesozooplankton mortality impacted by the cooling systems of two nuclear power plants at the northern Taiwan coast, southern East China Sea. Mar. Pollut. Bull. 136, 114–124. doi: 10.1016/j.marpolbul.2018.09.003
Lee, T. A., Rollwagen-Bollens, G., Bollens, S. M., and Faber-Hammond, J. J. (2015). Environmental influence on cyanobacteria abundance and microcystin toxin production in a shallow temperate lake. Ecotoxicol. Environ. Saf. 114, 318–325. doi: 10.1016/j.ecoenv.2014.05.004
Lehman, P. W., Kurobe, T., Lesmeister, S., Baxa, D., Tung, A., and Teh, S. J. (2017). Impacts of the 2014 severe drought on the Microcystis bloom in San Francisco estuary. Harmful Algae 63, 94–108. doi: 10.1016/j.hal.2017.01.011
Lehman, P. W., Marr, K., Boyer, G. L., Acuna, S., and Teh, S. J. (2013). Long-term trends and causal factors associated with Microcystis abundance and toxicity in San Francisco Estuary and implications for climate change impacts. Hydrobiologia 718, 141–158. doi: 10.1002/9781118994672.ch2
Lezcano, M. A., Velázquez, D., Quesada, A., and El-Shehawy, R. (2017). Diversity and temporal shifts of the bacterial community associated with a toxic cyanobacterial bloom: an interplay between microcystin producers and degraders. Water Res. 125, 52–61. doi: 10.1016/j.watres.2017.08.025
Li, T., Liu, S., Huang, L., Huang, H., Lian, J., Yan, Y., et al. (2011). Diatom to dinoflagellate shift in the summer phytoplankton community in a bay impacted by nuclear power plant thermal effluent. Mar. Ecol. Progr. Ser. 424, 75–85. doi: 10.3354/meps08974
Li, X., Dreher, T. W., and Li, R. (2016). An overview of diversity, occurrence, genetics and toxin production of bloom-forming Dolichospermum (Anabaena) species. Harmful Algae 54, 54–68. doi: 10.1016/j.hal.2015.10.015
Liao, J., Zhao, L., Cao, X., Sun, J., Gao, Z., Wang, J., et al. (2016). Cyanobacteria in lakes on Yungui plateau, China are assembled via niche processes driven by water physicochemical property, lake morphology and watershed land-use. Sci. Rep. 6:36357. doi: 10.1038/srep36357
Luerling, M., van Oosterhout, F., and Faasen, E. (2017). Euthrophication and warming boost cyanobacterial biomass and microcystins. Toxins 9:64. doi: 10.3390/toxins9020064
Mahmood, N. A., and Carmichael, W. W. (1986). Paralytic shellfish poisons produced by the freshwater cyanobacterium Aphanizomenon flos-aquae NH-5. Toxicon 24, 175–186. doi: 10.1016/0041-0101(86)90120-0
Martins, A., and Vasconcelos, V. (2011). Use of qPCR for the study of hepatotoxic cyanobacteria population dynamics. Arch. Microbiol. 193, 615–627. doi: 10.1007/s00203-011-0724-7
McPartlin, D. A., Loftus, J. H., Crawley, A. S., Silke, J., Murphy, C. S., and O’Kennedy, R. J. (2017). Biosensors for the monitoring of harmful algal blooms. Curr. Opin. Biotechnol. 45, 164–169. doi: 10.1016/j.copbio.2017.02.018
Meriluoto, J., Blaha, L., Bojadija, G., Bormans, M., Brient, L., Codd, G. A., et al. (2017). Toxic cyanobacteria and cyanotoxins in European waters – recent progress achieved through the CYANOCOST Action and challenges for further research. Adv. Oceanogr. Limnol. 8, 144–161. doi: 10.4081/aiol.2017.6429
Mihali, T. K., Kellmann, R., and Neilan, B. A. (2009). Characterization of the paralytic shellfish toxin biosynthesis gene clusters in Anabaena circinalis AWQCI3IC and Aphanizomenon sp. NH-5. BMC Biochem. 10:8. doi: 10.1186/1471-2091-10-8
Mirasbekov, Y., Zhumakhanova, A., Zhantuyakova, A., Sarkytbayev, K., Malashenkov, D. V., Baishulakova, A., et al. (2021). Semi-automated classification of colonial Microcystis by FlowCAM imaging flow cytometry in mesocosm experiment reveals high heterogeneity during seasonal bloom. Sci. Rep. 11, 1–14. doi: 10.1038/s41598-021-88661-2
Moreira, C., Fathalli, A., Vasconcelos, V., and Antunes, A. (2011). Genetic diversity and structure of the invasive toxic cyanobacterium Cylindrospermopsis raciborskii. Curr. Microbiol. 62, 1590–1595. doi: 10.1007/s00284-011-9900-x
Motomizu, S., Wakimoto, T., and Toei, K. (1983). Spectrophotometric determination of phosphate in river waters with molybdate and malachite green. Analyst 108, 361–368. doi: 10.1039/an9830800361
Naselli-Flores, L., Barone, R., Chorus, I., and Kurmayer, R. (2007). Toxic cyanobacterial blooms in reservoirs under a semiarid Mediterranean climate: the magnification of a problem. Environ. Toxicol. 22, 399–404. doi: 10.1002/tox.20268
Oesterholm, J., Popin, R. V., Fewer, D. P., and Sivonen, K. (2020). Phylogenomic analysis of secondary metabolism in the toxic cyanobacterial genera Anabaena, Dolichospermum and Aphanizomenon. Toxins 12:248. doi: 10.3390/toxins12040248
Oliver, R. L., Hamilton, D. P., Brookes, J. D., et al. (2012). “Physiology, blooms and prediction of planktonic cyanobacteria,” in Ecology of Cyanobacteria II – Their diversity in time and space, ed. B. A. Whitton (Dordrecht: Publishers’Graphics LLC), 155–194.
Padisák, J. (1997). Cylindrospermopsis raciborskii (Woloszynska) Seenayya et Subba Raju, an expanding, highly adaptive cyanobacterium: worldwide distribution and review of its ecology. Arch. Hydrobiol. Suppl. 107, 563–593.
Paerl, H. W., and Otten, T. G. (2013). Harmful cyanobacterial blooms causes, consequences, and controls. Microb. Ecol. 65, 995–1010. doi: 10.1007/s00248-012-0159-y
Paerl, H. W., and Paul, V. J. (2012). Climate change: links to global expansion of harmful cyanobacteria. Water Res. 46, 1349–1363. doi: 10.1016/j.watres.2011.08.002
Panda, A. K., Bisht, S. S., Kaushal, B. R., De Mandal, S., Kumar, N. S., and Basistha, B. C. (2017). Bacterial diversity analysis of Yumthang hot spring, North Sikkim, India by Illumina sequencing. Big Data Anal. 2:7. doi: 10.1186/s41044-017-0022-8
Park, S.-C., and Won, S. (2018). Evaluation of 16S rRNA databases for taxonomic assignments using a mock community. Genomics Inform. 16:e24. doi: 10.5808/GI.2018.16.4.e24
Parulekar, N. N., Kolekar, P., Jenkins, A., Kleiven, S., Utkilen, H., Johansen, A., et al. (2017). Characterization of bacterial community associated with phytoplankton bloom in a euthrophic lake in South Norway using 16S rRNA gene amplicon sequence analysis. PLoS One 12:e0173408. doi: 10.1371/journal.pone.0173408
Pearl, H. W., and Tucker, C. S. (1995). Ecology of blue-green algae in aquaculture ponds. J. World Aquac. Soc. 26, 109–131. doi: 10.1111/j.1749-7345.1995.tb00235.x
Pearson, L., Mihali, T., Moffitt, M., Kellmann, R., and Neilan, B. (2010). On the chemistry, toxicology and genetics of the cyanobacterial toxins, microcystin, nodularin, saxitoxin and cylindrospermopsin. Mar. Drugs 8, 1650–1680. doi: 10.3390/md8051650
Pearson, L. A., and Neilan, B. A. (2008). The molecular genetics of cyanobacterial toxicity as a basis for monitoring water quality and public health risk. Curr. Opin. Biotechnol. 19, 281–288. doi: 10.1016/j.copbio.2008.03.002
Pfeiffer, F., Gröber, C., Blank, M., Händler, K., Beyer, M., Schultze, J. L., et al. (2018). Systematic evaluation of error rates and causes in short samples in next-generation sequencing. Sci. Rep. 8:10950. doi: 10.1038/s41598-018-29325-6
Pitois, F., Fastner, J., Pagotto, C., and Dechesne, M. (2018). Multi-toxin occurences in ten French water resource reservoirs. Toxins 10:283. doi: 10.3390/toxins10070283
Pomati, F., Sacchi, S., Rossetti, C., and Giovannardi, S. (2000). The freshwater cyanobacterium Planktothrix sp. FP1: molecular identification and detection of paralytic shellfish poisoning toxins. J. Phycol. 36, 553–562.
Quick, J., Ashton, P., Calus, S., Chatt, C., Gossain, S., Hawker, J., et al. (2015). Rapid draft sequencing and real-time nanopore sequencing in a hospital outbreak of Salmonella. Genome Biol. 16:114. doi: 10.1186/s13059-015-0677-2
Quick, J., Loman, N. J., Simpson, J. T., Severi, E., Severi, E., Cowley, L., et al. (2016). Real-time, portable genome sequencing for ebola surveillance. Nature 530, 228–232. doi: 10.1038/nature16996
Ramsdell, J., Anderson, D., and Glibert, P. (eds) (2005). HARRNESS (Harmful Algal Research and Response: A National Environmental Science Strategy). Washington, DC: Ecological Society of America.
Rantala-Ylinen, A., Känä, S., Wang, H., Rouhiainen, L., Wahlsten, M., Rizzi, E., et al. (2011). Anatoxin-a synthetase gene cluster of the cyanobacterium Anabaena sp. strain 37 and molecular methods to detect potential producers. Appl. Environ.l Microbiol. 77, 7271–7278. doi: 10.1128/AEM.06022-1
Rapala, J., Erkomaa, K., Kukkonen, J., Sivonen, K., and Lahti, K. (2002). Detection of microcystins with protein phosphatase inhibition assay, high-performance liquid chromatography-UV detection and enzyme-linked immunosorbent assay - Comparison of methods. Anal. Chim. Acta 466, 213–231. doi: 10.1016/S0003-2670(02)00588-3
Rapala, J., Sivonen, K., Lyra, C., and Niemela, S. I. (1997). Variation of microcystin, cyanobacterial hepatotoxins, in Anabaena spp as a function of growth stimulation. App. Environ. Microbiol. 63, 2206–2212. doi: 10.1128/aem.63.6.2206-2212.1997
Rastogi, R. P., Madamwar, D., and Incharoensakdi, A. (2015). Bloom dynamics of Cyanobacteria and their toxins: environmental health impacts and mitigation strategies. Front. Microbiol. 6:1254. doi: 10.3389/fmicb.2015.01254
Reddington, K., Eccles, D., O’Grady, J., Drown, D. M., Hansen, L. H., Nielsen, T. K., et al. (2020). Metagenomic analysis of planktonic riverine microbial consortia using nanopore sequencing reveals insight into river microbe taxonomy and function. Gigascience 9:giaa053. doi: 10.1093/gigascience/giaa053
Regier, H. A., Holmes, J. A., and Pauly, D. (1990). Influence of temperature changes on aquatic ecosystems: an interpretation of empirical data. Transact. Am. Fish. Soc. 119, 374–389. doi: 10.1577/1548-8659
Rizal, N. S. M., Neoh, H.-M., Ramli, R., Periyasamy, P. R., Hanafiah, A., Samat, M. N. A., et al. (2020). Advantages and limitations of 16S rRNA next-generation sequencing for pathogen identification in the diagnostic microbiology laboratory: perspectives from a middle-income country. Diagnostics 10:816. doi: 10.3390/diagnostics10100816
Rozenstein, O., Qin, Z., Derimian, Y., and Karnieli, A. (2014). Derivation of land surface temperature for Landsat-8 TIRS using a split window algorithm. Sensors 14, 5768–5780. doi: 10.3390/s140405768
Rutten, T. P. A., Sandee, B., and Hofman, A. R. T. (2005). Phytoplankton monitoring by high performance flow cytometry: a successful approach? Cytometry A 64, 16–26. doi: 10.1002/cyto.a.20106
Saker, M. L., and Griffiths, D. J. (2000). The effect of temperature on growth and cylindrospermopsin content of seven isolates of Cylindrospermopsis raciborskii(Nostocales, Cyanophyceae) from water bodies in northern Australia. Phycologia 39, 349–354. doi: 10.2216/i0031-8884-39-4-349.1
Savadova, K., Mazur-Marzec, H., Karosienė, J., Kasperovičienė, J., Vitonytė, I., Torunska-Sitarz, A., et al. (2018). Effect of increased temperature on native and alien nuisance cyanobacteria from temperate lakes: an experimental approach. Toxins 10:445. doi: 10.3390/toxins10110445
Scherer, P. I., Millard, A. D., Miller, A., Schoen, R., Raeder, U., Geist, J., et al. (2017). Temporal dynamics of the microbial community composition with a focus on toxic cyanobacteria and toxin presence during harmful algal blooms in two South German lakes. Front. Microbiol. 8:2387. doi: 10.3389/fmicb.2017.02387
Shumway, S. E. (1990). A review of the effects of algal blooms on shellfish and aquaculture. J. World Aquac. Soc. 21, 65–103. doi: 10.1111/j.1749-7345.1990.tb00529.x
Sieracki, C. K., Sieracki, M. E., and Yentsch, C. S. (1998). An imaging-in-flow system for automated analysis of marine microplankton. Mar. Ecol. Prog. Ser. 168, 285–296.
Sukenik, A., Quesada, A., and Salmaso, N. (2015). Global expansion of toxic and non-toxic cyanobacteria: effect on ecosystem functioning. Biodivers. Conserv. 24, 889–908. doi: 10.1007/s10531-015-0905-9
Suresh, K., Ahamed, M. S., Durairaj, G., and Nair, K. V. K. (1993). Impact of power plant heated effluent on the abundance of sedentary organisms, off Kalpakkam, East coast of India. Hydrobiologia 268, 109–114. doi: 10.1007/BF00006881
Teikari, J. E., Popin, R. V., Hou, S., Wahlsten, M., Hess, W. R., and Sivonen, K. (2019). Insight into the genome and brackish water adaptation strategies of toxic and bloom-forming Baltic Sea Dolichospermum sp. UHCC 0315. Sci. Rep. 9:4888. doi: 10.1038/s41598-019-40883-1
Teixeira, T. P., Neves, L. M., and Araujo, F. G. (2009). Effect of a nuclear power plant thermal discharge on habitat complexity and fish community structure in Ilha Grande Bay, Brazil. Mar. Environ. Res. 68, 188–195. doi: 10.1016/j.marenvres.2009.06.004
Thomas, M. K., and Litchman, E. (2016). Effects of temperature and nitrogen availability on the growth of invasive and native cyanobacteria. Hydrobiologia 763, 357–369. doi: 10.1007/s10750-015-2390-2
Thuret-Benoist, H., Pallier, V., and Feuillade-Cathalifaud, G. (2019). Quantification of microcystins in natural waters by HPLC-UV after a pre-concentration step: validation of the analytical performances and study of the interferences. Environ. Toxicol. Pharmacol. 72:103223. doi: 10.1016/j.etap.2019.103223
Tornazo, A. E., Nieto, F., and Barja, J. L. (1990). Mortality associated with cyanobacterial bloom in farmed rainbow trout in Galicia (north-western Spain). Bull. Eur. Assoc. Fish Pathol. 10, 106–107.
Vaitomaa, J., Rantala, A., Halinen, K., Rouhiainen, L., Tallberg, P., Mokelke, L., et al. (2003). Quantitative Real-Time PCR for determination of microcystin synthetase E copy numbers for Microcystis and Anabaena in lakes. Appl. Environ. Microbiol. 69, 7289–7297. doi: 10.1128/aem.69.12.7289-7297.2003
Walawender, J. P., Hajto, M. J., and Iwaniuk, P. (2012). “A new ArcGIS toolset for automated mapping of land surface temperature with the use of LANDSAT satellite data,” in Proceedings of the 2012 IEEE International Geoscience and Remote Sensing Symposium, Munich, 4371–4374. doi: 10.1109/IGARSS.2012.6350405
Wejnerowski, L., Rzymski, P., Kokociński, M., and Meriluoto, J. (2018). The structure and toxicity of winter cyanobacterial bloom in a eutrophic lake of the temperate zone. Ecotoxicology 27, 752–760. doi: 10.1007/s10646-018-1957-x
Wells, M. L., Karlson, B., Wulff, A., Kudela, R. M., Trick, C., Asnaghi, V., et al. (2020). Future HAB science: directions and challenges in a changing climate. Harmful Algae 91, 101632–101650. doi: 10.1016/j.hal.2019.101632
Wilson, A. E., Sarnelle, O., Neilan, B. A., Salmon, T. P., Gehringer, M. M., and Hay, M. E. (2005). Genetic variation of the bloom-forming cyanobacterium Microcystis aeruginosa within and among lakes: implications for harmful algal blooms. Appl. Environ. Microbiol. 71, 6126–6133. doi: 10.1128/AEM.71.10.6126-6133.2005
Winand, R., Bogaerts, B., Hoffman, S., Lefevre, L., Delvoye, M., Van Braekel, J., et al. (2020). Targeting the 16S rRNA gene for bacterial identification in complex mixed samples: comparative evaluation of second (Illumina) and third (Oxford Nanopore Technologies) generation sequencing technologies. Int. J. Mol. Sci. 21:298. doi: 10.3390/ijms21010298
Woodhouse, J. N., Kinsela, A. S., Collins, R. N., Bowling, L. C., Honeyman, G. L., Holliday, J. K., et al. (2016). Microbial communities reflect temporal changes in cyanobacterial composition in a shallow ephemeral freshwater lake. ISME J 10, 1337–1351. doi: 10.1038/ismej.2015.218
Xiao, X., Sogge, H., Lagesen, K., Tooming-Klunderud, A., Jakobsen, K. S., and Rohrlack, T. (2014). Use of high throughput sequencing and light microscopy show contrasting results in study of phytoplankton occurrence in a freshwater environment. PLoS One 9:e106510. doi: 10.1371/journal.pone.0106510
Keywords: toxic algae, cyanobacteria, imaging flow cytometry, next-generation sequencing, MinION, real-time PCR, satellite data analysis, Cylindrospermopsis raciborskii
Citation: Mirasbekov Y, Abdimanova A, Sarkytbayev K, Samarkhanov K, Abilkas A, Potashnikova D, Arbuz G, Issayev Z, Vorobjev IA, Malashenkov DV and Barteneva NS (2021) Combining Imaging Flow Cytometry and Molecular Biological Methods to Reveal Presence of Potentially Toxic Algae at the Ural River in Kazakhstan. Front. Mar. Sci. 8:680482. doi: 10.3389/fmars.2021.680482
Received: 14 March 2021; Accepted: 10 June 2021;
Published: 21 July 2021.
Edited by:
Joe Silke, Marine Institute, IrelandReviewed by:
Khor Waiho, University of Malaysia Terengganu, MalaysiaNor Azman Kasan, University of Malaysia Terengganu, Malaysia
Copyright © 2021 Mirasbekov, Abdimanova, Sarkytbayev, Samarkhanov, Abilkas, Potashnikova, Arbuz, Issayev, Vorobjev, Malashenkov and Barteneva. This is an open-access article distributed under the terms of the Creative Commons Attribution License (CC BY). The use, distribution or reproduction in other forums is permitted, provided the original author(s) and the copyright owner(s) are credited and that the original publication in this journal is cited, in accordance with accepted academic practice. No use, distribution or reproduction is permitted which does not comply with these terms.
*Correspondence: Dmitry V. Malashenkov, dvmalashenkov@gmail.com; Natasha S. Barteneva, natalie.barteneva@nu.edu.kz; bartene@yahoo.com
†These authors have contributed equally to this work