Heterogeneity in diagnostic characters across ecoregions: A case study with Botrynema (Hydrozoa: Trachylina: Halicreatidae)
 Javier Montenegro1*
  Allen G. Collins2
  Russell R. Hopcroft3
  Jennifer M. Questel3
  Erik V. Thuesen4
  Tiffany S. Bachtel5
  Leah A. Bergman1,6 Mehul N. Sangekar1
  Jeffrey C. Drazen7
  Dhugal J. Lindsay1
- 1Institute for Extra-cutting-edge Science and Technology Avant-garde Research (X-STAR), Agency for Marine-Earth Science and Technology (JAMSTEC), Yokosuka, Kanagawa, Japan
- 2National Systematics Lab of National Oceanic and Atmospheric Administration (NOAA) Fisheries, Office of Science & Technology, Smithsonian National Museum of Natural History, Washington DC, United States
- 3College of Fisheries and Ocean Sciences, University of Alaska Fairbanks, Fairbanks, AK, United States
- 4The Evergreen State College, Olympia, WA, United States
- 5National Oceanic and Atmospheric Administration (NOAA) Southwest Fisheries Science Center, La Jolla, CA, United States
- 6School of Marine Biosciences, Kitasato University, Sagamihara, Kanagawa, Japan
- 7Department of Oceanography, University of Hawaii at Manoa, Honolulu, HI, United States
Introduction: Botrynema, a genus of medusozoans in the trachyline family Halicreatidae, currently contains two species: B. brucei and B. ellinorae, distinguished by the presence or absence, respectively, of an apical knob as a diagnostic character. However, no study has corroborated if these taxonomic diagnoses have a biological and evolutionary basis. Therefore, in this study we attempted to address the question “do the two nominal species in the genus Botrynema represent independent phylogenetic lineages, or two phenotypic variants of a single species?
Methods: In this study we took advantage of legacy collections from different research expeditions across the globe from 2000 to 2021 to study the phylogenetics and taxonomy of the genus Botrynema.
Results: B. brucei and B. ellinorae present partially overlapping vertical distributions in the Arctic and as a whole in the Arctic the genus seems to be limited to the Atlantic water masses. The phylogenetic reconstruction based on the concatenated alignment corroborates the validity of the family Halicreatidae and of genus Botrynema as monophyletic groups. However no clear differentiation was found between the two presently accepted species, B. ellinorae and B. brucei.
Discussion: Based on the evidence we gathered, we conclude that while the genus Botrynema does contain at least two species lineages, these lineages are not concordant with current species definitions. The species B. ellinorae is reassigned as a subspecies of B. brucei and diagnostic characters are provided.
1 Introduction
Gelatinous zooplankton communities are present in all the oceans of the world and occur across all latitudes and depths (Madin and Harbison, 2001). Nonetheless the diversity of gelatinous communities is often overlooked, not only because of the small number of active taxonomic experts, but also due to difficulties concerning collection and preservation of specimens, and at least in some cases high morphological variability that masks underlying species diversity (Cunha et al., 2016; Abboud et al., 2018; Lawley et al., 2021). The use of submersibles (Lindsay and Hunt, 2005; Robison et al., 2010), remotely operated vehicles (ROVs), imaging and video processing technologies (Gorsky et al., 2010; Easson et al., 2020) has facilitated observation and collection of specimens. However, the occurrence of cryptic species among gelatinous communities remains a recalcitrant problem to solve (Lindsay et al., 2017).
Halicreatidae, a family of medusozoans commonly found in gelatinous communities throughout the globe, was first erected by Fewkes in 1886, and is generally characterized by the presence of eight or more radial canals, a wide, circular stomach with no peduncle nor proboscis, and marginal tentacles with a soft flexible proximal portion but a stiff spine-like distal portion (VanHöffen, 1902; Bouillon and Boero, 2006). The family presently contains five genera (WoRMS - World Register of Marine Species), including Botrynema, the target of this study. The genus Botrynema was erected by Browne in 1908 with B. brucei, collected from the Southern Ocean, as the type species. Browne (1908) described the diagnostic features of the genus as being a trachymedusa “with sixteen groups of tentacles (two groups containing many tentacles in a single row in each octant) and eight solitary perradial tentacles (without perradial tubercles or outgrowths of jelly near the margin of the exumbrella).” Almost simultaneously, Botrynema ellinorae was described by Hartlaub in 1909 from the Greenland Sea as Alloionema ellinorae, with the genus being later synonymized with Botrynema by Bigelow (1913). After acknowledging that the species were very similar, Bigelow distinguished B. ellinorae from B. brucei using the shape of the margin of the umbrella and the position of the perradial tentacles. However, Kramp (1942) proposed the apical knob as the key diagnostic character to differentiate B. brucei from B. ellinorae, based on newly collected specimens of B. ellinorae and the original sketches of B. brucei by Browne (1908), and followed this supposition in his highly influential Synopsis of the Medusae of the World (Kramp, 1961). Since then, the apical knob has effectively been the only character used to differentiate species in the genus Botrynema (Buchanan and Sekerak, 1982; Kosobokova and Hirche, 2000; Lindsay, 2005; Hosia et al., 2008; Raskoff et al., 2010; Wang et al., 2014).
However, no studies have followed up on the conclusions of Kramp (1942); Kramp (1961), and tested the validity of this distinction with modern techniques. The rise of sequencing technologies has allowed taxonomists to flag problematic groups for focused morphological analyses, and facilitate the discovery of species (Hajibabaei et al., 2007). In particular, molecular techniques have played a crucial role in the discovery of cryptic species in marine environments (Moura et al., 2011; Daglio and Dawson, 2017; Johansson et al., 2018; Lawley et al., 2021), where a significant portion of the diversity is thought to be hidden below the morphospecies level (Knowlton, 2000; Bickford et al., 2007). Although less common, molecular techniques have also aided taxonomists in identifying geographically-delineated phenotypic variants as a single species rather than multiple independent lineages (Johannesson et al., 1993; Hay et al., 2010; Apolônio Silva de Oliveira et al., 2017). For the particular case of the genus Botrynema, no comprehensive molecular studies are presently available, and therefore it is difficult to assess the hypothesis that the presently accepted taxonomic distinction between B. brucei and B. ellinorae has a biological and evolutionary basis. Several observations about the genus Botrynema are puzzling: a) apart from the apical knob, B. brucei and B. ellinorae appear to be morphologically indistinguishable from each other and b) despite these remarkable phenotypic similarities, the two putative species exhibit dramatic differences in their geographical distributions, with B. ellinorae being found exclusively at higher latitudes in the northern hemisphere and B. brucei apparently being distributed globally. Therefore, the key question of this study was do the two nominal species in the genus Botrynema represent independent phylogenetic lineages, or two phenotypic variants of a single species?
In this study we take advantage of legacy collections from multiple research cruises around the globe, from the year 2000 to 2021, to present the most comprehensive study on the genus Botrynema to-date. Using in-situ imaging, data on vertical distributions, and basic molecular and morphological analyses, we aimed to untangle the biological bases for the distinction between B. brucei and B. ellinorae through the following endeavours: first, we gathered a set of all the molecular data publicly available for Botrynema and other members of the family Halicreatidae and its corresponding collection data through searches of the literature, databases and personal communications; second, we sequenced the commonly used molecular markers COI-mtDNA, 16S-rDNA, 18S-rDNA, and 28S-rDNA; and third, we performed thorough phylogenetic analyses based on maximum likelihood and Bayesian posterior probability. Finally, in the light of the evidence gathered thereby, we discuss the taxonomic and phylogenetic validity of B. brucei and B. ellinorae and the potential selective forces leading to the evolution and retention of the apical knob. Additionally, to place our findings in a broader context, we give suggestions for future studies on the molecular taxonomy of medusozoans.
2 Material and methods
2.1 Sample collection
Samples from the Chukchi Borderlands, Arctic Ocean, were collected using either the ROV Global Explorer or a Multinet of mouth area 0.5 m2 and mesh aperture 150 µm during Cruise HLY1601 of the U.S. Coast Guard Cutter (USCGC) Healy between 2 July to 10 August 2016. An additional sample was collected in a vertical haul of a ring net with a mouth diameter of 80 cm and mesh aperture of 335 µm during R/V Mirai Cruise MR21-05C from 31 August to 21 October 2021. Samples from the high Arctic were sampled by vertical tows of a Bongo net with a mouth diameter of 60 cm and mesh aperture of 300 µm or Multinet of mouth area 0.5 m2 and mesh aperture 150 µm during R/V Polarstern Cruise ARK-XXVI/3 from 5 August to 6 October 2011.
Samples from the northwest Pacific Ocean were collected using the crewed submersibles Shinkai 2000 (R/V Natsushima Cruise NT00-12, 30 October to 6 December 2000) and Shinkai 6500 (R/V Yokosuka Cruise YK00-04 Leg 2, 6 June to 22 June 2000), the ROV Hyper-Dolphin (R/V Kaiyo Cruise KY02-06, 20 April to 6 May 2002), an ORI net with a mouth diameter of 160cm and a mesh aperture of 330 µm (T/V TanseiMaru Cruise KT12-01, 4 March to 9 March 2012) or 690 µm (T/V TanseiMaru Cruise KT10-11, 24 June to 28 June 2010), and an opening-closing IONESS net system with a mouth area of 1.8 m2 and a mesh aperture of 330 μm (R/V Kaiyo Cruise KY06-03 Leg 1, 13 March to 28 March 2006).
The sample from the southeast Pacific Ocean was collected by an IONESS net system with a mouth area of 1.8 m2 and a mesh aperture of 330 μm during R/V Mirai Cruise MR18-06-03 from 27 January to 2 March 2019. Samples from the Southern Ocean were collected during the CEAMARC Cruise of the Training and Research Vessel (TR/V) Umitaka-Maru from 28 January to 8 February 2008 using a rectangular midwater trawl (RMT) with a mouth area of 8 m2 and a mesh aperture of 4.5 mm. Samples from the Clarion-Clipperton Zone (CCZ) in the eastern tropical Pacific Ocean were collected by the ROV Odysseus during Maersk Launcher campaign 5b from 11 March to 21 April 2021. In addition to the samples sequenced for this study (Supplementary Table 1), further samples and sequences were kindly provided by coauthors and colleagues, or directly downloaded from GenBank (Supplementary Table 2). The single sequence from the northwest Atlantic, harvested from GenBank, was from a specimen sampled by a MOCNESS net with a mouth area of 1 m2 and a mesh size of 180 µm (Transatlantic G.O. Sars 2013 Cruise, 1 May to 14 June 2013).
Previously published papers focusing on trachyline medusae taxonomy have sometimes used markers sequenced from multiple different individuals, sometimes from different geographic areas, concatenated for downstream analyses (eg. Bentlage et al., 2018; Matsumoto et al., 2020). Although this is a valid approach when addressing the questions outlined in those studies, for analyses addressing the intersection of populations and species, marker resolution at the individual organism level is necessary. Sometimes the same individual was sequenced for different markers in separate studies and the GenBank IDs did not make this readily apparent. The results of this detective work are outlined in Supplementary 2, where all specimens have also been given unique specimen IDs for use in future studies. The specimen distribution map (Figure 1) and density curves by depth (Figure 2) were plotted using the statistical software package R (Core Team, 2009), and the package ggplot2 (Wickham, 2016).
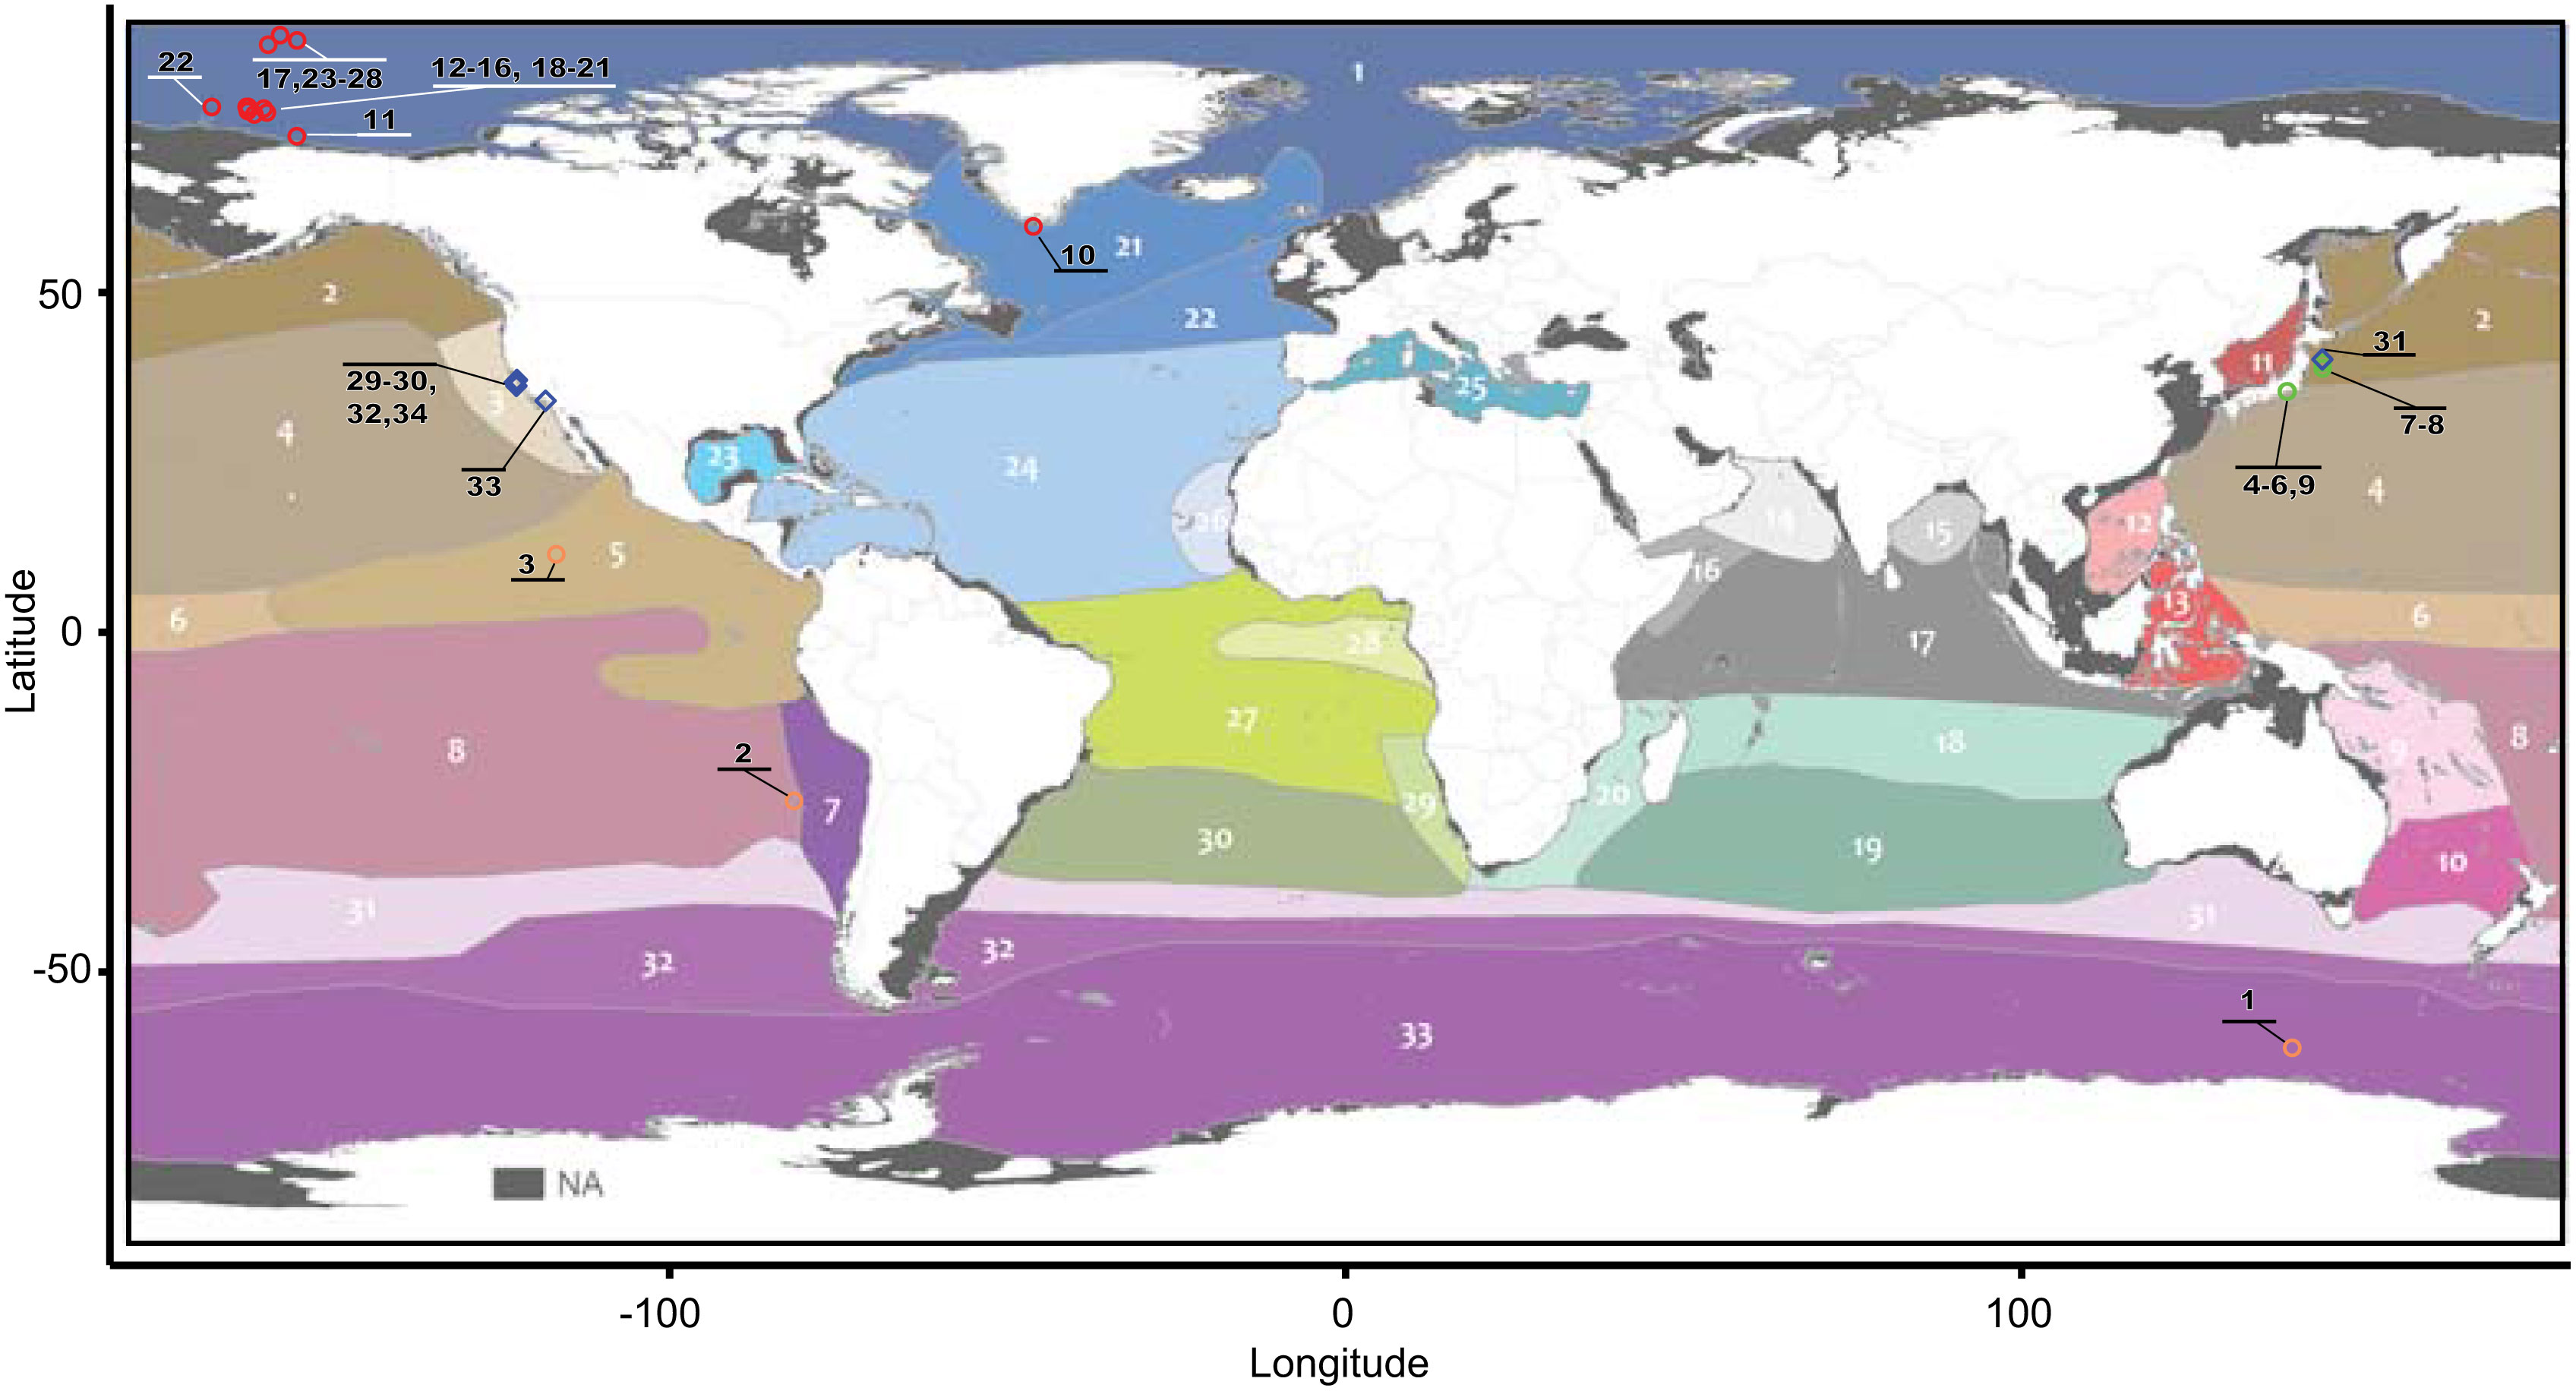
Figure 1 Geographical distribution by ecoregions of the samples analyzed in this study. Circles correspond to specimens of the genus Botrynema, and blue diamonds correspond to the genera Haliscera, Halitrephes and Halicreas in the family Halicreatidae. The ecoregion map was modified from Sutton et al. (2017). Numbers in black represent unique specimens as indicated in Supplementary Table 1.
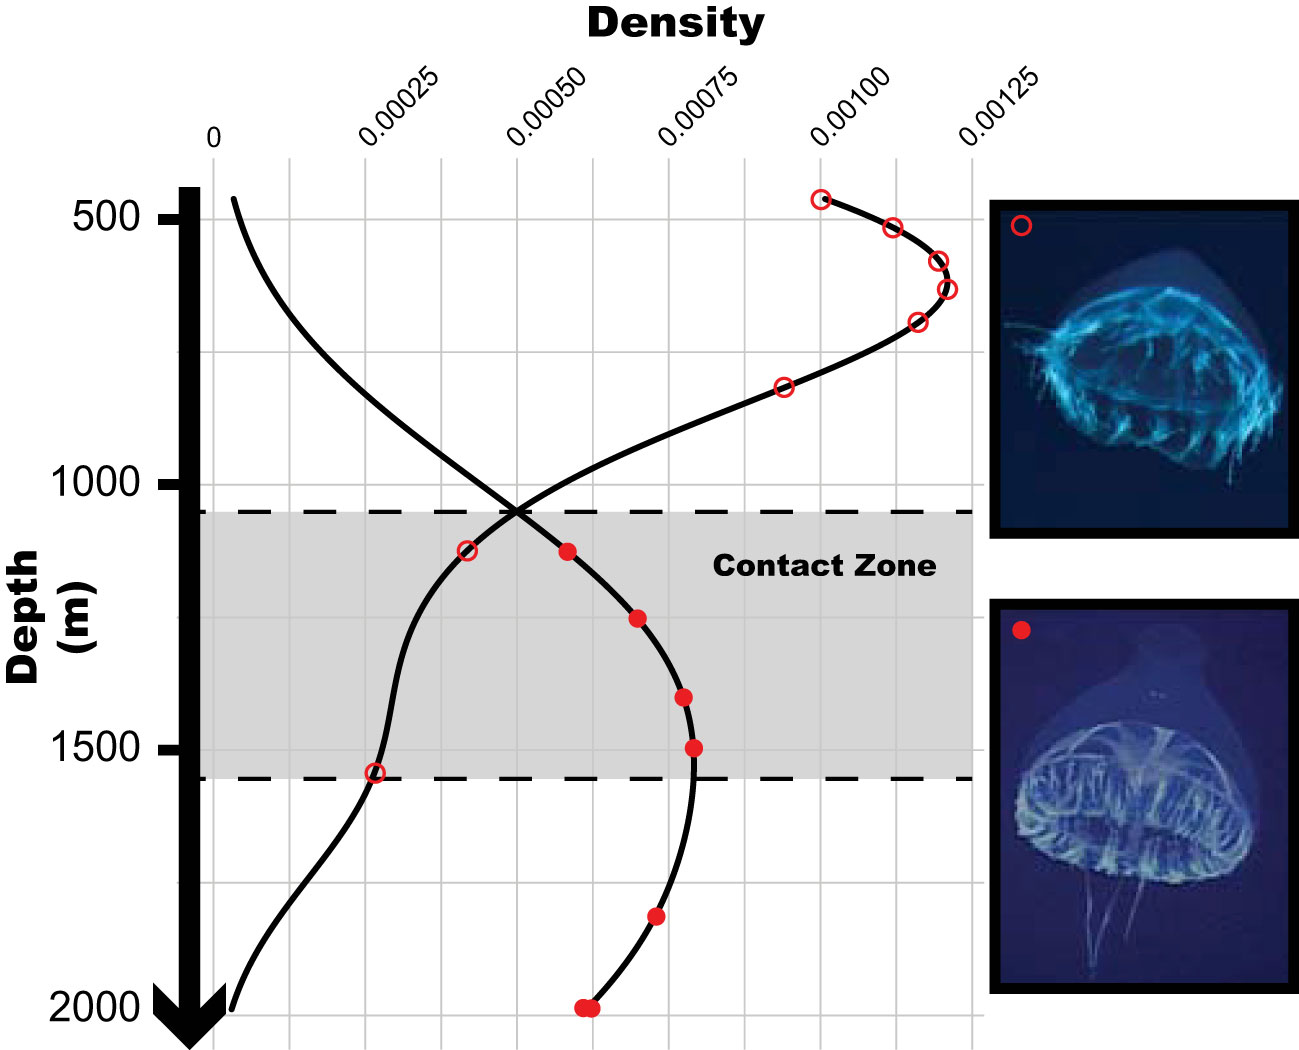
Figure 2 Density distribution plot for the recorded depths of occurrence of Botrynema in the Arctic Ocean during Cruise HLY16-01 of the U.S. Coast Guard Cutter (USCGC) Healy between 2 July to 10 August 2016. Empty circles indicate records for B. brucei ellinorae comb. nov. without an apical knob, and full circles records for B. brucei ellinorae comb. nov. with a knob.
2.2 Video records
Specimens sampled by ROVs or submersibles were located on the original video media (Shinkai 2000 & Shinkai 6500: Digi-Beta tapes, ROV HyperDolphin: HDCAM tapes) and digitized using an AJA Video Systems KiPro Ultra Plus recorder as Quicktime (.mov) videos files using the Apple ProRes 4:2:2 codec. Video from the ROV Global Explorer was recorded directly onto these same AJA Ki Pro systems in the same format as above, while video from the ROV Odysseus was retrieved from the video-recording NAS as Apple ProRes 4:2:0 codec Quicktime video files. Videos of sampled specimens in phototanks or under a dissecting microscope were digitized using Adobe Premiere Pro (version 22.6.2) for HDV or Quicktime Player (version 10.5) for MiniDV or DVCAM, and captured frames were processed using Adobe Photoshop (version 23.5.1) to remove video interlace artifacts. The observations by the ROV in the Arctic Ocean were annotated using SQUIDLE+ (Friedman, 2022) with a video player plugin and exported as comma-delimited text (.csv) files before being used to produce the density curves by depth in Figure 2. Contrast and brightness of images were edited in Adobe Photoshop (version 23.5.1) to improve clarity.
2.3 Genomic DNA extraction
Total DNA was extracted from chilled ethanol- or cold-preserved samples stored at -20˚C, using the Promega Wizard® HMW DNA Extraction Kit as indicated in the protocol for tissue cultured cells with the following modifications. Steps 1 to 5 were skipped, instead samples were predigested in a solution made of 540 µl of HMW Lysis Buffer-A and 60 µl of Collagenase I (cat. 031-17601, FUJIFILM Wako) at a concentration of 1 mg/ml in 1 M Tris-HCL. The predigesting step was performed at 37˚C for 30 min in a heat-block shaker at 400 rpm (Funakoshi TS-100C). Additionally at step 11, 23 µl of sodium acetate (3 Molar at pH 5.2) and 3 µl of Ethachinmate (cat. 312-01791, FUJIFILM Wako) were added to the solution and mixed by pipetting with wide bore tips as indicated in the protocol (Supplementary 1).
2.4 PCR amplification and sequencing
Four molecular markers were targeted: 16S-rDNA, 18S-rDNA, 28S-rDNA and COI-mtDNA, and partial sequences were amplified. These markers were selected following previous studies and based on the availably of information in public databases for multiple medusozoan groups and the family Halicreatidae. For the 16S-rDNA region, the primers med-rnl-F (GAC TGT TTA CCA AAG ACA TAG C) & med-rnl-R (AAG ATA GAA ACC TTC CTG TC) (Lawley et al., 2016) or primer1-F (TCG ACT GTT TAC CAA AAA CAT AGC) & primer2-R (ACG GAA TGA ACT CAA ATC ATG TAA G) (Cunningham and Buss, 1993) were used with PCR cycles of 94°C for 5 minutes, 35 cycles of 94°C for 30 seconds, 53°C for 30 seconds, 72°C for 2 minutes, and a final extension at 72°C for 10 minutes. For the 18S-rDNA region, three consecutive primer sets were used: 18SPrm-F (AAC CTG GTT GAT CCT GCC AGT) & 18SL-R (CCA ACT ACG AGC TTT TTA ACT G), 18SC-f (CGG TAA TTC CAG CTC CAA TAG) & 18SY-r (CAG ACA AAT CGC TCC ACC AAC), 18SO-f (AAG GGC ACC ACC AGG AGT GGA G) & 18SB-r (TGA TCC TTC CGC AGG TTC ACC T) (Apakupakul et al., 1999). All 18S-rDNA primer sets were amplified with the following PCR cycles of 94°C for 2 minutes, 38 cycles of 94°C for 45 seconds, 48°C for 60 seconds, 72°C for 2 minutes, and a final extension at 72°C for 10 minutes. 28S-rDNA was amplified using the primers 28SF63-f (AAT AAG CGG AGG AAA AGA AAC) & 28SR635-r (GGT CCG TGT TTC AAG ACG G) (Medina et al., 2001) and PCR cycles of 94°C for 3 minutes, 35 cycles of 94°C for 1 minute, 54°C for 1 minute, 72°C for 2 minutes, and a final extension at 72°C for 10 minutes. For COI-mtDNA, PCR reactions were performed with the primer sets LCO1490-f (GGT CAA CAA ATC ATA AAG ATA TTG G) & HCO2198r (TAA ACT TCA GCC TGA CCA AAA AAT CA) following (Ortman et al., 2010) and primers jgLCO1490-f (TIT CIA CIA AYC AYA ARG AYA TTG G) & jgHCO2198-r (TAI ACY TCI GGR TGI CCR AAR AAY CA) following Geller et al. (2013). All PCR reactions were performed using the QIAGEN Taq PCR Master Mix Kit (cat. 201443, QIAGEN) following the manufacturer’s instructions, except for the primer set jgLCO1490/jgHCO2198 where the Q5U master mix was used (cat. M0597S, New England BioLabs).
PCR amplifications were verified by electrophoresis using 1.5% agarose gels, NEB gel loading dye (cat. B7021S, New England BioLabs) and GelRed nucleic acid stain (cat. 41003, GelRed). Positive reactions were selected and cleaned using Shrimp Alkaline Phosphatase (cat. 2660A, SAP, TaKaRa) and Exonuclease I (cat. 2650A, Exo-I, TaKaRa) as follows: for each positive reaction 0.4 µl of SAP, 0.2 µl of Exo-I and 3.4 µl of TE buffer were prepared and the reaction was carried at 37°C for 30 minutes and then at 83°C for 30 minutes. The resulting amplicons were sent for Sanger sequencing to FASMAC Co. Ltd (Kanagawa, Japan). All sequences generated in this study were deposited in GenBank (Supplementary Table 2).
2.5 Phylogenetic analyses
Newly generated sequences were manually curated and flanking regions were trimmed. Additional sequences relevant to this study were downloaded from GenBank (Supplementary Table 2) and alignments were generated per marker. Preliminary alignments were generated in Geneious Prime 2022.2.2 <www.geneious.com> using the algorithm for global alignment with free-end gaps and default settings. These alignments were manually trimmed and thereafter realigned using MAFFT v7.450 (Katoh and Standley, 2013) with the algorithm L-INS-I and default settings. The resulting alignments were manually curated, concatenated, and missing data and gaps were replaced with Ns. The concatenated alignment was used to perform phylogenetic reconstructions using Maximum Likelihood (ML) and Bayesian Posterior Inference (BI). Additionally, because 16S-rDNA is known to have a high resolution at the species level in Hydrozoa (Miglietta et al., 2009; Moura et al., 2011; Zheng et al., 2014; Lindsay et al., 2015), independent ML and BI analyses were performed for this marker. The best fitting models were estimated using SMS (Lefort et al., 2017) for ML and ModelTest-NG v0.2.0 (Darriba et al., 2020) for BI trees. In both cases the Akaike information criterion (AIC) was used as the selecting criteria.
For the concatenated alignment, ML was estimated using the RAxML plugin in Geneious (Stamatakis, 2014), and BI was calculated in MrBayes 3.2.7a (Ronquist et al., 2012). RAxML was set to use the algorithm for rapid bootstrapping and search for the best-scoring tree ML-tree (-f a -x1), the partition scheme was specified, parsimony random seeds were set as 12345 and 1000 bootstrap trees were estimated. MrBayes was configured following the models and parameters as indicated by ModelTest-NG, with 4 MCMC heated chains, 10,000,000 generations, and a temperature of 0.2 for the heated chain. Chains were sampled every 200 generations. Burn-in length was set to 25%, at which point the average standard deviation of split frequency (ASDOSF) was steadily below 0.01. In both analyses Colobonema sericeum, Pantachogon haeckeli, Ptychogastria polaris, Solmissus incisa, and Solmundella bitentaculata were used as outgroups.
In order to gain further insights into the phylogenetic relationships within the family Halicreatidae, with a particular interest in the genus Botrynema, a new set of ML and BI phylogenetic analyses were performed for the 16S-rDNA region with no missing data. ML trees were constructed using PhyML v3.3.20220408 (Guindon et al., 2010) and the best fitting model was automatically selected using SMS with the AIC criteria. The PhyML tree was constructed using the ATGC server platform < http://www.atgc-montpellier.fr/phyml > as follows; one BioNJ tree (Gascuel, 1997) and 10 random trees were generated as starting trees, 1000 bootstraps were run using the transfer bootstrap approach (Lemoine et al., 2018) and the branch support was estimated with the aLRT_SH-like method. The BI was run as before, but with no missing data and for 5,000,000 generations. All alignments and associated data used in the phylogenetic reconstructions were deposited on figshare with a DOI: 10.6084/m9.figshare.21665519.
3 Results
3.1 Specimen distribution
Specimens corresponding with the presently accepted morphological diagnosis of Botrynema brucei, i.e., presence of a distinct apical knob, were distributed across multiple mesopelagic ecoregions, following (Sutton et al., 2017); Arctic Ocean (1), Subarctic Pacific (2), Northern Central Pacific (4), Eastern Tropical Pacific (5), Southern Central Pacific (8), Antarctic/Southern Ocean (33) and Northwest Atlantic Subarctic (21). In contrast, specimens classified as Botrynema ellinorae were only recorded from the Arctic Ocean (1). Numbers in parentheses follow the nomenclature of Sutton et al. (2017) (Figure 1). Therefore, the Arctic Ocean (1) is the only ecoregion where both morphotypes in the genus Botrynema, with and without a knob, have been historically reported. Interestingly, B. ellinorae was mostly distributed at shallower depths between 461-815 m, but up to a maximum depth of 1544 m, while B. brucei was recorded from 1125-1988 m depth. Therefore, B. brucei and B. ellinorae had partially overlapping vertical distributions between the range of 1100 m ~1600 m depth (Figure 2), and as a whole the genus in the Arctic seems to be limited to the Atlantic water masses, characterized by a high salinity and stable decrease in temperature from 0.75°C at 400 m to -0.5°C at 2000 m depth (McLaughlin et al., 2005; Raskoff et al., 2010).
3.2 Phylogenetic analyses
The genomic regions were amplified with different degrees of success (Supplementary Table 2). In total 98 sequences were used; 38 for 16S-rDNA, 28 for 18S-rDNA, 25 for 28S, and 7 for COI-mtDNA, including the sequences downloaded from GenBank. The final concatenated alignment consisted of 39 taxonomic units and 3113 bp. For BI the best fitting models were GTR+G4, HKY+I+G4, GTR+G4 and GTR+I, for 16S-rDNA, 18S-rDNA, 28S-rDNA, and COI-mtDNA respectively. For ML reconstructions in PhyML the best fitting model was GTR+R4 for 16S-rDNA, and for the concatenated alignment the substitution rates and parameters were automatically estimated by RAxML per partition.
The phylogenetic reconstruction based on the concatenated alignment corroborates the validity of the family Halicreatidae as a monophyletic group. The inclusion of Haliscera conica within the family Halicreatidae as the earliest standing diverging species was fully supported by BI in the concatenation, and by ML and BI based on the 16S-rDNA region. However, no support was found from ML based on the concatenated dataset. The genus Halicreas was clearly monophyletic with a bootstrap support > 98 in ML and full support for BI in all analyses. Halitrephes maasi was well supported as sister to Halicreas minimum with a likelihood support of >96 and full support for BI. The genus Haliscera was found to be polyphyletic in origin across all analyses; the phylogenetic position of Haliscera bigelowi remains uncertain, but it was determined to be basal to Halicreas and Halitrephes with moderate support in the ML analyses of the 16S-rDNA region (Figures 3, 4).
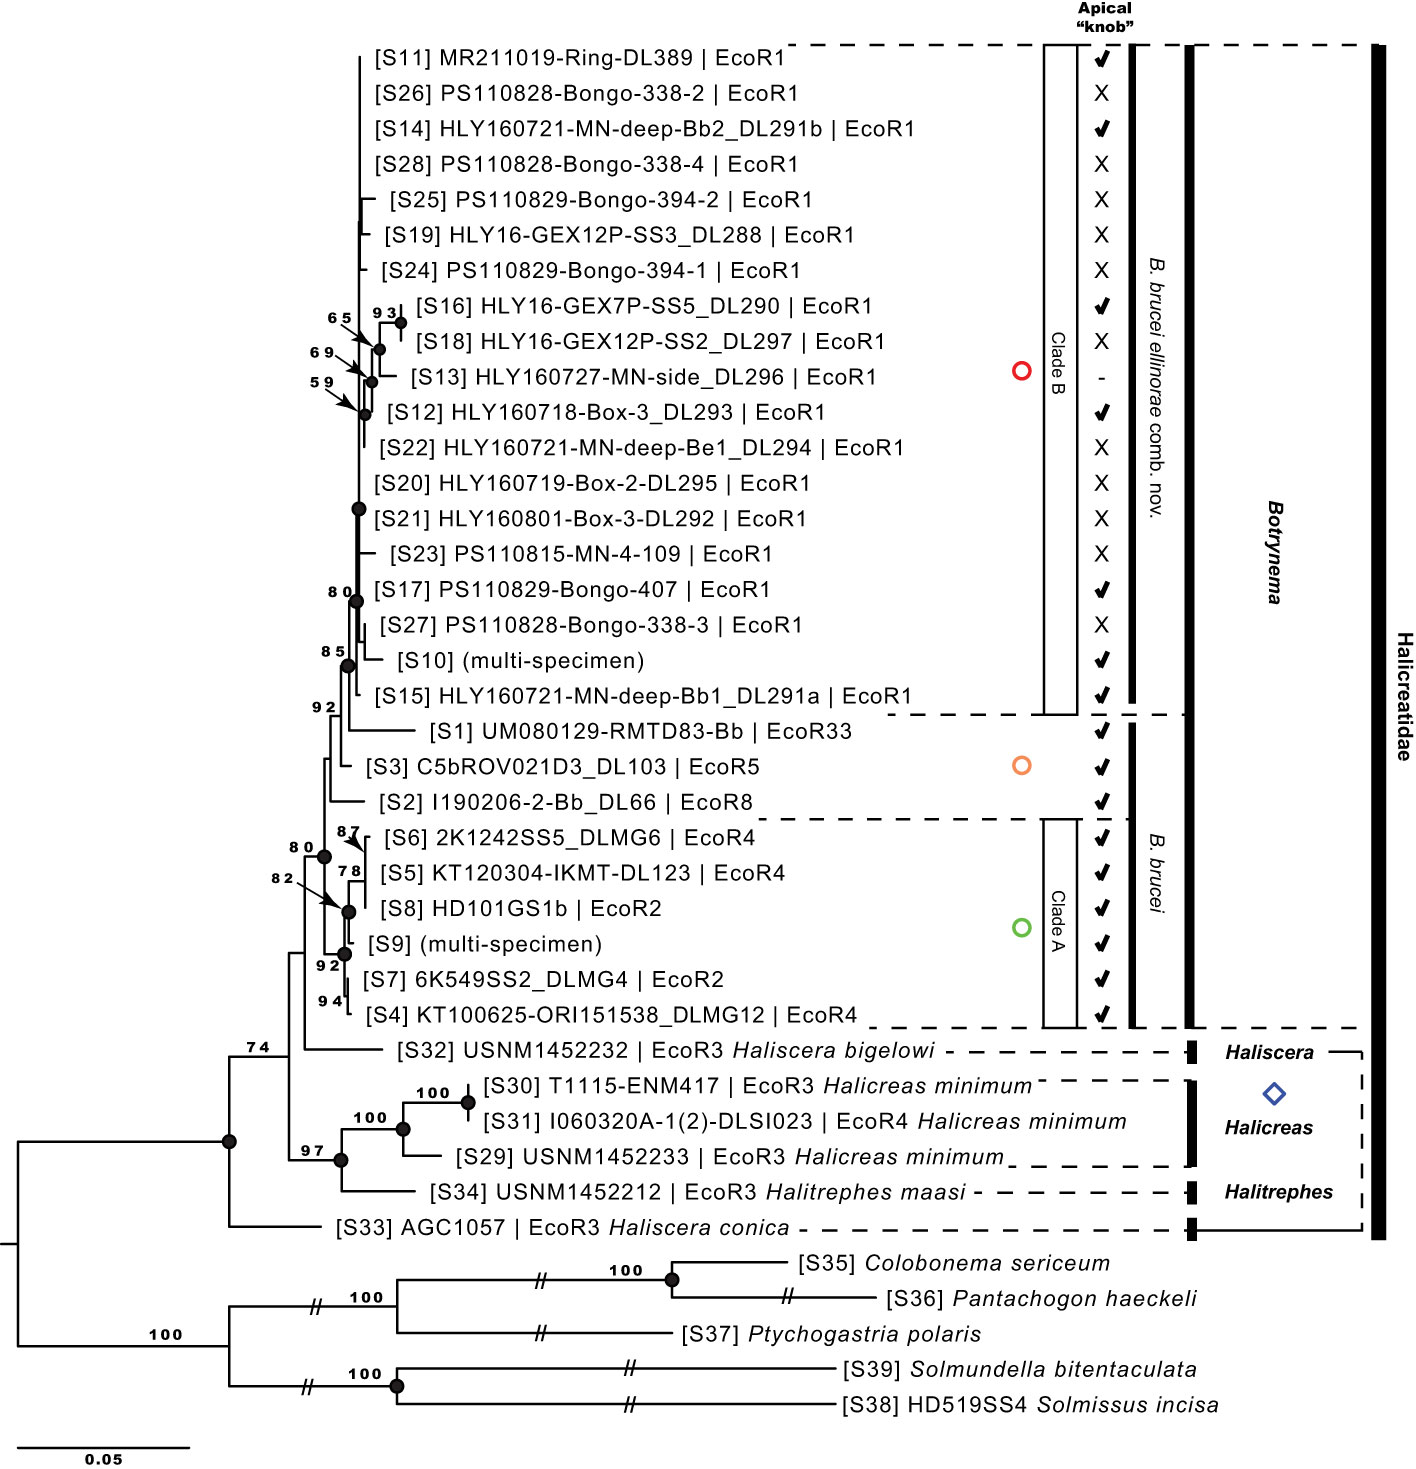
Figure 3 Maximum likelihood phylogenetic reconstruction based on the concatenated alignment (16S-rDNA + 18S-rDNA + 28S-rDNA + COI-mtDNA). Values on branch nodes represent likelihood bootstrap support over 50%. Full black circles on branch nodes represent Bayesian posterior probability support over 95%. Diamonds correspond to the genera Haliscera, Halitrephes and Halicreas in the family Halicreatidae. Circles refer to the genus Botrynema, in green Clade A, red Clade B, and in orange single lineages not corresponding to either Clade A nor B Note how the presence/absence of an apical knob is variable across clade B – B brucei ellinorae comb. nov. (see Figure 5).
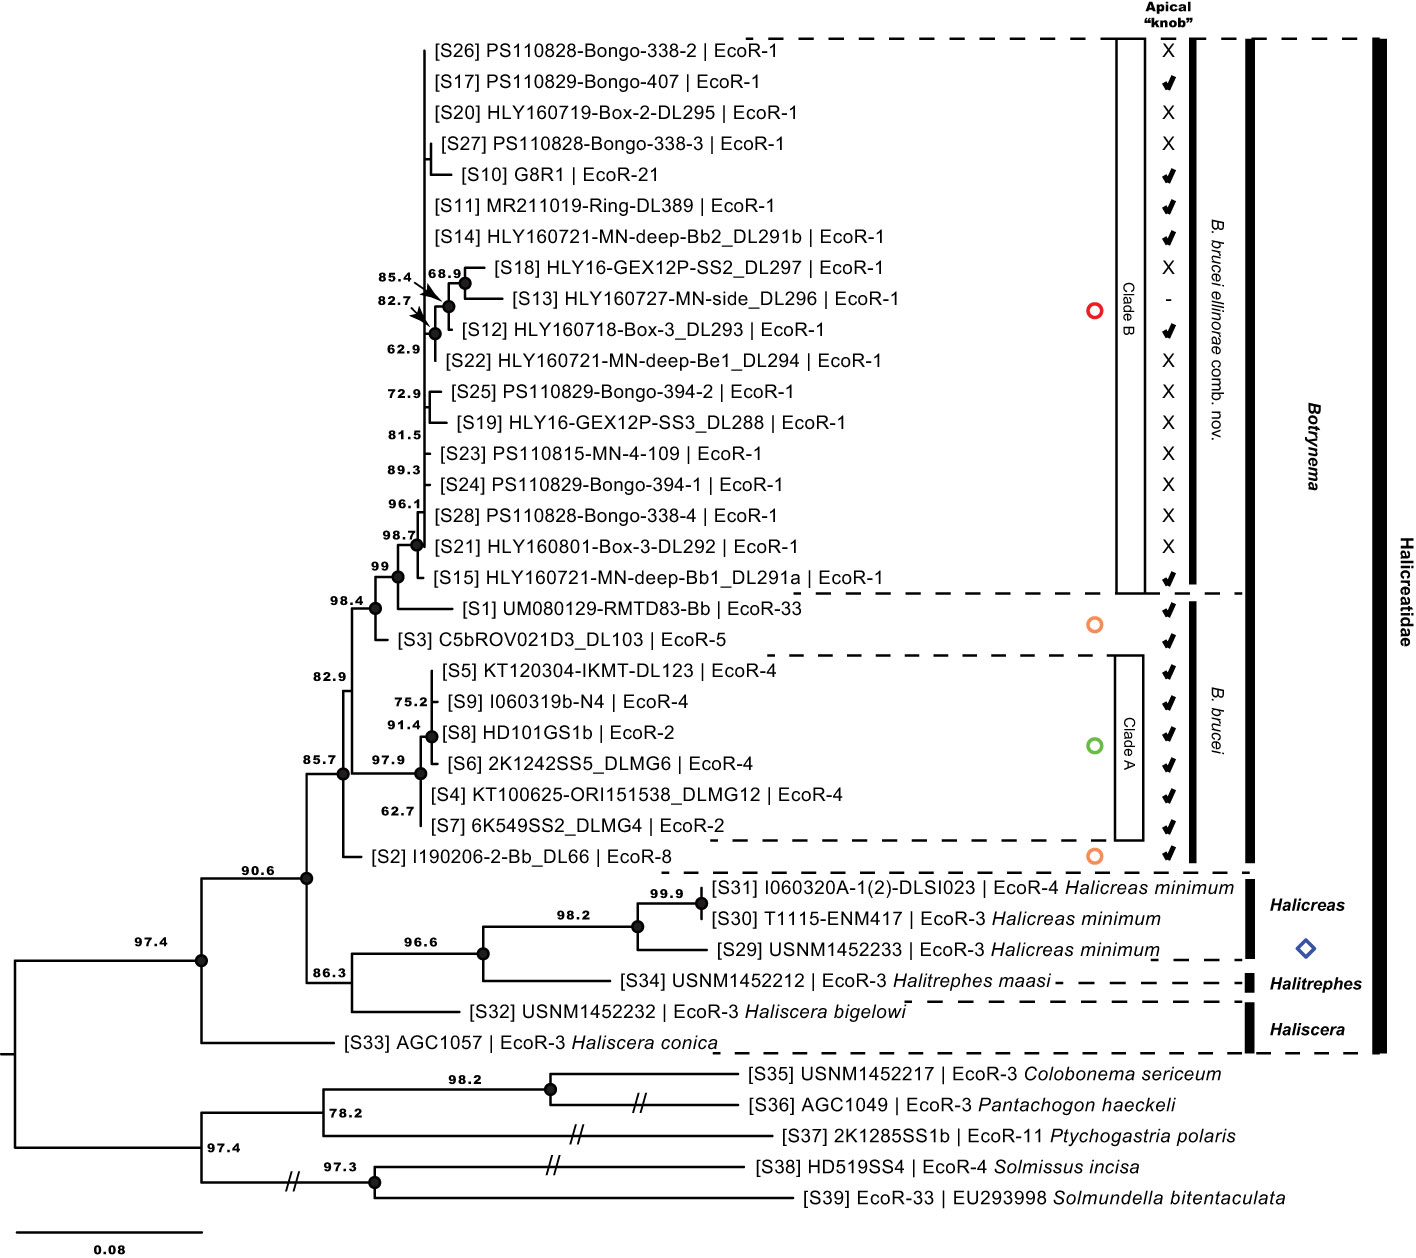
Figure 4 Maximum likelihood phylogenetic reconstruction based on the 16S-rDNA region. Values on branch nodes indicate likelihood bootstrap support over 50%. Full black circles on branch nodes represent Bayesian posterior probability support over 95%. Diamonds correspond to the genera Haliscera, Halitrephes and Halicreas in the family Halicreatidae. Circles refer to the genus Botrynema, in green Clade A, red Clade B, and in orange single lineages not corresponding either to Clade A nor B Numbers in brackets are concordant with the “S#” in Supplementary Table 1, 2. Note how the presence/absence of an apical “knob” is variable across clade B – B brucei ellinorae comb. nov. (see Figure 5).
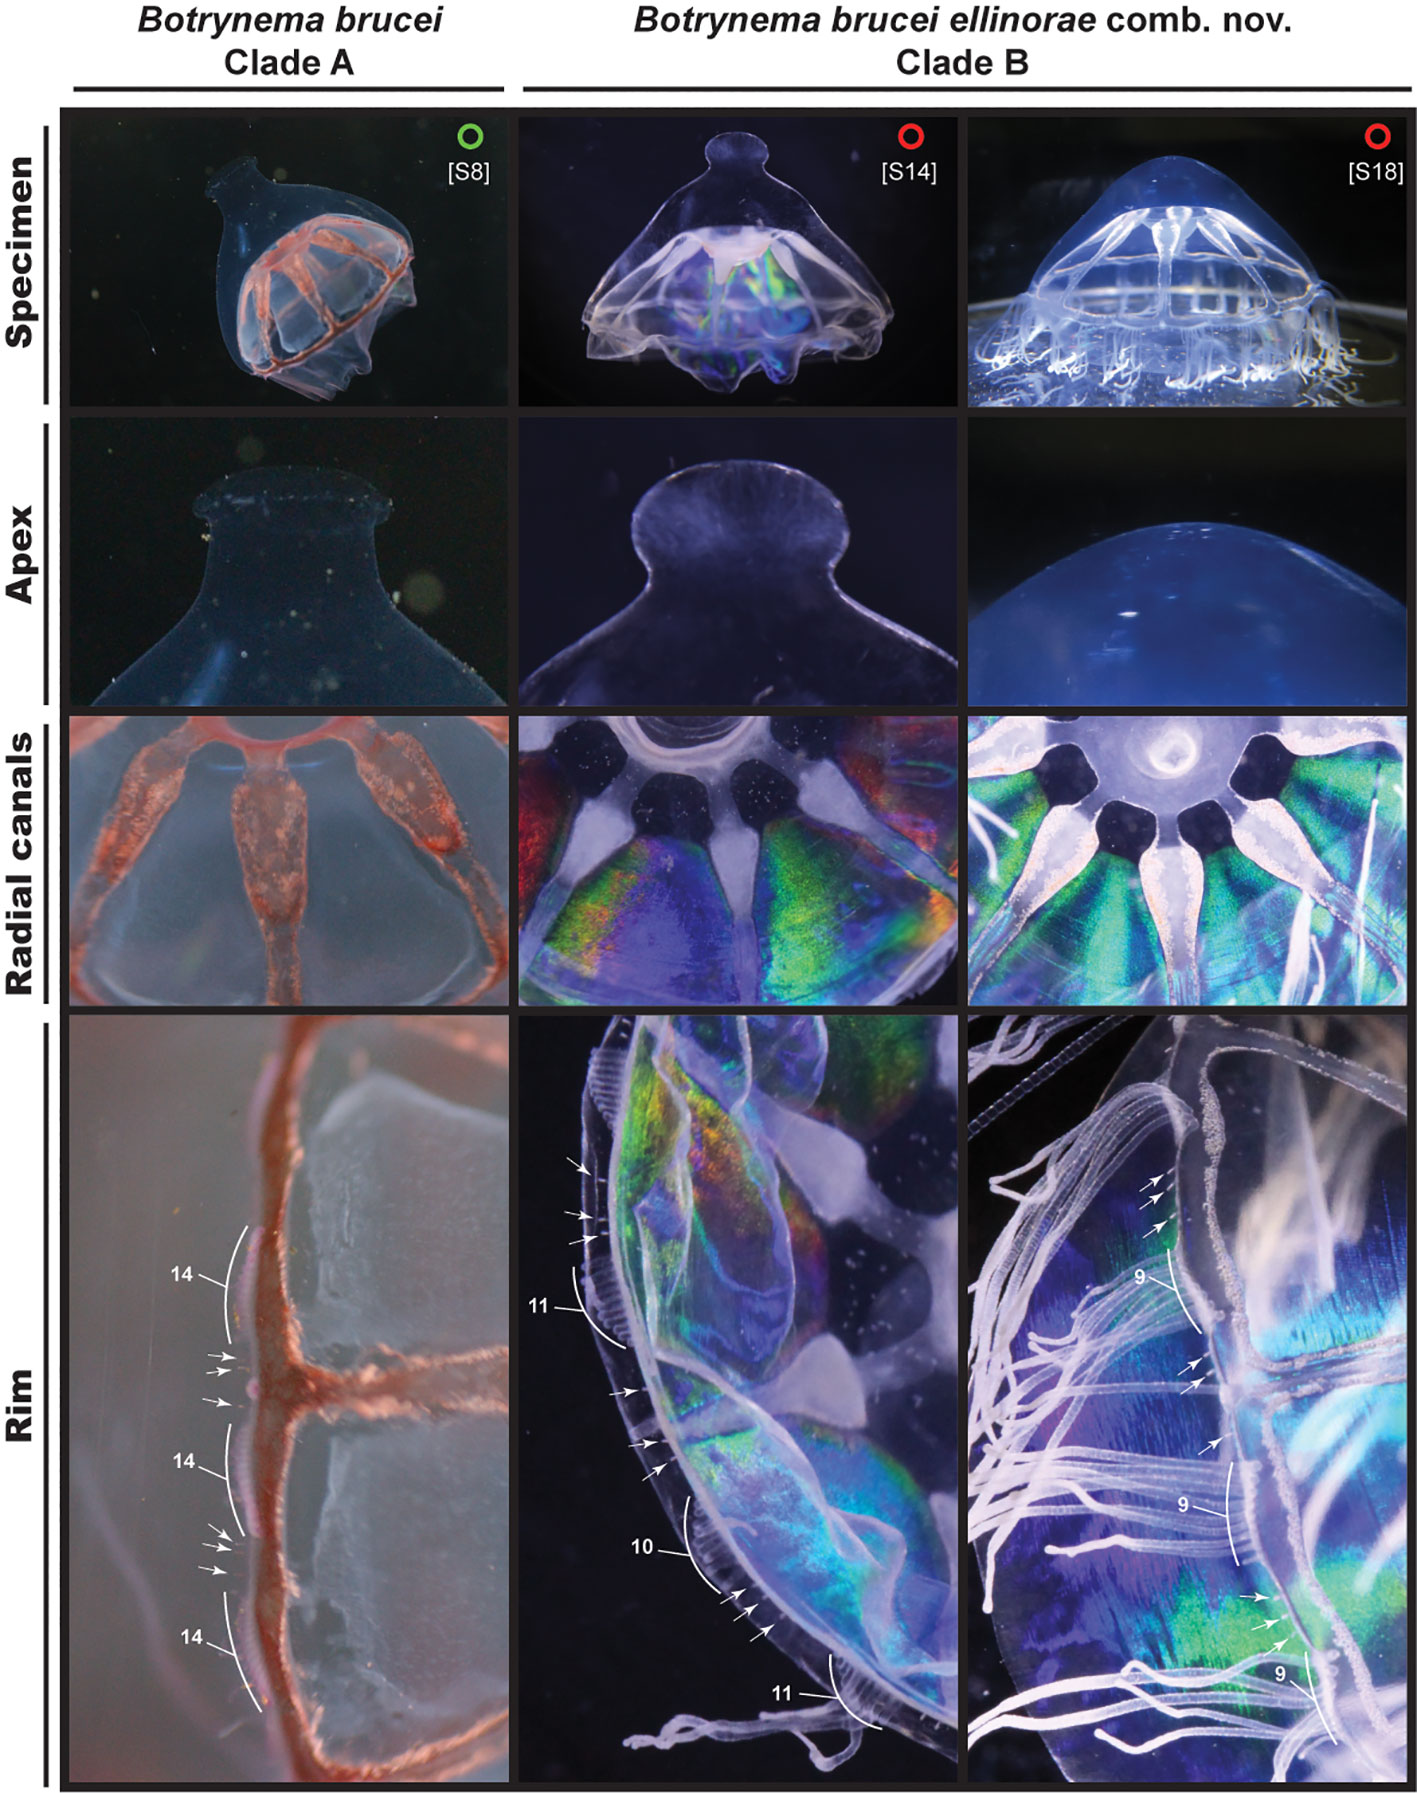
Figure 5 Comparison between specimens of B brucei and B brucei ellinorae comb. nov. Circles refer to specimens of Botrynema within Clade A in green, and red for Clade B (Figures 3, 4). Note the clear differences in the shape of the apical knob, when present, between clades A and B White arrows show the location of statocyst and numbers indicate the number tentacles per octant.
The monophyletic group formed by the genus Botrynema, which is the focus of this study, was well supported in all ML (≥80 boostrap) and BI (>0.98 probability) analyses. However no clear differentiation was discovered between the two presently accepted species, B. ellinorae and B. brucei. Nonetheless, two distinct clades were found, Clade A and Clade B, in all phylogenetic reconstructions (Figures 3, 4). Clade A is strongly supported with a bootstrap >92 in ML and full support in BI across all analyses, and it was exclusively comprised of specimens of B. brucei (Figures 3, 4). Similarly, Clade B was strongly supported in all ML and BI analyses, however, in this case, specimens of both B. brucei and B. ellinorae were mixed within a monophyletic group. This result was the same for both the phylogenetic reconstructions based on the concatenated alignment and on the 16S-rDNA region alone (Figures 3, 4).
3.3 Systematics
Phylum Cnidaria Hatschek, 1888
Class Hydrozoa Owen, 1843
Subclass Trachylinae Haeckel, 1879
Order Trachymedusae Haeckel, 1866
Family Halicreatidae Fewkes, 1886
According to VanHöffen (1902) and Bouillon and Boero (2006): Trachymedusae with a flattened, wide and circular manubrium; mouth circular and projected into the subumbrellar cavity as a short funnel, without peduncle; without centripetal canals; radial canals usually eight or more in number, with the exception of the genus Varitentaculata He, 1980. Marginal tentacles of different sizes, structurally similar, and arranged in a single series. Marginal tentacles with a soft, flexible, proximal portion but a stiff, spine-like distal portion. Ectodermal statocysts are free (Bouillon and Boero, 2006)
3.3.1 Genus Botrynema Browne, 1908
urn:lsid:zoobank.org:act:BECCCF10-5F75-4393-9D1E-C870A6FC5869
According to Browne (1908) and Bouillon and Boero (2006): Trachymedusae with 16 distinct groups of 11-12 tentacles, comprised of 2 groups with many tentacles in a row per octant; 8 solitary perradial tentacles. The genus name is derived from the Greek masculine noun βoτρυς (botrys=grape), meaning clustered in this context, and another Greek neuter noun νῆμᾰ (nema=thread) referring to the clustered tentacles (Figure 6F.1).
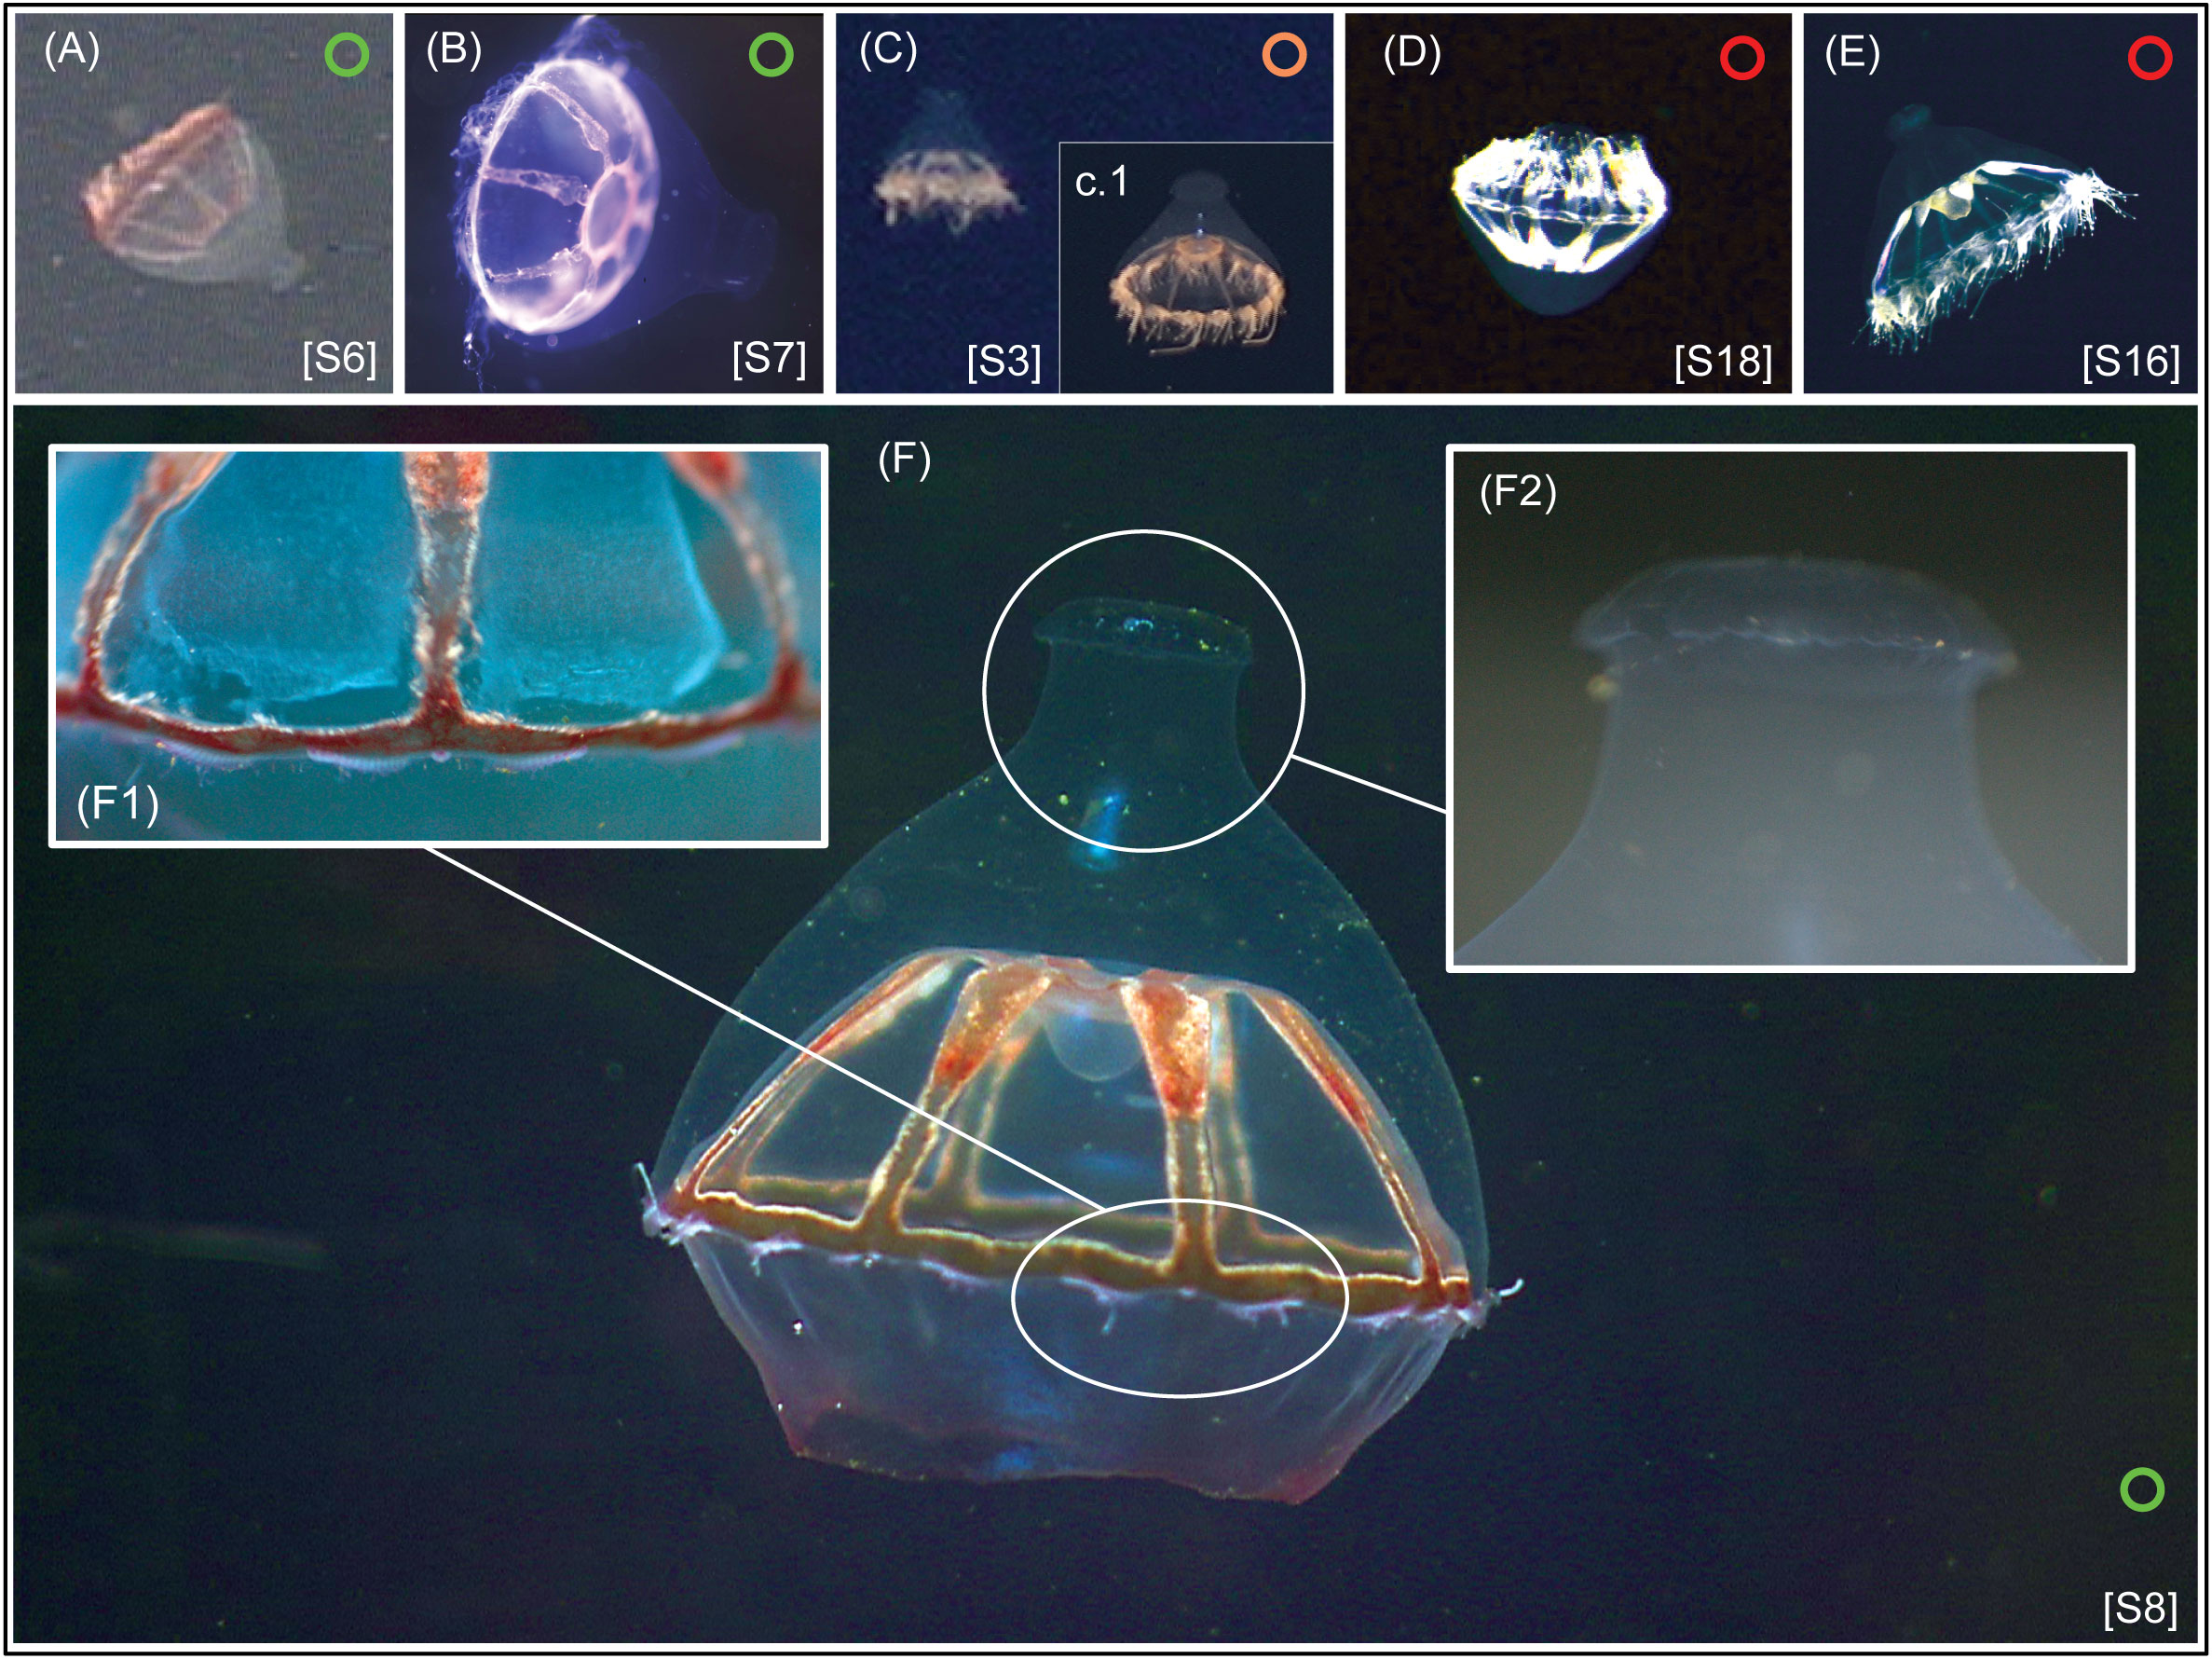
Figure 6 In-vivo pictures of some of the specimens in the genus Botrynema analyzed in this study. Specimens belonging to Clade A are marked with a green circle, belonging to Clade B with a red circle, and specimens not included in either of the clades with an orange circle. Numbers in brackets are concordant with the “S#” in Supplementary Tables 1, 2. Note how Clade A (A, B, F) is exclusively comprised of specimens where the apical knob (F2) is present, while for specimens in Clade B (D, E) the presence/absence of the knob is variable. The images in frames (C) and (C1), belong to two different specimens recorded from the Clarion-Clipperton Zone on different expeditions; frame (c) corresponds to specimen [S3], while specimen (c.1) was recorded on campaign TMC5e, ROV dive OY030, date 2021-11-27 at 2086 m depth.
3.3.2 Species Botrynema brucei Browne, 1908
urn:lsid:zoobank.org:act:4F4EE1B6-EB13-4D06-9574-2B49A74D70DA
B. brucei was described based on material from the northern Weddell Sea, Antarctica (type locality: GPS coordinates lat. -64.800, long. -44.433; Station 301) collected by the Scottish National Antarctic Expedition on 13 March 1903 in an open trawl deployed to 4545 m depth. The holotype was 25 mm in both diameter and umbrellar height, with a conspicuous conical projection on its summit (Browne, 1908). The specimen’s tentacles were arranged into distinct groups or clusters: sixteen adradial groups of tentacles, each group containing around twelve tentacles, as well as eight solitary perradial tentacles. It is worth noting that specimen UM080129-RMTD83-Bb (S1) in Supplementary Table 1 was collected from the same mesopelagic ecoregion as the holotype of B. brucei.
Analyzed material: For details on the analyzed material and collection metadata see Supplementary Table 1. In addition to molecular analyses and records on the presence or absence of the apical knob (see Figures 3, 4 and Supplementary Table 1), the number of tentacles per cluster and number of statocysts between clusters were counted on the following samples: specimen 6K549SS2_DLMG4 (S7), had 10-14 tentacles per cluster and 2-1 statocyst in-between clusters, and specimen HD101GS1b (S8) had 14 tentacles per cluster and three statocysts between clusters.
3.3.3 Subspecies Botrynema brucei ellinorae (Hartlaub, 1909) comb. nov.
urn:lsid:zoobank.org:act:00AD4909-D695-49C8-8A68-B722ACC87AD7
B. brucei ellinorae comb. nov. was initially ascribed to the newly erected genus Alloionema Hartlaub, 1909, which was later made a junior synonym of Botrynema by Bigelow (1913) according to precedence. Hartlaub (1909) described A. ellinorae from five individuals (1 specimen from St. 17, lat. 79.567, long. 2.617, 1200-1800 m, 12 July 1905; 3 specimens from St. 22, lat. 78.083, long. 5.350, 800-1350 m, 16 July 1905; one specimen from St. 48, lat. 71.367, long -18.967, 800-1000 m, 15 August 1905) collected in the Greenland Sea by the Belgica Expedition (Hartlaub, 1909). The only recognizable differences from B. brucei Browne, 1908 were the presence of “généralement de onze” (generally eleven) tentacles in each of the adradial tentacle clusters, rather than 12, and “Gelée épaisse, particulièrement au sommet où elle est développée en une masse épaisse et plus ou moins conique” (Thick jelly, especially at the top where it is developed into a thick, more or less conical mass), with no mention of a conspicuous conical projection at the bell summit, or an apical “knob”.
Bigelow (1913) described a further five specimens of B. ellinorae from the Bering Sea (3 specimens from St. 4760, lat. 53.883, long. -144.883, 0-549 m, 21 May 1906; 1 specimen from St. 4763, lat. 53.950, long. -168.100, 0-549 m, 28 May 1906; 1 specimen from St. 4764, lat. 53.333, long. -171.000, 0-2067 m, 29 May 1906) of 8-13 mm umbrellar diameter. His specimens had apical gelatinous projections and 7-11 tentacles per adradial cluster (Bigelow, 1913). His identification was based not by the presence or absence of an apical knob or the exact number of tentacles in each group, but rather on his belief that the characters diagnostic for B. brucei were that the umbrella margin is cleft into lobes and that the perradial tentacles lie in exumbral grooves. Bigelow “retained provisionally” both species and moved Alloionema ellinorae into the genus Botrynema.
Analyzed material: For details on the analyzed material and collection metadata see Supplementary Table 1. In addition to molecular analyses and records on the presence or absence of the apical knob (see Figures 3, 4 and Supplementary Table1), the number of tentacles per cluster and statocysts between clusters were counted on the following samples: specimens HLY160718-Box-3_DL293 (S12), HLY160721-MN-deep-Bb2_DL291b (S14), HLY16-GEX7P-SS5_DL290 (S16), HLY16-GEX12P-SS2_DL297 (S18) had three statocysts in between tentacle clusters while specimen HLY16-GEX12P-SS3_DL288 (S19) had two. The tentacle numbers were variable, nine per cluster in specimens S18 and S19, 12 tentacles in S12, between 10-11 tentacles in S14, and 13 tentacles in S16.
Diagnosis: multiple nucleotide substitutions across the 16S-rDNA region differentiate B. brucei ellinorae comb. nov. (Clade B) from other B. brucei populations. Botrynema brucei ellinorae comb. nov. always has the following combination of positions and bases in the 16S ribosomal DNA sequence alignment: 47=C, 115=G, 160=T, 210=G, 219=G, 283=G, 295&296=deletion, 321=C, 335=T, 349-351=TTT, 380=T, 381=A, 382=T, 384=G, 388=G (Figure 7). The apical knob in B. brucei ellinorae comb. nov. can be present or not, when present the knob is round and without pronounced perpendicular surfaces while, in contrast, in B. brucei the knob is always present and prismoidal in aspect (Figure 5).
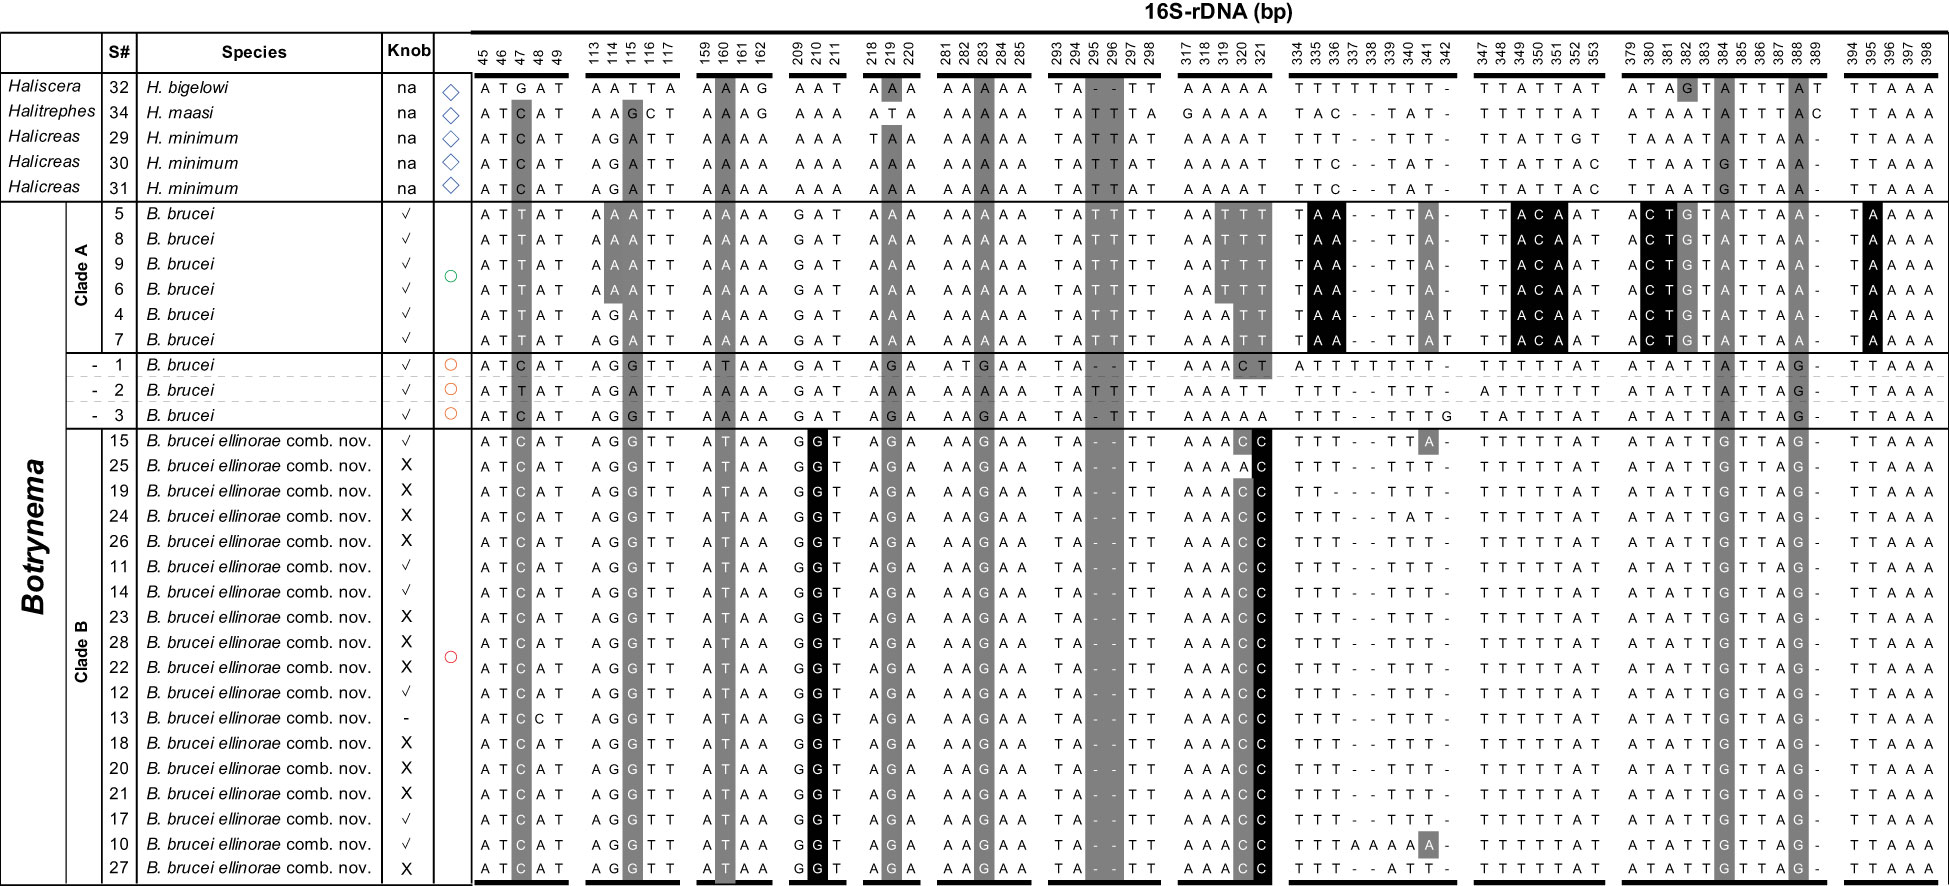
Figure 7 Differential molecular diagnosis between B brucei (Clade A) and B brucei ellinorae comb. nov. (Clade B) across the 16S-rDNA region. Nucleotide bases with a black background show substitutions unique to each clade within the family Halicreatidae. Bases with a grey background indicates polymorphic positions that are characteristic but not unique to any particular clade within the family Halicreatidae. Blue diamond symbols correspond to the genera Haliscera, Halitrephes and Halicreas in the family Halicreatidae. Circles refer to the genus Botrynema, in green Clade A, red Clade B, and in orange single genotypes not corresponding either to Clade A nor B Note how the presence/absence of an apical “knob” is variable across Clade B.
Comments: B. brucei ellinorae comb. nov. appears to be primarily distributed across the Arctic Ocean and higher latitudes in the North Atlantic Ocean, in particular the Northwest Atlantic Subarctic and the North Atlantic Drift – ecoregions 1, 21 and 22, respectively (Figure 1). However, given the global distribution of B. brucei, and the lack of further genomic and morphological information from the Arctic and nearby ecoregions we consider that it is safer to refer to B. brucei ellinorae comb. nov. as a subspecies, rather than as stand-alone species within the genus Botrynema. Furthermore, Botrynema from ecoregions 5, 8 and 33 appear to each represent single lineages apart from clade A or B (Figure 4), but additional samples and analyses are needed to verify these suspicions.
The present material suggests that other minor physical differences may allow the lineages to be separated morphologically. For example, B. brucei from Clade A appears to have between 10-14 tentacles per cluster and 1-3 statocysts between clusters, while in B. brucei ellinorae comb. nov. the tentacle number per cluster ranges between 9-13 and it has 2-3 statocysts between each cluster. Additionally, B. brucei ellinorae comb. nov. often has whitish radial canals and gonads (Figures 6D, E), while B. brucei from most other ecoregions are pinkish, orangish or reddish in color (Figures 6A– C, F), though it is worth mentioning that Browne (1908) described B. brucei from the type locality (ecoregion 33), as having a whitish coloration and with no traces of red or reddish brown pigments.
4 Discussion
4.1 Heterogeneity of diagnostic characters in Genus Botrynema
Since Kramp (1942), B. brucei and B. ellinorae have been considered easy to differentiate by using the presence or absence of an apical knob (Figure 6.F2) as the primary diagnostic character – the knob being conspicuous in B. brucei but absent in B. ellinorae. Nonetheless, our results refute this hypothesis and demonstrate that the presence or absence of a knob is taxonomically irrelevant across ecoregions 1 and 21, and perhaps 22 (Hosia et al., 2008), while Botrynema from all other ecoregions have an apical knob. Furthermore, molecular analyses failed to identify any genetic differences between the two phenotypes in the Arctic Ocean, though ecological differences may explain the presence or absence of the knob.
In our records, individuals with a knob, at that time identified as B. brucei, were exclusively recorded at depths below 1000 m, while individuals without a knob, at that time identified as B. ellinorae, were reported at shallower depths – commonly between 461-815 m (Figure 2) but up to a maximum of 1544 m depth. Our results mirror those of Raskoff et al. (2010) from the Arctic Ocean expedition of 2005. After surveying 400 individuals, Raskoff et al. (2010) found that B. ellinorae inhabits between 300-2000 m depth and that B. brucei is found exclusively below 1000 m, with higher abundances between 2000-3000 m. Buchanan and Sekerak (1982) also reported B. ellinorae from 1245-1900 m in Baffin Bay (ecoregion 1). Interestingly, consistent depth ranges were found for specimens of B. brucei across most of the ecoregions, regardless of large variations in physico-chemical environmental parameters. Lindsay (2005) reported maximum abundances of B. brucei in the Japan Trench between 1700-2400 m depth (ecoregion 2). Vinogradov and Shushkina (2002) reported B. brucei maximum abundance at 1700-2500 m in the Kurile-Kamtchatka region (ecoregion 2). In the Southern Ocean, near the type locality, Pagès et al. (1994) reported that B. brucei was most commonly collected in the 1000-2000 m depth layer, and Toda et al. (2014) also reported it was most common between 1000-2000 m depth in East Antarctica (ecoregion 33). Although several individuals of B. brucei have been reported within the range of 500-1000 m depth in ecoregions 2 (Lindsay, 2005), 3 (Thuesen and Childress, 1994), 13 (Grossmann et al., 2015), 24 (Larson et al., 1991) and 33 (Pagès et al., 1994; Toda et al., 2014), it is remarkable that B. brucei appears to preferentially inhabit the 1000-3000 m depth layer (Pagès et al., 1994; Vinogradov and Shushkina, 2002; Lindsay, 2005; Toda et al., 2014; Katija et al., 2022). Therefore, it is reasonable to think that the absence of Botrynema from shallower waters at lower latitudes might be a reflection of ecological constraints, i.e. temperature or inter-species competition, and that whatever that constraint is, it might be relaxed or not existent at higher latitudes.
Our working hypothesis is that the preferential distribution of Botrynema at deeper ranges outside the Arctic is the result of niche displacement due to competition with other medusozoans (Lindsay and Hunt, 2005; Robison et al., 2010). In contrast, in the Arctic where the diversity and richness of medusozoans is much lower than in other ecoregions (Raskoff et al., 2010), Botrynema has successfully colonized shallower environments. However, the association between the knob and the vertical distribution of B. brucei ellinorae comb. nov. at higher latitudes remains obscure. We think that the knob could play a role in predator avoidance; for instance, the knob could play an important function by breaking the surface tension between prey and predator nematocyst-laden surfaces, facilitating escape, or the knob could physically push apart the mouth-lips of gelatinous predators after successful ingestion, allowing B. brucei to escape, or the knob could facilitate pivot turns at sharper angles to avoid predation.
Whatever the function of the knob might be, it is interesting to note that most of the common predators of gelatinous zooplankton such as the narcomedusae, e.g. Solmissus, are prolific across most ecoregions (Raskoff, 2002; Lindsay and Hunt, 2005; Robison et al., 2010; Choy et al., 2017) but absent from shallower depths at higher latitudes (Raskoff et al., 2010) precisely the same depths where the B. brucei ellinorae comb. nov. morphotype without a knob occurs, and preferentially inhabiting between 461 m to 815 m (Figure 2). Furthermore, Bathykorus boullini, a narcomedusae and a major predator of gelatinous taxa in the Arctic, is known to be restricted to waters deeper than 1300 m and inhabit preferentially between 1400-2000 m, indeed the same depths inhabited by the B. brucei ellinorae comb. nov. morphotype with a knob. Figure 8 shows video framegrabs of Poralia rufescens, a scyphomedusa, foraging on Botrynema brucei at 1002 m depth in the Japan Trench, ecoregion 2 (Figure 1). Poralia rufescens is absent from the Arctic and known to inhabit between 500~1679 m depth (Lindsay et al., 2004; Hughes and Lindsay, 2017). Therefore, the vertical distribution of the genus Botrynema could be the result of niche displacement due to competition with other medusozoans, while the presence/absence of the knob could be determined by a differential regimen of selection by predation across ecoregions.
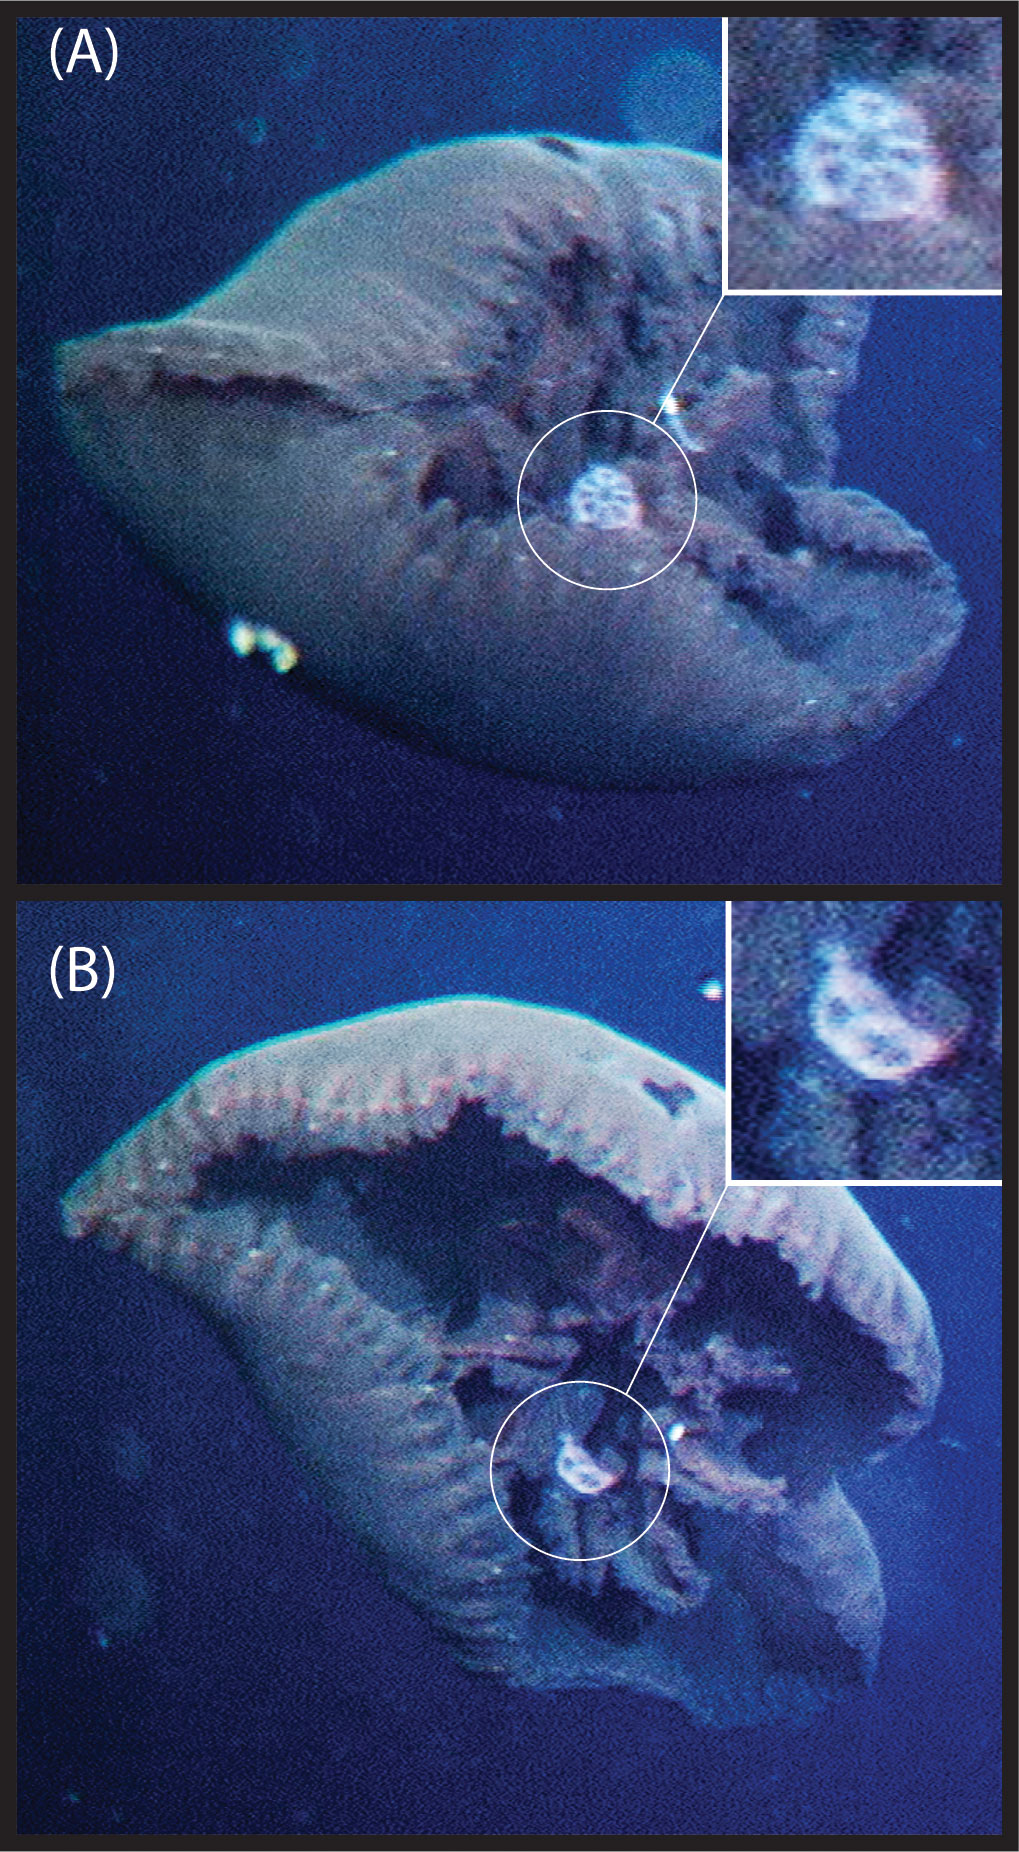
Figure 8 Footage of Poralia rufescens foraging on Botrynema brucei; frontal (A) and (B) lateral view of B brucei. The footage was recorded during cruise KY02-06 on ROV HyperDolphin dive #103 (HPD0103) in the Japan Trench (lat. 38.334, long.143.917) on 29 April 2002 at 1002 m depth, ecoregion 2 in Figure 1.
4.2 Phylogeny of the Family Halicreatidae
The family Halicreatidae was well-supported as a single monophyletic lineage across most of the analyses, and in general the same was true for the genera Halicreas, Botrynema and Halitrephes. However, the genus Haliscera was found to be paraphyletic, in concordance with Bentlage et al. (2018). While at first sight these results seem to erode the validity of Haliscera as a taxonomic unit, we think further considerations are necessary. Little taxonomic work has been done on the genus Haliscera since Kramp (1947) and an updated re-examination of characters using modern techniques might be necessary. Furthermore, currently all sequences available for the genus Haliscera come from only one specimen of each of the species, and given the coherence of the phylogenetic signal across the molecular markers in Bentlage et al. (2018), and the obvious morphological similarities between the two currently accepted Haliscera species (DJL, personal observation), we suspect that, this is likely a case of misidentification of one of these specimens rather than an actual paraphyly within the genus Haliscera.
Our analyses clarify the phylogenetic position of Halitrephes maasi, which has been challenging to determine. Our analyses revealed H. maasi to be the sister to a clade of Halicreas minimum with almost full support across all phylogenetic reconstructions. However, this relationship was only weakly supported in Bentlage et al. (2018), and discordant with the results of Matsumoto et al. (2020), where the genus Halitrephes was placed as sister to all halicreatids with total support. During our analyses we found that the 16S-rDNA sequence “MG979380” was highly discordant with other sequences in the family Halicreatidae. After comparing this sequence against the information available in GenBank it was discovered that “MG979380” is actually attributable to the rhopalonematid trachymedusa Crossota alba, rather than to a Halitrephes species, but it has been repeatedly used in the concatenations for Halitrephes maasi across multiple studies (Bentlage et al., 2018; Matsumoto et al., 2020). Therefore, in Supplementary Table 2 we present new sequencing information derived from the same specimen analyzed in Bentlage et al. (2018), voucher USNM1452212, with a correct 16S-rDNA sequence under the GenBank accession number “OP921299”. Our data provide strong evidence that the genus Halitrephes is sister to the genus Halicreas, rather than it being an earlier diverging lineage within the family Halicreatidae (Bentlage et al., 2018; Matsumoto et al., 2020).
The source of the mistake in the specific attribution of the sequence “MG979380” could have occurred anywhere in the analysis pipeline but it is worth noting that in medusozoan studies cross-contamination is not always the result of human error. When stressed, some medusozoans, such as the rhopalonematid medusae to which Crossota alba belongs, have the tendency to autotomize tentacles and these often get attached to nearby specimens (DJL, personal observation). Furthermore, the low-rate of DNA/tissue wet-mass in gelatinous taxa makes this issue particularly problematic. A solution to this common problem could be the use of single molecule sequencing technologies along with bioinformatic tools to differentiate target sequences from contaminants, i.e. CD-HIT (Fu et al., 2012).
4.3 Phylogeny of the Genus Botrynema
Our results ratify the validity of the genus Botrynema as a taxonomic and evolutionary unit across ecoregions with strong support (Figures 3, 4). Botrynema morphotypes with an apical knob are widely distributed throughout the Arctic, Pacific and Antarctic Oceans, in ecoregions 1, 2, 4, 5, 8, 21 and 33, while the morphotype without a knob is restricted to the Arctic Ocean, ecoregion 1 (Figure 1). Additionally, Hosia et al. (2008) reported both morphotypes from the North Atlantic Drift, ecoregion 22. Nonetheless, our phylogenetic analyses revealed major incongruences with the use of the knob as a diagnostic character, and contrary to expectations, specimens with a knob were found to be paraphyletic, and present in the two main monophyletic clades, A and B in Figures 3 and 4. Furthermore it is possible than Botrynema brucei, a lineage comprising exclusively individuals with a knob may be a species complex with multiple putative populations represented by single lineages in ecoregions 5, 8 and 33. Unfortunately, currently no sequences are available for Botrynema specimens sampled anywhere between the far North Atlantic and the Southern Ocean or the Indian Ocean, which oceanographically would be expected to have the highest possibility of containing hybridization zones between the Arctic population and other currently sampled populations. The single sequence from the Southern Ocean sequenced in this study clustered as sister to the Arctic clade in both ML and BI analyses, as would be expected oceanographically due to the lack of deep-water exchange between the Arctic and North Pacific Oceans. Interestingly, the sequence from the CCZ was found to be sister to the Arctic+Antarctic Botrynema clade, possibly due to the influence of Antarctic Intermediate Water (AAIW) flowing northwest across the Pacific from the subantarctic zone near Chile. The single sequence from the southeast Pacific Ocean was ostensibly from ecoregion 8 (the southern central Pacific) but was in fact very close to ecoregion 7 (Peru upwelling/Humboldt Current) and therefore presumably not as strongly influenced by the AAIW (Figure 1). Its genetic placement within the Botrynema world population remains uncertain.
In summary, our molecular analyses clearly demonstrate the Arctic Ocean population of Botrynema is monophyletic, regardless of the presence or absence of an apical knob. Botrynema from the Arctic Ocean (ecoregion 1) are hereby amalgamated as the subspecies Botrynema brucei ellinorae comb. nov., diagnosed by sometimes lacking an apical knob and by multiple unique substitutions and deletions in the 16S ribosomal DNA sequence (Figure 7). At least some B. brucei in ecoregions 21 and 22 are also referable to this subspecies, but splitting the globally distributed species B. brucei into multiple subspecies, other than B. brucei ellinorae comb. nov., is not presently possible due to a lack of geographic sampling and an exhaustive study of morphologies.
Phylogenetic analyses clearly support B. brucei ellinorae comb. nov. as a monophyletic group, referred to as clade B in Figure 3 and 4. Furthermore, multiple SNP sites across the 16S-rDNA region set clade A and B apart (Figure 7), corroborating the view of phylogenetic independence between those clades. Our personal observations also suggest that there may be stable, recognizable morphological differences between representatives of clades A and B, specifically in terms of coloration, number of tentacles per cluster, and the shape of the knob when present (Figure 5, see section 4.3). The delineation of these characters and their relationship to the taxonomy awaits the collection and analysis of further material.
Based on the data presented in this study concerning B. brucei ellinorae comb. nov., we hypothesize that this lineage might be currently in an ongoing process of speciation (i.e. Johannesson et al., 1993; Levy et al., 2021) as follows: after B. brucei ellinorae comb. nov. successfully colonized ecoregion 1, an environment relatively free from large narcomedusan predators at shallower mesopelagic depths (Raskoff et al., 2010), the selective pressures maintaining the presence of a knob in the other ecoregions were relaxed. Under these circumstances, it is theoretically possible for the apical knob, an adaptive trait, to be drifting neutrally across the population of B. brucei ellinorae comb. nov. but passively segregating individuals across a depth gradient, e.g., by leading to differential optimal distribution depths determined by the mesogleal mass’s contribution to buoyancy (Mills, 1981), and thus slowly favoring the evolution of reproductive isolation between phenotypes. Alternatively, the presence or absence of the knob could represent two extremes of the morpho-space in B. brucei ellinorae comb. nov. The development of the knob might be favored at mesopelagic and bathypelagic habitats as an epigenetic response against predation by Bathykorus bouilloni, which is most common between 1400-2000 m depth (Raskoff, 2010). Hence B. brucei ellinorae comb. nov. individuals without a knob are mainly reported above 1000 m while the B. brucei ellinorae comb. nov. individuals with a knob are often seen below 1000m. Whichever the reason supporting the existence of two morphotypes in B. brucei ellinorae comb. nov., the genetic flow remains strong at the contact zone between 1100 m to 1600 m depth (Figure 2), hence our inability to detect genetic differences between the two phenotypes of B. brucei ellinorae comb. nov. Although the two morphotypes may represent different species according to the ecospecies concept, they appear to be a single species according to the phylogenetic species concept.
It is important to note that the molecular analyses performed in this study are limited and lack the power necessary to draw further conclusions. Therefore, future studies should perform whole genome analyses, for SNP calling and comparative genomics to detect regions of genetic differentiation associated with the segregation of individuals by depth and phenotype (e.g., Durand et al., 2022). Furthermore, if our hypothesis of the knob as an adaptive trait is correct, the genomic region associated with the knob should exhibit differential genetic variation across ecoregions; with a larger variation in regions where the predation pressure is relaxed, and lower variation in regions where narcomedusan predators are more common (e.g., Lamichhaney et al., 2015). The genomic regions associated with the knob could be narrowed down by doing a population-wide association mapping study or bulk segregation analyses over the Arctic population of B. brucei ellinorae comb. nov. where both phenotypes are present (e.g., Johnston et al., 2011; Montenegro et al., 2022).
4.4 Points to be aware of for future studies
In this study we sequenced commonly used taxonomic markers for the characterization of medusozoans (Supplementary Table 2). Partial amplifications of 16S-rDNA, 18S-rDNA and 28S-rDNA were easily achievable across most of the specimens analyzed, with 16S-rDNA being the marker with the highest success rate. However, in our experiments COI-mtDNA was notoriously difficult to amplify and, because of the unpopularity of publishing negative results, this issue remains a known fact amongst medusozoan taxonomists, though it has not been formally acknowledged.
In particular, for the family Halicreatidae only two studies have successfully amplified COI-mtDNA (Bucklin et al., 2010; Ortman et al., 2010), and therefore sequences are conspicuous for their absence in phylogenetic studies (Collins et al., 2008; Bentlage et al., 2018) and public repositories. Accordingly, multiple studies have found COI-mtDNA difficult to amplify in medusozoans, and instead have targeted 16S-rDNA as a more informative and easier-to-amplify marker for barcoding and phylogenetic analyses (Hellberg, 2006; Miglietta et al., 2009; Moura et al., 2011; Zheng et al., 2014; Lindsay et al., 2015). In the near future, advantage should be taken of long-read sequencing technologies such as ONT nanopore (Wang et al., 2021) and genome skimming approaches that can result in longer portions or complete mitochondrial genomes in the absence of PCR. The resulting data should facilitate the design of new primers targeting adjacent conservative regions, and open the door to more widespread voucher-based amplification of COI-mtDNA across medusozoans. Such a step will have many benefits, not the least of which will be the ability to more readily detect medusozoan diversity captured within metabarcoding profiles derived from environmental samples. We encourage future studies to release negative results with the aim of avoiding wastage with respect to resources and time.
5 Conclusions
In synthesis, our study reports for the first time a comprehensive molecular analysis of the genus Botrynema in the family Halicreatidae across mesopelagic ecoregions around the globe. Based on the evidence from molecular analyses, field observations, and video footage we conclude that:
1. The use of the presence or absence of an apical knob to distinguish species in the genus Botrynema lacks systematic and phylogenetic support, and therefore should be discontinued.
2. Botrynema brucei ellinorae comb. nov. is a valid taxonomic and evolutionary unit that contains two phenotypes, one with and one without an apical knob.
3. Botrynema brucei ellinorae comb. nov. is mainly distributed across higher latitudes in the Arctic Ocean, the Northwest Atlantic Subarctic and the North Atlantic Drift; ecoregions 1, 21 and 22 in Figure 1.
4. Until further samples and molecular analyses are performed, all other specimens of Botrynema with an apical knob and from ecoregions others than 1, 21 and 22 (Figure 1), should be referred to as B. brucei.
5. Genome wide SNPs and whole genome comparative analyses will be necessary to understand the evolutionary basis for the differential segregation of B. brucei ellinorae comb. nov. individuals of different phenotypes across the depth gradient.
The answer to the question do the two nominal species in the genus Botrynema represent independent phylogenetic lineages, or two phenotypic variants of a single species? was partially addressed, and we are certain that at least two primary phylogenetic lineages exist within Botrynema. However, contrary to our expectations, these lineages were not defined by the presence or absence of an apical knob. Rather, our results clearly indicated that the lineages are geographically defined, and that the presence or absence of the knob might be determined by differential selective pressure across ecoregions.
Data availability statement
The sequencing data presented in the study is deposited in the GenBank repository, accession number OP921244-OP921299; The data for the phylogenetic reconstruction and additional pictures of specimens are deposited in the figshare repository, accession link. dx.doi.org/10.6084/m9.figshare.21665519. Further enquiries can be directed to the corresponding author. Sampling collection and GenBank accession numbers for allspecimens included in this study can be found in Supplementary Tables 1 and 2 respectively. Detailed information on the DNA extraction protocols can be found in Supplement 1.
Author contributions
JM, DL, AC, RH outlined and conceptualized the study. JM, DL, RH, JQ, JD, ET, TB, LB, MS participated in research cruises, data collection, and species identification. JM, AC, JQ performed DNA lab work. JM, DL, RH undertook morphological analyses. JM, DL performed all computational analyses. DL, LB, MS performed video analyses. JM and DL wrote the original draft of the manuscript with contributions from JD, AC, RH, JQ, ET. All authors contributed to the article. All authors reviewed and approved the submitted version.
Funding
This project was partially supported by funding from The Metals Company in a joint collaboration between the University of Hawaii and JAMSTEC. Authors JM, DL, JD, ET, TB, LB received support from TMC (The Metals Company Inc.) through its subsidiary Nauru Ocean Resources Inc. (NORI). NORI holds exploration rights to the NORI-D contract area in the CCZ regulated by the International Seabed Authority and sponsored by the government of Nauru. This is contribution TMC/NORI/D/003. This work was also partially funded by Japan Society for the Promotion of Science (JSPS) KAKENHI grant numbers 24248032, 26304030 and 23405031, JST grant CREST, the Cross-ministerial Strategic Innovation Promotion Program (SIP) for the Development of New-generation Research Protocols for Submarine Resources, MEXT Grant-in-Aid for Scientific Research on Innovative Areas TAIGA (20109003). Arctic collections have been supported by NOAA’s Office of Ocean Exploration and Research (grants NA05OAR4601079, NA15OAR0110209). The authors declare that this study received funding from The Metals Company Inc. and its subsidiary Nauru Ocean Resources Inc. (NORI). The funder was not involved in the study design, collection, analysis, interpretation of data, the writing of this article, or the decision to submit it for publication.
Acknowledgments
We are grateful to the reviewers for critical and constructive comments on the manuscript. We thank the scientific parties, ship crews, submersible and ROV pilots for all the research cruises contributing to this paper. We give special thanks to Kohei Matsuno from Hokkaido University, Mary Grossmann and Gerlien Verhaegen for providing invaluable samples for this study. We thank Ms. Kumiko Oshima and Dr. M. Hidaka for crucial assistance with the video analyses. DL’s travel to Antarctica was funded by the Census of Marine Zooplankton (CMarZ) within the Census of Marine Life (CoML), and to the Arctic by the University of Alaska Fairbanks. This study is a contribution to the Deep Ocean Stewardship Initiative (DOSI). Some of the genetic benchwork and sequencing was completed at the Smithsonian NMNH Laboratories of Analytical Biology (LAB).
Conflict of interest
The authors declare that the research was conducted in the absence of any commercial or financial relationships that could be construed as a potential conflict of interest.
Publisher’s note
All claims expressed in this article are solely those of the authors and do not necessarily represent those of their affiliated organizations, or those of the publisher, the editors and the reviewers. Any product that may be evaluated in this article, or claim that may be made by its manufacturer, is not guaranteed or endorsed by the publisher.
Supplementary material
The Supplementary Material for this article can be found online at: https://www.frontiersin.org/articles/10.3389/fmars.2022.1101699/full#supplementary-material
References
Abboud S. S., Gómez Daglio L., Dawson M. N. (2018). A global estimate of genetic and geographic differentiation in macromedusae–implications for identifying the causes of jellyfish blooms. Mar. Ecol. Prog. Ser. 591, 199–216. doi: 10.3354/meps12521
Apakupakul K., Siddall M. E., Burreson E. M. (1999). Higher level relationships of leeches (Annelida: Clitellata: Euhirudinea) based on morphology and gene sequences. Mol. Phylogenet. Evol. 12, 350–359. doi: 10.1006/mpev.1999.0639
Apolônio Silva de Oliveira D., Decraemer W., Moens T., Dos Santos G. A. P., Derycke S. (2017). Low genetic but high morphological variation over more than 1000 km coastline refutes omnipresence of cryptic diversity in marine nematodes. BMC Evol. Biol. 17, 71. doi: 10.1186/s12862-017-0908-0
WoRMS - world register of marine species. Available at: https://www.marinespecies.org/ (Accessed October 27, 2022).
Bentlage B., Osborn K. J., Lindsay D. J., Hopcroft R. R., Raskoff K. A., Collins A. G. (2018). Loss of metagenesis and evolution of a parasitic life style in a group of open-ocean jellyfish. Mol. Phylogenet. Evol. 124, 50–59. doi: 10.1016/j.ympev.2018.02.030
Bickford D., Lohman D. J., Sodhi N. S., Ng P. K. L., Meier R., Winker K., et al. (2007). Cryptic species as a window on diversity and conservation. Trends Ecol. Evol. 22, 148–155. doi: 10.1016/j.tree.2006.11.004
Bigelow H. B. (1913) Medusae and siphonophorae collected by the u. s. fisheries stemier “Albatross” in the northwestern pacific 1906. Available at: https://repository.si.edu/bitstream/handle/10088/14430/USNMP-44_1946_1913.pdf?sequence=1&isAllowed=y (Accessed September 1, 2022).
Bouillon J., Boero F. (2006). An introduction to hydrozoa (Paris, France: Publications Scientifiques du Muséum).
Browne E. T. (1908). X.–the medusæ of the Scottish national Antarctic expedition. Earth Environ. Sci. Trans. R. Soc Edinb. 46, 233–251. doi: 10.1017/S008045680000274X
Buchanan R. A., Sekerak A. D. (1982). Vertical distribution of zooplankton in Eastern Lancaster sound and Western Baffin bay, July - October 1978. Arctic 35, 41–55. doi: 10.14430/arctic2306
Bucklin A., Hopcroft R. R., Kosobokova K. N., Nigro L. M., Ortman B. D., Jennings R. M., et al. (2010). DNA Barcoding of Arctic ocean holozooplankton for species identification and recognition. Deep Sea Res. Part 2 Top. Stud. Oceanogr. 57, 40–48. doi: 10.1016/j.dsr2.2009.08.005
Choy C. A., Haddock S. H. D., Robison B. H. (2017). Deep pelagic food web structure as revealed by in situ feeding observations. Proc. Biol. Sci. 284. doi: 10.1098/rspb.2017.2116
Collins A. G., Bentlage B., Lindner A., Lindsay D., Haddock S. H. D., Jarms G., et al. (2008). Phylogenetics of trachylina (Cnidaria: Hydrozoa) with new insights on the evolution of some problematical taxa. J. Mar. Biol. Assoc. U. K. 88, 1673–1685. doi: 10.1017/S0025315408001732
Core Team R. R. (2009) R: A language and environment for statistical computing. Available at: https://hero.epa.gov/hero/index.cfm/reference/details/reference_id/7469942 (Accessed September 26, 2022).
Cunha A. F., Maronna M. M., Marques A. C. (2016). Variability on microevolutionary and macroevolutionary scales: a review on patterns of morphological variation in cnidaria medusozoa. Org. Divers. Evol. 16, 431–442. doi: 10.1007/s13127-016-0276-4
Cunningham C. W., Buss L. W. (1993). Molecular evidence for multiple episodes of paedomorphosis in the family hydractiniidae. Biochem. Syst. Ecol. 21, 57–69. doi: 10.1016/0305-1978(93)90009-G
Daglio L. G., Dawson M. N. (2017). Species richness of jellyfishes (Scyphozoa : Discomedusae) in the tropical Eastern pacific: missed taxa, molecules, and morphology match in a biodiversity hotspot. Invertebr. Syst. 31, 635–663. doi: 10.1071/IS16055
Darriba D., Posada D., Kozlov A. M., Stamatakis A., Morel B., Flouri T. (2020). ModelTest-NG: A new and scalable tool for the selection of DNA and protein evolutionary models. Mol. Biol. Evol. 37, 291–294. doi: 10.1093/molbev/msz189
Durand K., Yainna S., Nam K. (2022). Incipient speciation between host-plant strains in the fall armyworm. BMC Ecol. Evol. 22, 52. doi: 10.1186/s12862-022-02008-7
Easson C. G., Boswell K. M., Tucker N., Warren J. D., Lopez J. V. (2020). Combined eDNA and acoustic analysis reflects diel vertical migration of mixed consortia in the gulf of Mexico. Front. Mar. Sci. 7, 552. doi: 10.3389/fmars.2020.00552
Fewkes J. W. (1886). Report on the medusae collected by the U.S. fish commission steamer albatross in the region of the gulf stream in 1883-’84. U.S. Gov. Printing Office 952–954.
Friedman A. (2022). SQUIDLE+–a tool for managing, exploring & annotating images, video & Large-scale mosaics. Available at: https://squidle.org/ (Accessed October 27, 2022).
Fu L., Niu B., Zhu Z., Wu S., Li W. (2012). CD-HIT: accelerated for clustering the next-generation sequencing data. Bioinformatics 28, 3150–3152. doi: 10.1093/bioinformatics/bts565
Gascuel O. (1997). BIONJ: an improved version of the NJ algorithm based on a simple model of sequence data. Mol. Biol. Evol. 14, 685–695. doi: 10.1093/oxfordjournals.molbev.a025808
Geller J., Meyer C., Parker M., Hawk H. (2013). Redesign of PCR primers for mitochondrial cytochrome c oxidase subunit I for marine invertebrates and application in all-taxa biotic surveys. Mol. Ecol. Resour. 13, 851–861. doi: 10.1111/1755-0998.12138
Gorsky G., Ohman M. D., Picheral M., Gasparini S., Stemmann L., Romagnan J.-B., et al. (2010). Digital zooplankton image analysis using the ZooScan integrated system. J. Plankton Res. 32, 285–303. doi: 10.1093/plankt/fbp124
Grossmann M. M., Nishikawa J., Lindsay D. J. (2015). Diversity and community structure of pelagic cnidarians in the celebes and sulu seas, southeast Asian tropical marginal seas. Deep Sea Res. Part I 100, 54–63. doi: 10.1016/j.dsr.2015.02.005
Guindon S., Dufayard J.-F., Lefort V., Anisimova M., Hordijk W., Gascuel O. (2010). New algorithms and methods to estimate maximum-likelihood phylogenies: Assessing the performance of PhyML 3.0. Syst. Biol. 59, 307–321. doi: 10.1093/sysbio/syq010
Hajibabaei M., Singer G. A. C., Hebert P. D. N., Hickey D. A. (2007). DNA Barcoding: how it complements taxonomy, molecular phylogenetics and population genetics. Trends Genet. 23, 167–172. doi: 10.1016/j.tig.2007.02.001
Hartlaub C. (1909) Croisière oceéanographique : accomplie à bord de la belgica dans la mer du grönland, Vol. 1905 Eds. de Gomery G., Orleans L. P. R., Bulens B. C., 463–478. Bruxelles, C. Bulens.
Hay J. M., Sarre S. D., Lambert D. M., Allendorf F. W., Daugherty C. H. (2010). Genetic diversity and taxonomy: a reassessment of species designation in tuatara (Sphenodon: Reptilia). Conserv. Genet. 11, 1063–1081. doi: 10.1007/s10592-009-9952-7
Hellberg M. E. (2006). No variation and low synonymous substitution rates in coral mtDNA despite high nuclear variation. BMC Evol. Biol. 6, 24. doi: 10.1186/1471-2148-6-24
Hosia A., Stemmann L., Youngbluth M. (2008). Distribution of net-collected planktonic cnidarians along the northern mid-Atlantic ridge and their associations with the main water masses. Deep Sea Res. Part 2 Top. Stud. Oceanogr. 55, 106–118. doi: 10.1016/j.dsr2.2007.09.007
Hughes L. E., Lindsay D. (2017). Pseudocallisoma coecum (Holmes 1908) (Amphipoda, scopelocheiridae) and Lanceola clausi clausi bovallius 1885 (Amphipoda, lanceolidae) associated with Poralia rufescens vanhöffen 1902 (Scyphozoa, ulmaridae). Crustaceana 90, 1303–1318. doi: 10.1163/15685403-00003709
Johannesson K., Johannesson B., Rolán-Alvarez E. (1993). Morphological differentiation and genetic cohesiveness over a microenvironmental gradient in the marine snail Littorina saxatilis. Evolution 47, 1770–1787. doi: 10.2307/2410220
Johansson M. L., Shiganova T. A., Ringvold H., Stupnikova A. N., Heath D. D., MacIsaac H. J. (2018). Molecular insights into the ctenophore genus Beroe in Europe: New species, spreading invaders. J. Hered. 109, 520–529. doi: 10.1093/jhered/esy026
Johnston S. E., McEwan J. C., Pickering N. K., Kijas J. W., Beraldi D., Pilkington J. G., et al. (2011). Genome-wide association mapping identifies the genetic basis of discrete and quantitative variation in sexual weaponry in a wild sheep population. Mol. Ecol. 20, 2555–2566. doi: 10.1111/j.1365-294X.2011.05076.x
Katija K., Orenstein E., Schlining B., Lundsten L., Barnard K., Sainz G., et al. (2022). FathomNet: A global image database for enabling artificial intelligence in the ocean. Sci. Rep. 12, 15914. doi: 10.1038/s41598-022-19939-2
Katoh K., Standley D. M. (2013). MAFFT multiple sequence alignment software version 7: Improvements in performance and usability. Mol. Biol. Evol. 30, 772–780. doi: 10.1093/molbev/mst010
Knowlton N. (2000). “Molecular genetic analyses of species boundaries in the sea,” in Marine genetics. Eds. Solé-Cava A. M., Russo C. A. M., Thorpe J. P. (Dordrecht: Springer Netherlands), 73–90.
Kosobokova K., Hirche H.-J. (2000). Zooplankton distribution across the lomonosov ridge, Arctic ocean: species inventory, biomass and vertical structure. Deep Sea Res. Part I 47, 2029–2060. doi: 10.1016/S0967-0637(00)00015-7
Kramp P. L. (1947). Medusæ: Part III; trachylina and scyphozoa; with zoogeographical remarks on all the medusæ. Danish Ingolf Expedition 5 (14), 1–66.
Kramp P. L. (1961). Synopsis of the medusae of the world. J. Mar. Biol. Assoc. U. K. 40, 7–382. doi: 10.1017/S0025315400007347
Lamichhaney S., Berglund J., Almén M. S., Maqbool K., Grabherr M., Martinez-Barrio A., et al. (2015). Evolution of darwin’s finches and their beaks revealed by genome sequencing. Nature 518, 371–375. doi: 10.1038/nature14181
Larson R. J., Mills C. E., Harbison G. R. (1991). Western Atlantic Midwater hydrozoan and scyphozoan medusae: in situ studies using manned submersibles. Hydrobiologia 216, 311–317. doi: 10.1007/BF00026480
Lawley J. W., Ames C. L., Bentlage B., Yanagihara A., Goodwill R., Kayal E., et al. (2016). Box jellyfish Alatina alata has a circumtropical distribution. Biol. Bull. 231, 152–169. doi: 10.1086/690095
Lawley J. W., Gamero-Mora E., Maronna M. M., Chiaverano L. M., Stampar S. N., Hopcroft R. R., et al. (2021). The importance of molecular characters when morphological variability hinders diagnosability: systematics of the moon jellyfish genus Aurelia (Cnidaria: Scyphozoa). PeerJ 9, e11954. doi: 10.7717/peerj.11954
Lefort V., Longueville J.-E., Gascuel O. (2017). SMS: Smart model selection in PhyML. Mol. Biol. Evol. 34, 2422–2424. doi: 10.1093/molbev/msx149
Lemoine F., Domelevo Entfellner J.-B., Wilkinson E., Correia D., Dávila Felipe M., De Oliveira T., et al. (2018). Renewing felsenstein’s phylogenetic bootstrap in the era of big data. Nature 556, 452–456. doi: 10.1038/s41586-018-0043-0
Levy E., Canel D., Rossin M. A., González-Castro M., Timi J. T. (2021). Parasite assemblages as indicators of an incipient speciation process of Odontesthes argentinensis in an estuarine environment. Estuar. Coast. Shelf Sci. 250, 107168. doi: 10.1016/j.ecss.2021.107168
Lindsay D. J. (2005). Planktonic communities below 2000m depth. Bull. Plankton Soc. Japan 52, 113–118. doi: 10.24763/bpsj.62.1_39
Lindsay D. J., Furushima Y., Miyake H., Kitamura M., Hunt J. C. (2004). “The scyphomedusan fauna of the Japan trench: preliminary results from a remotely-operated vehicle,” in Coelenterate biology (Netherlands: Springer), 2003537–547.
Lindsay D. J., Grossmann M. M., Bentlage B., Collins A. G., Minemizu R., Hopcroft R. R., et al. (2017). The perils of online biogeographic databases: a case study with the ‘monospecific’ genus Aegina (Cnidaria, hydrozoa, narcomedusae). Mar. Biol. Res. 13, 494–512. doi: 10.1080/17451000.2016.1268261
Lindsay D. J., Grossmann M. M., Nishikawa J., Bentlage B., Collins A. G. (2015). DNA Barcoding of pelagic cnidarians: current status and future prospects. Bull. Plankton Soc. Jpn. 62, 39–43. doi: 10.24763/bpsj.62.1_39
Lindsay D. J., Hunt J. C. (2005). Biodiversity in midwater cnidarians and ctenophores: submersible- based results from deep-water bays in the Japan Sea and north-western pacific. J. Mar. Biol. Ass. U.K. 85, 503–517. doi: 10.1017/S0025315405011434
Madin L. P., Harbison G. R. (2001). “Gelatinous zooplankton,” in Encyclopedia of ocean sciences (London, England: Elsevier), 1120–1130.
Matsumoto G. I., Bentlage B., Sherlock R., Walz K., Robison B. H. (2020). “Little red jellies” in Monterey bay, California (Cnidaria: Hydrozoa: Trachymedusae: Rhopalonematidae). Front. Mar. Sci. 6, 84–98. doi: 10.3389/fmars.2019.00798
McLaughlin F., Shimada K., Carmack E., Itoh M., Nishino S. (2005). The hydrography of the southern Canada basin 2002. Polar Biol. 28, 182–189. doi: 10.1007/s00300-004-0701-6
Medina M., Collins A. G., Silberman J. D., Sogin M. L. (2001). Evaluating hypotheses of basal animal phylogeny using complete sequences of large and small subunit rRNA. Proc. Natl. Acad. Sci. U. S. A. 98, 9707–9712. doi: 10.1073/pnas.171316998
Miglietta M. P., Schuchert P., Cunningham C. W. (2009). Reconciling genealogical and morphological species in a worldwide study of the family hydractiniidae (Cnidaria, hydrozoa). Zool. Scr. 38, 403–430. doi: 10.1111/j.1463-6409.2008.00376.x
Mills C. E. (1981). Diversity of swimming behaviors in hydromedusae as related to feeding and utilization of space. Mar. Biol. 64, 185–189. doi: 10.1007/BF00397107
Montenegro J., Fujimoto S., Ansai S., Nagano A. J., Sato M., Maeda Y., et al. (2022). Genetic basis for the evolution of pelvic-fin brooding, a new mode of reproduction, in a sulawesian fish. Mol. Ecol 34 (14), 3798–3811. doi: 10.1111/mec.16555
Moura C. J., Cunha M. R., Porteiro F. M., Rogers A. D. (2011). The use of the DNA barcode gene 16S mRNA for the clarification of taxonomic problems within the family sertulariidae (Cnidaria, hydrozoa). Zool. Scr. 40, 520–537. doi: 10.1111/j.1463-6409.2011.00489.x
Ortman B. D., Bucklin A., Pagès F., Youngbluth M. (2010). DNA Barcoding the medusozoa using mtCOI. Deep Sea Res. Part 2 Top. Stud. Oceanogr. 57, 2148–2156. doi: 10.1016/j.dsr2.2010.09.017
Pagès F., Pugh P. R., Gili J.-M. (1994). Macro- and megaplanktonic cnidarians collected in the eastern part of the weddell gyre during summer 1979. J. Mar. Biol. Assoc. U. K. 74, 873–894. doi: 10.1017/S0025315400090111
Raskoff K. (2002). Foraging, prey capture, and gut contents of the mesopelagic narcomedusa solmissus spp. (Cnidaria: Hydrozoa). Mar. Biol. 141, 1099–1107. doi: 10.1007/s00227-002-0912-8
Raskoff K. A. (2010). Bathykorus bouilloni: a new genus and species of deep-sea jellyfish from the Arctic ocean (Hydrozoa, narcomedusae, aeginidae). Zootaxa 2361, 57–67. doi: 10.11646/zootaxa.2361.1.5
Raskoff K. A., Hopcroft R. R., Kosobokova K. N., Purcell J. E., Youngbluth M. (2010). Jellies under ice: ROV observations from the Arctic 2005 hidden ocean expedition. Deep Sea Res. Part 2 Top. Stud. Oceanogr. 57, 111–126. doi: 10.1016/j.dsr2.2009.08.010
Robison B. H., Sherlock R. E., Reisenbichler K. R. (2010). The bathypelagic community of Monterey canyon. Deep Sea Res. Part 2 Top. Stud. Oceanogr. 57, 1551–1556. doi: 10.1016/j.dsr2.2010.02.021
Ronquist F., Teslenko M., van der Mark P., Ayres D. L., Darling A., Höhna S., et al. (2012). MrBayes 3.2: efficient Bayesian phylogenetic inference and model choice across a large model space. Syst. Biol. 61, 539–542. doi: 10.1093/sysbio/sys029
Stamatakis A. (2014). RAxML version 8: a tool for phylogenetic analysis and post-analysis of large phylogenies. Bioinformatics 30, 1312–1313. doi: 10.1093/bioinformatics/btu033
Sutton T. T., Clark M. R., Dunn D. C., Halpin P. N., Rogers A. D., Guinotte J., et al. (2017). A global biogeographic classification of the mesopelagic zone. Deep Sea Res. Part I, 126, 85–102. doi: 10.1016/j.dsr.2017.05.006
Thuesen E. V., Childress J. J. (1994). Oxygen consumption rates and metabolic enzyme activities of oceanic California medusae in relation to body size and habitat depth. Biol. Bull. 187, 84–98. doi: 10.2307/1542168
Toda R., Lindsay D. J., Fuentes V. L., Moteki M. (2014). Community structure of pelagic cnidarians off adélie land, East Antarctica, during austral summer 2008. Polar Biol. 37, 269–289. doi: 10.1007/s00300-013-1430-5
VanHöffen E. (1902) Die acraspeden medusen der deutschen tiefsee-expedition 1898-1899. mit tafel I-VIII Ed. Fischer J. G.. 1902. doi: 10.5962/bhl.title.1404
Vinogradov M. E., Shushkina E. A. (2002). Vertical distribution of gelatinous macroplankton in the north pacific observed by manned submersibles mir-1 and mir-2. J. Oceanogr. 58, 295–303. doi: 10.1023/A:1015813809541
Wang C., Huang J., Xiang P., Wang Y., Xu Z., Guo D., et al. (2014). Hydromedusae from the Arctic in 2010 during the 4th Chinese national Arctic research expedition (CHINARE 4). Acta Oceanol. Sin. 33, 95–102. doi: 10.1007/s13131-014-0494-6
Wang Y., Zhao Y., Bollas A., Wang Y., Au K. F. (2021). Nanopore sequencing technology, bioinformatics and applications. Nat. Biotechnol. 39, 1348–1365. doi: 10.1038/s41587-021-01108-x
Keywords: Arctic gelatinous zooplankton, cryptic species, phylogenetic, B. brucei, B. brucei ellinorae
Citation: Montenegro J, Collins AG, Hopcroft RR, Questel JM, Thuesen EV, Bachtel TS, Bergman LA, Sangekar MN, Drazen JC and Lindsay DJ (2023) Heterogeneity in diagnostic characters across ecoregions: A case study with Botrynema (Hydrozoa: Trachylina: Halicreatidae). Front. Mar. Sci. 9:1101699. doi: 10.3389/fmars.2022.1101699
Received: 18 November 2022; Accepted: 21 December 2022;
Published: 17 January 2023.
Edited by:
Alexandra Anh-Thu Weber, Swiss Federal Institute of Aquatic Science and Technology, SwitzerlandReviewed by:
María A. Mendoza, Centro de Investigación Biológica del Noroeste (CIBNOR), MexicoAmanda Cunha, Universidade Federal de Viçosa, Brazil
Copyright © 2023 Montenegro, Collins, Hopcroft, Questel, Thuesen, Bachtel, Bergman, Sangekar, Drazen and Lindsay. This is an open-access article distributed under the terms of the Creative Commons Attribution License (CC BY). The use, distribution or reproduction in other forums is permitted, provided the original author(s) and the copyright owner(s) are credited and that the original publication in this journal is cited, in accordance with accepted academic practice. No use, distribution or reproduction is permitted which does not comply with these terms.
*Correspondence: Javier Montenegro, Jmontzalez@gmail.com