 Laura Trejo
 Miguel Reyes
 Daniela Cortés-Toto
 Elvira Romano-Grande
 Lizbeth L. Muñoz-Camacho1
- 1Laboratorio de Biodiversidad y Cultivo de Tejidos Vegetales, Instituto de Biología, Universidad Nacional Autónoma de México, Tlaxcala, Mexico
- 2Departamento de Actuaría, Física y Matemáticas, Universidad de las Américas Puebla, Puebla, Mexico
Pulque is one of the oldest fermented beverages, with its origins dating back to pre-Hispanic Mexico. Recently, public consumption has increased. However, the majority of Agave plantations for pulque production have disappeared or been abandoned in recent decades. To create strategies for the conservation and production of pulque agaves, it is necessary to first determine their taxonomic identities and to better understand their genetic and morphological diversity. Despite the historical importance of pulque in Mexico, little attention has been placed on the study of Agave plants used for its production. Therefore, we analyzed the morphological diversity of vegetative characters of nine landraces of two Agave species (A. salmiana and A. mapisaga) which are widely cultivated for pulque production in Tlaxcala, Mexico. The analysis of morphological characters showed that the landraces largely clustered based on classic taxonomic relationships. One cluster of landraces associated with Agave mapisaga var. mapisaga and another with A. salmiana subsp. salmiana, but with the exception of A. salmiana subsp. salmiana “Ayoteco”, which is more closely related with A. mapisaga var. mapisaga. Additionally, we analyzed the genetic relationships between 14 landraces and wild individuals using molecular markers (trnL and ITS). The identified genetic variants or haplotypes and genetic pools mainly corresponded with the species. In the case of “Ayoteco”, incongruence between markers was observed. Low selection intensity, genetic flow events, and the plasticity of morphological traits may explain the high number of landraces without clear differences in their morphological diversity (vegetative characters) or genetic pools. The use of reproductive traits and massive sequencing might be useful for identifying possible morphological and genetic changes in the Agave landraces used for pulque production.
Introduction
The Agave L. genus has great economic, cultural, and ecological importance in Mexico and beyond. For over 10,000 years, agaves have provided many products, such as food, fiber, construction materials, and beverages (Gentry, 1982; Colunga-GarcíaMarín et al., 2007). From an ecological perspective, agaves are the keystone species in their native environments, providing food, refuge, and water to various organisms as well as preventing soil erosion (Gentry, 1982). The genus Agave, commonly known as maguey, is comprised of 206 species endemic to the Americas (Gentry, 1982; García-Mendoza, 2011). It has a recent origin (7.8–10.1 mya; Good-Avila et al., 2006), with Mexico being the primary center of diversity of the genus. Nearly 75% (159) of Agave species are found in Mexico (Gentry, 1982; García-Mendoza, 2011). It has been suggested that Agave species rapidly diversified with the coinciding of increased aridization of portions of North America (Good-Avila et al., 2006) with the increased diversity of pollinator species, which favored hybridization of Agave species (Good-Avila et al., 2006; Flores-Abreu et al., 2019).
One of the most important products obtained from Agave plants is pulque, a fermented beverage of pre-Hispanic origin. However, little to no research has been carried out on the Agave species used for pulque production, making it difficult to develop adequate conservation, management, and production strategies. Pulque agaves (magueyes pulqueros) are enormous plants that can measure more than 5 m in diameter and 10 m in height, including their inflorescence. These plants are mainly adapted to the elevation and climatic conditions of central Mexico. The main species utilized in pulque production are Agave americana L., Agave inaequidens Koch, Agave mapisaga Trel., Agave salmiana Otto ex Salm-Dyck subsp. salmiana, and Agave salmiana Otto ex Salm-Dyck subsp. tehuacanensis (Karw. Ex Salm-Dyck) García-Mend. (García-Mendoza, 2011). One study found more than 60 common names for pulque agaves (Mora-López et al., 2011), complicating the study of their diversity.
Pulque is produced by the alcoholic fermentation of Agave sap, which is called aguamiel. Its consumption, along with its benefits, has been recorded in at least eight codices since pre-Hispanic times (Gonςalves de Lima, 1956). According to the Aubin Codex, the Aztecs discovered pulque in the year 7 Acatl (1187 A.D.) during their long pilgrimage from Aztlán in search of Tenochtitlan (which is now Mexico City; Gonςalves de Lima, 1956). During the pre-Hispanic period, pulque played a major role in the cultural development of the region, especially for populations living in the Mexican highlands. For example, pulque was offered as tribute to the Aztecs by those they conquered (Guerrero-Guerrero, 1985). However, on a regular basis, this beverage was supposedly only consumed by the elderly, the sick, lactating women, and high-level dignitaries. Being inebriated by pulque was considered improper and a cause for punishment (Gonςalves de Lima, 1956). Alternatively, the Florentine Codex states that pulque was sold in the so-called tianguis, or open-air markets, and was consumed by those who participated in religious ceremonies as well as manual laborers (Sahagún, 1979).
Such was the economic importance of pulque that its production was allowed to continue in New Spain despite the prohibition of many other native beverages, such as, for example, mezcal. At the time of independence, 30,000 barrels of pulque were being produced every year (Guerrero-Guerrero, 1985). By the beginning of the Mexican Revolution in 1910, however, agrarian reform led to a 45% reduction in production which was also a result of land redistribution, Agave overexploitation, competition from other alcoholic beverages (mainly beer), and an intense smear campaign (Guerrero-Guerrero, 1985; Ramírez-Rancaño, 2000). From that point, pulque was considered a filthy, unsanitary, and low-class beverage dangerous for human health (Ramírez-Rancaño, 2000). Given the decrease in consumption, Agave plants have gradually disappeared from the Mexican landscape, with the majority of production fields being abandoned or substituted by other crops (Ramírez-Rancaño, 2000; Alvarez-Duarte et al., 2018).
Despite these historical challenges, pulque has had a rebound in recent years due to the efforts of the Mexican government to promote it through fairs, its consumption among young people and also due to the existence of economic resources to promote the cultivation of agaves used to produce it (Ramírez, 2014). Various studies have shown that pulque is, in fact, safe for consumption and nutritious, with high levels of carbohydrates, mineral salts, vitamins, and amino acids (Escalante et al., 2008; Lappe-Oliveras et al., 2008; Ortiz-Basurto et al., 2008). It also contains prebiotic and probiotic microorganisms that help improve intestinal microbiota (Moreno-Vilet et al., 2014). Many other products are obtained from pulque agaves including: inulin-type fructans; xylitol sweetener (Alvarado et al., 2014); agave syrup; distilled liquors, such as mezcal; leaves for cooking barbacoa (Gentry, 1982; Colunga-GarcíaMarín et al., 2007); mixiotes, or leaf cuticles for wrapping and cooking meat; the edible white worm (Aegiale hesperians Walker) and red worm (Hipota agavis Blásquez); and maguey mushrooms (Pleurotus opuntiae Durieu et Levy; Gentry, 1982; Alvarez-Duarte et al., 2018).
Given the context provided above, the present study seeks to contribute to the understanding of the morphological and genetic diversity of traditional pulque Agave species and landraces in Tlaxcala, the second-most important state in Mexico in terms of pulque production (Álvarez-Duarte et al., 2018; Ramírez-Manzano, 2020), through an analysis of morphological characters and chloroplast and nuclear DNA markers. The resulting data are fundamental for the conservation of the landrace diversity of pulque Agave species and for improving their production in central Mexico.
Materials and Methods
Study Area
The state of Tlaxcala is located in the central eastern region of Mexico between 19° 06’ 18’’ and 19° 43’ 44’’ N and 97° 37’ 31’’ and 98° 42’ 30’’ W, with an elevation range of 2200 to 4,400 m above sea level. It comprises 0.2% of the area of Mexico (399,113.7 ha) and has a population of 1,272,847. Its climate can be characterized as semi-arid and cool temperate, with an annual precipitation of 720 mm (INEGI, 2016). The main soil type is cambisol. Agriculture is one of the main economic activities and corresponds with 74% of the state’s area; the main crops are corn (Zea mays subsp. mays L.), beans (Phaseolus vulgaris L.), barley (Hordeum vulgare L.), and potato (Solanum tuberosum L.). Nearly 41% of the land area is comprised of grasslands, and another 9% of forests, wherein the main arboreal species are Pinus teocote Schiede ex Schltdl., Juniperus depeana Steud., Abies religiosa (Kunth) Schltdl & Cham., and Quercus laurina Humb & Bonpl (INEGI, 2016).
Study System
Fourteen Agave landraces used for pulque production in Tlaxcala and three wild individuals (plants from wild populations that are not used for pulque production) were analyzed (Table 1 and Table S1). Landraces are plants that are only grown in certain ecogeographic areas that have adapted to the environmental conditions of these areas as well as traditional management practices and uses (Casañas et al., 2017). Both landraces and wild individuals were identified at the species and subspecies level (Table 1 and Table S1) following García-Mendoza’s (2011) and Gentry’s (1982) taxonomic keys. However, there are no taxonomic keys specifically for identifying landraces, which are generally identified by their common names (names assigned by people). These landraces are described in the present study according to our field work observations in nine municipalities, 10 localities, and 14 producers (see Supplementary Data 1, Figure 1).
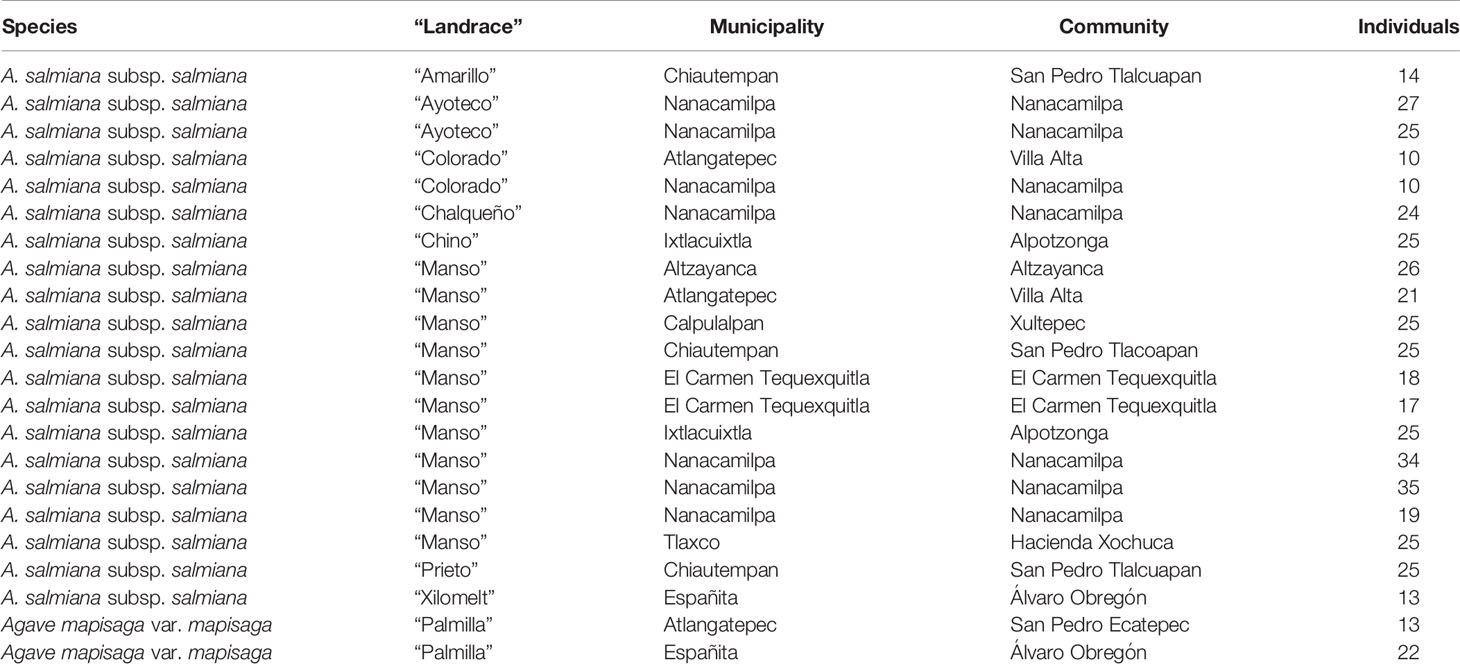
Table 1 Morphological diversity of nine Agave landraces analyzed, species, places of origin and number of individuals by population.
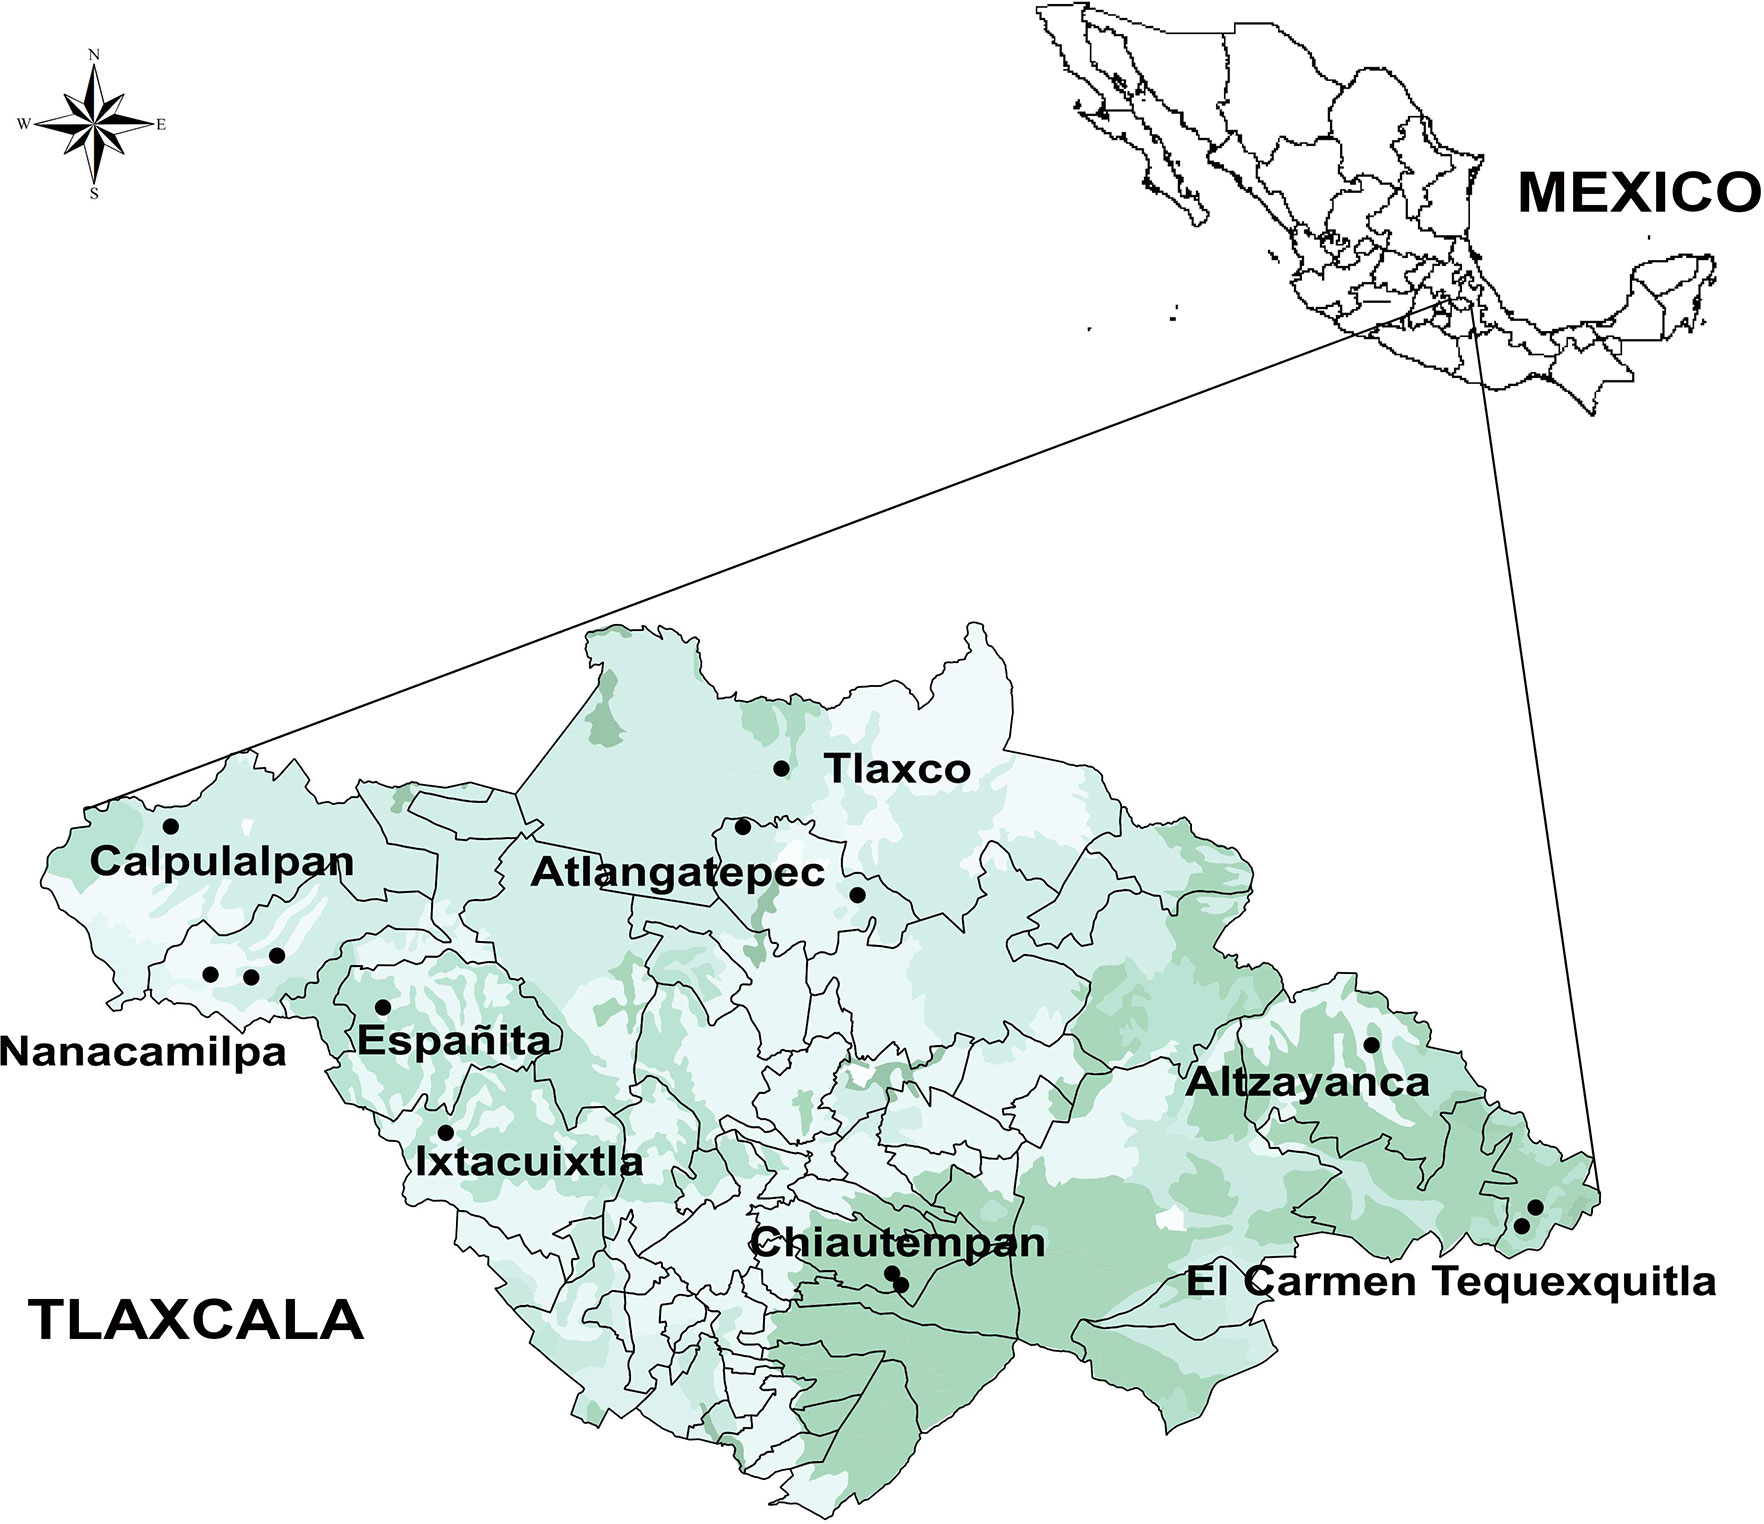
Figure 1 Map of localities (circles) where measurements on plants cultivated in ranches, plots, and milpas (mixed crop plots) were carried out. This map presents a land use and vegetation layer (Qgis 2.6.1-Brighton).
Morphological Diversity
Nine Agave landraces were analyzed (Figure 2): Agave salmiana subsp. salmiana “Amarillo”, “Ayoteco”, “Colorado”, “Chalqueño”, “Chino”, “Manso”, “Prieto”, and “Xilomelt” and Agave mapisaga var. mapisaga “Palmilla”. Twenty-two populations of 13–35 individuals were included in the study (N = 478 individuals; Table 1; https://zenodo.org/record/3976297#.Xy35gChKjIU). The number of landraces and analyzed individuals depended on the availability of the number of mature Agave plants close to initiating inflorescence emergence.
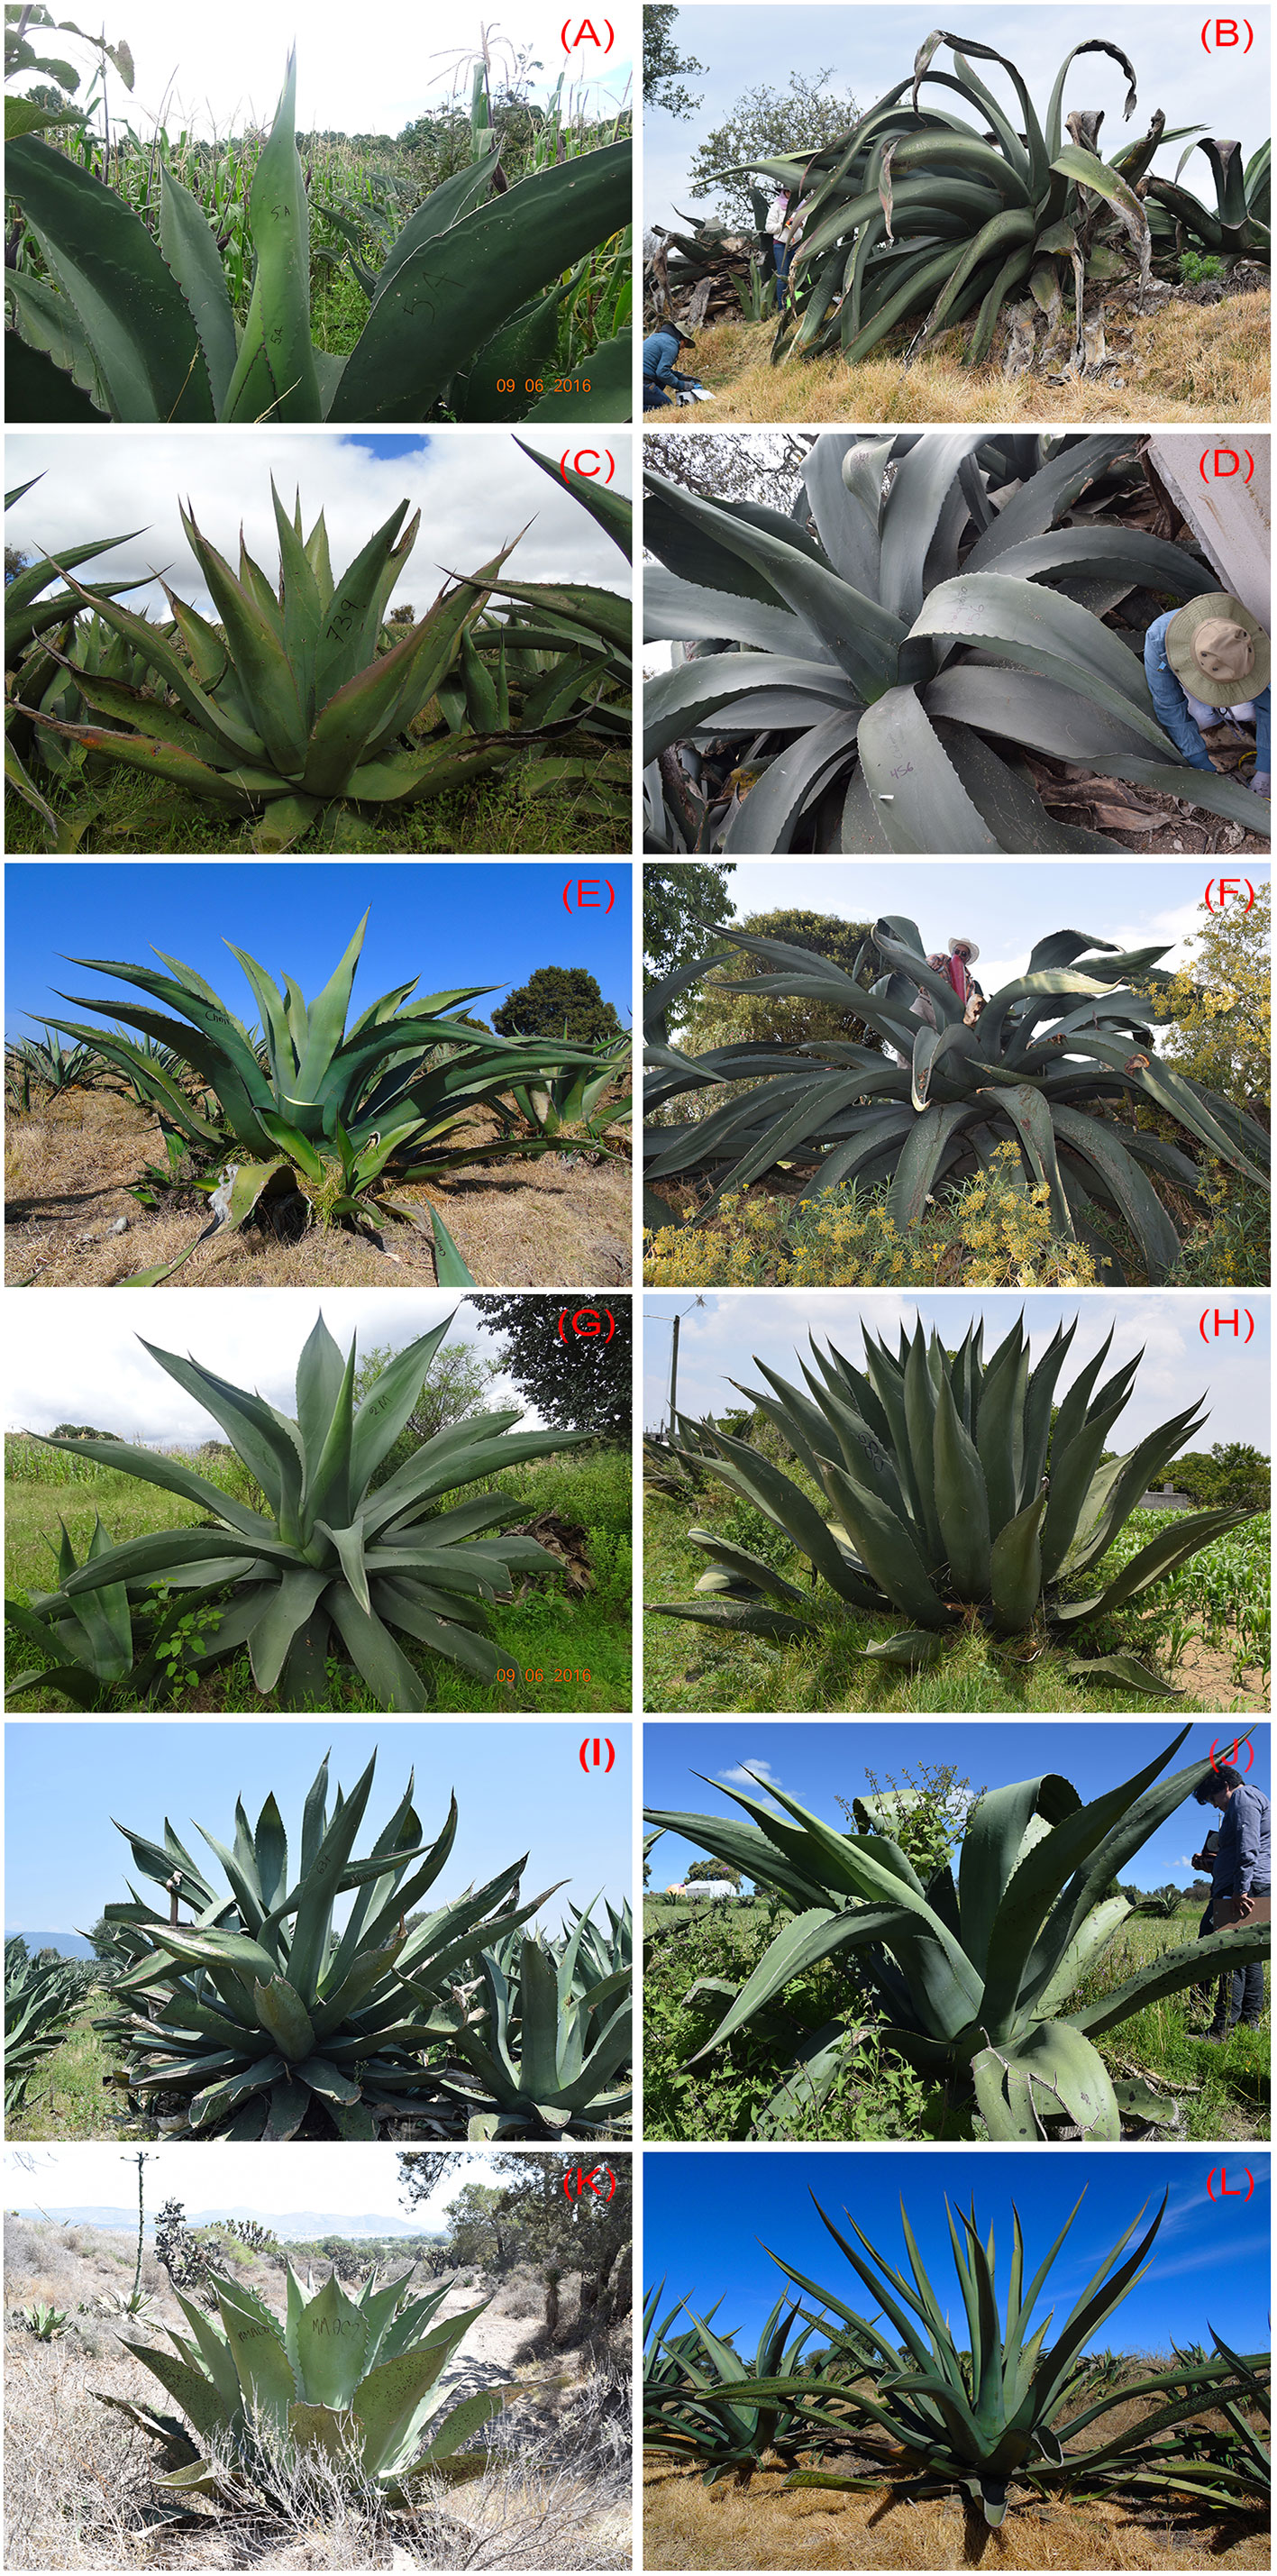
Figure 2 Agaves used in the production of pulque. (A–J) Agave salmiana subsp. salmiana: (A) “Amarillo,” (B) “Ayoteco,” (C) “Colorado,” (D) “Chalqueño,” (E) “Chino,” (F) “Manso,” (G) “Matecón,” (H) “Prieto,” (I) “Púa Larga,” (J) “Xilomelt.” (K) Agave salmiana subs tehuacanensis Tepezorra and (L) Agave mapisaga var. mapisaga “Palmilla.”
Twenty morphological variables were measured (Figure 3) in each individual plant. Of these variables, spine shape and tooth shape were binary (0, 1), and total number of leaves, number of rigid leaves, and number of flaccid leaves were counts. The remaining variables were intervals except for the percentage of rigid leaves, which was treated as an ordinal variable with five levels since most leaves were rigid (i.e., 77% of observations had entirely rigid leaves and 82% of the observations had at least 95% rigid leaves). It was calculated from three variables (total number of leaves, number of rigid leaves, number of flaccid leaves). The levels were as follows: 1) less than 60% rigid leaves, 2) 60 to 70% rigid leaves, 3) 70 to 80% rigid leaves, 4) 80 to 90% rigid leaves, and 5) more than 90% rigid leaves.
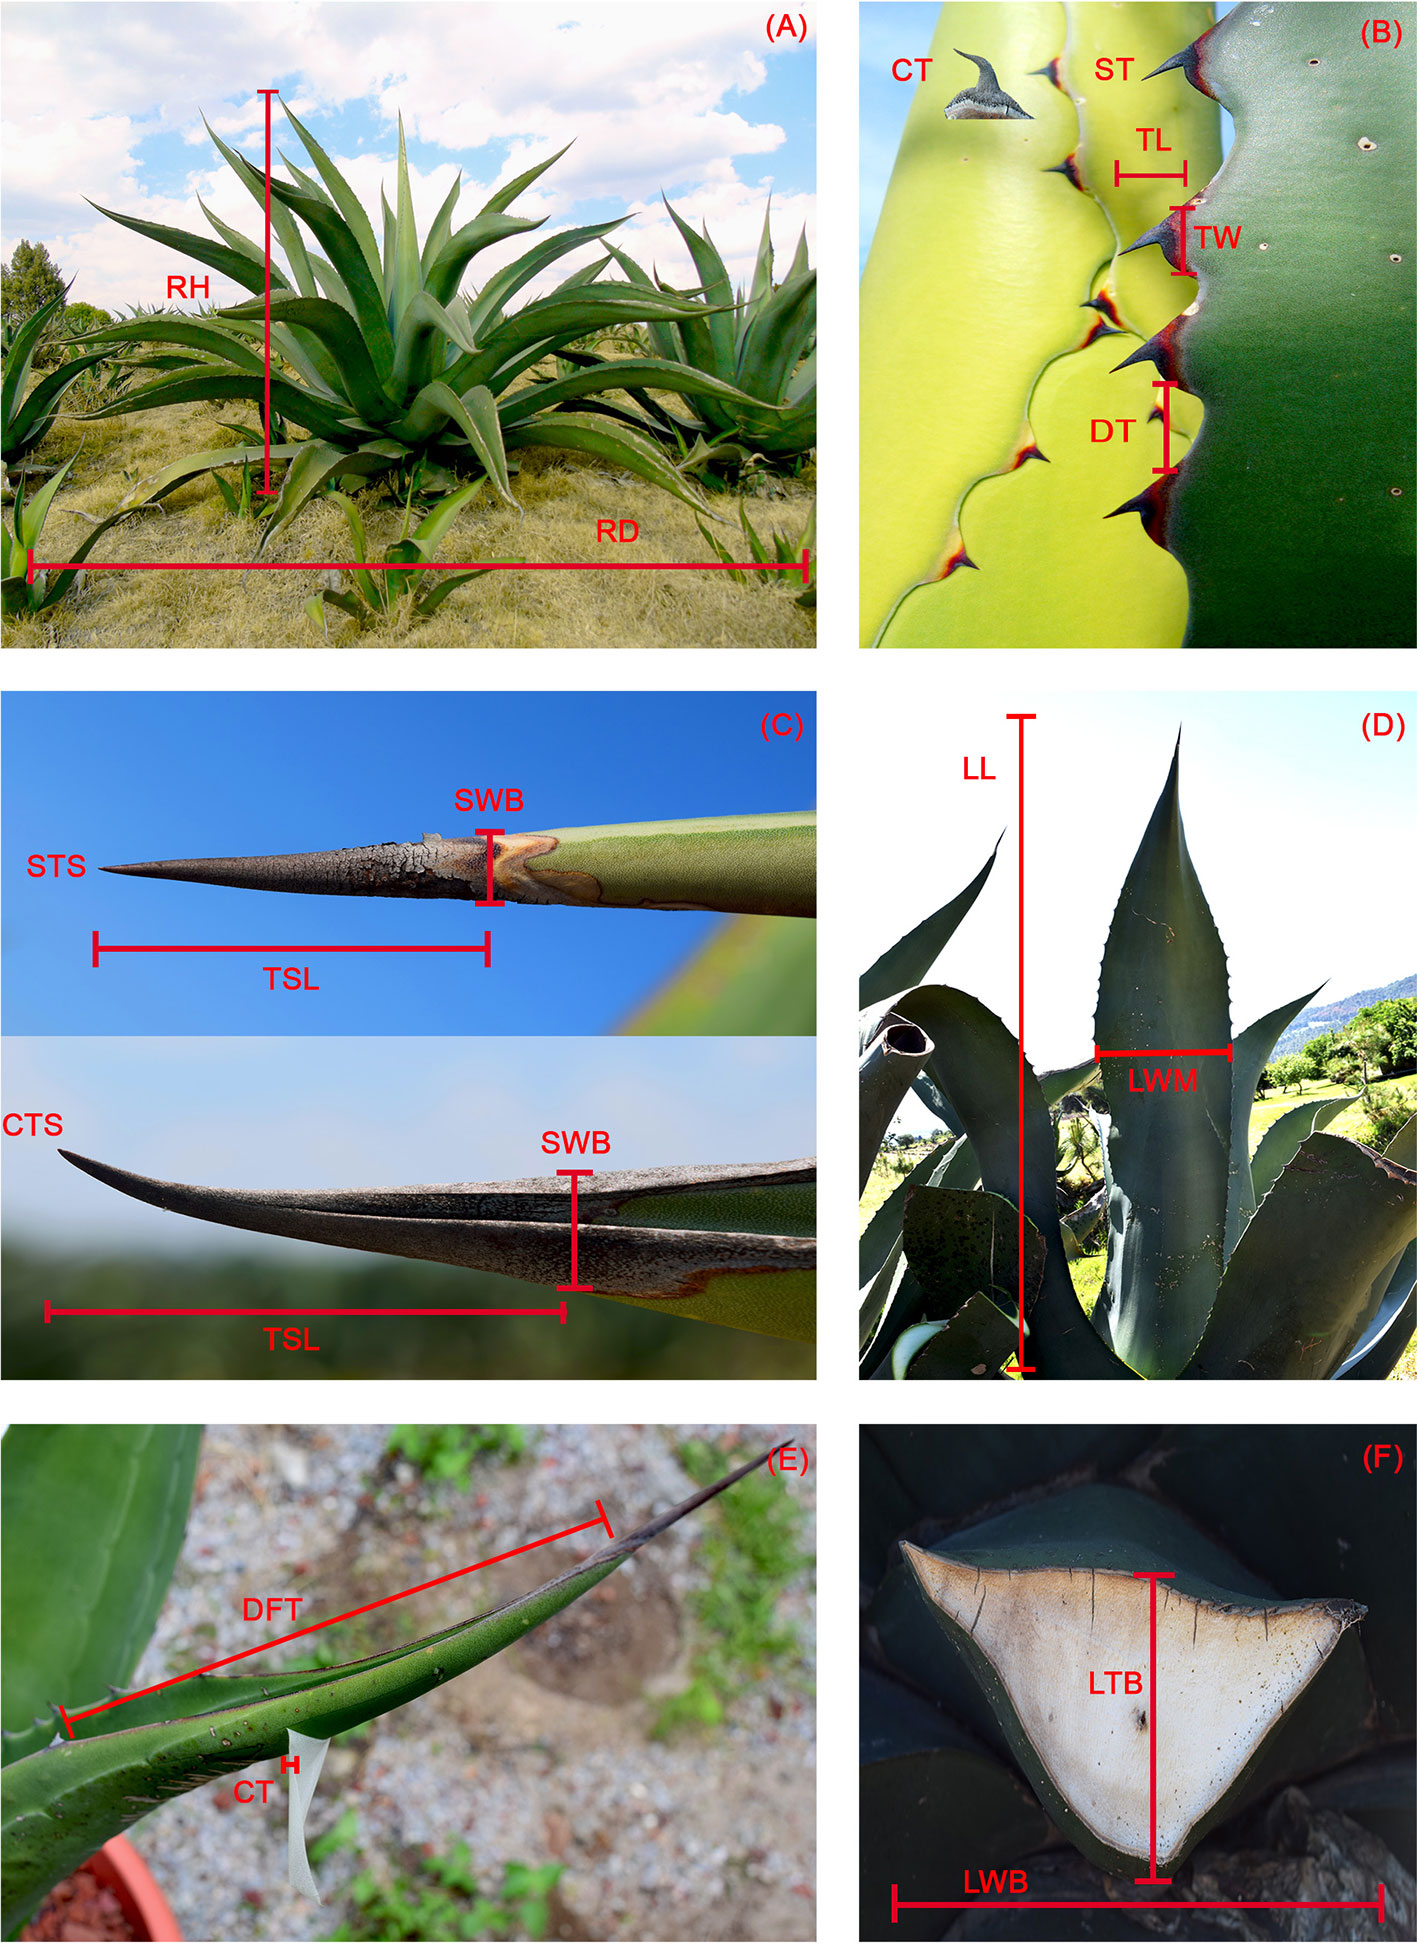
Figure 3 Morphological characters. (A) RH, rosette height; RD, rosette diameter. (B) CT, curved teeth; ST, straight teeth; TL, tooth length; TW, tooth width; DT, distance between teeth. (C) STS, straight terminal spine; CTS, curved terminal spine; SWB, terminal spine, width at base; TSL, terminal spine length. (D) LL, leaf length; LWM, leaf, width at mid length. (E) DFT, distance to first tooth; CT, cuticle thickness. (F) LTB, leaf thickness at base; LWB, Leaf width at base.
Pearson linear correlations were calculated between interval variables to detect redundant information and, in this way, describe the morphology of the plants with a smaller number of variables. The correlations are shown on the heat map in Figure 4. Variables with correlations above R = 0.11 appear collapsed in the same group, all of them providing redundant information. Based on correlations and a PCA (Gabriel, 1971; Gabriel, 1980), we selected three variables (average distance of the first tooth, leaf length, and leaf thickness at the base) from the first group in addition to three variables (average length of teeth, cuticle width, and spine length) from the second group (see Figure 4 and Figure S1). We also included two binary variables (spine shape and tooth shape) and the ordinal variable (percentage of rigid leaves). Consequently, we were able to describe the morphology of the plants with just nine variables (i.e., the morphology of each individual plant is represented by a 9-dimensional vector) (Nguyen and Holmes, 2019).
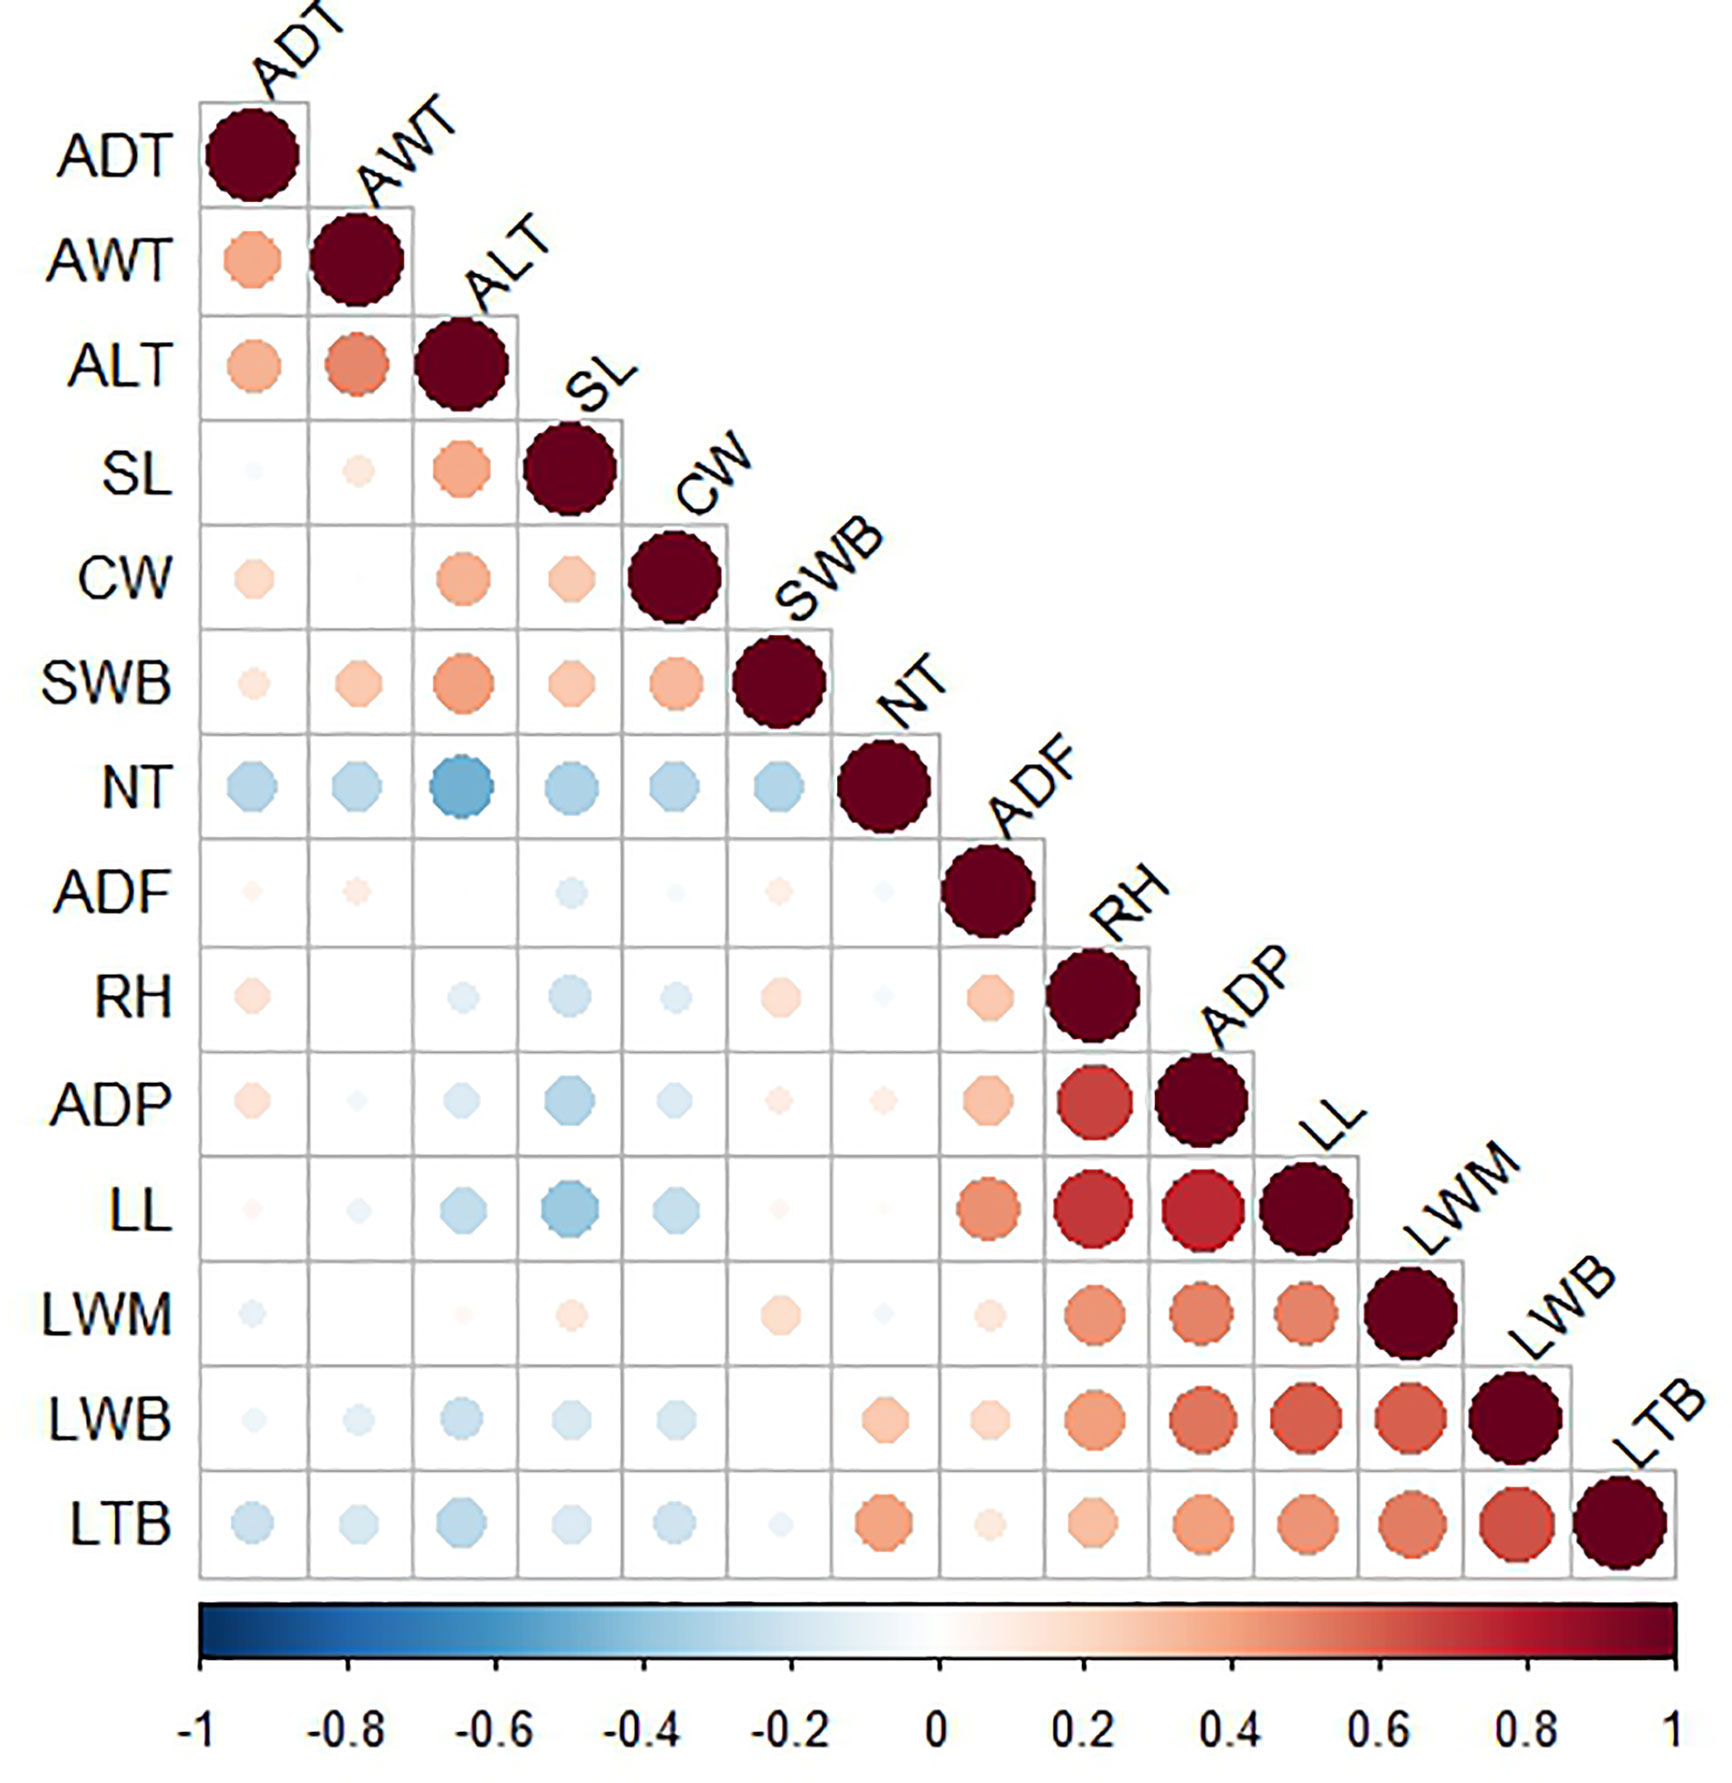
Figure 4 Heat map of linear correlations between interval variables. Intense red corresponds with a highly positive correlation and intense blue with a highly negative correlation. Size of the circles indicate the magnitude of the correlation coefficient: larger circles indicate greater correlation, being the maximum size (in the diagonal) equivalent to a coefficient of 1. RH, Rosette height (cm); ADP, Average diameter of plant (cm); TNL, Total number of leaves; NRL,Number of rigid leaves; NFL, Number of flaccid leaves; CW, Cuticle width (mm), LL, Leaf length (cm); LWB, Leaf width at base (cm); LWN, Leaf width at middle (cm); LTB, Leaf thickness at base (cm); SL, Spine length (mm); SWB, Spine width at base (mm); SS, Spine shape; ADF, Average distance of the first tooth (cm); NT, Number of teeth; ADT, Average distance between teeth (mm); AWT, Average width of teeth (mm); ALT, Average length of teeth (mm); TS, Tooth shape; PRL, Percentage of rigid leaves.
In order to generate clusters of plants based on morphological data, we used a hierarchical agglomerative clustering algorithm (Rokach and Maimon, 2005) along with the Gower’s metric (Gower, 1971), which is suitable for calculating distances between mixed data (i.e., individuals described using different types of variables, such as binary, ordinal, and interval; Kaufman and Rousseeuw, 2005). We calculated these distances between our mixed data using the daisy function in the cluster package (Maechler et al., 2018) of R software (R Core Team, 2019). Once the dissimilarity matrix was obtained, we used the hierarchical clustering algorithm in the agnes function of the aforementioned package. For the linkage criterion, we used the Ward’s method (Ward, 1963).
The visualization of the clustering structure is useful for deciding the number of clusters. For this, we used a dendrogram, which is a graphical tool that shows the distance at which observations merged. We also used the agglomerative coefficient, which describes the strength of the obtained clustering structure, ranging from zero to one. Values close to one suggest a strong clustering structure, and values close to zero a weak structure (Kaufman and Rousseeuw, 2005). Both the dendrogram and agglomerative coefficient can be obtained via the plot fuction applied to a proper agnes object.
For a visual impression of the detected clusters, we used an Andrews plot. High-dimensional data can be represented defining a finite Fourier series, so that each multivariate vector is represented by a curve in a two-dimensional space. Due to the periodicity of Fourier series, the x-axis is the interval from −π to π (roughly from −3.14 to 3.14), while the y-axis is the value of the specific finite Fourier series (defined in each situation) when evaluated over the interval from –π to π (Andrews, 1972). If there is structure in the data, it should be visible in the Andrews curves.
The curve algorithm was implemented using the Andrews function in the Andrews package in R software (Myslivec, 2012).
Genetic Relationships
Twenty individuals of A. salmiana subsp. salmiana, A. salmiana subsp. tehuacanensis, and A. mapisaga var. mapisaga were included in the relationship analysis. Seventeen belonged to the landraces, and three were wild types (A. salmiana subsp. salmiana Manso Listado, A. salmiana subsp. salmiana Prieto Silvestre, and A. salmiana subsp. tehuacanensis Tepezorra; Table S1). Tissue from the tip of a leaf was collected from each individual and kept in silica gel. DNA was extracted from each sample using liquid nitrogen and the DNeasy Plant Mini Kit extraction kit (Qiagen, Hilden, Germany). The quantity and quality of the obtained DNA were measured using a Colibri microvolume spectrometer (Titertek-Berthold, Pforzheim, Germany).
Ten primers previously used to screen for interspecific variation in Agave were tested (Good-Avila et al., 2006; Scheinvar et al., 2017; Flores-Abreu et al., 2019). Only two of them presented variation (Table S2): the trnL(UAA) intron (c–d) of cpDNA (Taberlet et al., 1991) and the internal transcribed spacers (ITS) 1–4 (Bayer et al., 1996). The trnL(UAA) primer was amplified by polymerase chain reaction (PCR) under the following protocol: 95°C/7 min and 35 cycles of 95°C/1 min, 52.4°C/60 s, and 72°C/90 s followed by one cycle of 72°C/7 min and one cycle of 4°C/10 min. The nuclear ribosomal DNA ITS 1–4 were sequenced under the following protocol: 94°C/2 min followed by 30 cycles of 94°C/1 min, 57°C/90 s, 72°C/2 min; an elongation period of 72°C/10 min; and one cycle of 4°C/10 min. The PCR was performed for both pairs of primers, each reaction had a final volume of 25 µL and contained: 2 µL of DNA (10–100 ng), 1 µL of 10 µM for each pair of primer, and 21 µL (1X) of GoTaq Hot Start Colorless Master Mix (Promega, Madison, USA). The PCR products were run in an electrophoresis chamber in agarose gel and purified with QIAquick PCR purification kits (Qiagen). The sequences were obtained in the Biodiversity and Health Genomic Sequencing Laboratory of the Institute of Biology, Universidad Nacional Autónoma de México (UNAM). To prepare the samples, we used 0.4 µL of big dye terminator v. 3.1, 2 µL of 5x buffer, 4 µL of water, 1 µL of primer (10 µM), and 3 µL of the purified amplificate. The samples were placed in the PCR, and the following program was used: 30 cycles at 96°C/10 s, 50°C/5 s, and 60°C/4 min. Once the cycle series ended, the samples were purified with Centri-Sep (Thermo Fisher Scientific) following the manufacturer’s specifications. To the purified samples, 25 µL of EDTA (0.5 mM) were added, and the samples on the plate were run in an Applied Biosystems 3730xL sequencer (ThermoFisher Scientific). The generated sequences were uploaded to GenBank (see Table S1).
Sequences were cleaned and aligned by eye with the support of BioEdit 7.2.6.1. Haplotype networks per marker and per combined matrix were obtained, and a parsimony analysis was performed using the TCS 1.21 program (Clement et al., 2000). The gaps were considered as missing data, and the network was constructed at a 95% confidence level.
For each marker and combined matrix, a Bayesian clustering method was applied with the support of the STRUCTURE v. 2.3.4 program. For these analyses, an independent allelic frequencies linkage model was used (Pritchard et al., 2000; Falush et al., 2003). A total of 350,000 Markov Chain Monte Carlo (MCMC) repetitions were performed, with 150,000 burn-in periods for each run. Ten runs were designed to estimate from 1 to the 5 populations. The optimum number (K) of genetic clusters was obtained by calculating the ΔK statistic using an Evanno test in the STRUCTURE HARVESTER program (Evanno et al., 2005; Earl and vonHoldt, 2012). A bar plot was made to represent the individual assignment probability obtained for K in the R software.
Results and Discussion
Morphological Diversity
In the different analyses carried out under the unsupervised learning method, we mainly observed two clusters related with each species. All of the landraces of A. salmiana subsp. salmiana, with the exception of “Ayoteco”, were mainly observed in one of the clusters, and the other cluster was mainly composed of A. mapisaga var. mapisaga and A. salmiana subsp. salmiana “Ayoteco”. This confirms that the analysis of only the vegetative characters can distinguish the Agave species but not landraces of commonly used for pulque production. However, the landrace “Ayoteco” recognized in classical taxonomy as A. salmiana subsp. salmiana is closer to A. mapisaga var. mapisaga based on morphometric evidence, as provided below.
The dendrogram (Figure 5) is overall divided into two large morphological zones: a first zone indicated by cluster 1 and a second zone indicated by merger of cluster 2 and cluster 3. However, a further split of the merged cluster 2 and 3 is reasonable as well. Clusters 2 and 3 consisted of landraces of A. salmiana subsp. salmiana, with the exception of “Ayoteco”, and cluster 1 contains mainly A. mapisaga var. mapisaga and A. salmiana subsp. salmiana “Ayoteco”. Table 2 shows how the individuals of the landraces are distributed in the three clusters as well as the total observations in each. To formalize the distribution of the individual plants according to landrace and cluster, we performed a cluster analysis using the same agglomerative method and the Ward’s method with the row-wise vectors in Table 2B (Figure 6).
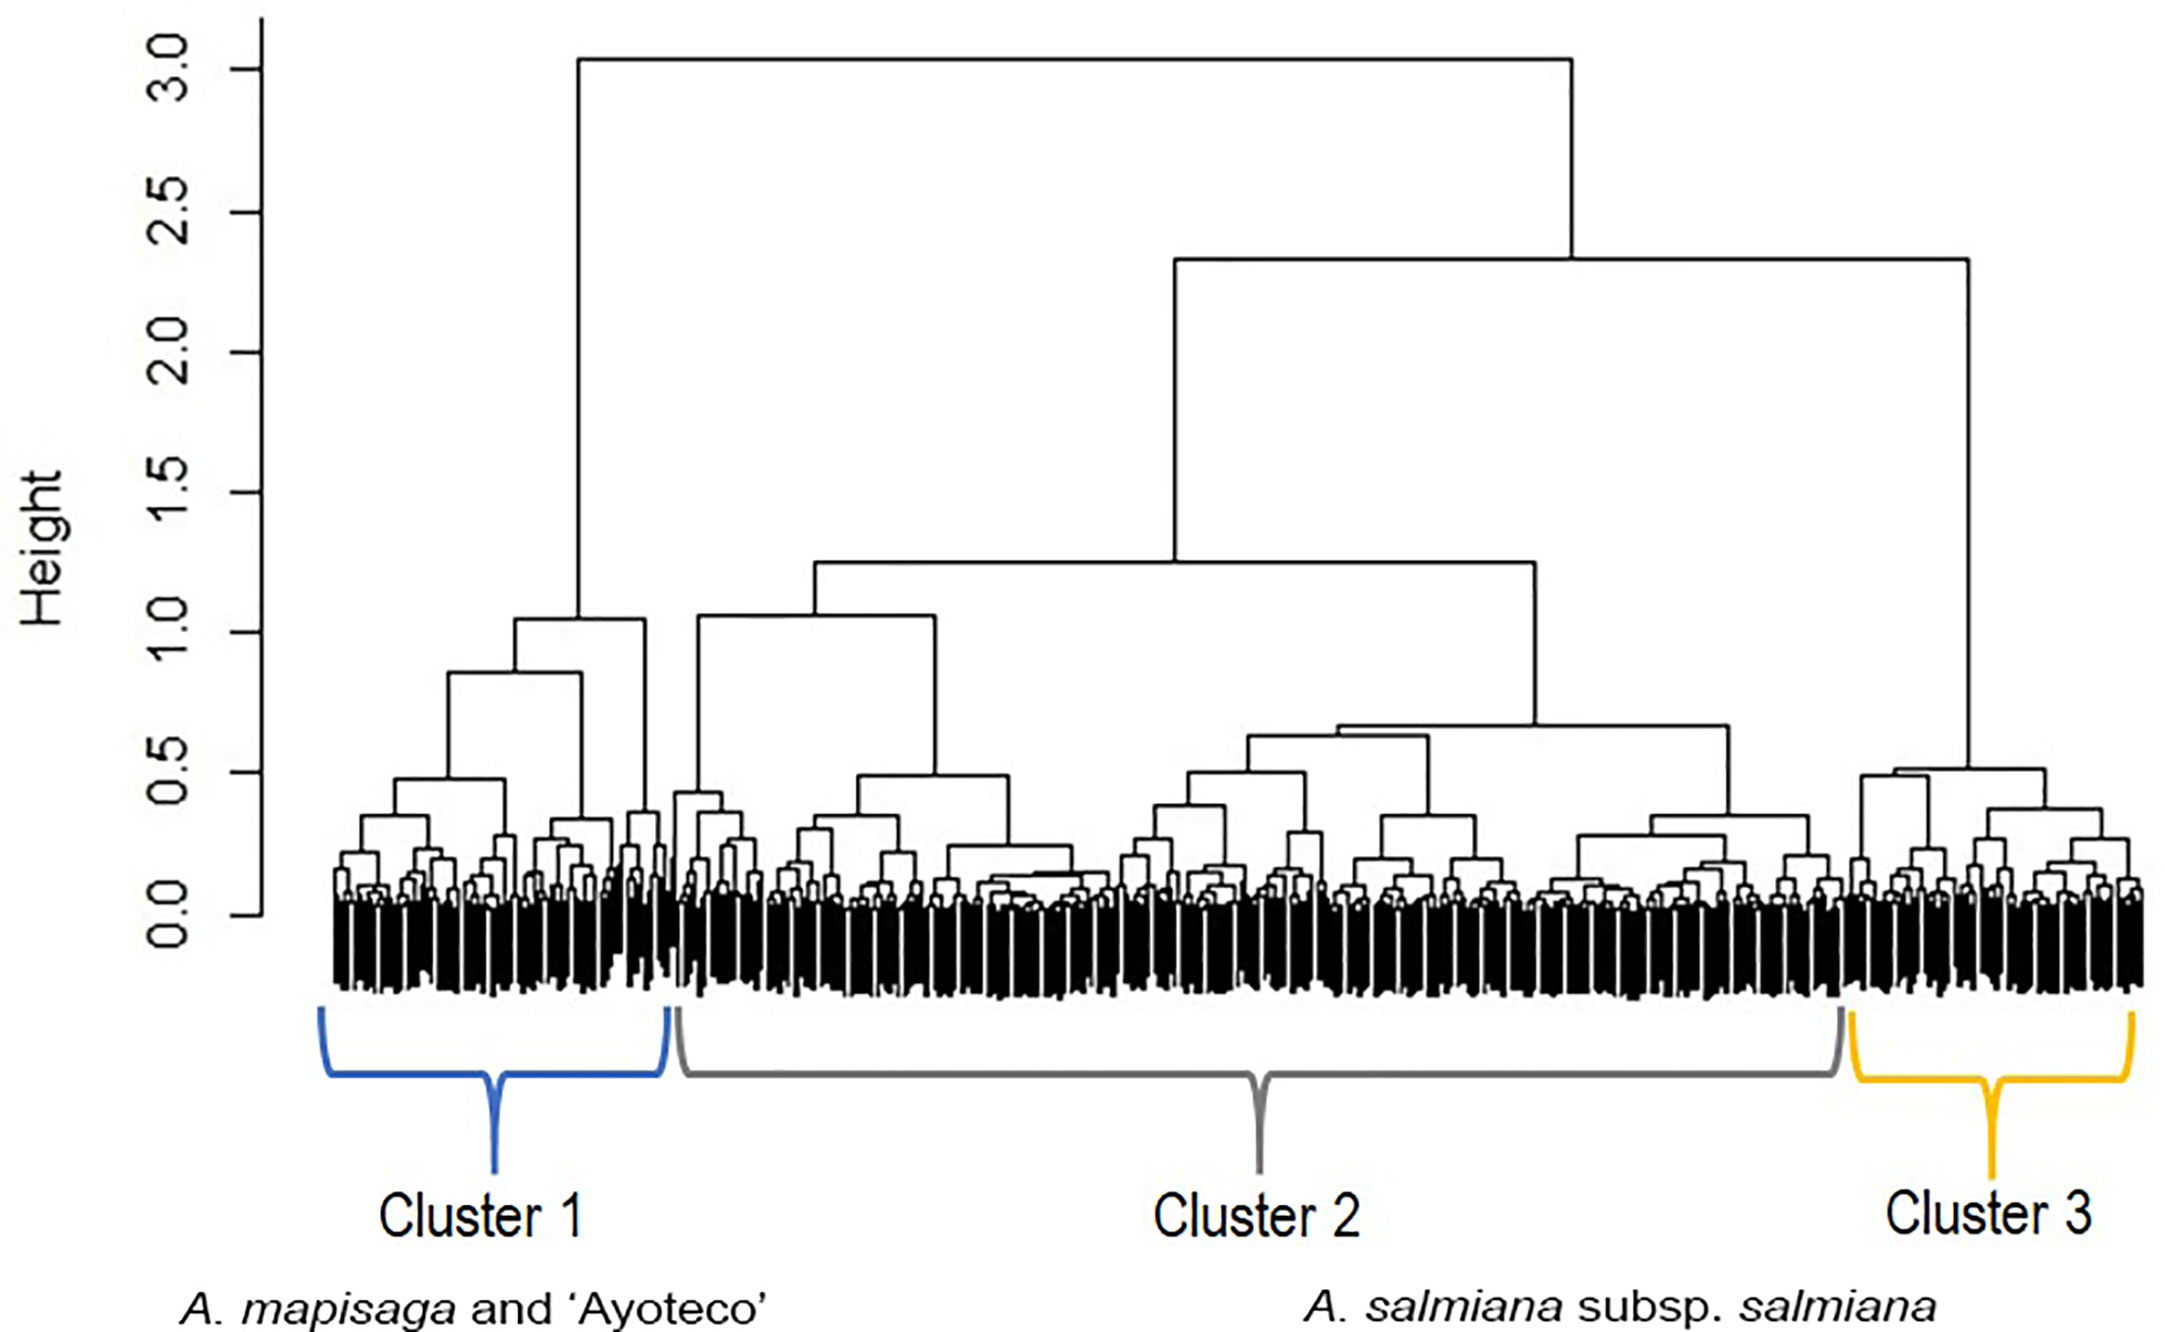
Figure 5 Dendrogram showing the fusions of individual observations when clustering according to the “agnes” function of the R cluster library using Gower’s dissimilarities and Ward’s method. Agglomerative coefficient: 0.9855. The black area on the bottom represents the unclustered data, while the black vertical lines that protrude into the white area show the heights (dimensionless distance) at which the clusters were formed.
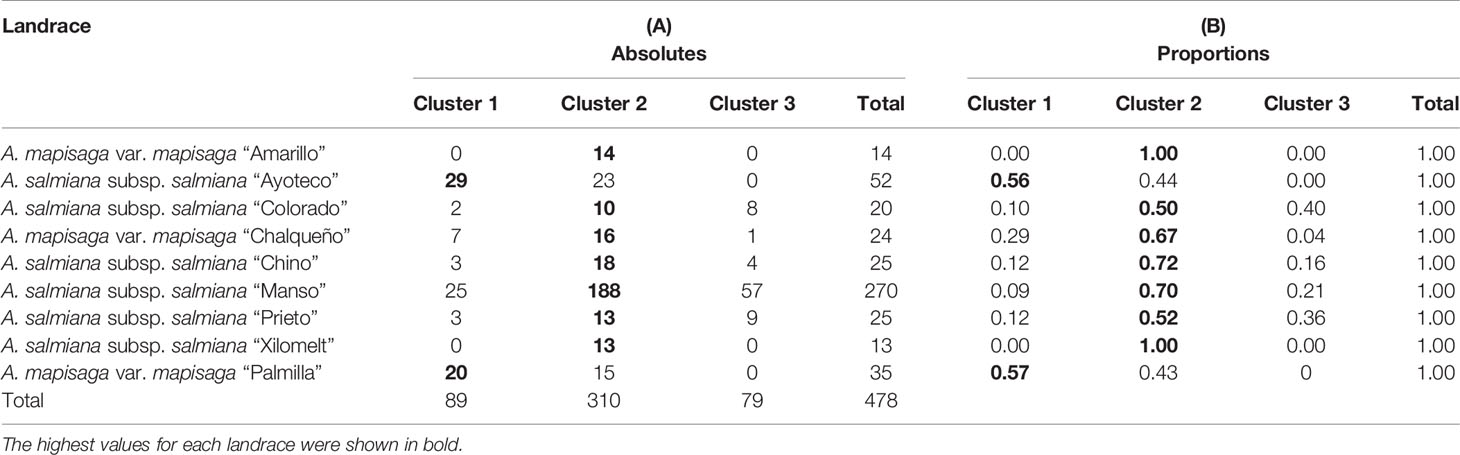
Table 2 (A) Distribution of the different individual plants according to landrace and cluster, in absolute numbers. (B) Proportions of individual plants distributed (row wise) according to landrace and cluster.
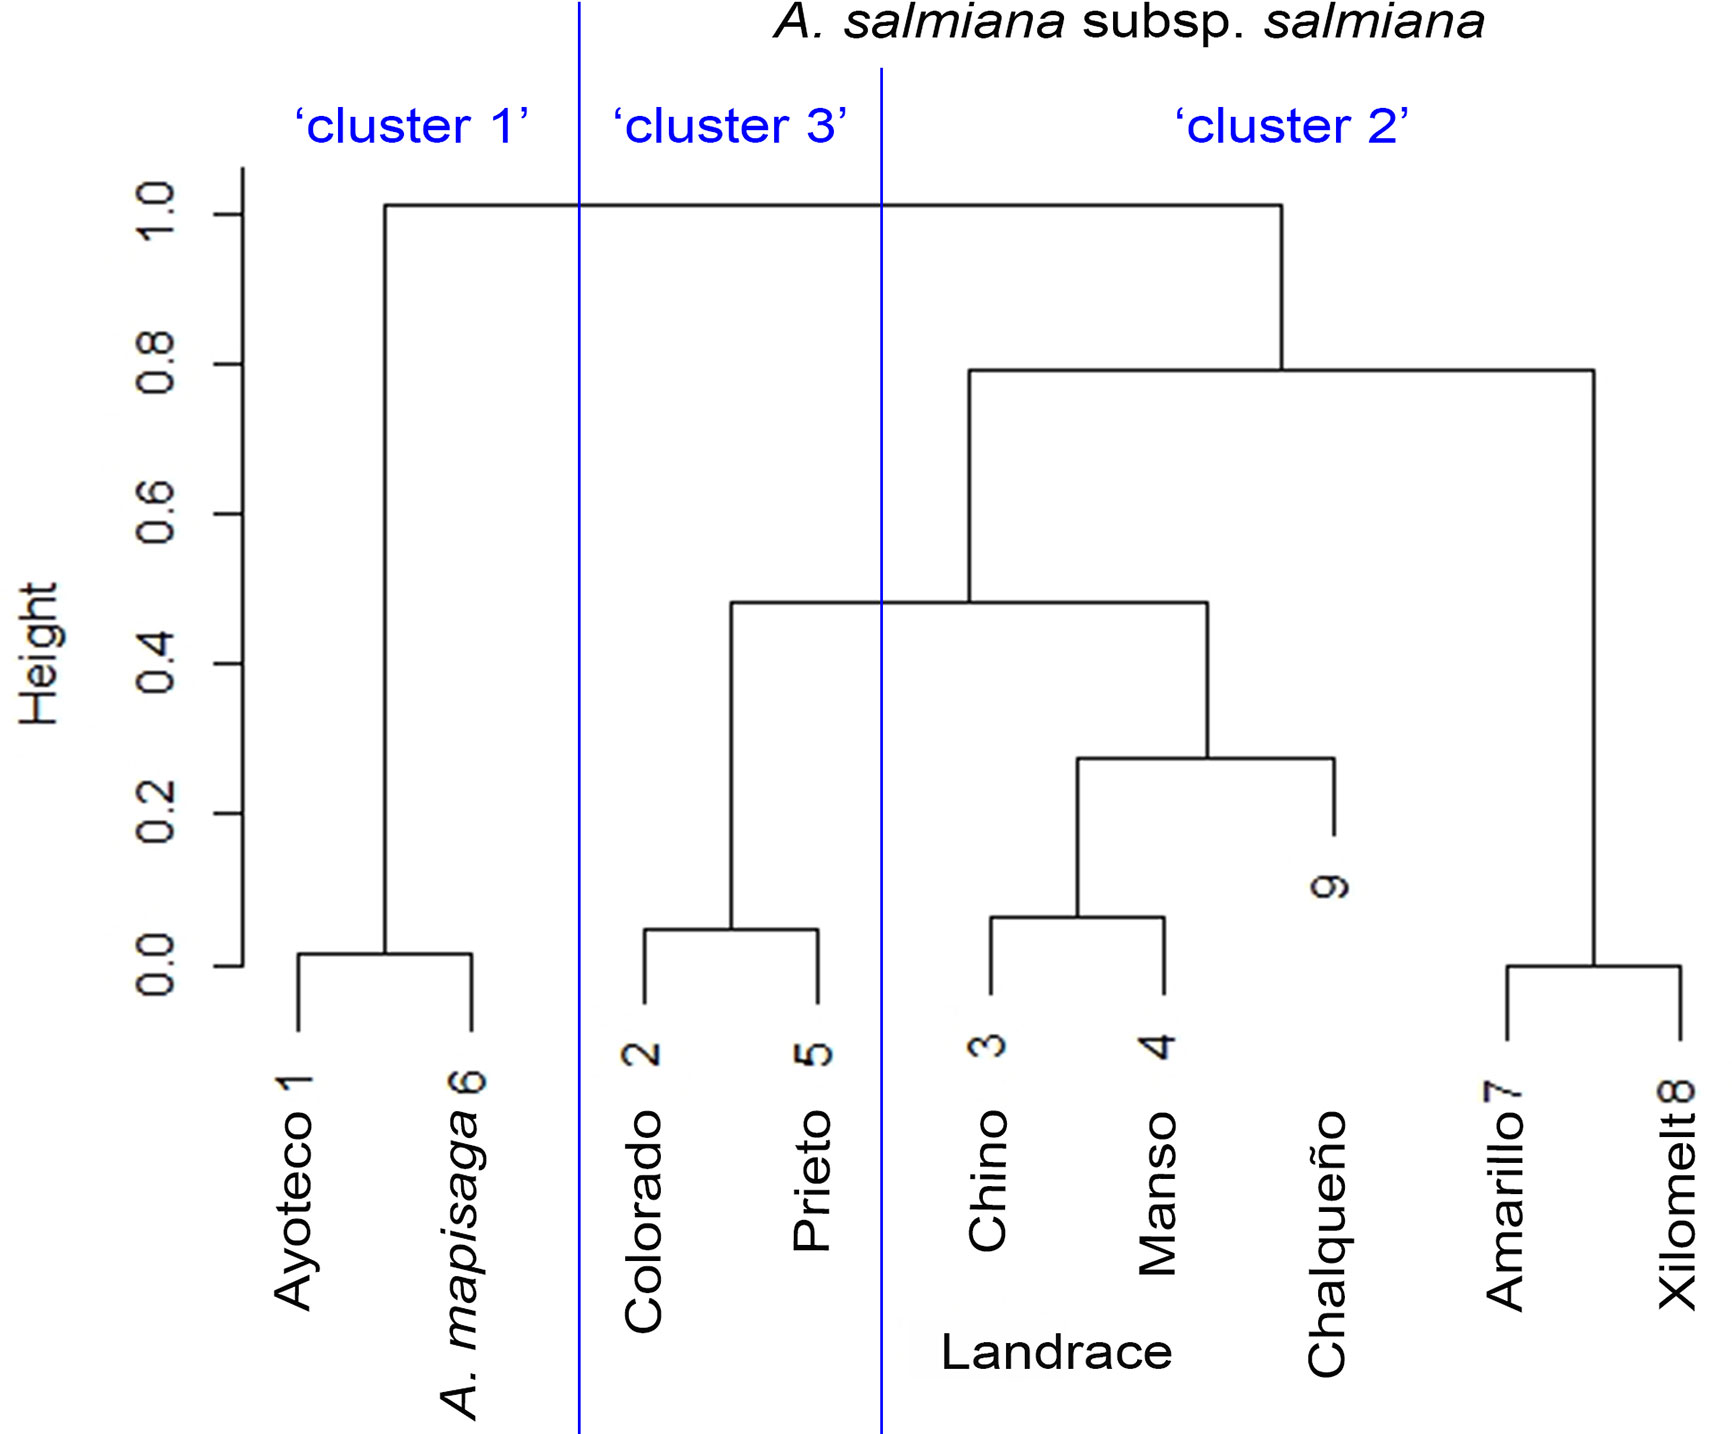
Figure 6 Similarity dendrogram between varieties. The percentage distributions in Table 2 were introduced as vectors in the “agnes” function of the R cluster library using Ward’s method.
Table 3 shows the means of the interval variables per cluster. The main morphological contrasts occurred between individuals in cluster 1 and the merged cluster 2 and cluster 3 (Table 3). The landraces of cluster 1 (mainly A. mapisaga var. mapisaga and A. salmiana subsp. salmiana “Ayoteco”) had, on average, shorter average teeth length, shorter spine length, and thinner cuticles; they also have a longer distance to the first tooth, greater leaf thickness at the base, and longer leaves. On the other hand, the means of the individuals in cluster 2 and 3 (mainly landraces of A. salmiana subsp. salmiana, with the exception of “Ayoteco”) showed some differences yet tended to be more similar.
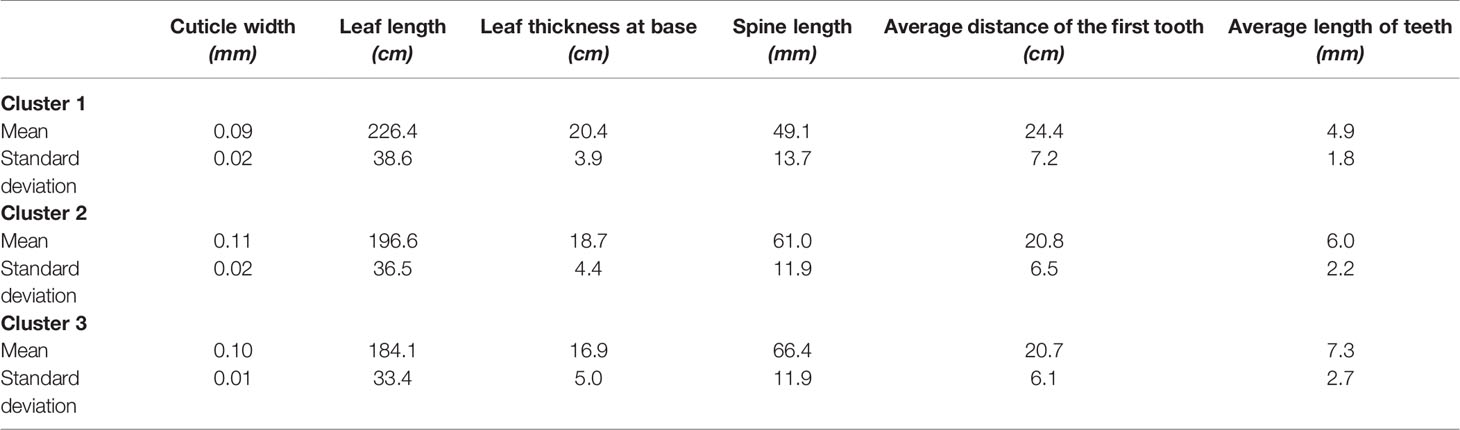
Table 3 Averages of the morphological interval variables per cluster.
Individuals in cluster 1 also differed from those in cluster 2 and 3 in terms of spine and tooth shape (Table 4). Cluster 1 (mainly A. mapisaga var. mapisaga and A. salmiana subsp. salmiana “Ayoteco”) is dominated by individuals with curved spines and straight teeth. Cluster 2 (mainly A. salmiana subsp. salmiana “Amarillo”, “Chalqueño”, “Chino”, “Manso”, and “Xilomelt”) is basically formed by individuals with straight spines and straight teeth. Meanwhile, in cluster 3 (mainly A. salmiana subsp. salmiana “Colorado” and “Prieto”), all individuals have straight spines and curved teeth. Morphological differences between clusters are also evident in the percentage of rigid leaves. Ninety-five percent of individuals in cluster 3 had at least 90% rigid leaves, but only 66% of individuals in cluster 1 had rigid leaves. Meanwhile, cluster 2 is between clusters 1 and 3 in terms of percentage of rigid leaves (see Table 5). Therefore, it was possible to morphologically separate species of pulque agaves.
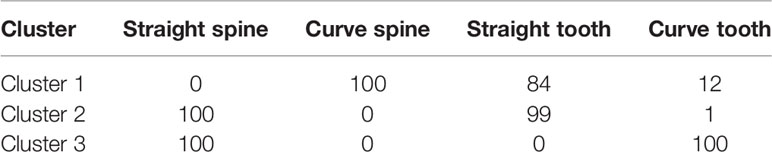
Table 4 Percentage of individual plants with straight spine, curve spine, straight tooth and curve tooth per cluster.
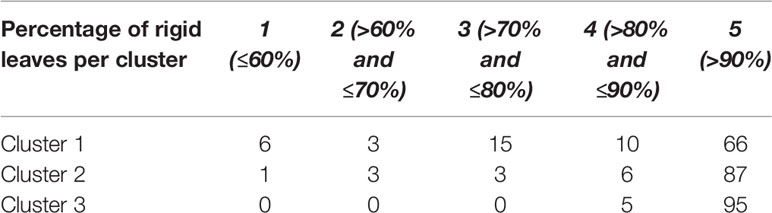
Table 5 Percentage distribution of the ordinal variable (percentage of rigid leaves) per cluster.
Figure 7 shows the actual clusters in two dimensions. It is important to remember that the morphological vectors of the individual plants are 9-dimensional, so we cannot visualize them precisely. To have a visual impression of both the data and clusters, it is necessary to use visualization techniques such as the Andrews plot, whose main, and perhaps only, purpose is to visualize high dimensional data. This plot allowed us to confirm that the clusters are not only geometrically but visually differentiable and, as already anticipated in the dendrogram, clusters 2 and 3 are more similar, as can be seen in the greater similarity of the oscillatory patterns of the observations of these clusters.
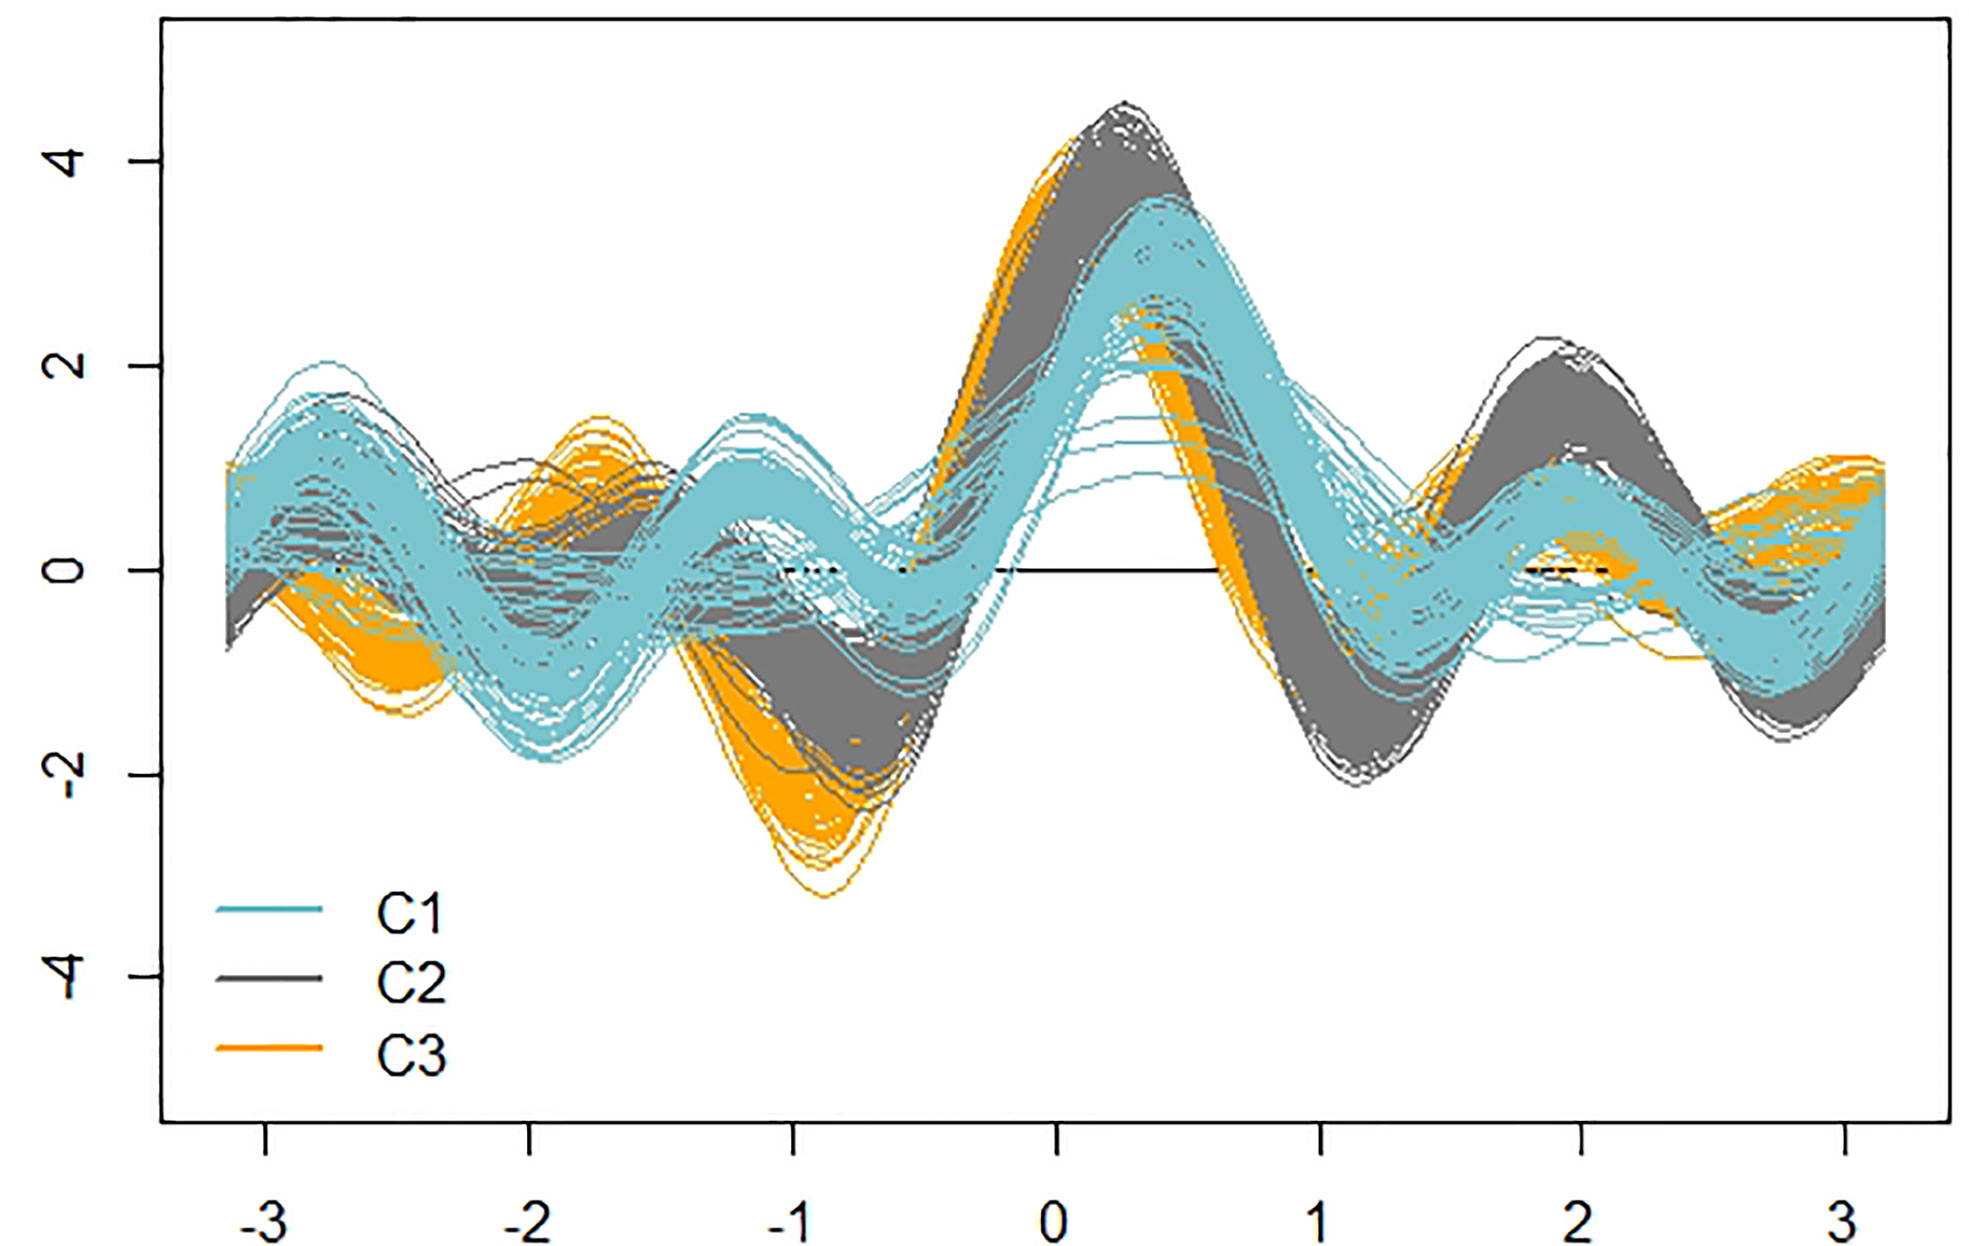
Figure 7 Andrews curves of the 478 observations distinguished according to cluster. Blue: cluster 1; Gray: cluster 2; Orange: cluster 3.
The majority of the studies on the morphological diversity of agaves for pulque production are based solely on the analysis of vegetative characters (Alfaro-Rojas et al., 2007; Mora-López et al., 2011; Figueredo et al., 2014; Alvarez-Ríos et al., 2020; Table S3). Similar to the present study, the variability of morphological vegetative characters in these latter studies is distributed and grouped at the species level with respect to classical taxonomy (Mora-López et al., 2011; Alvarez-Ríos et al., 2020; Table S4). Mora-López et al. (2011) observed that A. salmiana and A. mapisaga var. mapisaga are separated into two groups, similar to the findings herein. Alfaro-Rojas et al. (2007) analyzed six stem characters and found that “Manso”, “Ayoteco”, and “Verde” formed a single cluster that differed from “Xilomelt”. Notably, these latter authors also found that “Ayoteco” belonged to the morphological group of A. salmiana in contrast with our findings that it is closest to A. mapisaga var. mapisaga. This reflects the difficulty of identifying plants by only their common names, as it is possible that the “Ayoteco” studied by Alfaro-Rojas et al. (2007) is not the same that we analyzed herein or that this cultivar presents variability in vegetative characters throughout its distribution.
The analysis of reproductive, biochemical, and genetic characters could improve the taxonomic resolution of the different landraces. Figueredo et al. (2014, 2017) analyzed vegetative, reproductive, and genetic characters, distinguishing wild populations of A. inaequides from cultivated ones as well as species such as A. hookeri and A. cupreata. Few studies have analyzed reproductive characters due to the difficulty of obtaining flowers, fruits, and seeds from pulque agaves. Growers halt their development to obtain aguamiel or, if flowers bloom, people collect them as a food source (Tables S3 and S4).
Comparison between previous studies and ours is not an easy task because of differences between studies. For example, each study measured morphological characters in different ways, and the most significant characters also tended to be different in each study (Tables S3 and S4). The number of measured plants has varied from 2 to 100; however, in most of cases, just a few plants were measured. In addition, many authors did not identify species and landraces using classical taxonomic keys. Rather, the majority of studies only reported the common name of the taxa, which complicates comparisons given that these names may or may not correspond with the same taxa across studies. These issues could be resolved by standardizing the methods for measuring morphological, biochemical, and genetic characters. In addition, studies should be rigorous in their taxonomic identification efforts and aspire to create taxonomic keys for identifying landraces in the future in order to avoid the ambiguity caused by using only common names.
Some authors have also pointed out that the management and artificial selection of certain plants could have modified certain characters, reflecting the characteristics desired by growers (Vargas-Ponce et al., 2007; Mora-López et al., 2011). Growers tend to select for larger plants (longer leaves and thicker leaf bases), smaller teeth, greater distance between teeth, greater distance from the apical spine to the first tooth, and shorter apical spines. Cluster 1 (“Ayoteco” and A. mapisaga var. mapisaga) could be expressing these characters of interest. Notably, we also observed that the subspecies salmiana, in particular the “Manso” landrace, is still cultivated in a very traditional manner in Tlaxcala. On the other hand, A. mapisaga and “Ayoteco” could be the landraces most modified by growers. However, these differences could also be due to pre-existing differences between species resulting from their evolutionary histories. The shape of the spine and teeth could be explained by the latter, as these do not appear to be characters of interest but rather distinctive characters of the landraces (Table 4). To better understand the changes caused by artificial selection, it would be necessary to make comparisons with wild relatives.
The analysis of morphological diversity has many practical applications for the management, production, and conservation of the Agave landraces used for pulque production. Through these studies, the variability of morphological characters in production fields can be described, possibly enabling the identification of different landraces as morphological groups with particular characters, which has taxonomic implications. The characterization of this diversity is fundamental for the establishment of in situ and ex situ conservation strategies. On the other hand, the lack or loss of diversity can lead to an increase in the vulnerability of plants to pests and diseases and decrease their resistance to climate change.
Genetic Relationships
The low resolution obtained from the Agave genome fragments is most likely due to the recent origin of the genus, around 6–10 million years ago, and the high hybridization rates occurring as a consequence of pollinator-mediated genetic flow (Good-Avila et al., 2006; Scheinvar et al., 2017; Flores-Abreu et al., 2019). In our first attempt to use genetic markers to distinguish pulque-producing agaves, we only found enough variation to differentiate between species using one plastid marker and one nuclear marker.
A 13 base-pair (bp) inversion was found in the trnL(UAA) intron of cpDNA at the 1,209 position in the total matrix for A. mapisaga and A. salmiana subsp. salmiana “Ayoteco”. Therefore, in building our trnL haplotype network (Figure 8A), A. mapisaga and “Ayoteco” were grouped as haplotype H1. Using the ITS 1–4 marker, we only found a single base change (C–A) at position 602 in a 635-bp-long matrix, and polymorphisms were observed in A. mapisaga. Thus, the ITS haplotype network (Figure 8B) indicated a haplotype per species separated by a single mutation, grouping “Ayoteco” with A. salmiana. Finally, the combined matrix showed three haplotypes (Figure 8C): A. mapisaga (H1) separated by only one mutation from “Ayoteco” (H2) and the remaining A. salmiana taxa (H3). This latter haplotype is separated from the other two by various steps.
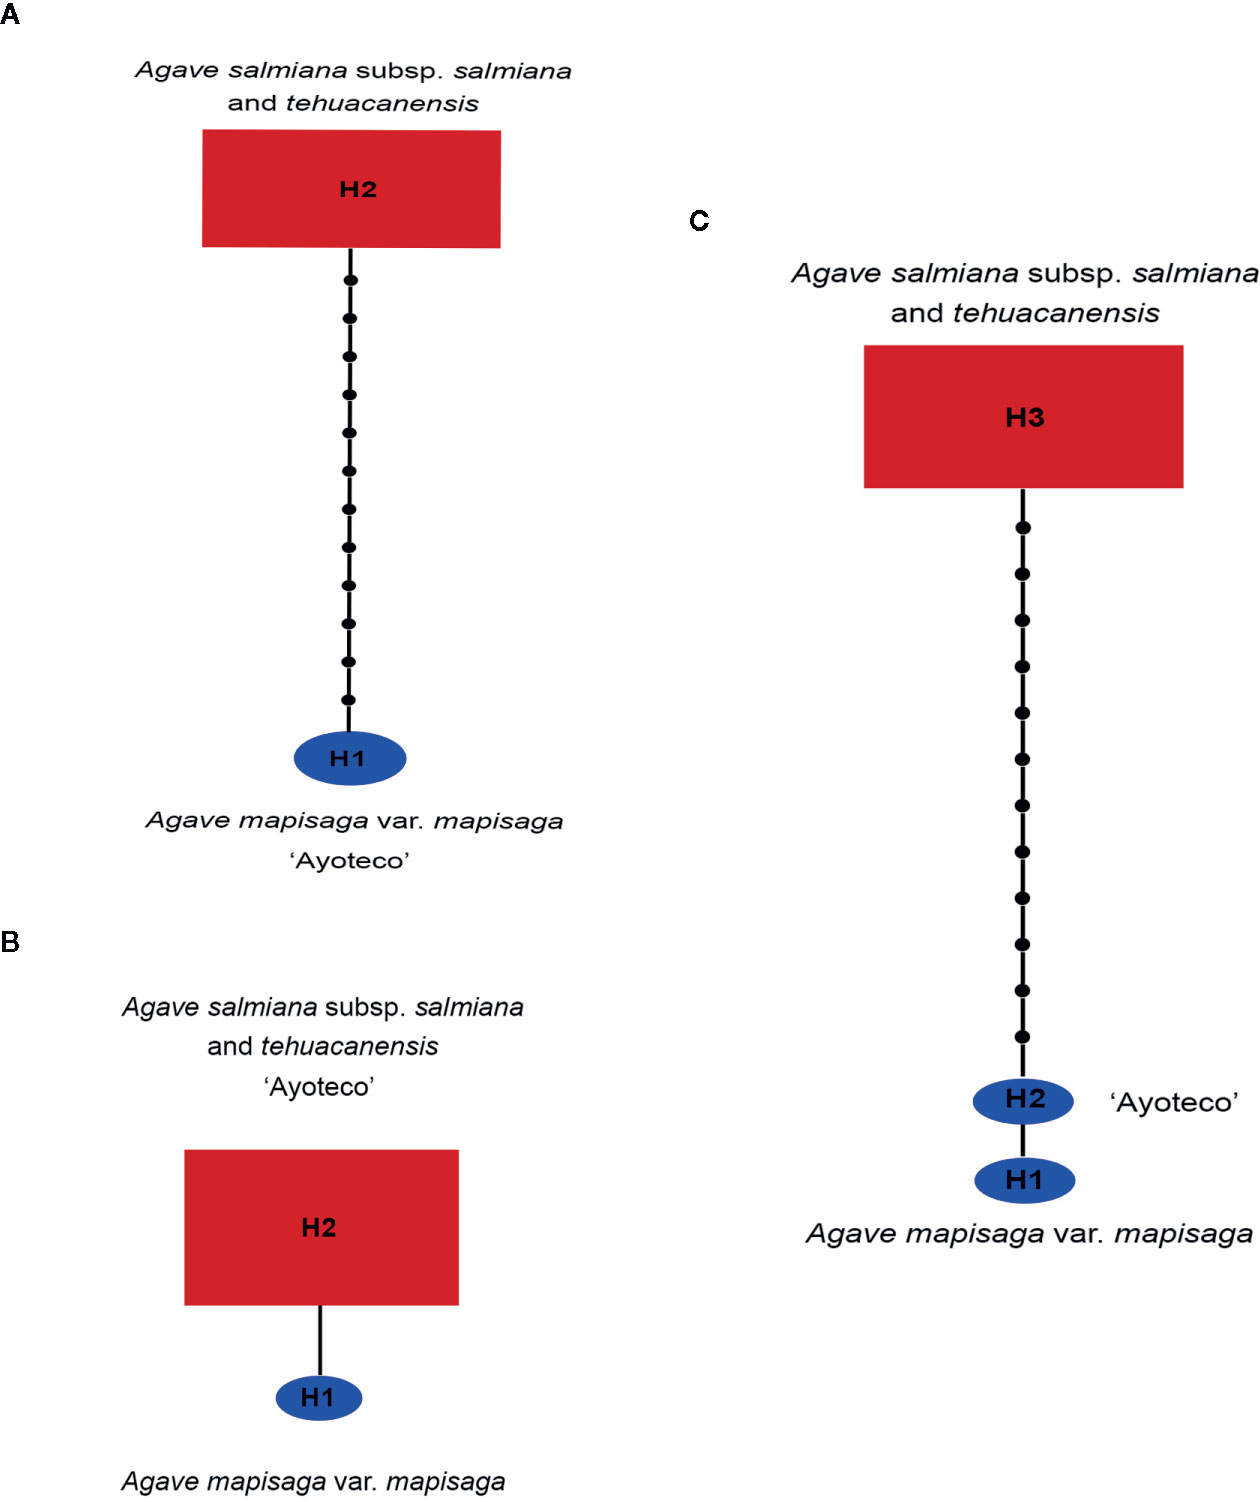
Figure 8 Haplotype network from the (A) trnL, (B) ITS, and (C) combined trnL and ITS matrices obtained in the TCS program (Clement et al., 2000). The size of the red rectangles and blue ellipses represent the haplotype frequency (Table S1).
In the STRUCTURE assignment analysis, we obtained a ΔK probability value supporting two clusters in trnL intron and combined matrices (Figures 9C–F). Each cluster or genetic pool corresponded with a species. Specifically, cluster 1 corresponded with A. salmiana subsp. salmiana and A. salmiana subsp. tehuacanensis and cluster 2 with A. mapisaga var. mapisaga. Only A. salmiana subsp. salmian “Ayoteco” was the exception and was shown to share the same genetic pool as A. mapisaga var. mapisaga (cluster 2). In the case of the ITS marker, only one cluster was identified with a K = 1 (Figure 9A). For this last marker, there was no ΔK obtained because there was no variance found between the different runs, and the highest probability value reached 1 (Figure 9B).
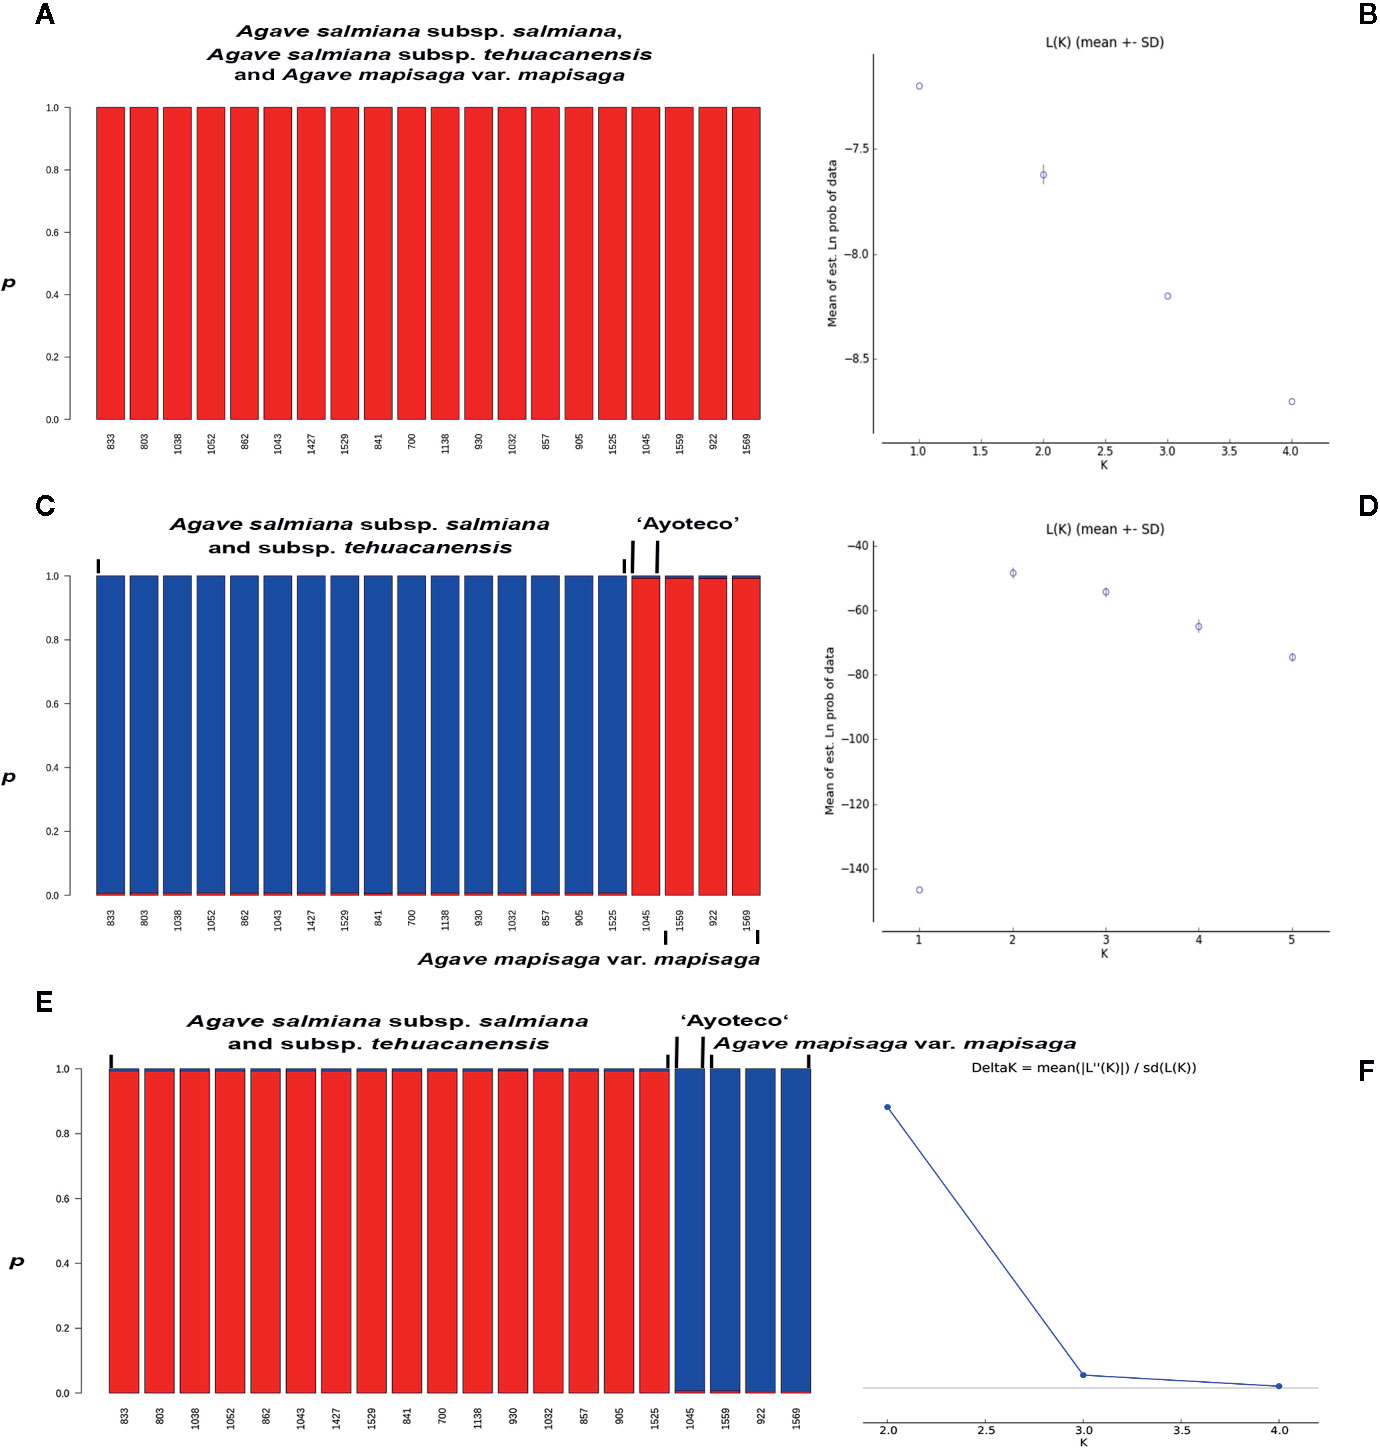
Figure 9 Individuals’ assignment analysis using the Bayesian statistic with the p co-ancestry coefficient in STRUCTURE and probability values for (A, B) ITS (K=1), (C) trnL (K=2), and (D, E) combined matrix (K=2); with the optimum genetic cluster number (K) based on Evanno’s ΔK statistic calculated in the STRUCTURE HARVESTER program (F), except for ITS. The Evanno’s ΔK and probability values graphs for trnL are quite similar to the ones from the combined matrix, these were not presented.
As previously mentioned, classical taxonomy based on morphological traits identifies “Ayoteco” as A. salmiana subsp. salmiana, even though this landrace shares traits with both species. However, the morphological analysis grouped “Ayoteco” and A. mapisaga var. mapisaga, even though they are not identical. Therefore, with respect to “Ayoteco,” the genetic data are not congruent, although the combined data analysis supports its close relationship with A. mapisaga var. mapisaga.
The history retrieved from each genome (either plastid or nuclear) tends to be different because of its origin, evolutionary processes, and manner of inheritance. Chloroplasts are haploid with maternal inheritance, almost nonexistent recombination, and a lower mutation rate compared to the nuclear genome, but higher than nuclear ribosomal DNA (Palmer et al., 1988; Wheeler et al., 2014; Ferradini et al., 2017). Many plant studies have easily found sufficient phylogenetic resolution from plastid genome markers (Yang et al., 2013; Wheeler et al., 2014).
There is a much discussion over whether the results of combined analyses are accurate since two different evolutionary histories are combined. However, these histories are not entirely independent because they have the same species history (Gadagkar et al., 2005; Degnan and Rosenberg, 2009). Some studies have found well-supported trees with high resolution from analyzing total combined data (Gadagkar et al., 2005; Degnan and Rosenberg, 2009). In the plastid genome, inversions are more rare than single nucleotide substitutions (Palmer et al., 1988); thus, in this case, the use of the trnL intron could be more plausible than the ITS marker. Ultimately, these approaches represent hypotheses that can be re-addressed in future studies to search for further phylogenetic resolution for the taxa in question, as the genetic data presented herein are not conclusive. It is necessary to explore a larger number of Agave species (paying special attention to the Salmianae group, Gentry, 1982) and a larger set of molecular markers to find ones that would be capable of providing a more complete and resolved phylogenetic history in order to better understand the genetic diversity of pulque-producing Agave species and landraces.
Currently, most studies on the Agave genus have been carried out at the population level using DNA fingerprint markers. Using microsatellite molecular markers (SSRs), Figueredo et al. (2015) found that A. inaequides (used for mezcal and pulque production) shows high genetic diversity and low structuring and that genetic diversity was mainly associated with the environment or the samples’ region of origin. This could imply that there is variability among populations of landraces or throughout their geographic distribution, which highlights the need to carry out further studies on their morphological and genetic diversity throughout their geographic distribution. Later, once again using microsatellite molecular markers (SSR), Figueredo et al. (2017) observed that the species used for mezcal and pulque production (Agave inaequides, Agave hookeri, and Agave cupreata) tended to form genetic pools corresponding with the species level, even though A. hookeri is mixed with cultivated A. inaequides plants. In the present study, A. salmiana and A. mapisaga could similarly represent separate genetic pools, with the exception of “Ayoteco” (Figure 9). Alvarez-Ríos et al. (2020) also found through SSR markers that A. salmiana and A. mapisaga have distinguishable genetic pools by species, with moderate genetic flow between these species. A cluster showing similarities to Agave americana was also found, possibly a hybrid of A. salmiana and A. americana. Microsatellites are especially useful for the study of interpopulational variation. In particular, chloroplast microsatellites (cpSSRs) are useful for testing hypothesis on the hybridization between species or populations (Wheeler et al., 2014). However, cpSSRs have been little used in studies on agave and could be one alternative for distinguishing the genetic pools of A. salmiana and A. mapisaga and possible introgression events.
Because of their low selection intensity, the landraces studied herein may be assigned to genetic clusters at the species level in contrast to extreme examples like Agave tequilana “Azul”, which is intensively and continuously cloned to produce tequila. A. tequilana “Azul” is recognized as having an identity distinct from other possibly closely related species (Trejo et al., 2018). With respect to pulque agaves, there is a possibility that morphological vegetative traits are plastic and reflect growers’ knowledge of different landraces and the common names given to different forms. Accordingly, such plasticity may be environmental and directed by the selection of plants or, occasionally, may result from genetic flow between them when plants eventually flower following abandonment or growers forget to harvest the aguamiel.
Conclusions
The perception of the diversity of pulque agaves is high among growers, as reflected by the high number of common names. However, most morphological studies have only analyzed vegetative characters and have only been able to differentiate landraces at the species level. The sequencing analyses carried out herein enabled genetic variants generally associated with genetic pools at the species level to be identified. However, the landraces from the pulque production agaves could be different from each other, since they have origin in different wild plants and have different uses. Furthermore, crop abandonment allows for genetic flow events. In contrast, the intensive production of certain landraces through restrictive asexual reproduction or the complete abandonment of certain landraces could lead to their eventual disappearance.
The identity of A. salmiana subsp. salmiana “Ayoteco” is still not clear, this might be a hybrid between A. salmiana and A. mapisaga or we just might be observing gene flow between “Ayoteco” and A. mapisaga. In order to acquire further understanding about pulque landraces’ taxonomic identity, it is necessary to include more characters in the analysis, including reproductive and biochemical characters, as well as polymorphisms in a single nucleotide (SNP). It is also recommendable to perform population analyses of Agave landraces throughout their geographic distribution and compare these to their wild relatives.
In Tlaxcala, the conservation of Agave landraces with a local distribution can be strengthened through their taxonomic identification and continued local use. However, the conservation of their vast richness also depends on avoiding their replacement with other landraces that could lead to their extinction, such as in the Yucatan Peninsula, where local landraces (henequen) have been displaced, or in Jalisco, where traditional varieties once used for tequila production have been substituted by the blue agave.
Data Availability Statement
The datasets generated for this study can be found in the GenBank (see Table S2).
Author Contributions
LT participated in collecting, taking morphological characters measurements, obtaining sequences, analyzing kin relationships, writing and editing the article. MR and DC-T did the statistical analysis of morphological characters, and participated in writing and editing the article. ER-G took part in collecting, taking morphological characters measurements and making some of the figures. LM-C also took part in collecting and measuring morphological characters.
Conflict of Interest
The authors declare that the research was conducted in the absence of any commercial or financial relationships that could be construed as a potential conflict of interest.
Acknowledgments
We thank CONACyT Support for the Strengthening and Development of the Scientific and Technological Infrastructure for grant 26,866, and “Catedras CONACyT” project No. 59. We thank SEFOA for their support in the maintenance of the work area. We are grateful to the Biology Institute, UNAM, for its financial support to scientific publishing. The authors thank Eribel Bello Cervantes, Estefania Briones Dumas, Yulia Hernández Hernández, Gerardo D. Amezquita Hernández, Nayely López Rodríguez, Mariana E. Sánchez Martínez, and Adriana Montoya for their support with the field work. We also acknowledge the producers and growers who granted us access to their crop fields. Finally, we thank Laura Márquez and Nelly López of LaNABio for their assistance in obtaining the sequences and Jaime Gasca for his support during analysis stage and suggestions for the writing of the article.
Supplementary Material
The Supplementary Material for this article can be found online at: https://www.frontiersin.org/articles/10.3389/fpls.2020.524812/full#supplementary-material
References
Alfaro-Rojas, R. G., Legaria, J. P., Rodríguez, J. E. (2007). Diversidad genética en poblaciones de agaves pulqueros (Agave spp.) del nororiente del Estado de México. Rev. Fitotec. Mex. 30, 1–12.
Alvarado, C., Camacho, R. M., Cejas, R., Rodríguez, J. A. (2014). Profiling comercial Agave fructooligosaccharides using ultrafiltration and high performance thin layer cromatography. Rev. Mex. Ing. Quim. 13, 417–427.
Alvarez-Duarte, M. C., Garcia-Moya, E., Suárez-Espinosa, J., Luna-Cavazos, M. (2018). Traditional knowledge, cultivation and use of maguey pulquero in municipalities of Puebla and Tlaxcala. Polibotanica 45, 205–222. doi: 10.18387/polibotanica.45.15
Alvarez-Ríos, G., Pacheco-Torres, F., Figueredo-Urbina, C. J., Casas, A. (2020). Mnagement, morphological and genetic diversity of domesticated agaves in Michoacán, México. J. Ethno. Biomed. 16:3. doi: 10.1186/s13002-020-0353-9
Bayer, R. J., Soltis, D. E., Soltis, P. S. (1996). Phylogenetic inferences in Antennaria (Asteraceae: Gnaphalieae: Cassiniinae) based on sequences from Nuclear Ribosamal DNA internal transcribed spacers (ITS). Am. J. Bot. 83, 516–527. doi: 10.2307/2446220
Casañas, F., Simo, J., Casals, J., Prohens, J. (2007). Toward an Evolved Concept of Landrace. Front. Plant Sci. 8, 145. doi: 10.3389/fpls.2017.00145
Clement, M., Posada, D., Crandall, K. A. (2000). TCS: a computer program to estimate gene genealogies. Mol. Ecol. 9, 1657–1659. doi: 10.1046/j.1365-294x.2000.01020.x
Colunga-GarcíaMarín, P., Zizumbo-Villarreal, D., Martinez-Torres, J. (2007). “Tradiciones en el aprovechamiento de los agaves mexicanos: una aportación a la protección legal y conservación de su diversidad biológica y cultural,” in En lo ancestral hay futuro: del tequila, los mezcales y otros agaves. Eds. Colunga-GarciaMarin, P., Larqué Saavedra, A., Eguiarte, L. E., Zizumbo-Villarreal, D. (Merida, Yuc: CICY, A.C), 229–248.
Degnan, J. H., Rosenberg, N. A. (2009). Gene tree discordance, phylogenetic inference and the multispecies coalescent. Trends Ecol. Evol. 24, 332–340. doi: 10.1016/j.tree.2009.01.009
Earl, D. A., vonHoldt, B. M. (2012). STRUCTURE HARVESTER: a website and program for visualizing STRUCTURE output and implementing the Evanno method. Conserv. Genet. Resour. 4, 359–361. doi: 10.1007/s12686-011-9548-7
Escalante, A., Giles-Gómez, M., Hernández, G., Córdova-Aguilar, M. S., López-Munguía, A., Gosset, G., et al. (2008). Analysis of bacterial community during the fermentation of pulque, a traditional Mexican alcoholic beverage, using a polyphasic approach. Int. J. Food Micribiol. 124, 126–134. doi: 10.1016/j.ijfoodmicro.2008.03.003
Evanno, G., Regnaut, S., Goudet, J. (2005). Detecting the number of clusters of individuals using the software STRUCTURE: a simulation study. Mol. Ecol. 14, 2611–2620. doi: 10.1111/j.1365-294X.2005.02553.x
Falush, D., Stephens, M., Pritchard, J. K. (2003). Inference of population structure using multilocus genotype data: linked loci and correlated allele frequencies. Genetics 164, 1567–1587. doi: 10.1111/j.1471-8286.2007.01758.x
Ferradini, N., Lancioni, H., Torricelli, R., Russi, L., Ragione, I. D., Cardinali, I., et al. (2017). Characterization and phylogenetic analysis of ancient italian landraces of pear. Front. Plant Sci. 8:751:751. doi: 10.3389/fpls.2017.00751
Figueredo, C. J., Casas, A., Colunga-GarcíaMarín, P., Nassar, J. M., González-Rodríguez, A. (2014). Morphological variation, management and domestication of ‘maguey alto’ (Agave inaequidens) and ‘maguey manso’ (A.hookeri) in Michoacán, México. J. Ethno. Biomed. 10, 66. doi: 10.1186/1746-4269-10-66
Figueredo, C. J., Casas, A., González-Rodríguez, A., Nassar, J. M., Colunga-GarcíaMarín, P., Rocha-Ramírez, V. (2015). Genetic structure of coexisting wild and managed agave populations: implications for the evolution of plants under domestication. AoB Plants 7:plv114. doi: 10.1093/aobplan/plv114
Figueredo, C. J., Casas, A., Torres-García, I. (2017). Morphological and genetic divergence between Agave inaequidens, A.cupreata and the domesticated A. hookeri. Analysis of their evolutionary relationships. PloS One 12, 11. doi: 10.1371/journal.pone.0187260
Flores-Abreu, I. N., Trejo-Salazar, R. E., Sánchez-Reyes, L. L., Good, S. V., Magallón, S., García-Mendoza, A., et al. (2019). Tempo and mode in coevolution of Agave sensu lato (Agavoideae, Asparagaceae) and its bat pollinators, Glossophaginae (Phyllostomidae). Mol. Phylogenet. Evol. 133, 176–188. doi: 10.1016/j.ympev.2019.01.004
Gabriel, K. R. (1971). The biplot graphic display of matrices with application to principal component analysis. Biometrika 58, 453–467. doi: 10.1093/biomet/58.3.453
Gabriel, K. R. (1980). “Biplot,” in Encyclopedia of Statistical Sciences. Eds. Johnson, N. L., Kotz, S. (New York: John Wiley and Sons), 147–173.
Gadagkar, S. R., Rosenberg, M. S., Kumar, S. (2005). Inferring species phylogenies from multiple genes: Concatenated sequence tree versis consensus gene tree. J. Exp. Zool. B. Mol. Dev. Evol. 304B, 64–74. doi: 10.1002/jez.b.21026
García-Mendoza, A. J. (2011). “Agavaceae,” in Flora del Valle de Tehuacán-Cuitlatán. Fascículo 88 (Mexico: Instituto de Biología, UNAM).
Gentry, H. S. (1982). Agaves of Continental North America (Tucson: The University of Arizona Press).
Gonςalves de Lima, O. (1956). El Maguey y el pulque en los códices Mexicanos (Mexico: Fondo de Cultura Económica).
Good-Avila, S. V., Souza, V., Gaut, B. S., Eguiarte, L. E. (2006). Timing and rate of speciation in Agave (Agavaceae). PNAS 103, 9124–9129. doi: 10.1073/pnas.0603312103
Gower, J. C. (1971). A general coefficient of similarity and some of its properties. Biometrics 27, 857–871. doi: 10.2307/2528823
Instituto Nacional de Estadística, Geografía e informática (2016). Anuario estadístico y geográfico de Tlaxcala (Mexico: INEGI). Available at: http://evaluacion.tlaxcala.gob.mx/images/stories/documentos/planea/estadistica/ae/ea2016.pdf (Accessed 12 de june de 2019).
Kaufman, L., Rousseeuw, P. J. (2005). Finding groups in data: An introduction to cluster analysis (New York: Wiley).
Lappe-Oliveras, P., Moreno-Terrazas, R., Arrizón-Gaviño, J., Herrera-Suárez, T., García-Mendoza, A., Gschaedler-Mathis, A. (2008). Yeasts associated with the production of Mexican alcoholic nondistilled and distilled Agave beverages. FEMS Yeast. Res. 8, 1–16. doi: 10.1111/j.1567-1364.2008.00430.x
Maechler, M., Rousseeuw, P., Struyf, A., Hubert, M., Hornik, K. (2018). cluster: Cluster Analysis Basics and Extensions, R package version 2.0.7-1.
Mora-López, J., Reyes-Agüero, J., Flores-Flores, J., Peña-Valdivia, C., Aguirre-Rivera, J. (2011). Variación morfológica y humanización de la Sección Salmianae del género Agave. Agrociencia 45, 465–477.
Moreno-Vilet, L., Garcia-Hernandez, M. H., Delgado-Portales, R. E., Corral-Fernandez, N. E., Cortez-Espinosa, N., Ruiz-Cabrera, M. A., et al. (2014). In vitro assessment of agave fructans (Agave salmiana) as prebiotics and immune system activators. Int. J. Biol. Macromol. 63, 181–187. doi: 10.1016/j.ijbiomac.2013.10.039
Myslivec, J. (2012). andrews: Andrews curves. R package version 1.0. Available at: https://CRAN.R-project.org/package=andrews.
Nguyen, L. H., Holmes, S. (2019). Ten quick tips for effective dimensionality reduction. PloS Comput. Biol. 15 (6), e1006907. doi: 10.1371/journal.pcbi.1006907
Ortiz-Basurto, R. I., Pourcelly, G., Doco, T., Williams, P., Dornier, M., Belleville, M. P. (2008). Analysis of the main components of the aguamiel produced by the maguey-pulquero (Agave mapisaga) throughout the harvest period. J. Agric. Food Chem. 56, 3682–3687. doi: 10.1021/jf072767h
Palmer, J. D., Jansen, R. K., Michaels, H. J., Chase, M. W., Manhart, J. R. (1988). Chloroplast DNA variation and plant phylogeny. Ann. Mo. Bot. Gard. 75, 1180–1206. doi: 10.2307/2399279
Pritchard, J. K., Stephens, M., Donnelly, P. (2000). Inference of population structure from multilocus genotype data. Genetics 155, 945–959.
R Core Team (2019). R: A language and environment for statistical computing (Vienna, Austria: R Foundation for Statistical Computing). Available at: https://www.R-project.org/.
Ramírez, A. M. (2014). “El pulque, un bien biocultural y sustentable,” in El maguey y el pulque en la región central de México. Ed. Ramos-Galicia, Y. (Mexico: Gobierno del Estado de Tlaxcala), 83–98.
Ramírez-Manzano, S. I., Bye, R., García-Moya, E., Romero-Manzanares, A. (2020). Aprovechamiento del maguey pulquero en Nanacamilpa, Tlaxcala, Mexico. Rev. Etnb. 18, 65–76.
Ramírez-Rancaño, M. (2000). Ignacio Torres Adalid y la industria pulquera (Mexico: Instituto de investigaciones Sociales de la UNAM. Editores Plaza y Valdés).
Rokach, L., Maimon, O. (2005). Clustering Methods. in Data Mining and Knowledge Discovery. Eds. Maimon, O., Rokach, L. (Boston, M.A: Springer). Handbook.
Sahagún, B. (1979). Historia general de las cosas de Nueva España. Manuscrito de la Colección Palatina de la Biblioteca Medica Laurenziana, Florencia [reproducción facsimilar: Códice Florentino] (México, D.F: Archivo General de la Nación).
Scheinvar, E., Gámez, N., Castellanos-Morales, G., Aguirre-Plater, E., Eguiarte, L. E. (2017). Neogene and Pleistocene history of Agave lechuguilla in the Chihuahuan Desert. J. Biogeography 44, 322–334. doi: 10.1111/jbi.12851
Taberlet, P., Gielly, L., Pautou, G., Bouvet, J. (1991). Universal primers for amplification of three non-coding regions of chloroplast DNA. Mol. Eco. 17, 1105–1109. doi: 10.1007/BF00037152
Trejo, L., Limones, V., Peña, G., Scheinvar, E., Vargas-Ponce, O., Zizumbo-Villarreal, D., et al. (2018). Genetic variation and relationships among agaves to the production of Tequila and Mezcal in Jalisco. Indust. Crops. Prod. 125, 140–149. doi: 10.1016/j.indcrop.2018.08.072
Vargas-Ponce, O., Zizumbo-Villarreal, D., Martínez-Castillo, J., Coello-Coello, J., Colunga-GarcíaMarín, P. (2007). In situ diversity and maintenance of Traditional Agave Landraces used in spirits production in West-Central Mexico. Eco. Bot. 61, 362–375. doi: 10.1663/0013-0001(2007)61[362:ISDAMO]2.0.CO;2
Ward, J. H., Jr (1963). Hierarchical grouping to optimize an objective function. J. Amer. Statist. Assoc. 58, 236–244. doi: 10.1080/01621459.1963.10500845
Wheeler, G. L., Dorman, H. E., Buchanan, A., Challagundla, L., Wallace, L. E. (2014). A review of the prevalence, utility, and caveats of using chloroplast simple sequence repeats for studies of plant biology. Appl. Plant Sci. 2:1400059. doi: 10.3732/apps.1400059
Keywords: plant domestication, landrace, morphology, molecular markers, Agave salmiana, Agave mapisaga
Citation: Trejo L, Reyes M, Cortés-Toto D, Romano-Grande E and Muñoz-Camacho LL (2020) Morphological Diversity and Genetic Relationships in Pulque Production Agaves in Tlaxcala, Mexico, by Means of Unsupervised Learning and Gene Sequencing Analysis. Front. Plant Sci. 11:524812. doi: 10.3389/fpls.2020.524812
Received: 06 January 2020; Accepted: 20 August 2020;
Published: 08 September 2020.
Edited by:
Karolina Heyduk, University of Hawaii, United StatesReviewed by:
Ryan Stewart, Brigham Young University, United StatesJose Alberto Narvaez-Zapata, Instituto Politécnico Nacional, Mexico
Copyright © 2020 Trejo, Reyes, Cortés-Toto, Romano-Grande and Muñoz-Camacho. This is an open-access article distributed under the terms of the Creative Commons Attribution License (CC BY). The use, distribution or reproduction in other forums is permitted, provided the original author(s) and the copyright owner(s) are credited and that the original publication in this journal is cited, in accordance with accepted academic practice. No use, distribution or reproduction is permitted which does not comply with these terms.
*Correspondence: Laura Trejo, laura.trejo@st.ib.unam.mx