 Hong-Yi Zheng
 Xian-Lin Guo
 Megan Price2
 Xing-Jin He
- 1Key Laboratory of Bio-Resources and Eco-Environment of Ministry of Education, College of Life Sciences, Sichuan University, Chengdu, China
- 2Sichuan Key Laboratory of Conservation Biology on Endangered Wildlife, College of Life Sciences, Sichuan University, Chengdu, China
Exploring the effects of orographic events and climatic shifts on the geographic distribution of organisms in the Himalayas-Hengduan Mountains (HHM) region and Qinghai-Tibetan Plateau (QTP) is crucial to understand the impact of environmental changes on organism evolution. To gain further insight into these processes, we reconstructed the evolutionary history of nine Chamaesium species distributed across the HHM and QTP regions. In total, 525 individuals from 56 populations of the nine species were analyzed based on three maternally inherited chloroplast fragments (rpl16, trnT-trnL, and trnQ-rps16) and one nuclear DNA region (internal transcribed spacer, ITS). Fifty-two chloroplast DNA (cpDNA) and 47 ITS haplotypes were identified in nine species. All of the cpDNA and ITS haplotypes were species-specific. Phylogenetic analysis suggested that all nine species form a monophyletic clade with high support. Dating analysis and ancestral area reconstruction revealed that the ancestral group of Chamaesium originated in the southern Himalayan region at the beginning of the Paleogene (60.85 Ma). The nine species of Chamaesium then separated well during the last 25 million years started in Miocene. Our maxent modeling indicated the broad-scale distributions of all nine species remained fairly stable from LIG to the present and predicted that it will remain stable into the future. The initial split of Chamaesium was triggered by climate changes following the collision of the Indian plate with the Eurasia plate during the Eocene. Subsequently, divergences within Chamaesium may have been induced by the intense uplift of the QTP, the onset of the monsoon system, and Central Asian aridification. Long evolutionary history, sexual reproduction, and habitat fragmentation could contribute to the high level of genetic diversity of Chamaesium. The higher genetic differentiation among Chamaesium populations may be related to the drastic changes of the external environment in this region and limited seed/pollen dispersal capacity.
Introduction
The Himalayan-Hengduan Mountains (HHM) are key features of the biodiversity hotspots of South and East Asia (Myers et al., 2000; Zhang et al., 2002; Marchese, 2015), with alpine plant diversity being a significant contributor to the hotspot (Wu et al., 2011). The Himalayas define the southern margin of the Qinghai-Tibetan Plateau (QTP), whereas the HHM of Southwest China forms the plateau’s southeastern frontier (Zhang et al., 2002). Previous studies have suggested that the HHM region was formed by the collision of the Indian plate with Eurasia and the consequent rise of the Himalayas and QTP (Dupont-Nivet et al., 2010; Zhang et al., 2012; Chatterjee et al., 2013). Despite many studies focusing on a younger age for collision (20–30 Mya or younger) (Zheng et al., 2000; Aitchison et al., 2007; Wan et al., 2007), the collision is widely accepted to have started ca. 55–50 Mya during the Eocene (Zhang et al., 2012; Chatterjee et al., 2013). During the uplift in the Miocene, the Himalayan basins Thakkhola, Gyirong, and Zhada reached a mean elevation of 4,000 or 6,000 m (Garzione et al., 2001; Rowley et al., 2001; Saylor et al., 2009). The QTP experienced further growth during the Late Miocene and the Pliocene (Li and Fang, 1999; Zheng et al., 2000; Mulch and Chamberlain, 2006), particularly at its eastern edge within the HHM. The paleobotanical and paleoclimatic data suggests that Hengduan Mts. reached peak elevation shortly before the Late Pliocene, and the orogeny of Hengduan Mts. occurred as a final propagation of the uplift after 10 Ma (Sun et al., 2011).
The uplift of the QTP caused a series of topographical and climatic changes, which possibly served as a major force in species diversification (Harmon et al., 2008; Qiu et al., 2011; Xu et al., 2015; Mosbrugger et al., 2018). For example, the rising QTP and adjacent mountainous areas formed barriers to atmospheric circulation in Asia during the Oligocene (Ruddiman and Kutzbach, 1991; Kutzbach et al., 1993; An et al., 2001), and consequently promoted the formation and development of the East Asian monsoon system (Sun and Wang, 2005; Huntington et al., 2006; Guo et al., 2008). In contrast, the progressive uplift of the Himalayas and the Tianshan, and the retreat of the Tethys Sea, in conjunction with global cooling may have contributed to the aridification of Central Asia since the Miocene (Tapponnier et al., 2001; Mulch and Chamberlain, 2006; Wu et al., 2007; Qiang et al., 2011). The creation of these distinct climatic zones had a significant influence on the distribution and evolution of plant taxa (Sun and Wang, 2005; Lowry et al., 2008; Zhang and Sun, 2011; Keller and Seehausen, 2012). Additionally, the Hengduan Mts. region has a unique mountainous topography and was impressive during the orogeny. This area is distinguished by north-south oriented high peaks separated by valley floors (Zhang et al., 2004; Cao et al., 2009; Sun et al., 2011; Song et al., 2016). Dramatic elevation variations ranging from ca. 1,000 m in some valleys to 7,556 m at the summit of Minya Konka can form “sky islands” (Lopez-Pujol et al., 2011; He and Jiang, 2014; Sklenar et al., 2014). These distinct habitat zones and ecosystems, such as the sky islands, also resulted in speciation and radiation (Shepard and Burbrink, 2008; Wang Y.J. et al., 2009; Xu et al., 2010; Qiu et al., 2011). Consequently, the climatic and orogenic changes caused by uplift have played a critical role in the origin, speciation and evolution of several plant taxa throughout the HHM and adjacent areas.
With such an intricate geological and ecological diversity, the HHM region is attractive for studying the drivers of species diversification and evolution. Previous phylogenetic and biogeographical studies have focused on species-level diversification resulting from the uplift of the QTP (Liu et al., 2006; Wang L.Y. et al., 2009). Phylogeographical analyses within species have demonstrated that the divergence and demography of populations have also been intensively affected by the rise of the QTP and the Quaternary climatic oscillations in this area (Yang et al., 2008, 2012; Wang et al., 2010; Li et al., 2011), with deep intraspecific divergences formed over a range of timescales (Wang L.Y. et al., 2009; Li et al., 2011). Among these studies, however, very few have focused specifically on an endemic genus of the HHM region (Cun and Wang, 2010; Opgenoorth et al., 2010). Therefore we aimed to determine species’ origins, diversification and origin of existing distribution patterns from phylogenetic, biogeographical and phylogeographical data of Chamaesium H. Wolff.
Chamaesium is the only genus of the Chamaesium clade in Apiaceae and is endemic to the HHM region, where it grows in alpine meadows, shrublands and forests above 3,000 m (Guo et al., 2018). It is characterized by having fruits with developed primary and secondary ribs and 1- pinnate leaf blade, which easily distinguishes it from other genera of Apiaceae. In addition, Chamaesium has unique morphological characteristics as it has fruits with twice as many ribs and vascular bundles as Apiaceae’s other genera. According to records of Chamaesium in the Flora of China and Guo et al. (2018), nine morphologically distinct species are accepted and the recent phylogenetic study (Zhou et al., 2009; Guo et al., 2018) indicated that this genus forms a distinct monophyletic clade, the Chamaesium clade. Chamaesium is thus an ideal taxon to investigate the evolution and diversification of alpine plants in the HHM region.
In this study, we reconstructed the phylogenetic tree of Chamaesium based on materials from 56 populations of nine species and used biogeographical and phylogeographical approaches to identify the mechanism of origin, divergence and population evolutionary history in the genus Chamaesium. Our aims were to: (1) reconstruct the phylogenetic relationships within the genus Chamaesium based on materials from 56 populations; (2) explore the origin and species diversification of Chamaesium throughout the HHM region and its adjacent areas (QTP); (3) explore the geological and climatic changes that influenced distribution shifts and genetic diversity of Chamaesium.
Materials and Methods
Sampling
We collected 525 individuals belonging to nine species of Chamaesium between 2015 and 2019. These individuals were from 56 populations at elevations above 3,000 m in Tibet (Xizang), Sichuan, Yunnan, Qinghai and Gansu provinces (Figure 1 and Supplementary Table 1). Sampling localities covered almost the entire distribution of the nine species. Six to 15 individuals were randomly sampled from each population with at least 20 m between the collected samples. Fresh leaves were collected and dried immediately with silica gel. Voucher specimens were deposited at Sichuan University Herbarium (SZ). Bupleurum boissieuanum, Bupleurum falcatum, and Sanicula chinensis were confirmed to have closely affinity with Chamaesium, so they were chosen as outgroups based on previous studies (Zhou et al., 2009; Guo et al., 2018).
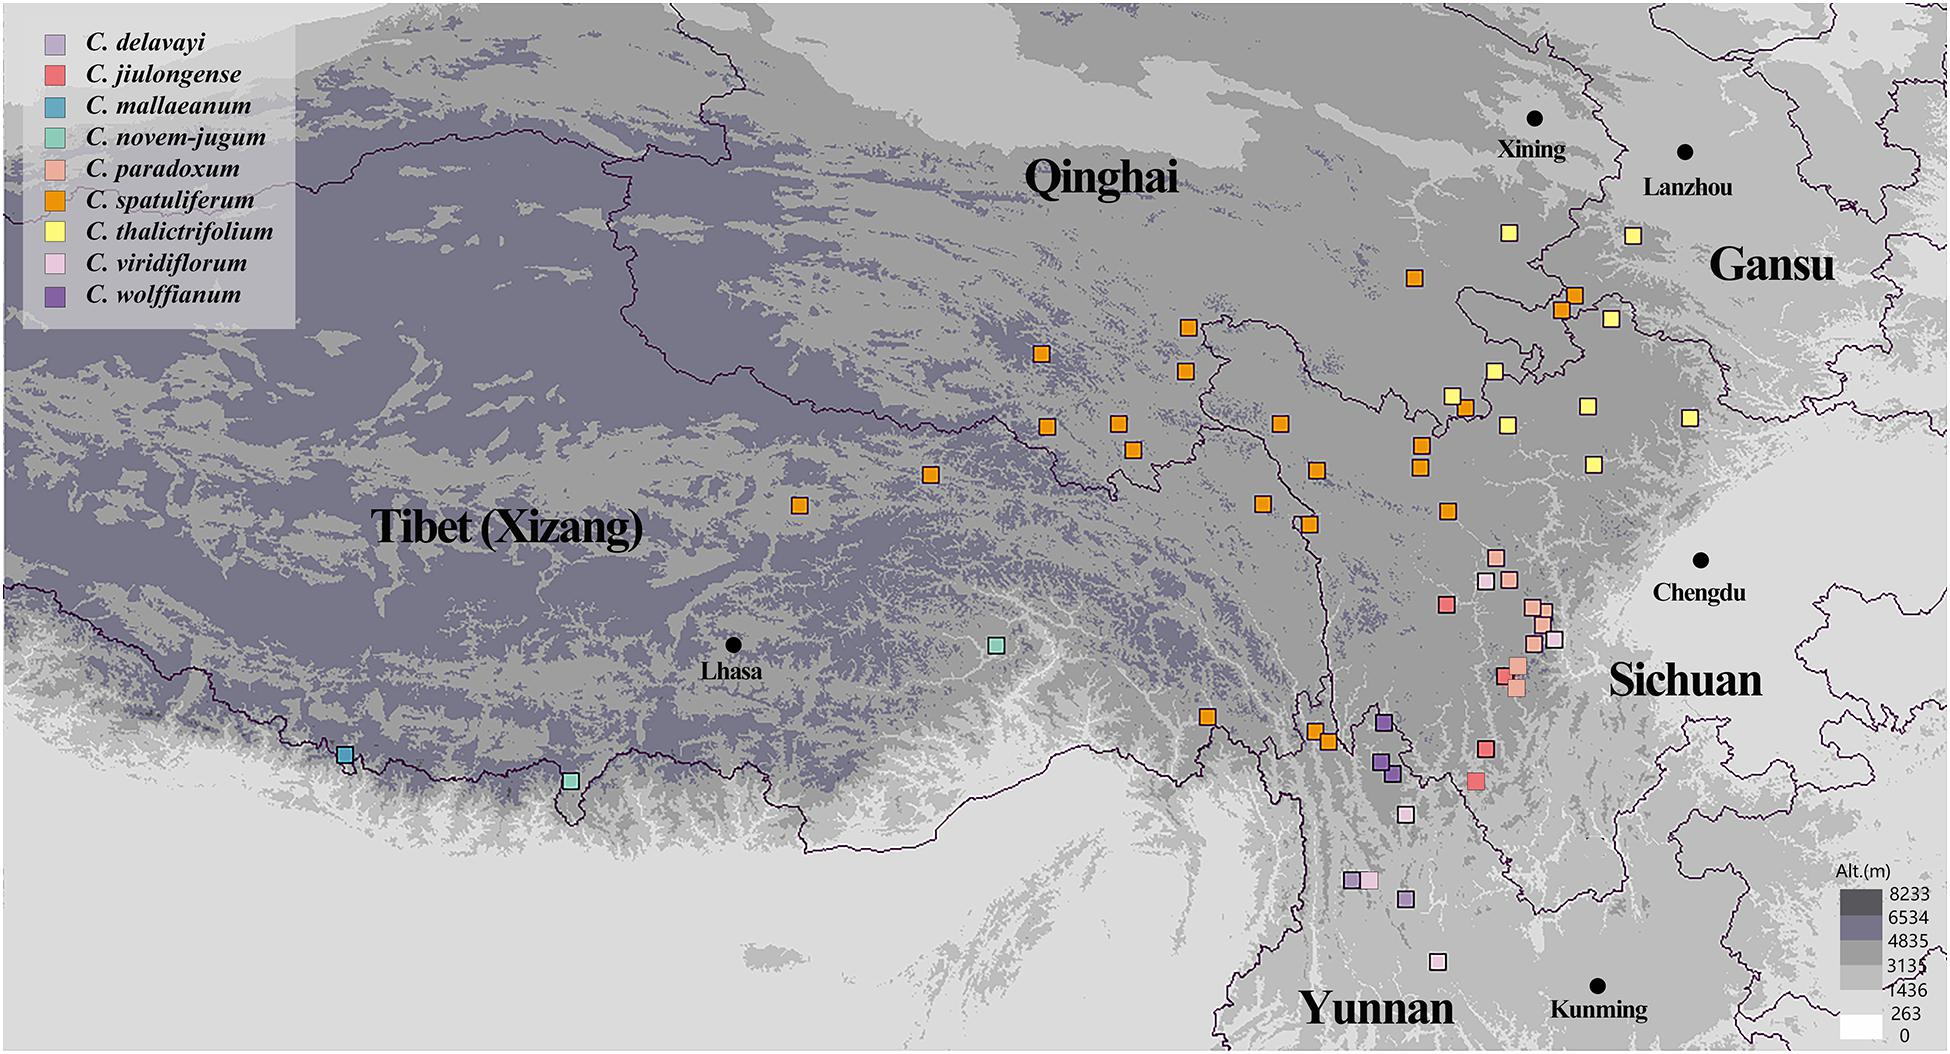
Figure 1. Sampling locations of Chamaesium.
DNA Extraction, PCR Amplification, and Sequencing
Total genomic DNA was extracted from dried leaf tissue using a modified cetyltrimethylammonium bromide (CTAB) protocol. We amplified and sequenced ITS (ITS1–5.8sRNA–ITS2) (White et al., 1990) and three chloroplast fragments (trnT-trnL, trnQ-rps16, rpl16) (Shaw et al., 2005, 2007; Danderson et al., 2017). Polymerase chain reactions (PCRs) were performed in a 30 μL volume with 3 μL plant total DNA, 1.5 μL forward primer, 1.5 μL reverse primer and 15 μL volume 2×Taq MasterMix (cwbio, Beijing, China). All sequences in this study were deposited in GenBank with accession numbers MT678849–MT678858, MT723793–MT723822, MT827288–MT827802, and MT850316–MT851860.
Phylogeny Reconstruction
All the DNA sequences were edited by SeqMan (DNAstar package; DNAStar Inc., Madison, WI, United States) to obtain consensus sequences. We used program MAFFT v.7.369b (Katoh and Standley, 2013) to align for subsequent manual adjustments. Haplotypes were identified and distinguished using DNAsp version 5.0 (Librado and Rozas, 2009). Gaps were treated as missing data during the tree searches. The phylogeny reconstruction based on haplotype was performed using Bayesian inference (BI) and maximum likelihood (ML). The BI and ML analyses were conducted with MrBayes version 3.2 (Ronquist et al., 2012) and IQ-TREE 1.2.12 (Nguyen et al., 2015). The best model for ITS and cpDNA were GTR + G (BI) or GTR + I + G (ML) inferred by ModelFinder (Kalyaanamoorthy et al., 2017) based on the Akaike information criterion (AIC), respectively. BI was performed using a Markov chain Monte Carlo (MCMC) method, as implemented in MrBayes, v.3.2.6 (Ronquist et al., 2012). We set the number of generations to 10 million, sampling every 1,000 generations, discarding 25% of the trees as burn-in in BI. All runs were inspected to check that the average standard deviation of split frequencies was <0.1 (Ronquist et al., 2012). Besides, we ran IQ-TREE on ITS and cpDNA with the ultrafast bootstrap feature, “-bb 10000” (Hoang et al., 2018), using the ‘‘-alrt 1000’’ option to assess branch supports. The convergence of MCMC inference was evaluated using Tracer v.1.7.11. Finally, ML bootstrap support (ML BS) and BI posterior probabilities (BI PP) were presented at the nodes.
Divergence Time Estimate
There are no Chamaesium fossil records, yet there are relatively consistent results of the crown age of Chamaesium based on cpDNA and ITS (Calvino et al., 2016; Wen et al., 2020). Therefore, we conducted divergence time estimation using BEAST (Drummond and Rambaut, 2007) based on calibration points from previous studies (Calvino et al., 2016; Yu et al., 2020). BEAUti was used to set criteria for analyses where we used a GTR + G substitution model selected by ModelFinder, an uncorrelated relaxed clock (Drummond et al., 2006) and a Yule process. For the ITS dataset, we applied normal priors with means of 49.78 (±3 st. dev.) and 44.88 (±5) for Chamaesium and Bupleurum crown ages, respectively. For the cpDNA dataset, the crown age of the Chamaesium was set to 51.4 Ma with a normally distributed standard deviation of 8. MCMC analyses were run for ten million generations with parameters sampled every 10,000 generations after discarding the first 20% of generations as burn-in. The convergence of the stationary distribution was accessed by ESS values (>200) using the Tracer v.1.7.1 (see text footnote 1). Maximum clade credibility (MCC) trees were produced with TreeAnnotator 1.8.4 in BEAST and were visualized in FigTree v1.4.42.
Ancestral Area Reconstruction
Ancestral area reconstruction is crucial to understand the biogeographic history of plant taxa by inferring origin area, developing routes and dispersal/vicariance/extinction events. We implemented a reconstruction using RASP version 4.03 (Yu et al., 2020) based on Bayesian Binary Method (BBM) using the cpDNA and nrDNA datasets, respectively. We used four regions based on geographic distribution and floral composition throughout HHM and QTP regions (Wu et al., 2011) A: southern Himalayas, B: Tangut region, C: eastern Himalayas, D: Hengduan Mountains region. F81 + G rate model was applied in the BBM analysis and was run for 2 × 10⁷ generations using 1 cold chain and 9 hot Markov chains with temperature increments of 0.1.
Population Genetics, Phylogeographic Analyses, and Demographic History
Haplotype diversity (Hd) (Nei and Tajima, 1981) and nucleotide diversity (π) (Nei and Li, 1979) for each population were calculated using DNAsp v5.1 (Librado and Rozas, 2009) to verify the degrees and patterns of diversity. PERMUT (Pons and Petit, 1996) was used to access the total diversity (HT), within-population diversity (HS) and population differentiation indices (GST and NST) (Grivet and Petit, 2002). We also used a U-statistic to test the phylogeographic structure by comparing GST and NST, which can indicate the presence of phylogeographic structure. In addition, we performed analyses of molecular variance (AMOVA) with 1,000 permutations using ARLEQUIN version 3.5 (Excoffier and Lischer, 2010) to detect the genetic variation among species FSC, among populations within species FST, and within population FCT. Neutrality test (Fu’s Fs; Tajima’s D) (Tajima, 1989) and mismatch distribution analysis (MDA) (Schneider and Excoffier, 1999) were conducted to test whether there was potential population expansion in Chamaesium. The smoothness of observed mismatch distribution was detected by the sum of squared deviations (SSD) between observed and expected mismatch distributions and Harpending’s raggedness index (Hrag) (Harpending, 1994). Additionally, PopART 1.7 (Polzin and Daneshmand, 2003) was used to construct TCS networks among the haplotypes within Chamaesium.
Species Distribution Modeling
We used MAXENT 3.3.3K (Phillips et al., 2006) to predict the distribution of Chamaesium during four time periods: Last Interglacial (LIG), Last Glacial Maximum (LGM), and the present and future. A total of 208 distribution sites acquired from field investigations and online herbarium records (E, K, KUN, NAS, P, PE, SZ) were used in analyses. Nineteen bioclimatic environment variables (Hijmans et al., 2005) from four time periods (Last Interglacial, Last Glacial Maximum, present, future) were downloaded from the WorldClim dataset at 2.5 min resolution and employed in analyses. We used 19 bioclimatic variables involving altitude, temperature and precipitation (WorldClim) with significant effects within Chamaesium to detect changes in distribution between the four time periods. We also tested the area under the “Receiver Operating Characteristic (ROC) curve” (AUC) (Peterson et al., 2008; Elith and Leathwick, 2009) to observe the accuracy of each model prediction. Good model performance was assessed by AUC values above 0.7 (Fielding and Bell, 1997).
Results
Genetic Diversity and Structure
Three chloroplast fragments (trnT-trnL, trnQ-rps16, rpl16) and ITS were used to analyze 525 individuals from 56 populations of the nine Chamaesium species. The cpDNA and ITS haplotype frequencies of each population are listed in Supplementary Table 2, and the geographical distributions of haplotypes are shown in Figures 2, 3. The total length of the aligned sequences of cpDNA was 1,776 bp containing 201 polymorphic sites. We detected 52 chloroplast haplotypes (C1–C52), which were species-specific as none were shared by any two species (Figure 4A). 64.29% of the populations from each studied species were fixed for a single haplotype, and more than 32.14% of the populations have two haplotypes. In C. delavayi, only one haplotype (C1) was shared by two populations. A population with three haplotypes only occurred in C. spatuliferum (C20, C22, C26) and C. wolffianum (C50, C51, C52). Besides, the sequenced ITS’s total length was 635 bp, and 106 polymorphic sites were recovered with 47 haplotypes (N1–N47). Like cpDNA haplotypes, all ITS haplotypes were species-specific in Chamaesium (Figure 4B), and more than 53.57% of the populations from each studied species were fixed for a single haplotype and 26.78% of the populations had two haplotypes. A population with three or four haplotypes only occurred in C. spatuliferum. Simultaneously, all species form a monophyletic group in the haplotype network and the phylogenetic tree (Figure 5).
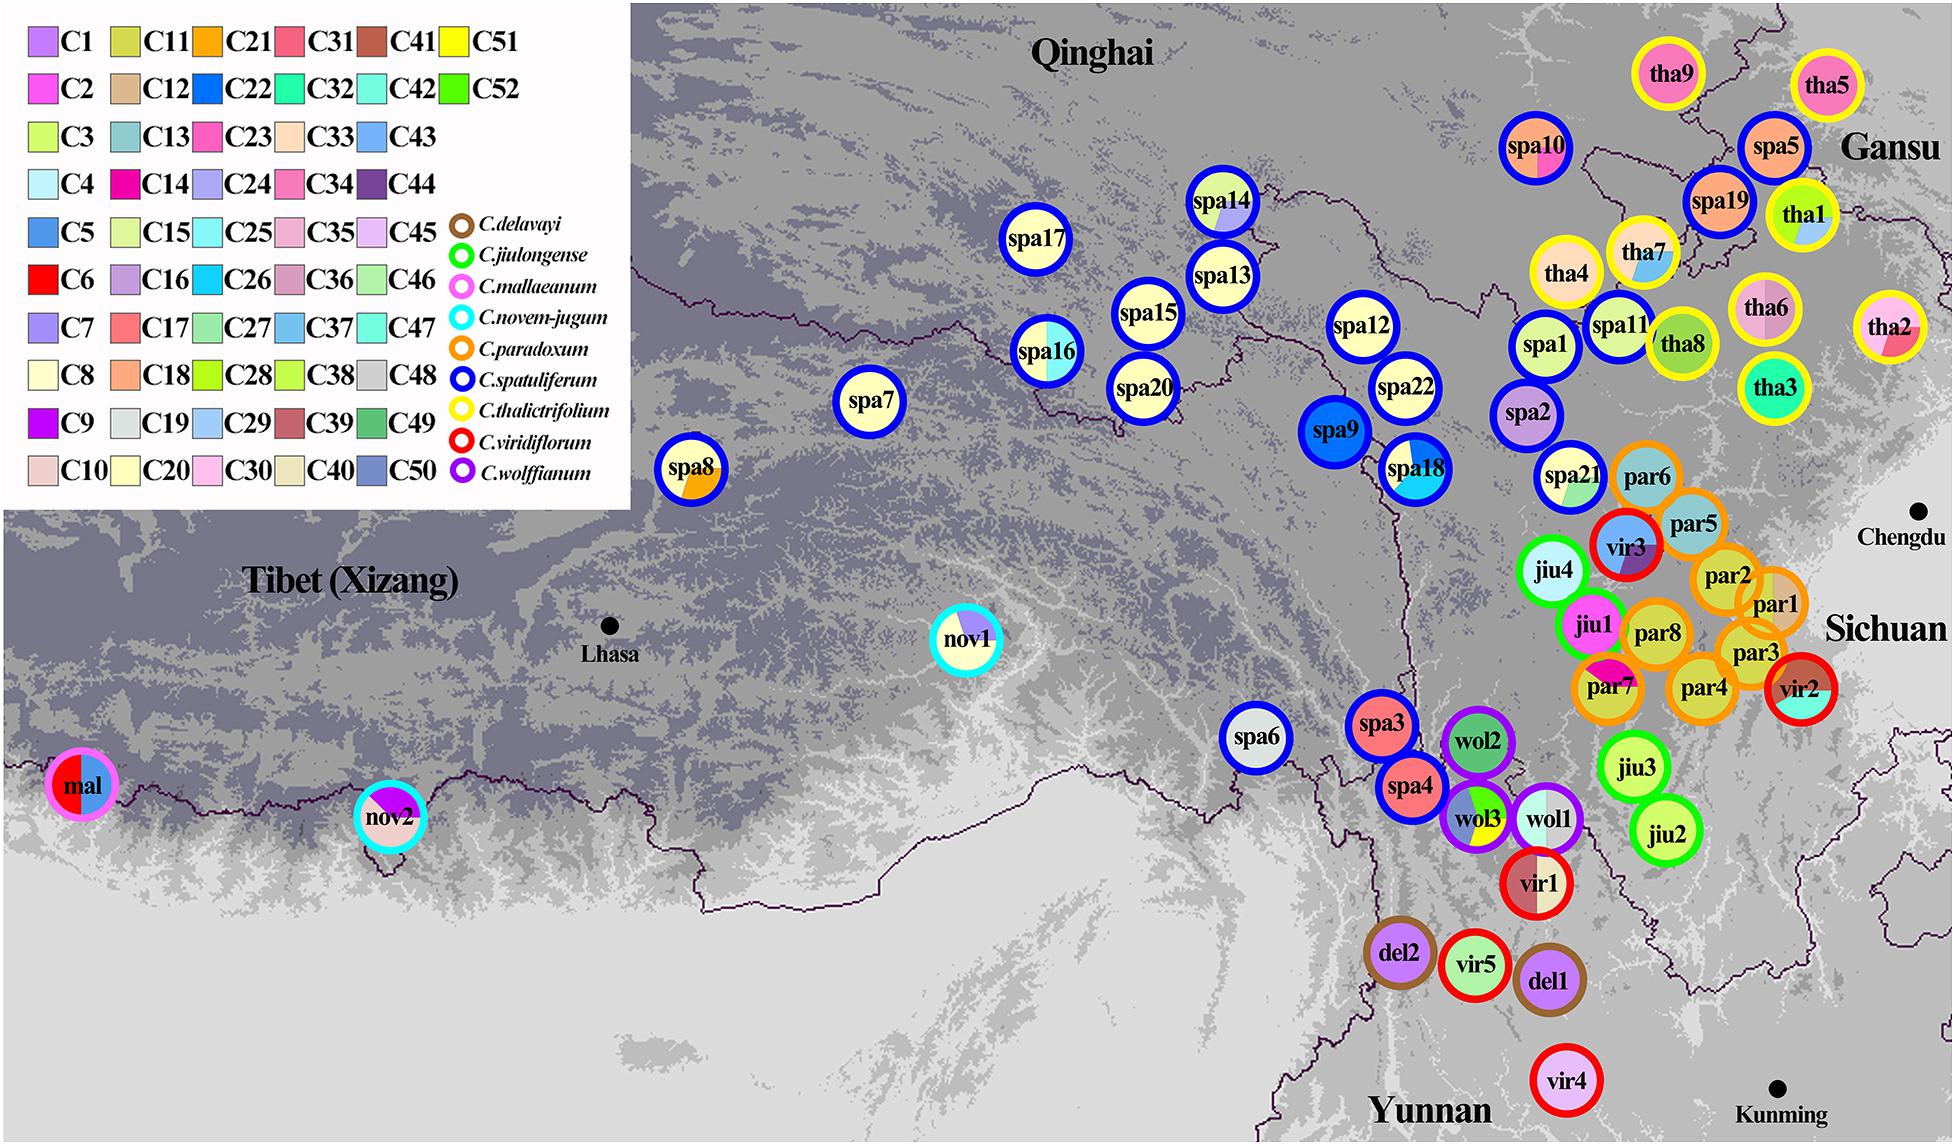
Figure 2. Geographic distribution of chloroplast haplotypes for Chamaesium. Each circle represents a population and the colored outlines of the circles distinguish the nine species. Each color represents a haplotype.
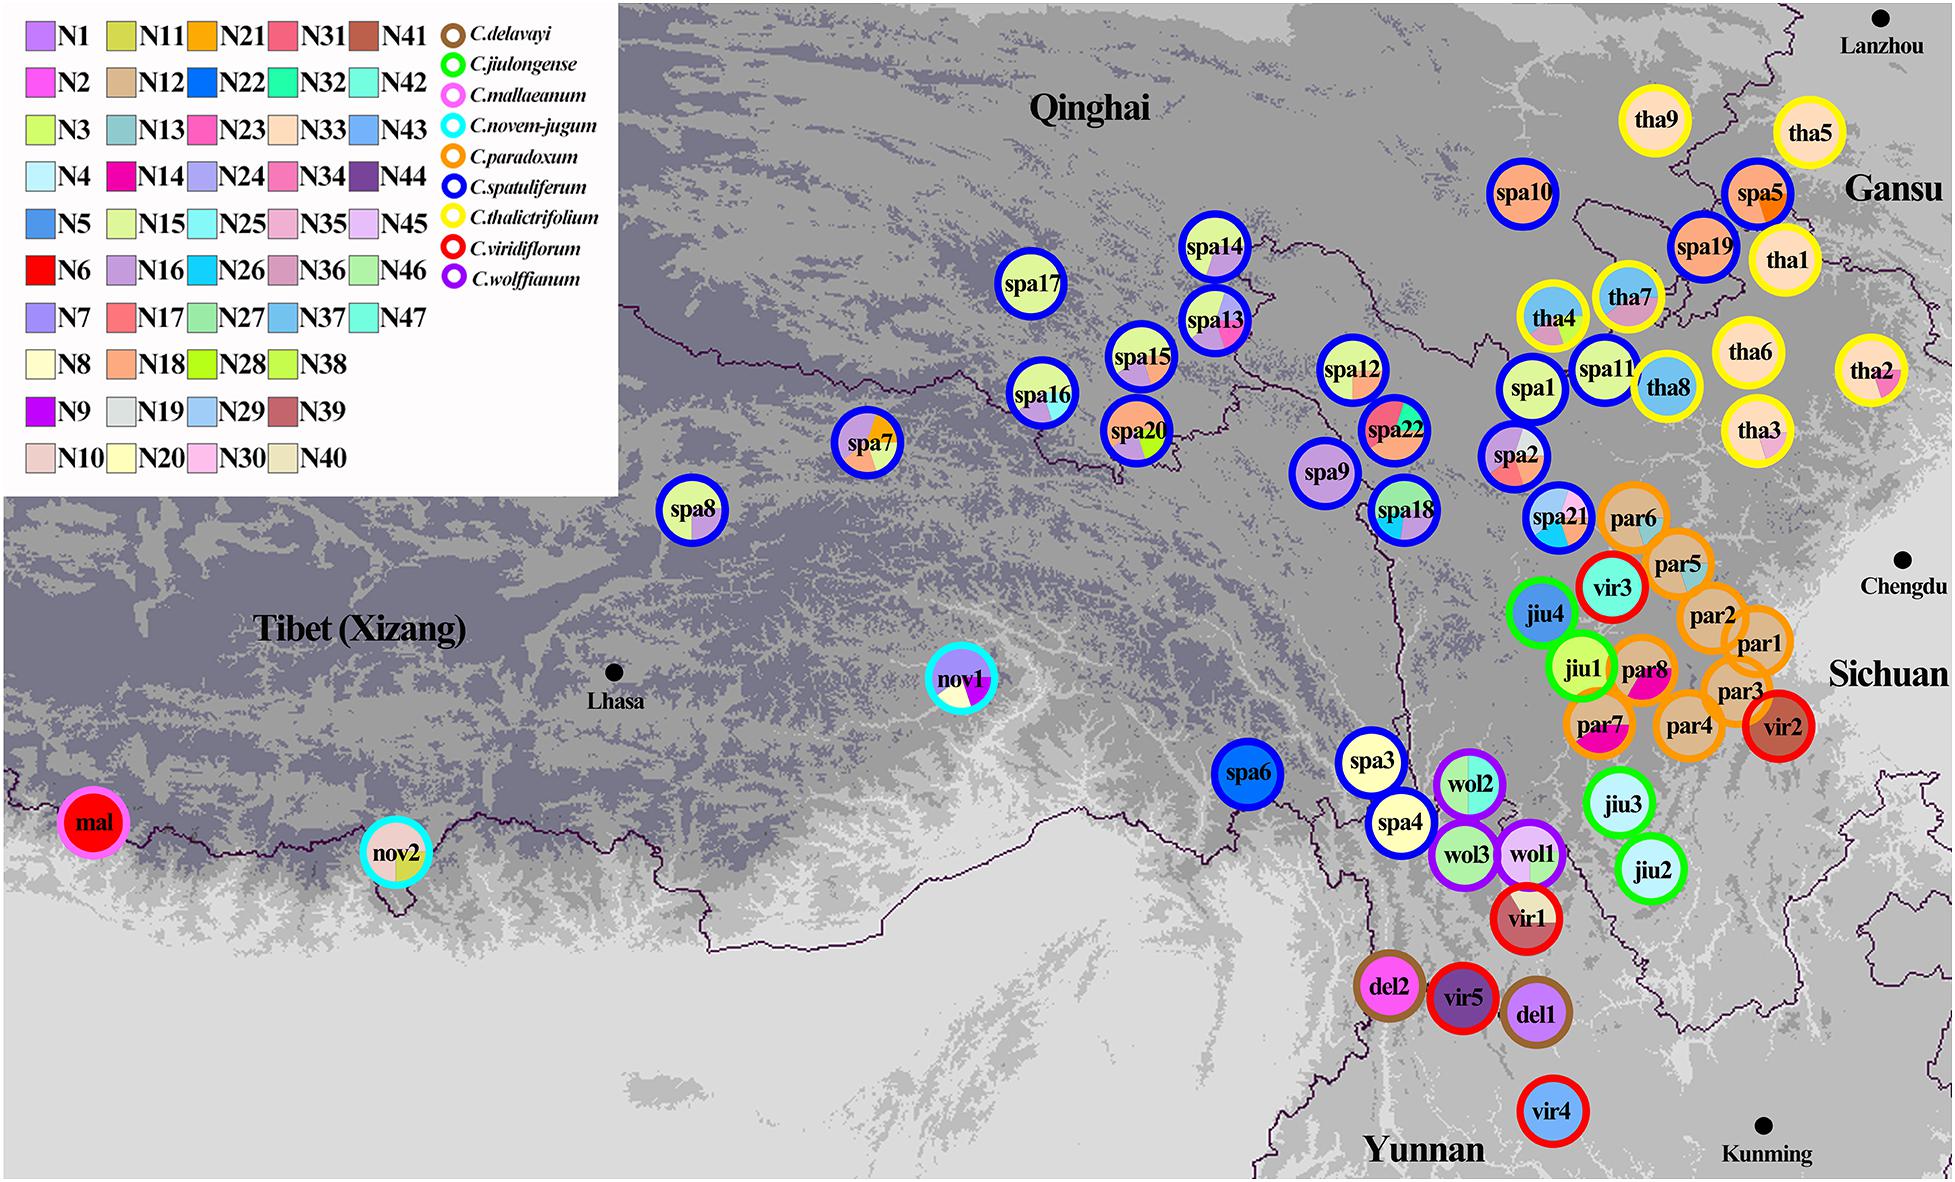
Figure 3. Geographic distribution of ITS haplotypes for Chamaesium. Each circle represents a population and the colored outlines of the circles distinguish the nine species. Each color represents a haplotype.
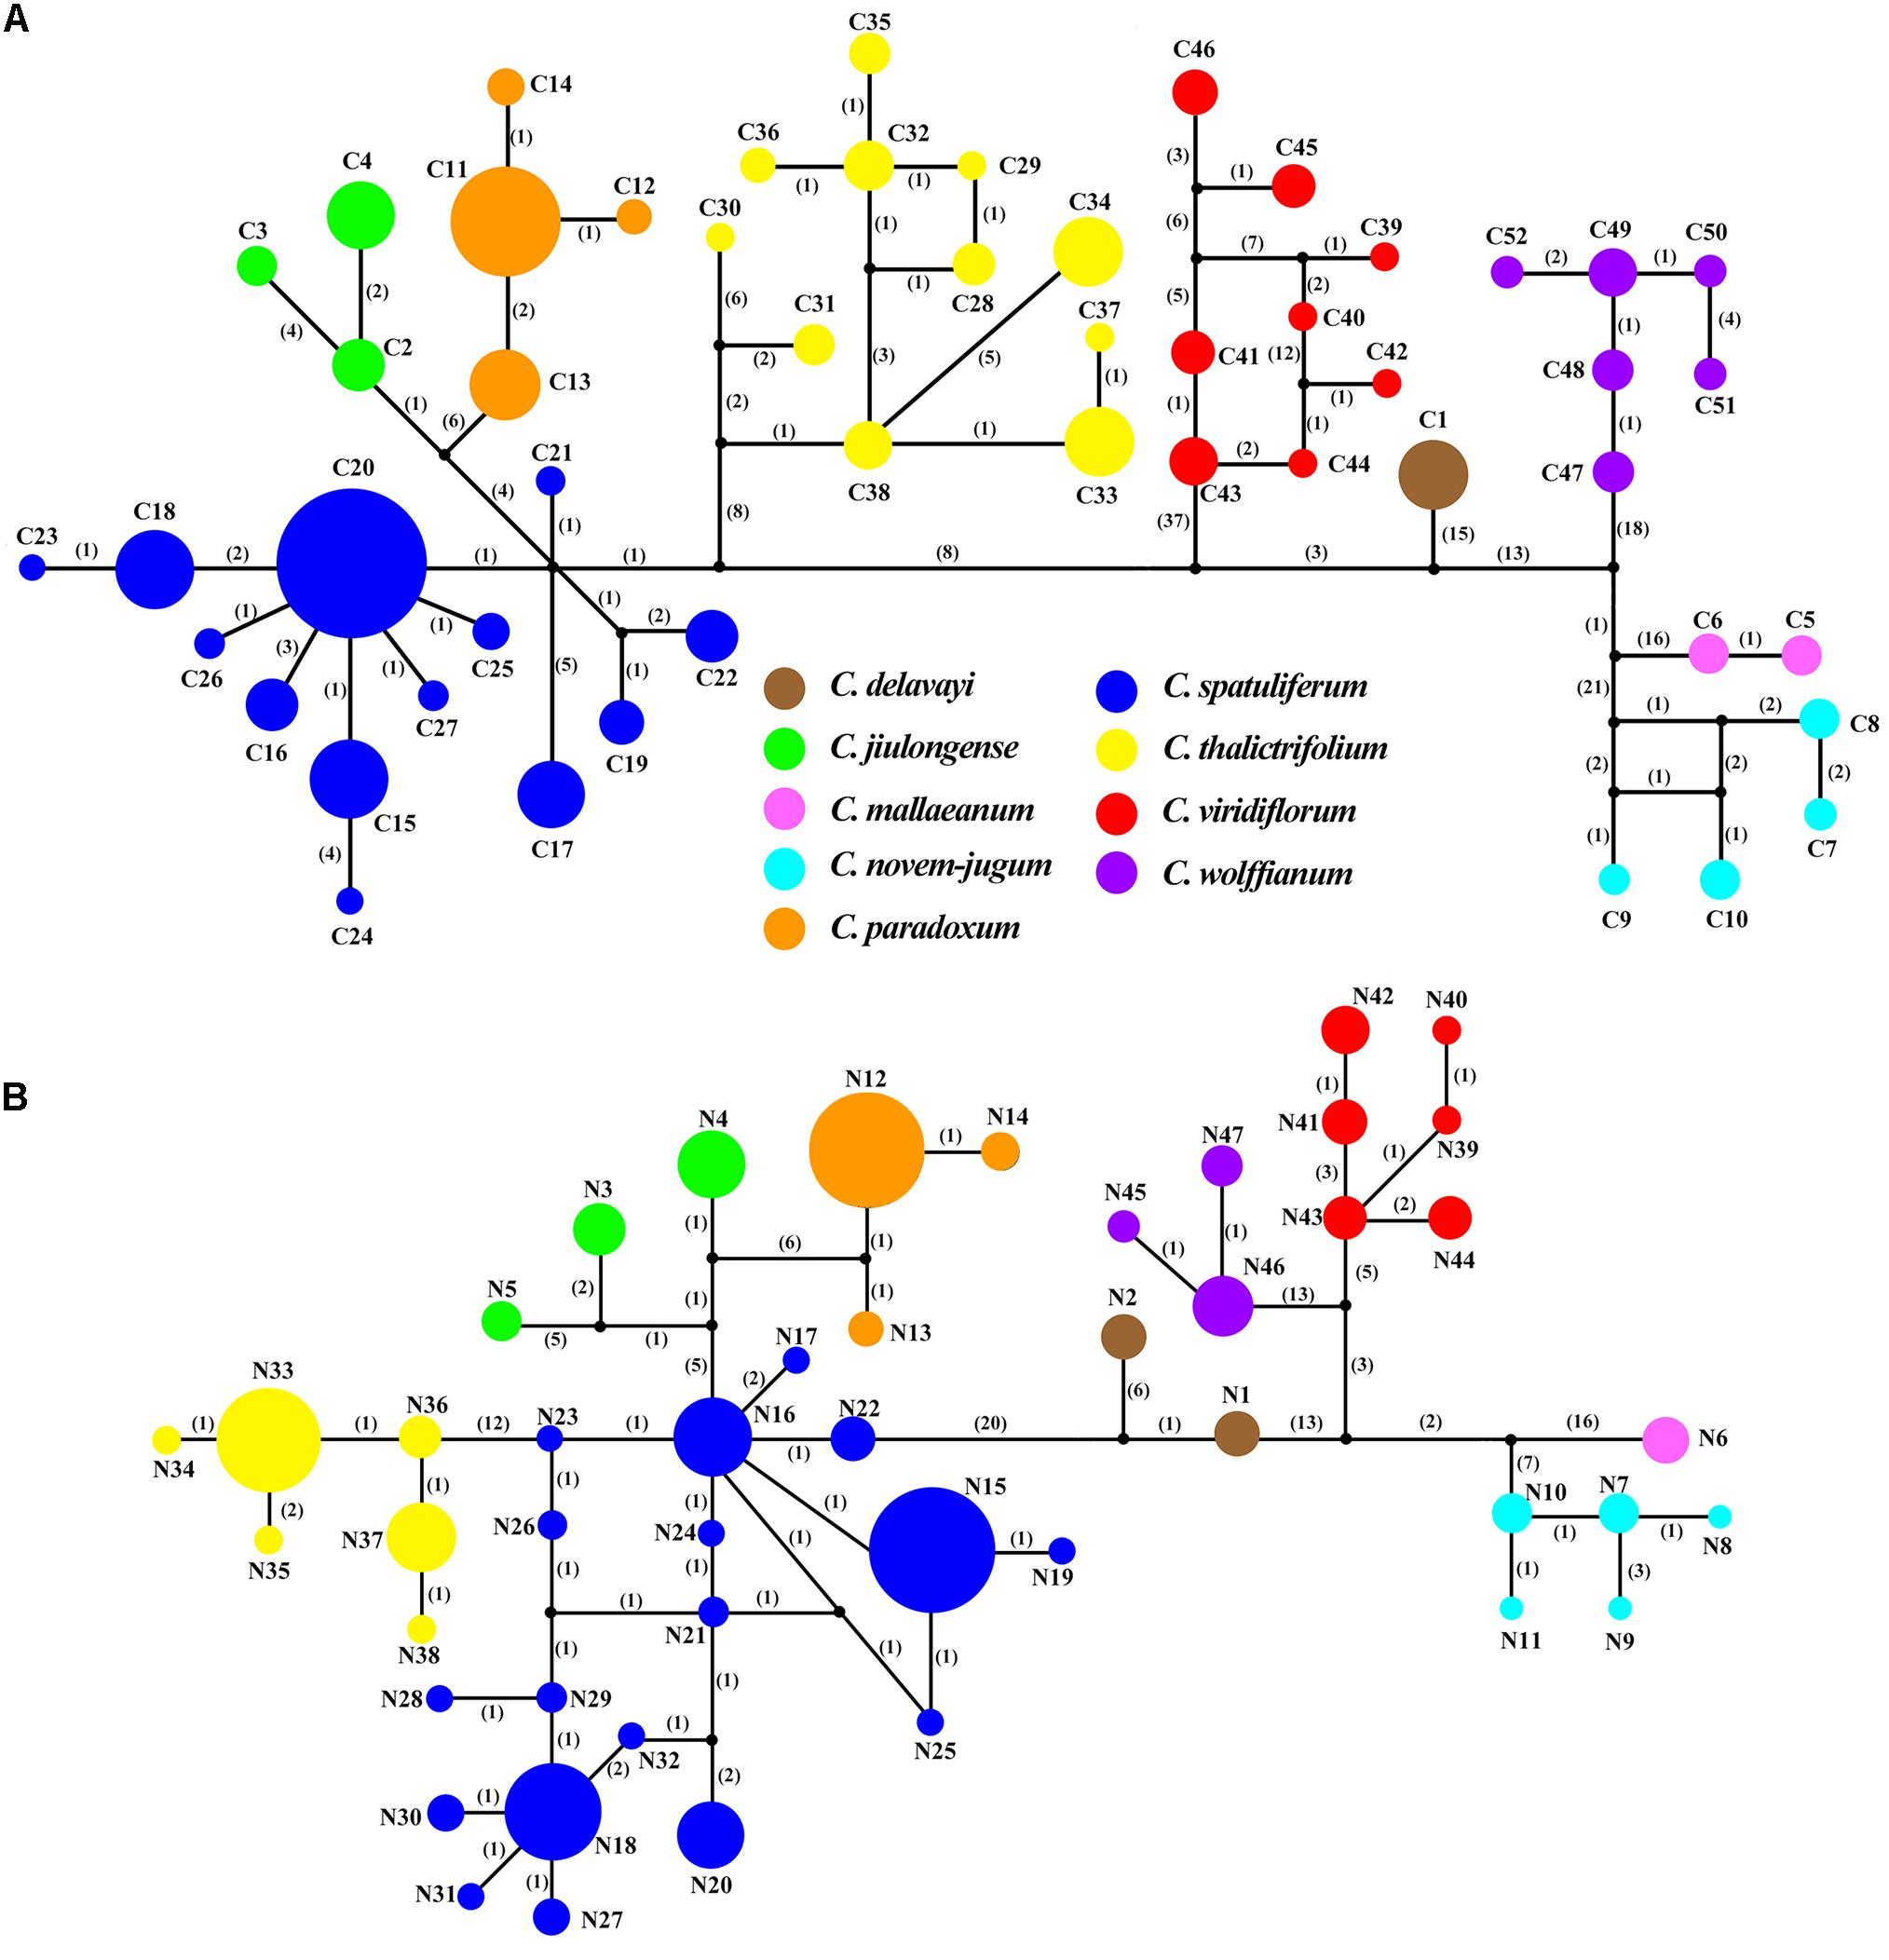
Figure 4. TCS networks for (A) 52 chloroplast haplotypes (B) 47 ITS haplotypes in Chamaesium. Each color represents a species. The size of circles in the network corresponds to the frequency of each haplotype. Numbers on the branches indicate the number of mutations between haplotypes. Small solid black circles denoted hypothetic unsampled or extinct ancestral haplotypes.
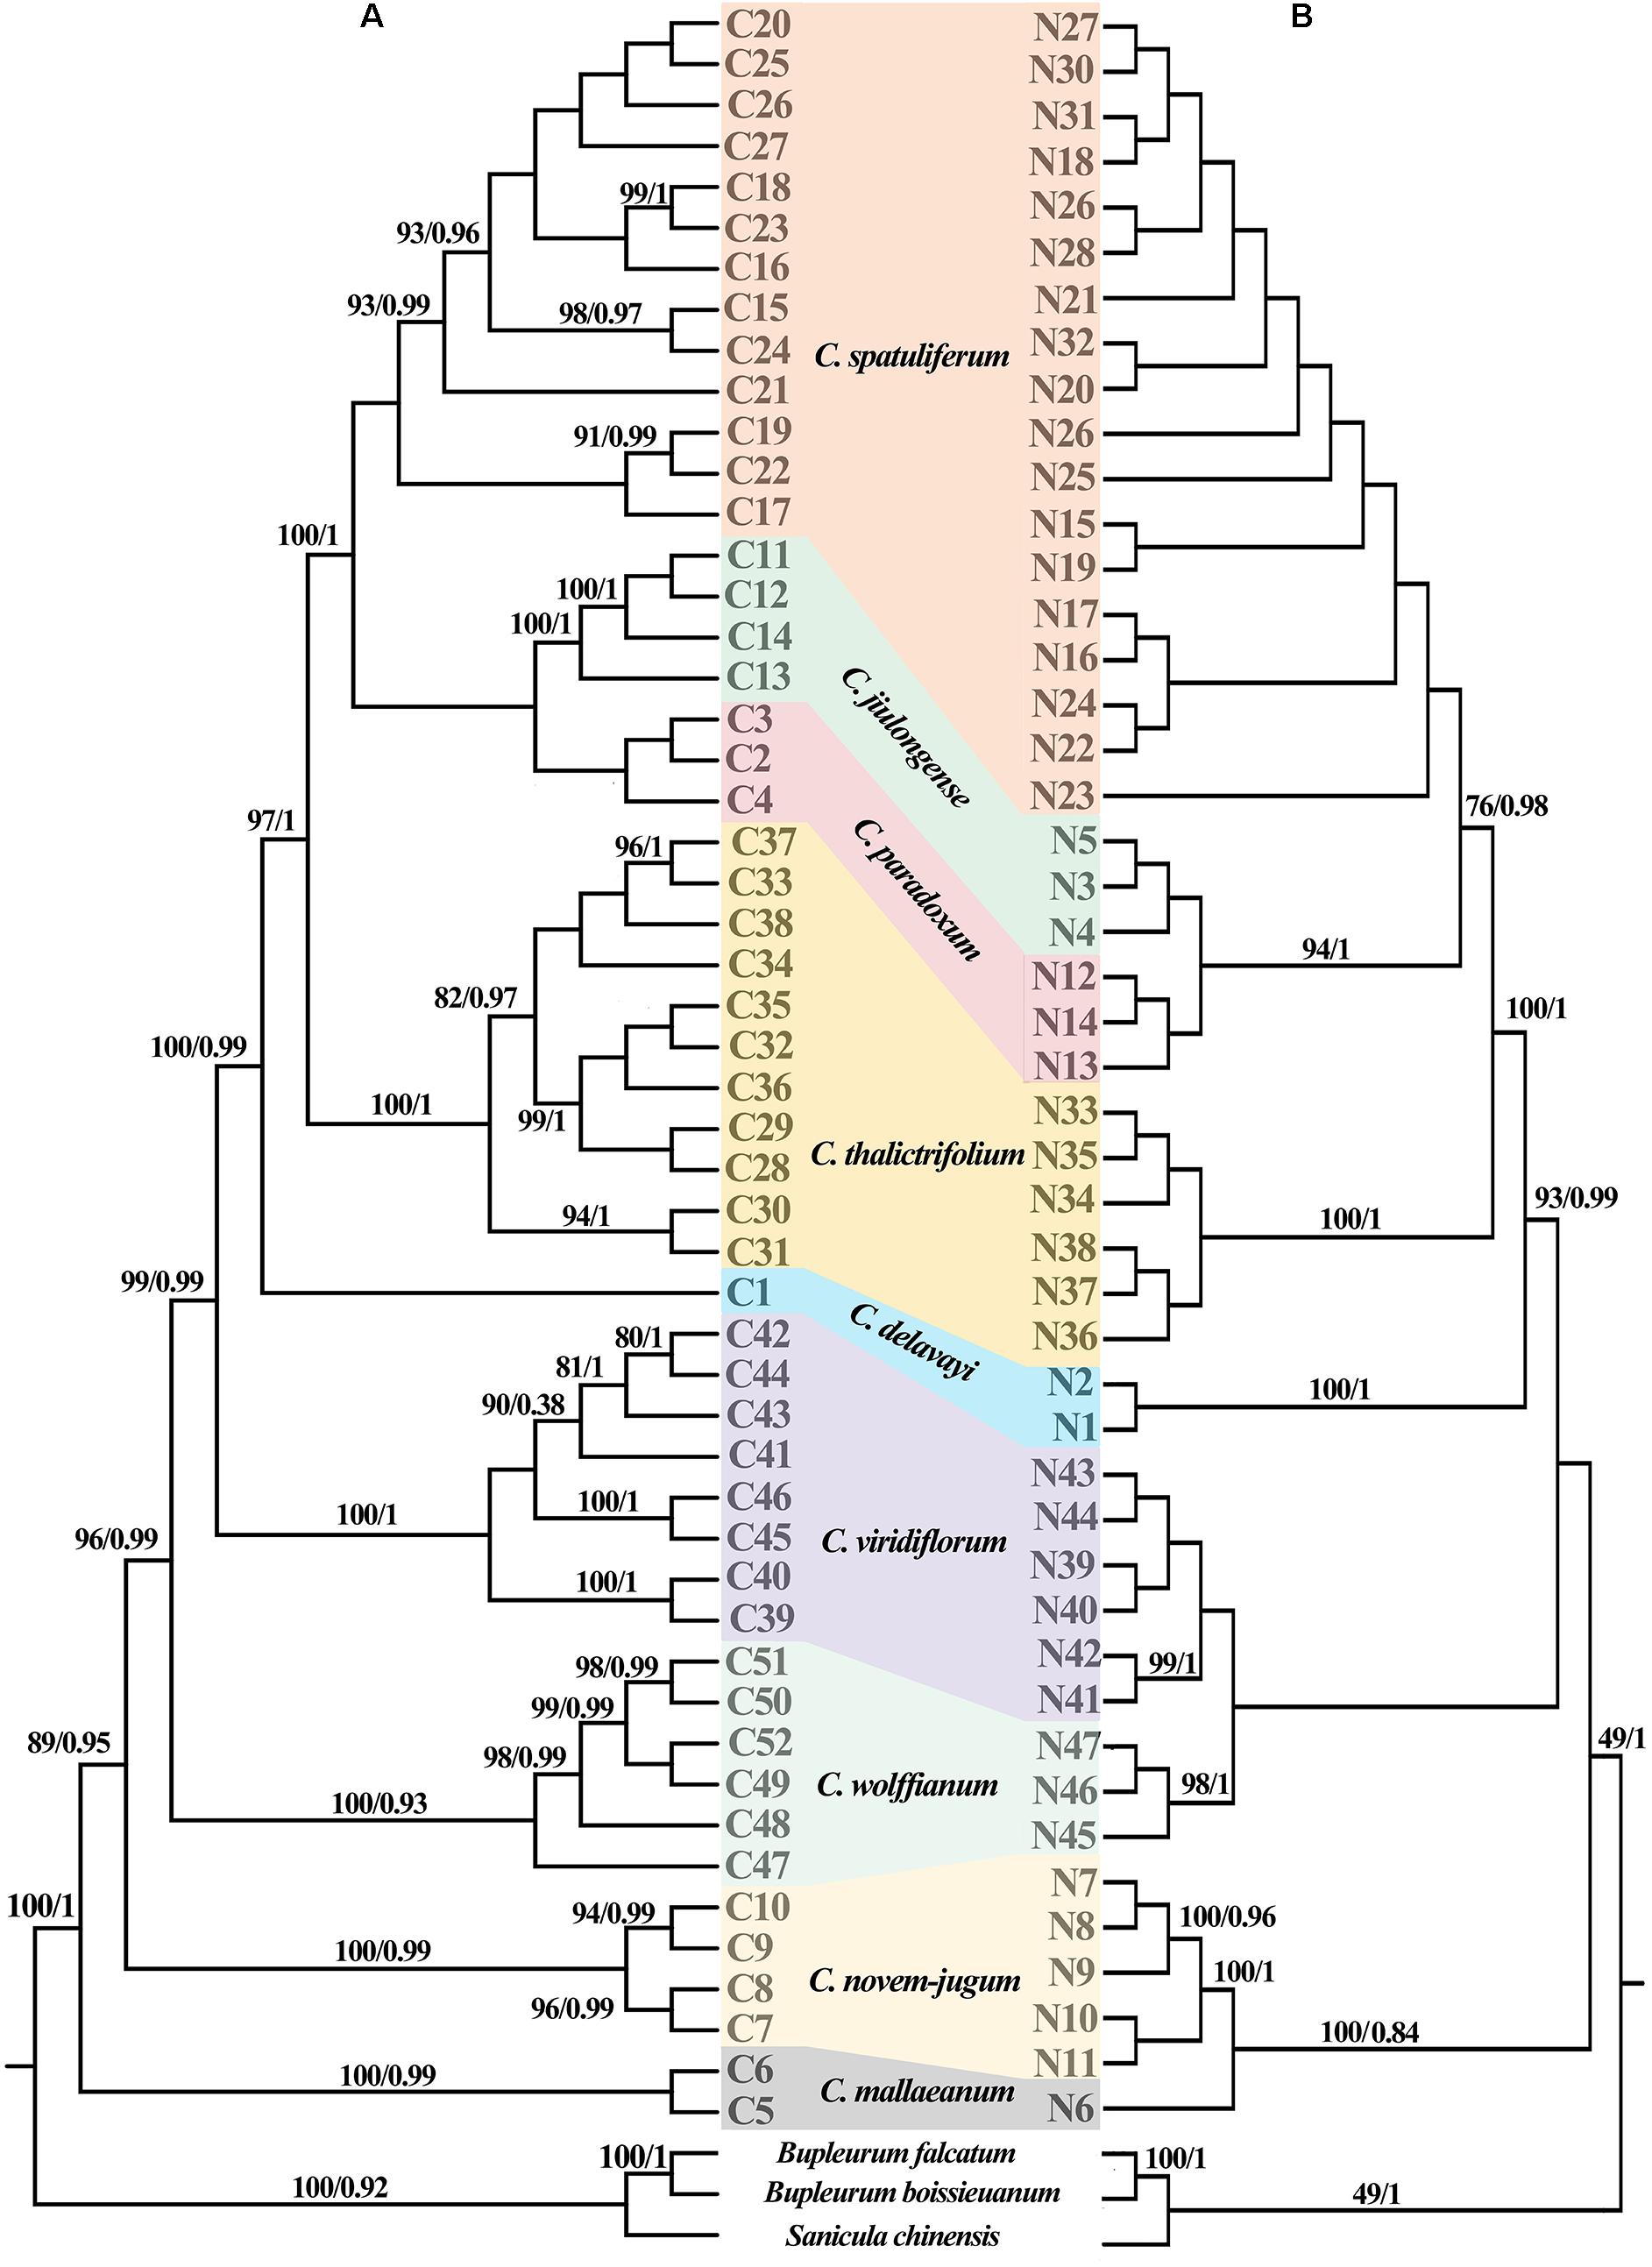
Figure 5. Phylogenetic relationship of Chamaesium recovered from the (A) chloroplast haplotypes and (B) ITS haplotypes. The maximum likelihood (ML) tree was only shown for the similar topologies with bayesian inference (BI) tree. Posterior probabilities (PP) and bootstrap values (BS) are shown above the branches, separated by backslash (/).
The haplotype diversity (Hd) of cpDNA ranged from 0.000 to 0.733, and nucleotide diversity (π) ranged from 0.000 to 0.002 across all species (Supplementary Table 2). Total gene diversity (HT) value was higher than average gene diversity within populations (HS) at the level of genus. Additionally, the number of substitution types (NST) was higher than interpopulation differentiation (GST), which indicated that a significant phylogeographic structure existed in Chamaesium (Table 1). The haplotype diversity (Hd) of ITS ranged from 0.000 to 0.800, and nucleotide diversity (π) ranged from 0.000 to 0.005 across all species (Supplementary Table 2). Like cpDNA haplotypes, the total gene diversity (HT) value was higher than the average gene diversity within populations (HS), whether at the level of species or genus. Total NST was significantly higher than GST, indicating significant phylogeographical structure in Chamaesium (Table 1).
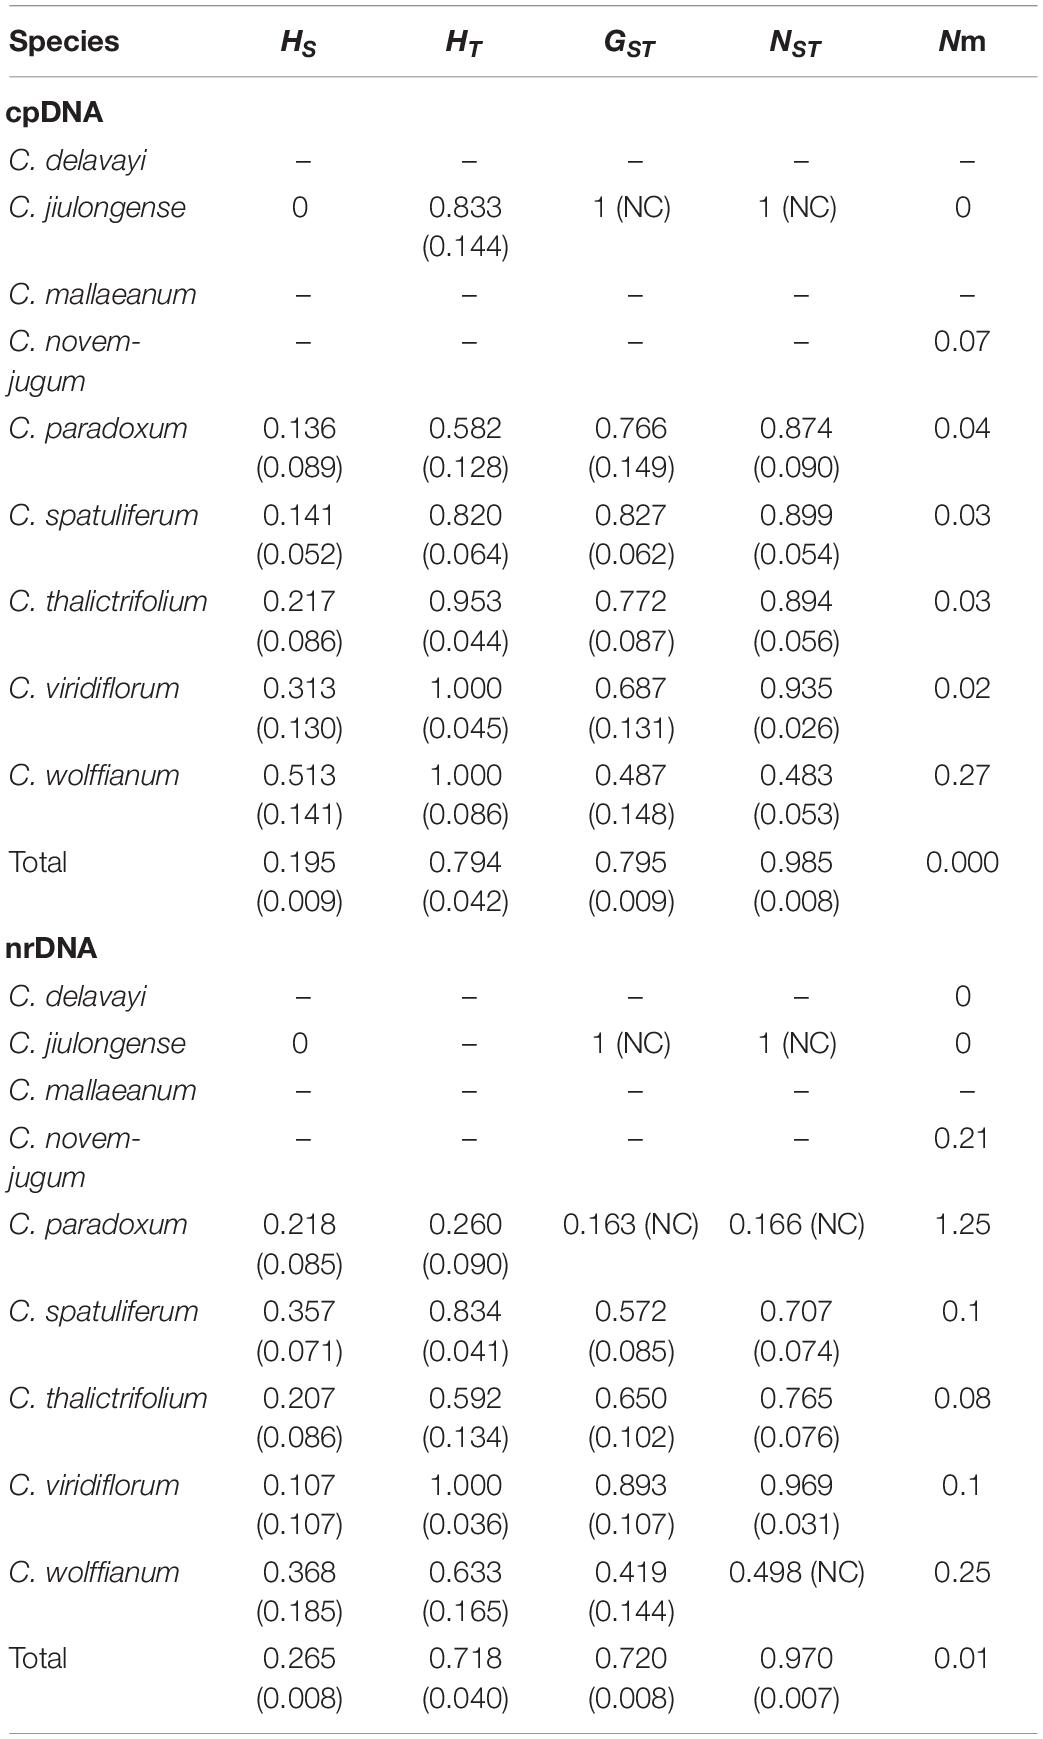
Table 1. Genetic diversity and genetic differentiation of nine species within Chamaesium based on cpDNA and ITS.
cpDNA AMOVA detected that the main genetic variation of most species (47.4–100%) occurred among populations (Table 2). In addition, the AMOVA of ITS data indicated that similar genetic differentiation patterns to those based on the cpDNA, that 16.5–100% of the overall variation was distributed among populations (Table 2).
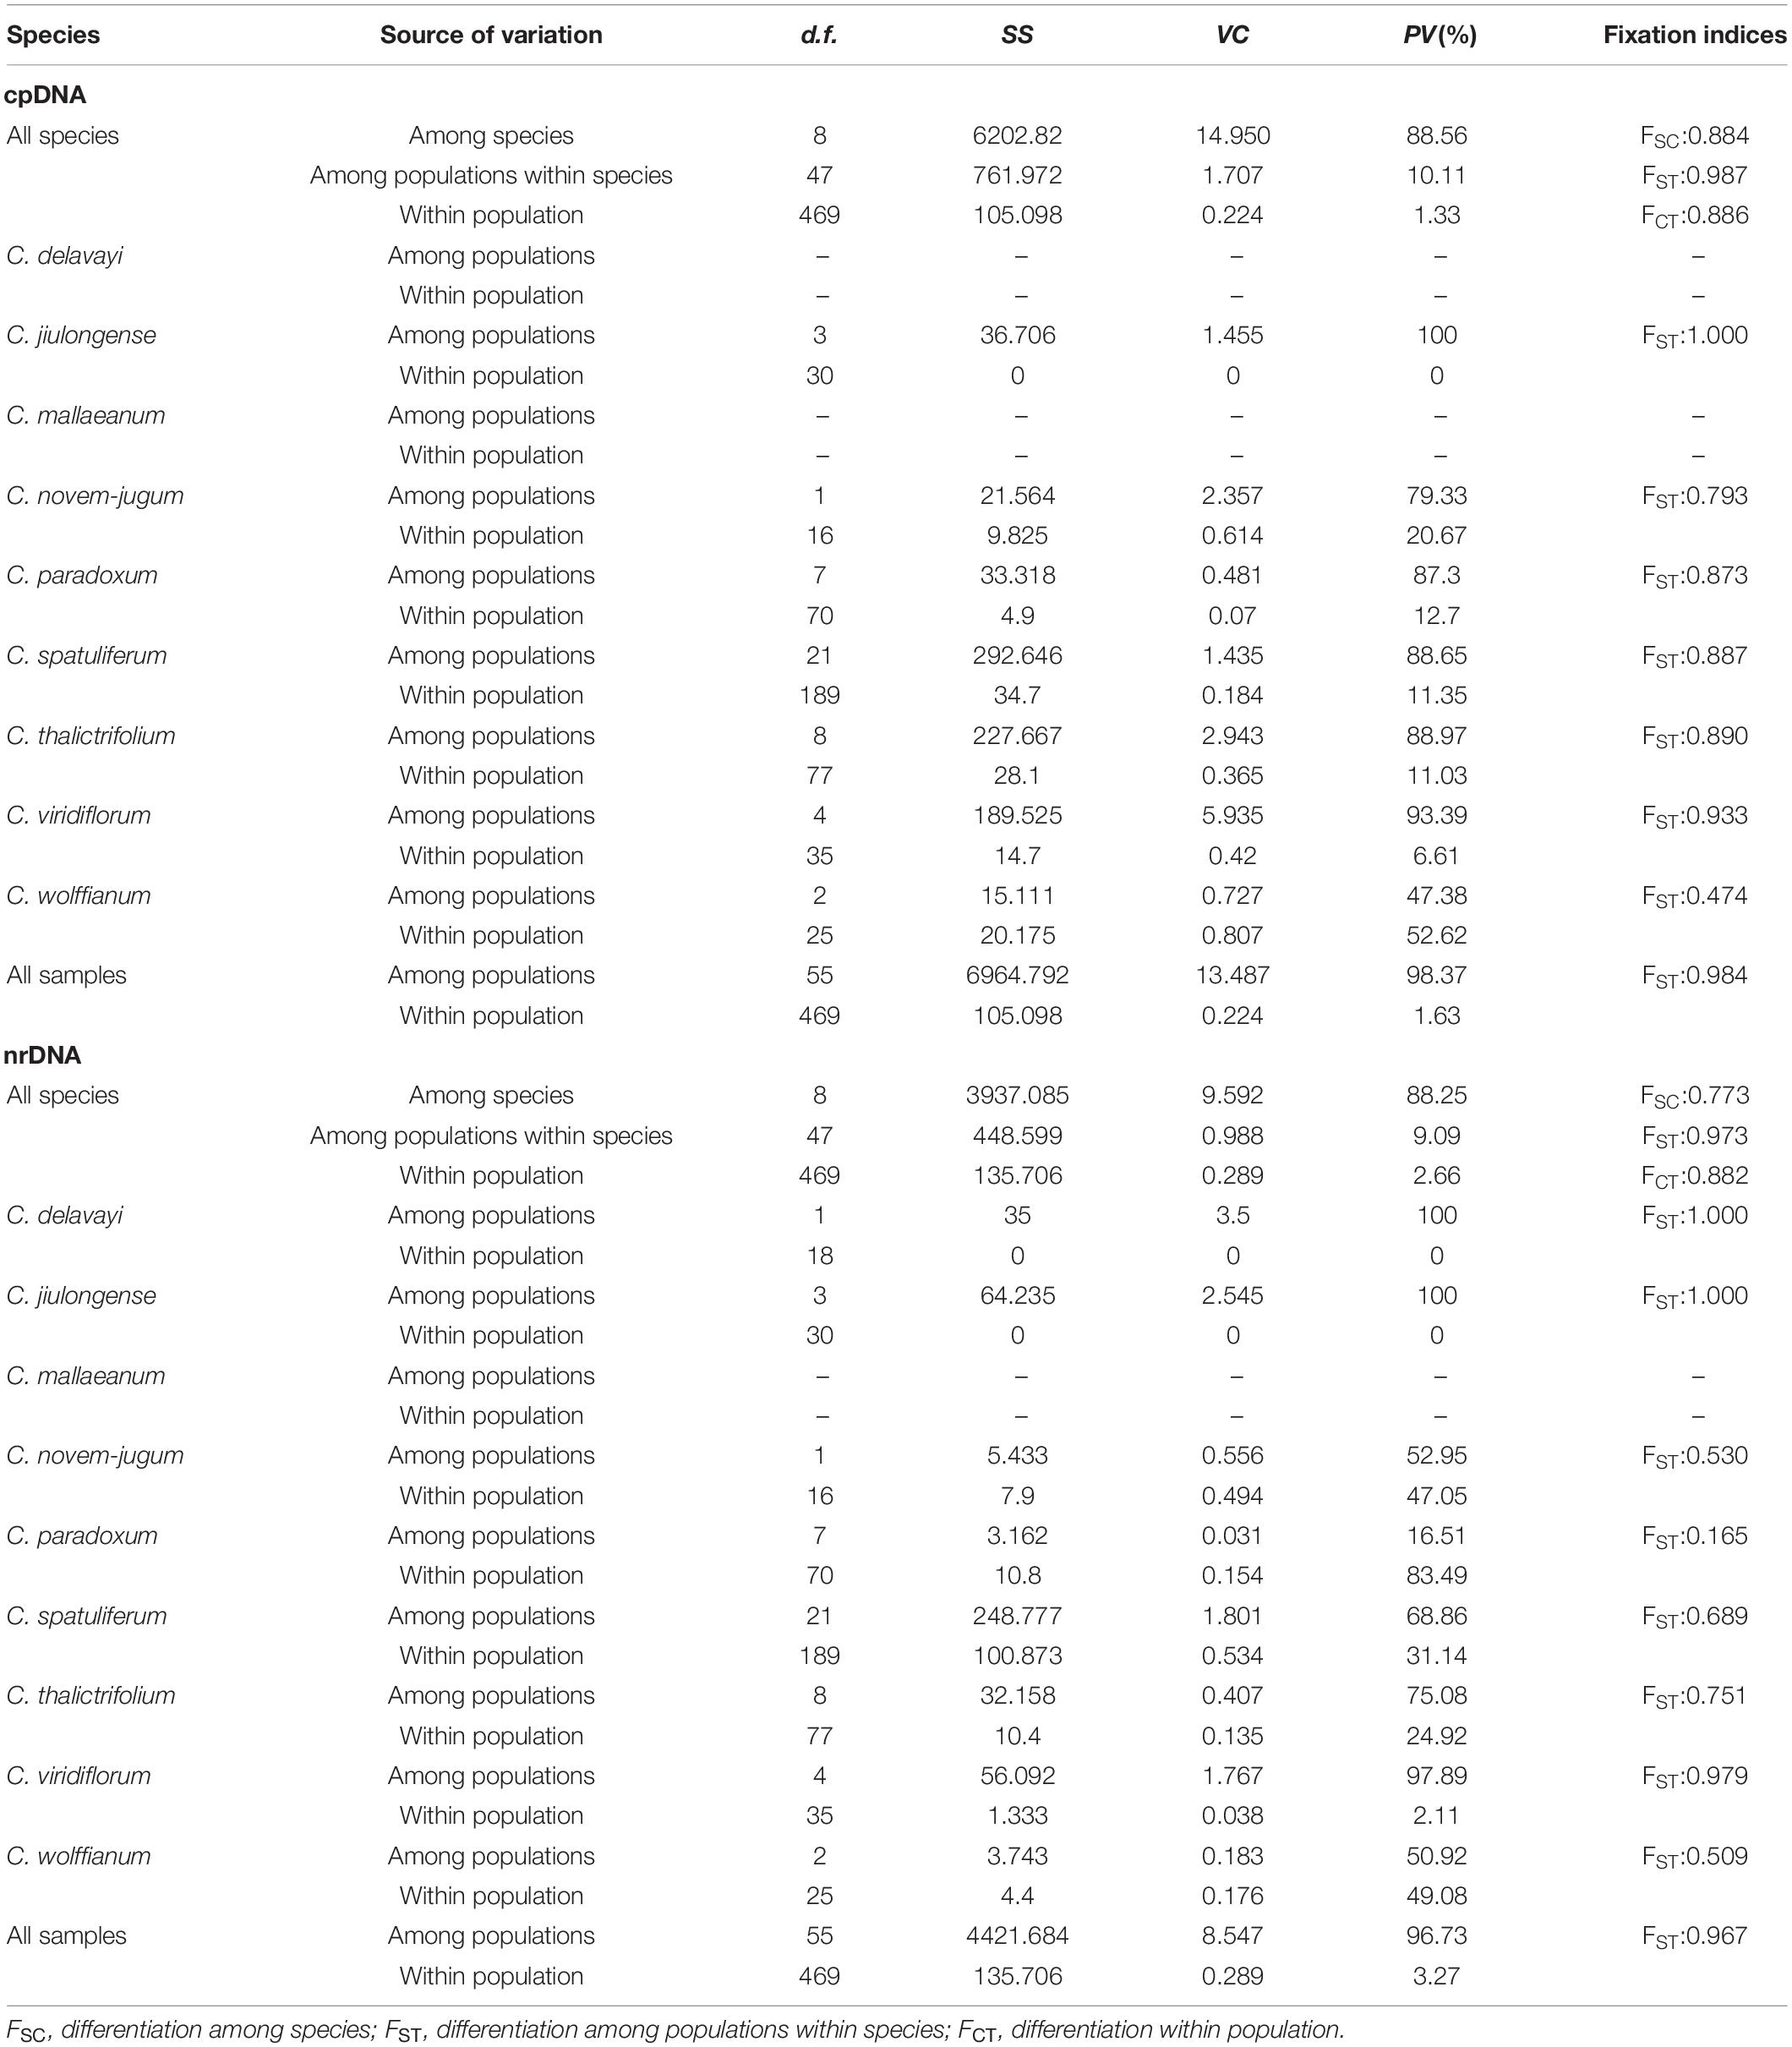
Table 2. Analysis of molecular variance (AMOVA) of nine species within Chamaesium based on cpDNA and ITS.
Phylogeny Reconstruction and Divergence Time Estimation
The ML and BI topologies of cpDNA and ITS haplotype phylogenetic trees were partly inconsistent (Figure 5). Inconsistencies between the cpDNA and ITS trees occurred regarding the phylogenetic relationships of Chamaesium mallaeanum, C. novem-jugum, C. wolffianum, and C. viridiflorum. Chamaesium mallaeanum had a close affinity to C. novem-jugum, and C. wolffianum was sister to C. viridiflorum in the ITS tree. However, these four species formed their own individual branch in the cpDNA tree. Overall, no haplotypes were shared between the nine Chamaesium species, and each species formed its own individual branch in the ITS and cpDNA trees.
According to the beast-derived age estimate based on cpDNA (Figure 6), the crown age of Chamaesium was dated to be 60.85 Ma (95% HPD: 35.69–101.38 Ma). The divergence times of C. mallaeanum and C. novem-jugum were estimated at 48.90 Ma (95%HPD: 32.30–64.53 Ma) and 42.04 Ma (95%HPD: 26.40–57.99 Ma). C. wolffianum, C. viridiflorum, and C. delavayi branched off around 36.78 Ma (95% HPD: 22.37–52.28 Ma), 30.75 Ma (95% HPD: 17.95–45.41 Ma) and 24.41 Ma (95% HPD: 12.67–36.69 Ma), respectively. The divergence of C. thalictrifolium, C. spatuliferum, and C. paradoxum occurred at 20.25 Ma (95% HPD: 10.42–31.54 Ma), 13.87 Ma (95% HPD: 6.82–23.00 Ma), and 8.37 Ma (95% HPD: 3.50–15.18 Ma), respectively. The divergence times estimated from ITS (Figure 7) indicated that the crown age of Chamaesium was dated to be 52.05 Ma (95% HPD: 46.51–57.61 Ma). The ancestor of C. mallaeanum and C. novem-jugum separated about 37.49 Ma (95% HPD: 25.42–49.22). The ancestor of C. wolffianum and C. viridiflorum separated around 32.79 Ma (95% HPD: 22.05–44.98). Furthermore, the divergence times of C. delavayi, C. thalictrifolium, C. spatuliferum, and C. paradoxum were estimated at 27.60 Ma (95% HPD: 16.96–39.50 Ma), 21.75 Ma (95% HPD: 12.69–31.96 Ma), 17.15 Ma (95% HPD: 9.33–26.00 Ma), and 11.90 Ma (95% HPD: 4.72–20.32 Ma), respectively. The results of divergence time based on cpDNA and ITS were similar. Since the molecular markers of chloroplast are closer to neutral and have matrilineal genetic stability, which is widely used in the process of divergence time estimation and biogeographic deduction, the results obtained cpDNA were selected for the subsequent elaboration of the differentiation history of Chamaesium.
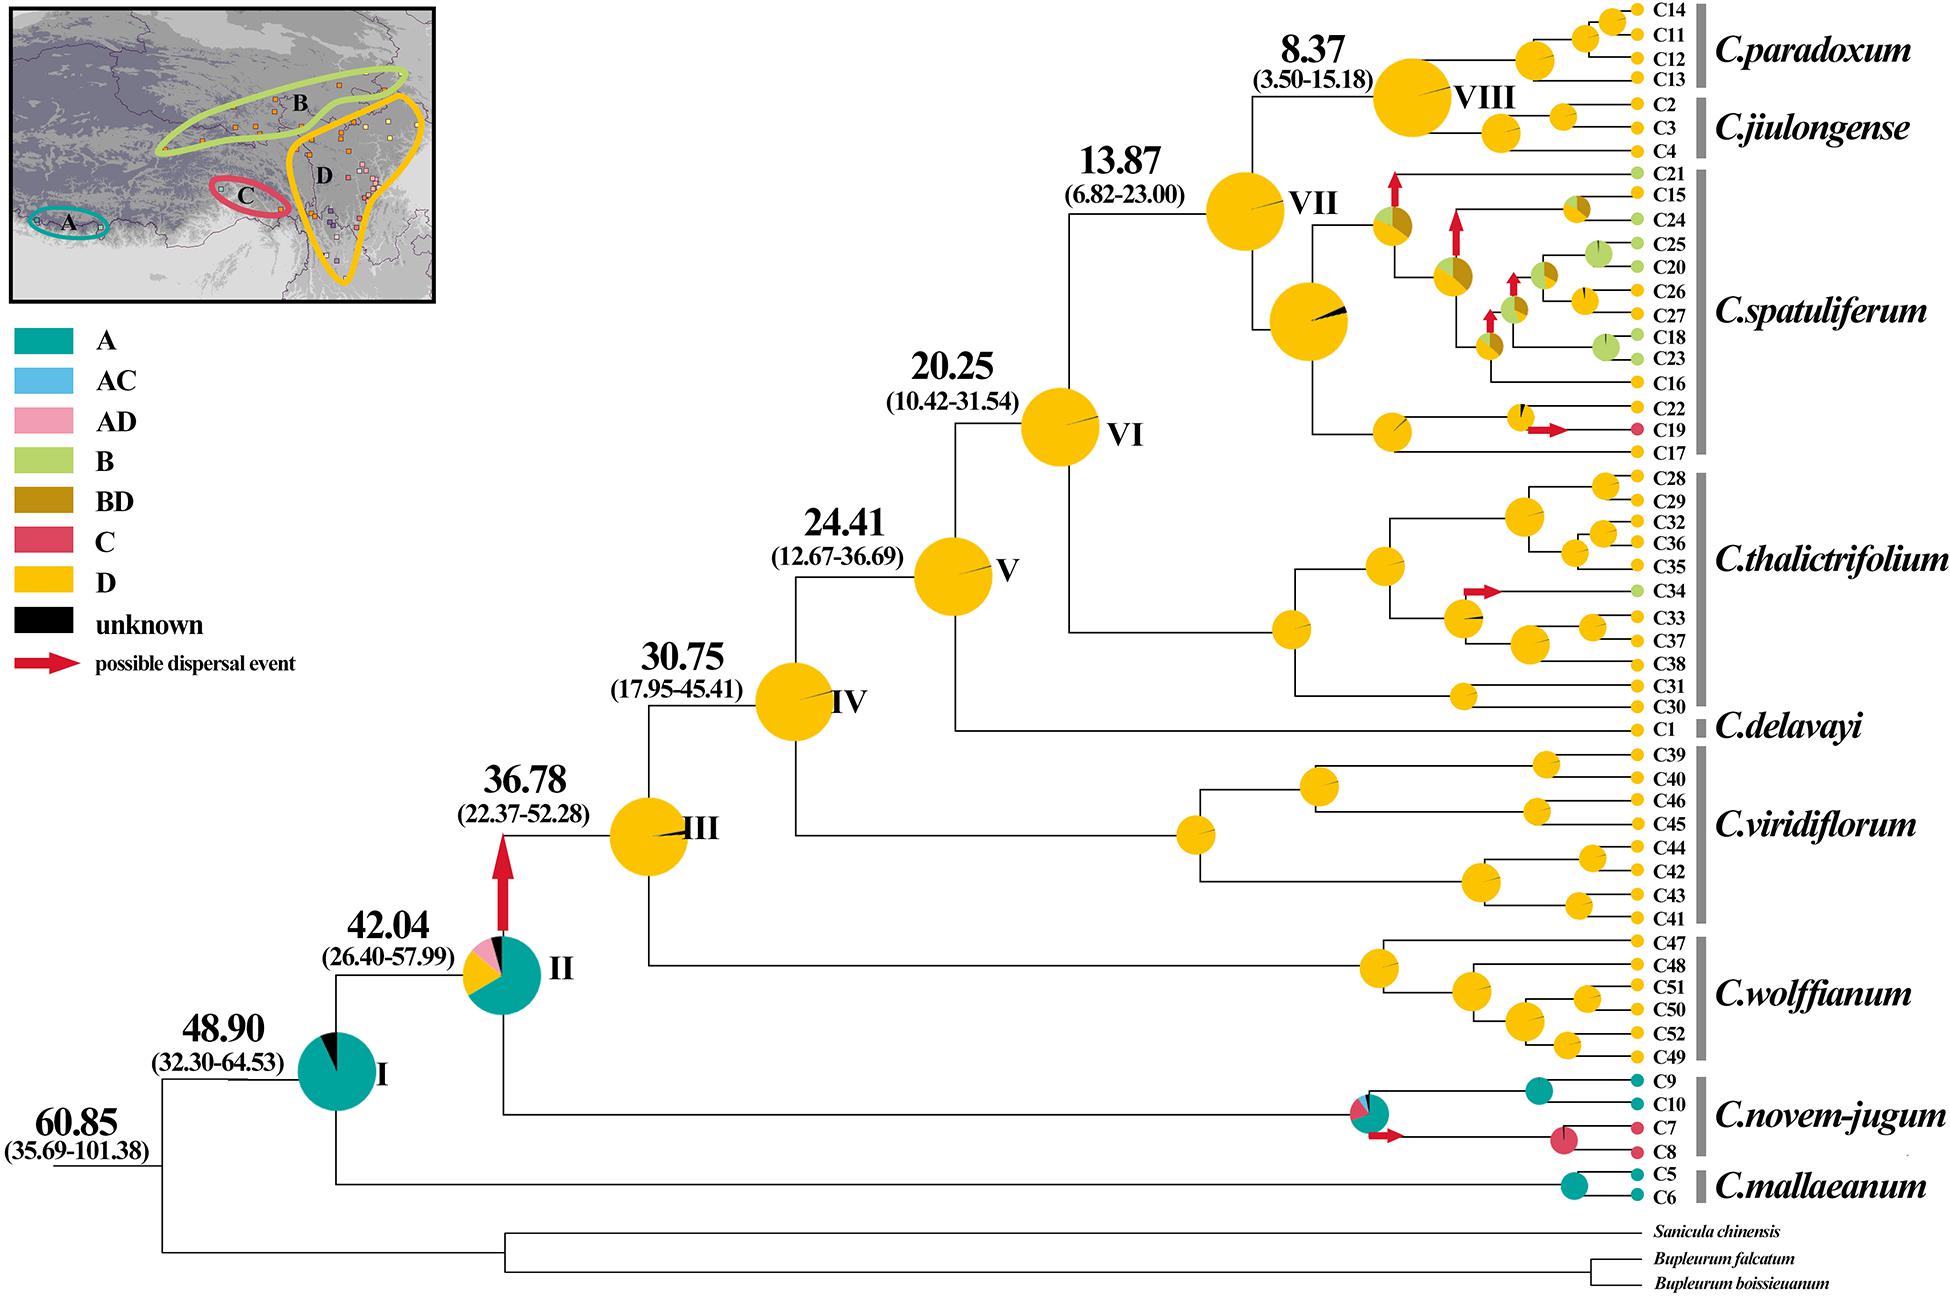
Figure 6. Ancestral area reconstructions based on cpDNA data set within Chamaesium. The map shows the four geographical distribution areas of Chamaesium: (A) southern Himalayas, (B) Tangut region, (C) eastern Himalayas, (D) Hengduan Mountains region. Pie charts show proportions of the ancestral ranges. The divergence time (in Ma) of the main nodes based on the cpDNA data set. Numbers in the brackets show the 95% HPD of divergence time (in Ma) of the main nodes.
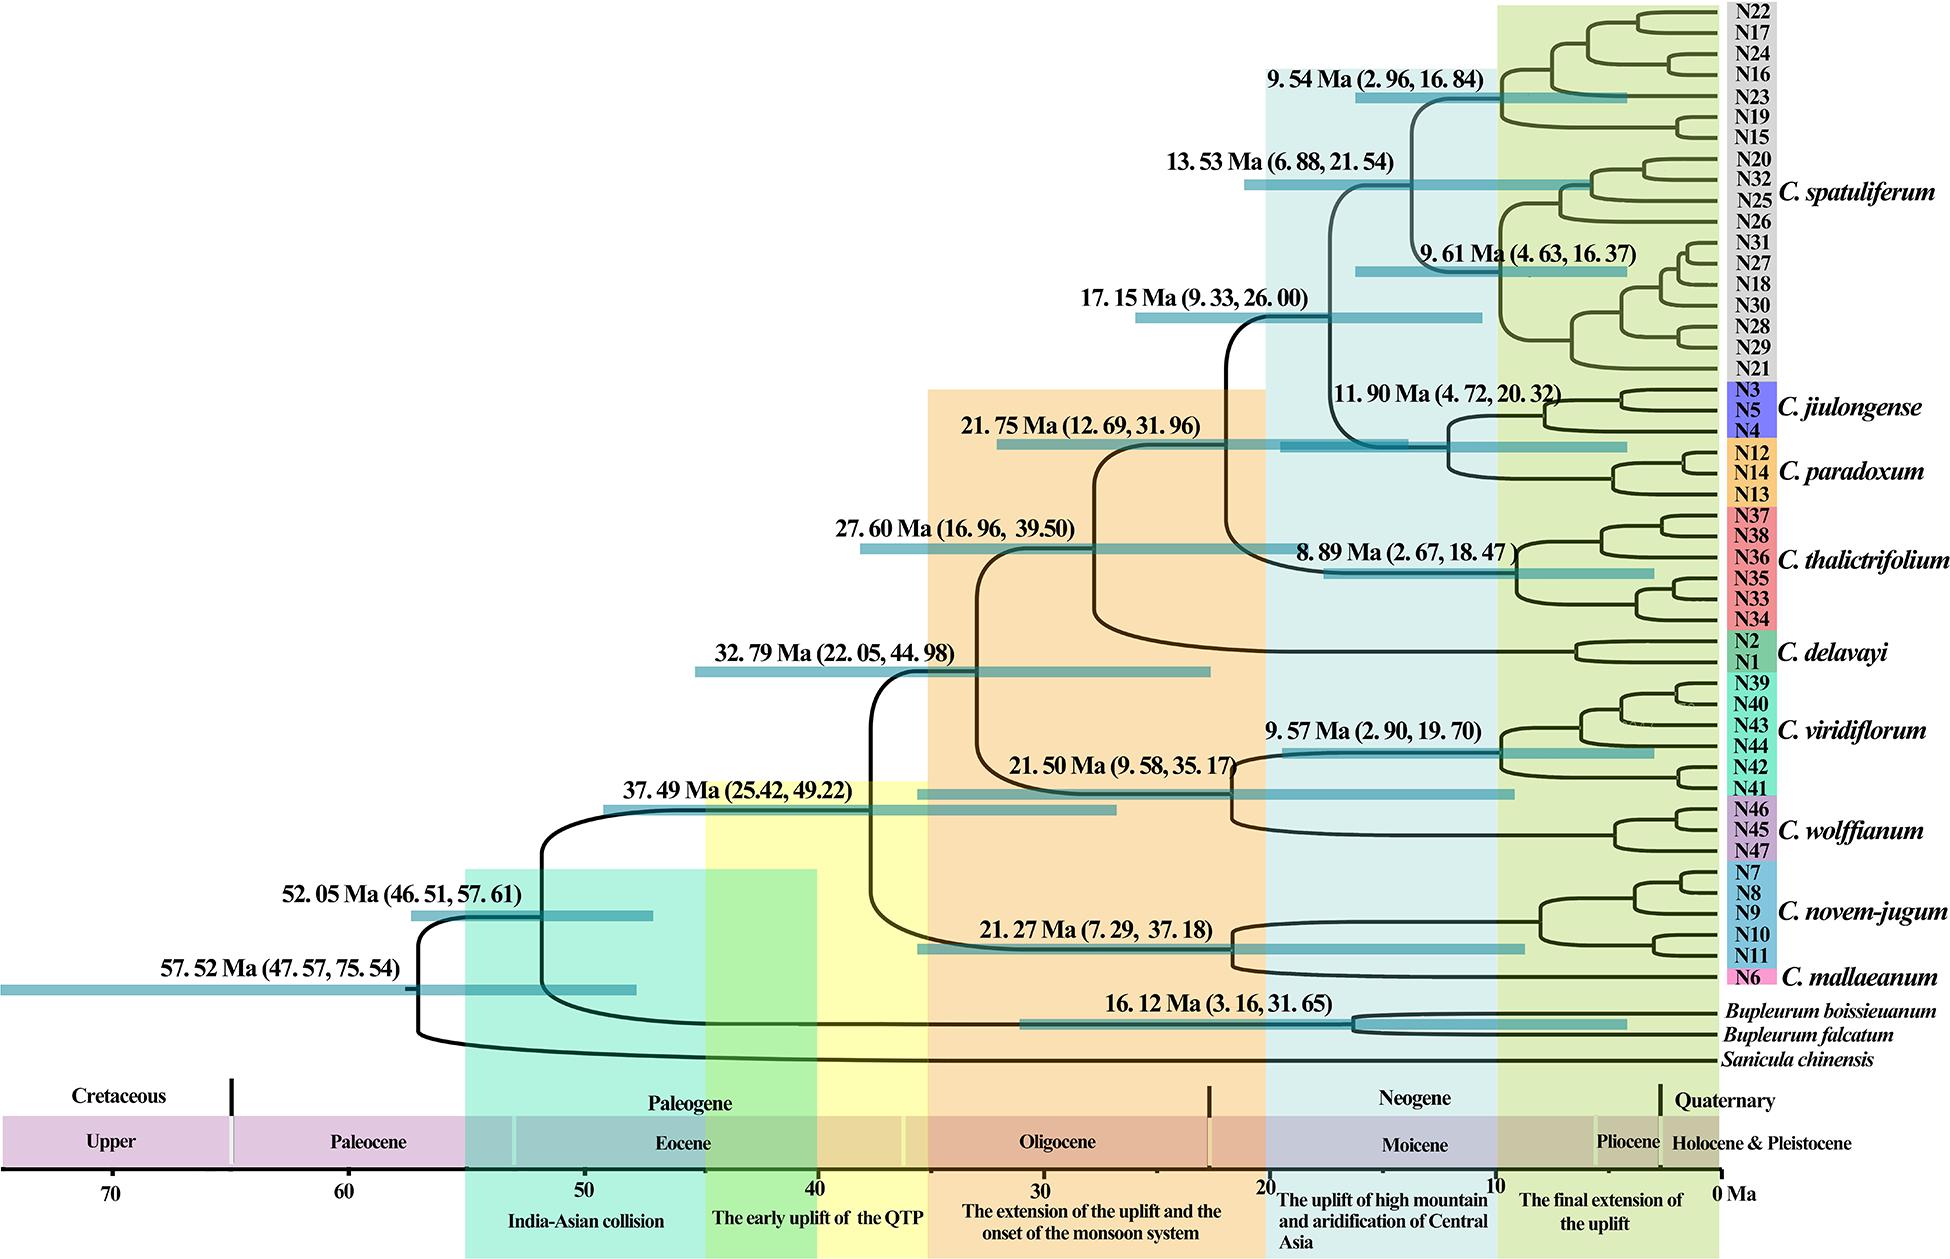
Figure 7. Phylogenetic chronograms of Chamaesium based on ITS. Green bars and numbers above represent 95% highest posterior density (95% HPDs) for each node. Geological events related to the Qinghai-Tibet Plateau are shown below the geological time scale axis, with large rectangular color blocks.
Ancestral Area Reconstruction
The BBM analysis of ancestral distribution (Figure 6) areas was used to indicate the ancient distribution of Chamaesium in the southern Himalayas based on cpDNA data (node I). Several ancestral populations moved eastwards to the eastern Himalayas and continued eastward, diversifying in the HHM region during the early Oligocene. One vicariance and two dispersal events were identified within populations from the eastern Himalayas to the HHM region (node II). Furthermore, the BBM analyses identified several dispersal events within C. novem-jugum, C. thalictrifolium, and C. spatuliferum. For example, C. spatuliferum populations separated and one group colonized the Tangut region or eastern Himalayas from HHM region, while the other continued diversifying in the HHM region.
Demographic History and Species Distribution Modeling
Based on cpDNA and ITS data, we performed mismatch distribution analysis and neutrality test to determine the demographic history of nine species. Values of Tajima’s D and Fu’s Fs were non-significant for all species in the neutrality test (Table 3). The mismatch distributions for our study species were multimodal and/or very ragged, which indicates populations are stable and not shrinking (Figure 8).
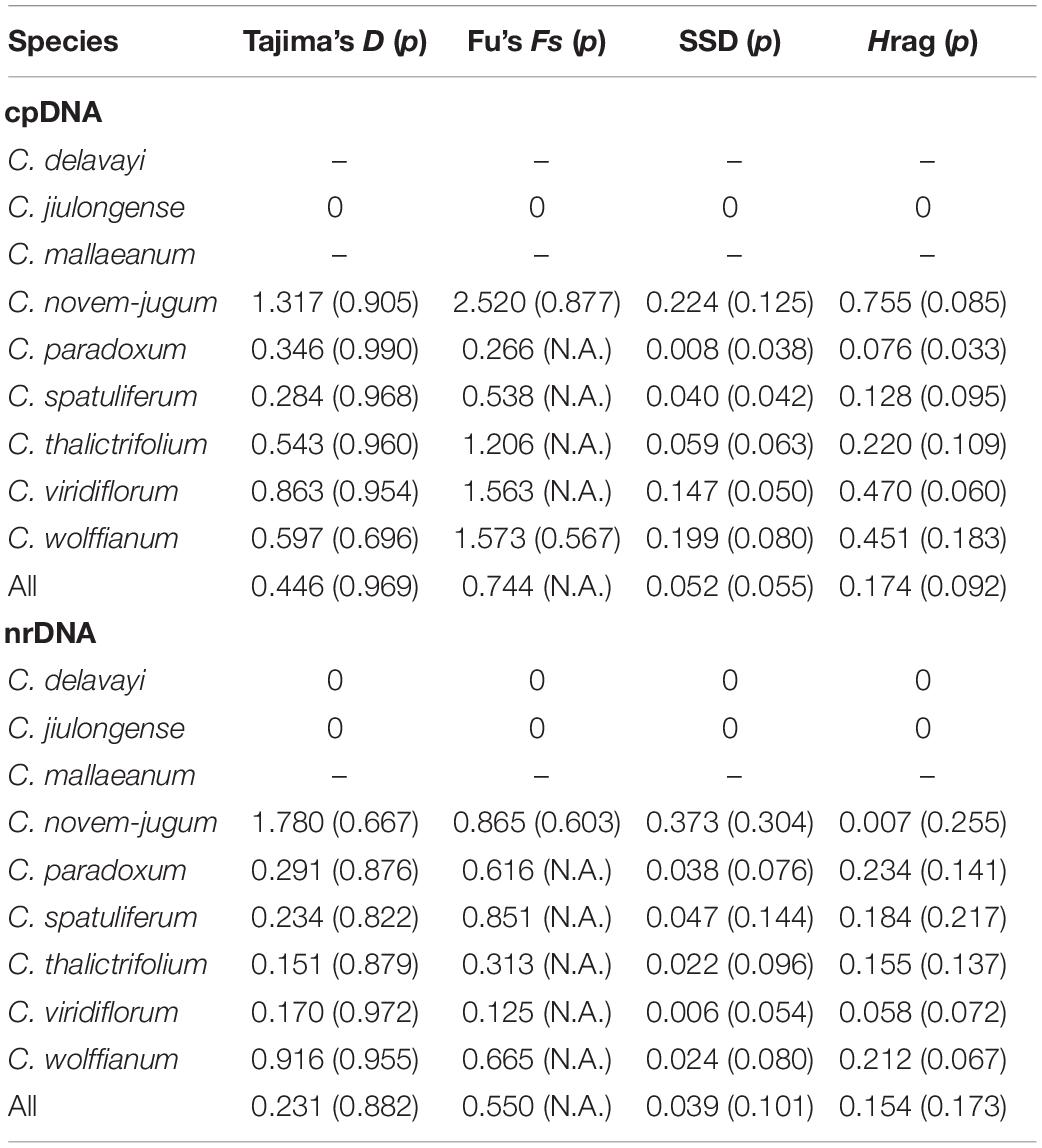
Table 3. Mismatch distribution analysis and neutrality tests within Chamaesium based on cpDNA and ITS.
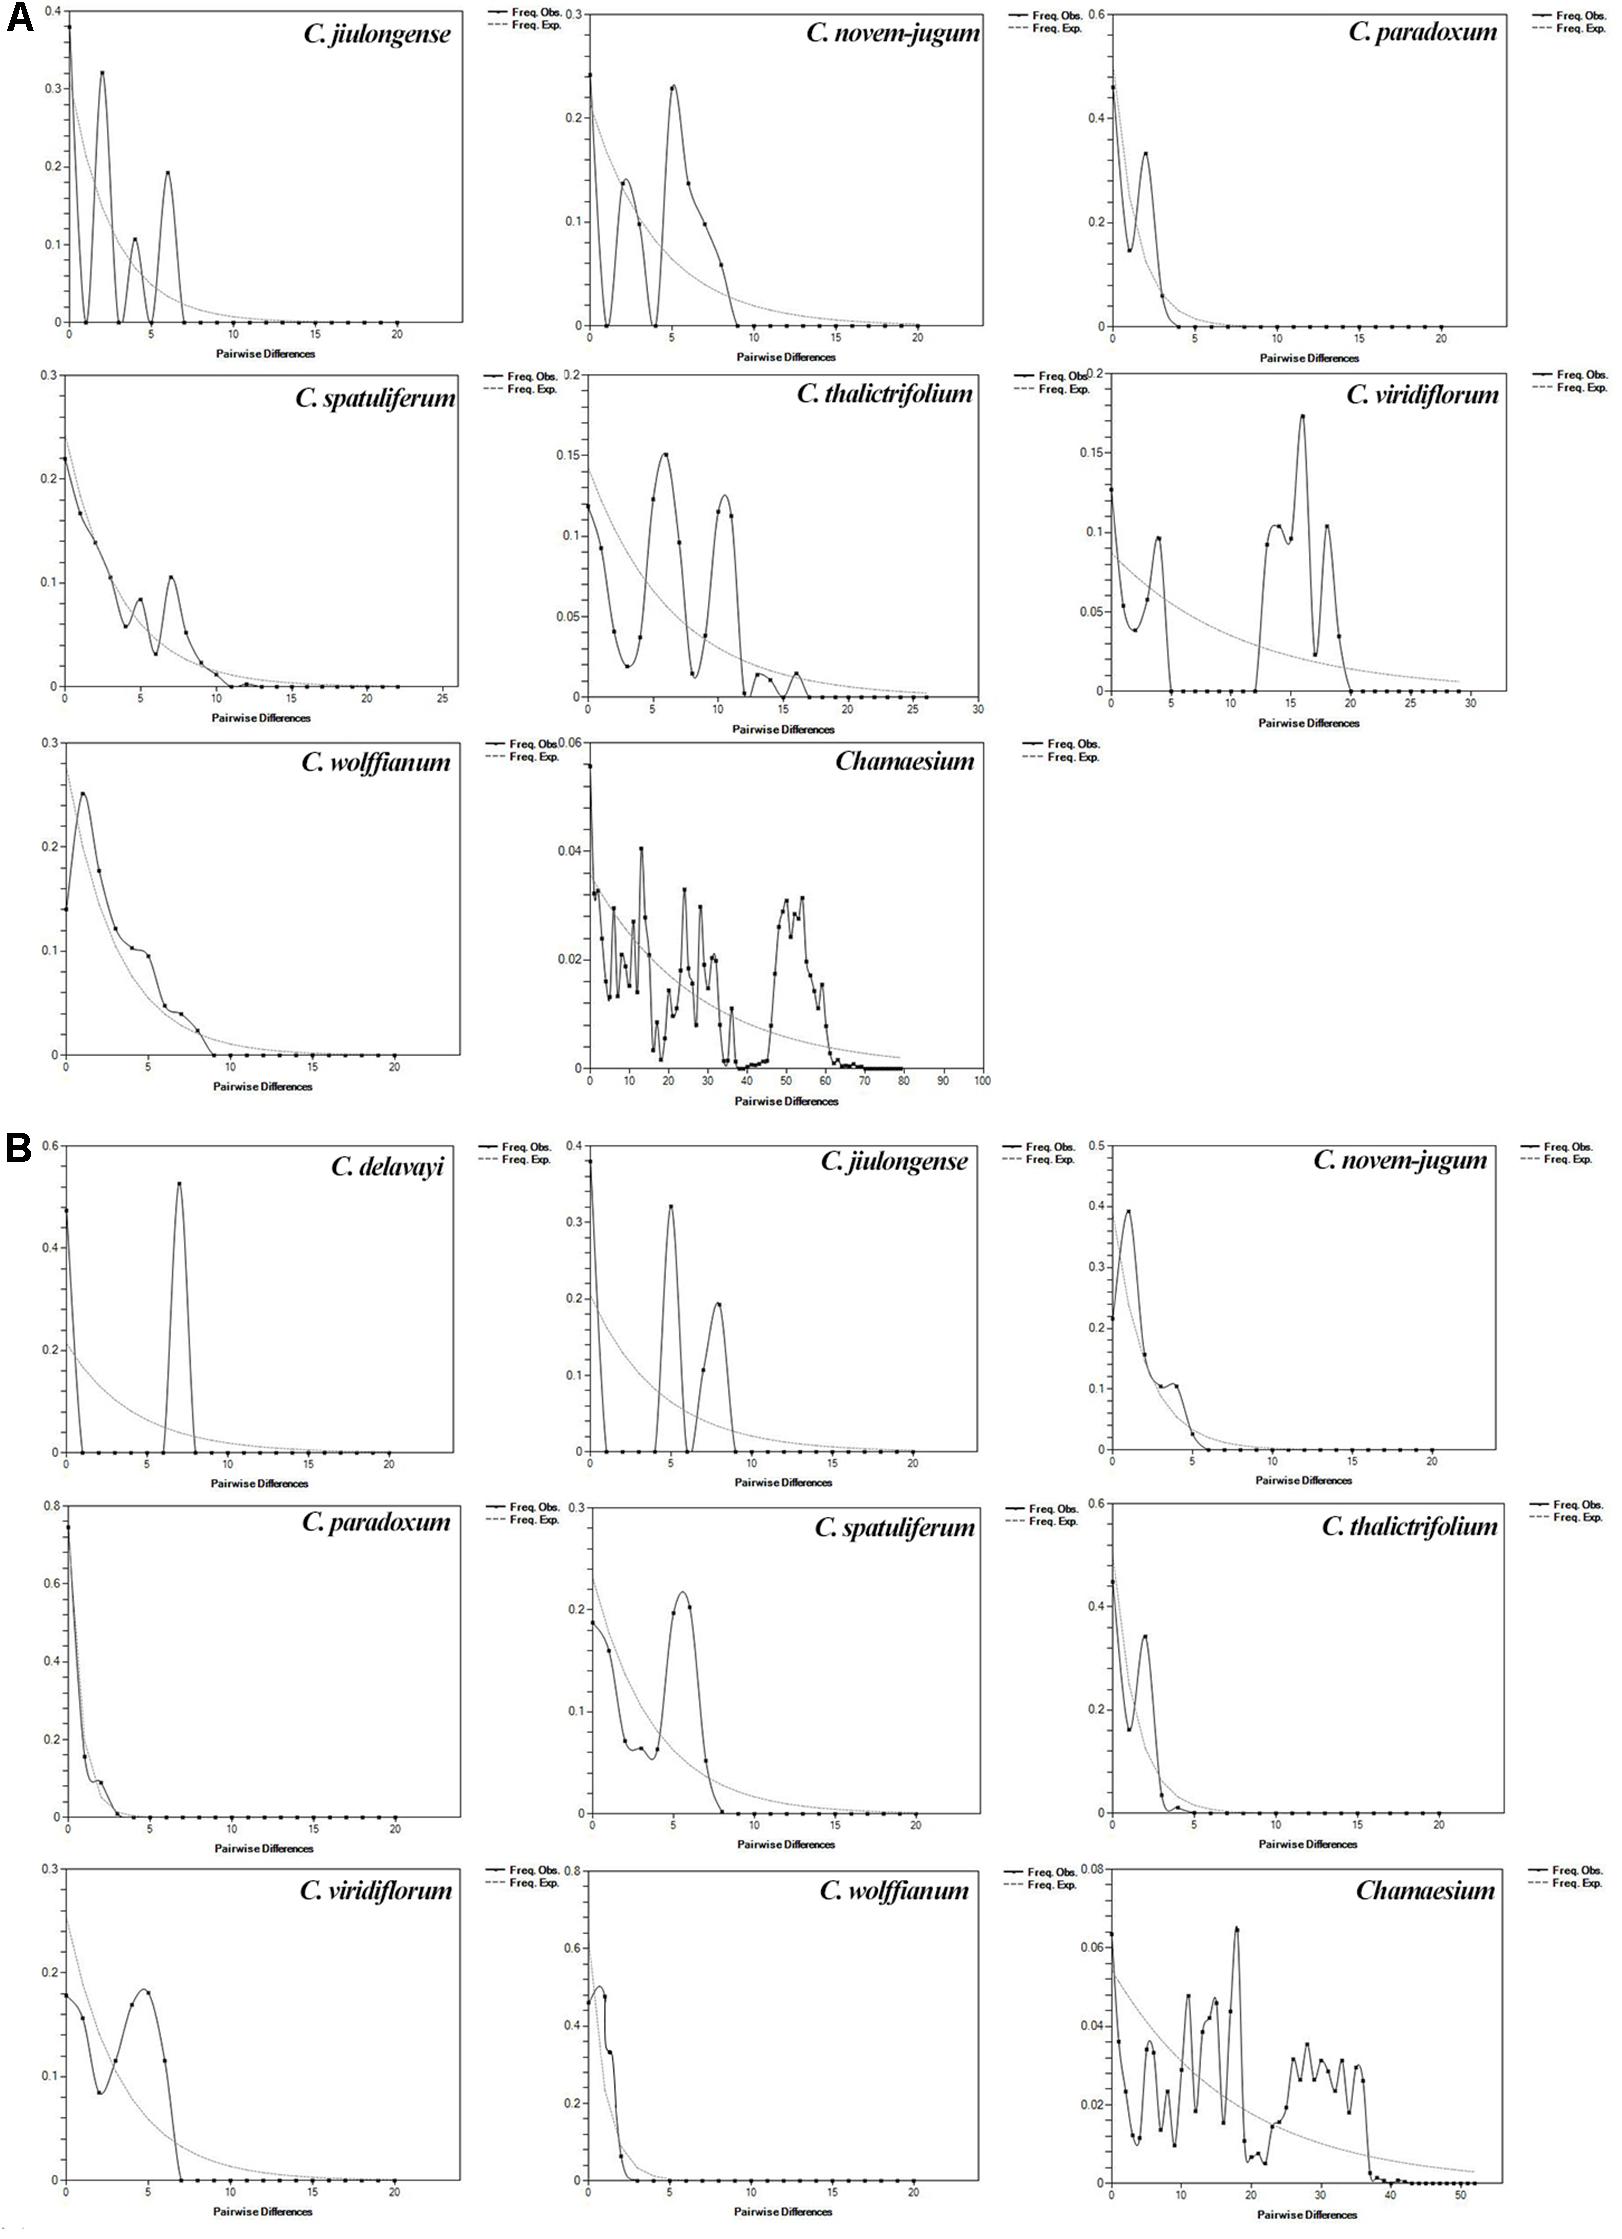
Figure 8. Mismatch distribution analysis for ITS (A) and cpDNA (B). The line represents the distributions of an expected population expansion, the dashed line show observed (Obs) values.
Considering Chamaesium and climate scenarios (the LIG, the LGM, the present and the future), the area under the AUC value for the potential climatically suitable areas of Chamaesium was high (>0.95), indicating the highest predictive capacity. The distribution ranges predicted for Chamaesium were consistent with the actual geographic distributions. This modeling (Figure 9) showed that the overall simulated distribution range of Chamaesium in LIG, LGM, the present and the future is not very different. The main difference lies in the change of the optimal distribution range (red) of Chamaesium. The climate decreased sharply from LIG to LGM, and the optimal distribution range of Chamaesium changed from the northern to the southern part of Hengduan Mountain. From LGM to the present, the main optimum distribution range changed from the southern to the northern part of the Hengduan Mountains. The optimal distribution area in the future is obviously reduced compared with that in the present.
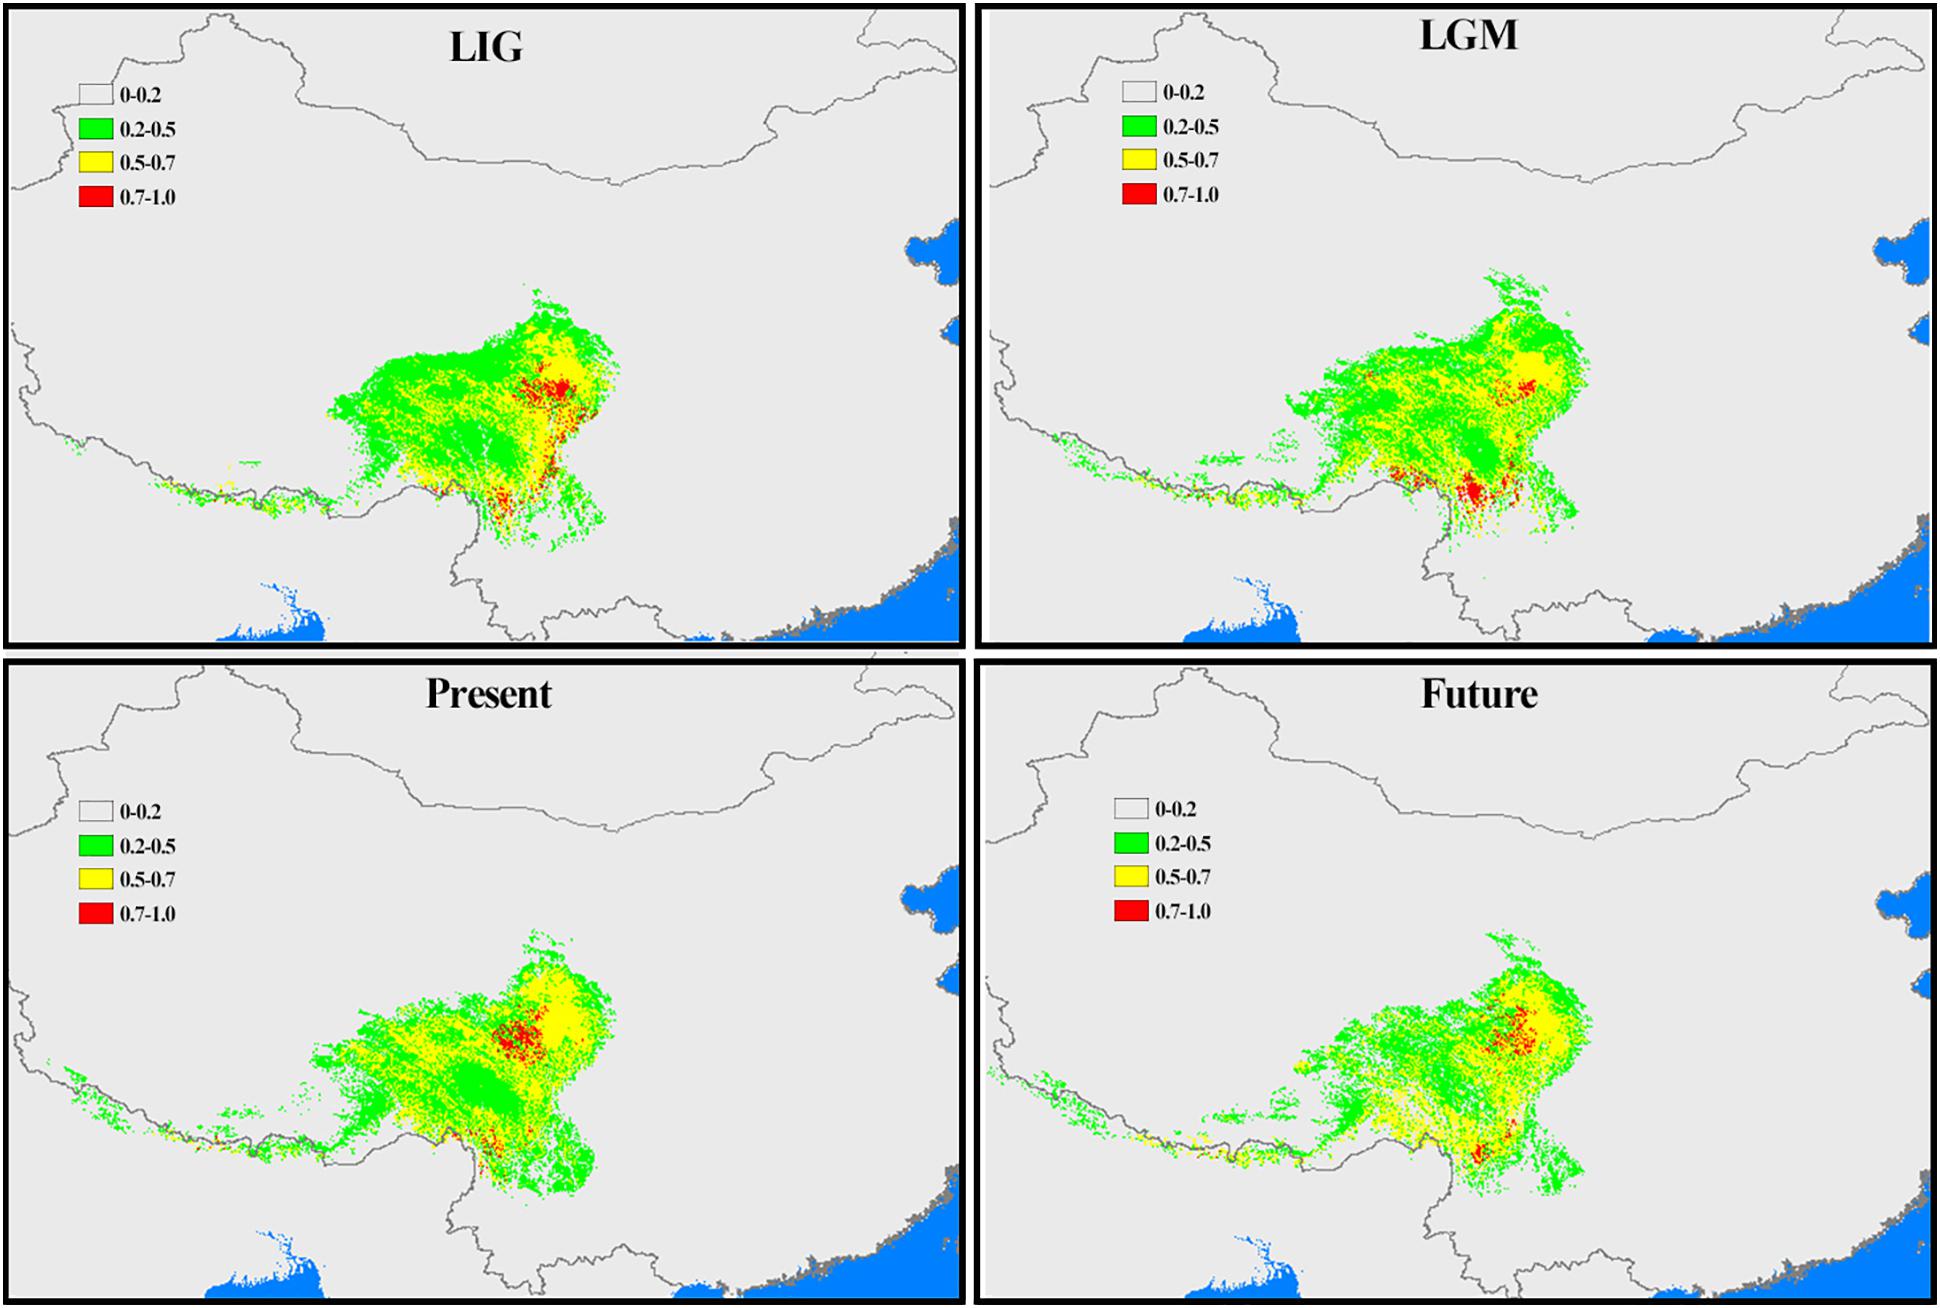
Figure 9. Potential distribution ranges within Chamaesium during LIG, LGM, present and future were simulated by using bioclimatic variables. Colors represent species climate adaptability.
Discussion
Genetic Diversity and Structure
Genetic diversity is the product of the long-term evolution of species, which is caused by many factors and is one of the prerequisites for survival, adaptation and evolution of species (Soltis and Soltis, 1991). The higher the level of genetic diversity of a species, the stronger its adaptability to environmental changes, the easier it is to expand to other distribution ranges or develop new living environments. On the contrary, when a species lacks genetic diversity, it will be unable to adapt to the complex and changeable environment, leading to the extinction of species (Avise and Hamrick, 1996). Petit et al. (2005) has integrated data related to the genetic diversity of a variety of plant groups, and the results show that the average genetic diversity of angiosperms is 0.67 based on chloroplast data analysis. In this study, we found that Chamaesium showed a high level of total genetic diversity based on the two datasets (Table 1), which was significantly higher than the average value of angiosperm genetic diversity obtained by Petit et al., and the high level of genetic diversity of Chamaesium could be attributed to the following reasons: (1) Chamaesium originated around the beginning of Paleogene. During its long evolutionary history, Chamaesium has experienced many geological events, climate changes and accumulated a lot of genetic variation. (2) Chamaesium is commonly distributed at an altitude of more than 3,000 m in the HHM, where the topography is very complex. Habitat fragmentation caused by the unique “island sky” prompts the differentiation among populations and increases the probability of genetic drift within the population, which will accumulate abundant genetic variation. (3) The reproductive mode of Chamaesium is sexual reproduction, which makes the species not only to maintain genetic stability but also enrich genetic variability. Generally speaking, a high level of genetic diversity plays a crucial role in maintaining both the biodiversity of plant groups and the dynamic balance of population (Hughes et al., 2008; Jump et al., 2009). Similar results have been found in other alpine plants distributed on the Tibetan Plateau, such as Pedicularis longensis (cpDNA: HT = 0.77), Eriophyton wallichii (cpDNA: HT = 0.983; ITS: HT = 0.953), Thalictrum squamiferum (cpDNA: HT = 0.973), Paraquilegia microphylla (cpDNA: HT = 0.984; G3pdh: HT = 0.977), Chionocharis hookeri (cpDNA: HT = 0.935; ITS: HT = 0.944), Notopterygium incisum (cpDNA: HT = 0.939; ITS: HT = 0.725) (Yang et al., 2008; Wang et al., 2011; Shahzad et al., 2017).
In addition, AMOVA was performed based on two datasets. The results showed (Table 2) that if Chamaesium was taken as a whole, the genetic variation among 56 populations was large (ITS: 96.73%; cpDNA: 98.37%) and the genetic variation within the population was relatively small (ITS: 3.27%; cpDNA: 1.63%), which may be related to the following reasons: (1) Field studies have shown that the seed/pollen dispersal capacity of Chamaesium is very limited, and the gene flow levels of populations based on two types of datasets are very low. Most of the inter-population differentiation may be due to limited gene flow. Similar results were found in Quercus sect. Heterobalanus, Allium section Sikkimensia, Angelica nitida, Bupleurum longiradiatum, and Thalictrum squamiferum (Zhang and He, 2013; Zhao et al., 2013; Luo et al., 2016; Meng et al., 2017; Xie et al., 2018). (2) It is found that the genetic differentiation of many organisms in the HHM is mainly driven by complex geological activities and diverse climate changes, such as habitat fragmentation can decrease gene flow and increase genetic variation among populations. Therefore, the higher genetic differentiation among Chamaesium populations may be related to the drastic changes in the external environment in this region. However, the AMOVA results of C. paradoxum based on ITS data indicated that the genetic variation was mainly within populations (83.49%), while the AMOVA results of C. wolffianum based on the two datasets indicated that the probability of genetic variation between populations (ITS: 50.92%; cpDNA:47.38%) and within populations (ITS:49.08%; cpDNA:52.62%) was very similar. Except for C. mallaeanum and C. delavayi, the genetic variation of other species occurred mainly between populations. The reasons for this genetic structure inconsistency are speculated as follows: (1) Three haplotypes (N12, N13, N14) were detected in the eight populations of C. paradoxum based on ITS data, of which N12 was the haplotype shared by the eight populations, thus reducing the genetic variation among the populations. (2) Six haplotypes (C47–C52) were detected in three populations of C. wolffianum based on cpDNA. These haplotypes were all unique and existed within and between populations of C. wolffianum, so the proportion of genetic variation was very close between and within populations.
Both ITS and cpDNA datasets showed a high level of haplotype diversity. We also constructed haplotype TCS networks of Chamaesium using PopART and drew geographic distribution maps of haplotypes (Figure 4). The results showed that there were no shared haplotypes among the nine Chamaesium species, and most (cpDNA/nDNA) haplotypes were restricted to single sites or neighboring populations. Therefore, we speculate that due to a combination of extrinsic and species-specific factors, these high-altitude populations remained isolated and confined within a mountainous area, not only during the glacial period but also during the interglacial period. This is mainly because: (1) The Himalaya-Hengduan Mountain region has complex topographic features, especially in the Hengduan Mountain region, where many high mountains above 4,000 m are separated by valleys. (2) Limited pollen/seed dispersal capacity of Chamaesium. (3) These alpine plants are not adapted to lowland conditions. Nevertheless, different haplotypes were found in a large number of populations, both based on ITS and cpDNA datasets, which still requires further investigation.
Origin and Diversification of Chamaesium
In the long history of the evolution of the earth, every geological activity and climate change will bring unprecedented effects on organisms, which is also a hot topic of research at present. In the present study, all Chamaesium populations we collected were mainly distributed in four regions: A: southern Himalayas, B: Tangut region, C: eastern Himalayas, D: Hengduan Mountains region. We estimate the time of the origin of Chamaesium and the differentiation of nine species and reconstruct the ancestral distribution of Chamaesium (Figure 6). The results show that the ancestral group of Chamaesium originated in the southern Himalayan region at the beginning of the Paleogene (60.85 Ma, 95% HPD: 35.69–101.38 Ma). And the most widely accepted theory is that the uplift of the QTP resulting from the collision of the Indian plate with Eurasia began at about 55–50 Ma, which also led to dramatic changes in the topography of this region. Great habitat changes have also contributed to the formation and differentiation of species, such as Gentiana (Motley, 2003; Favre et al., 2016) and Saxifraga (Ebersbach et al., 2017). Therefore, we speculate that the origin of Chamaesium is closely related to the early uplift of the QTP caused by the collision. The BEAST analysis showed that C. mallaeanum and C. novem-jugum diverged in succession in the early and middle Eocene. BBM analysis showed that some ancestral populations migrated eastward into the eastern Himalayas, during which time the QTP continued to rise from south to north.
During the Oligocene (36.5–23 Ma), the uplift progressed particularly northward and southward, causing the extension of the QTP. Due to its considerable size and elevation, the QTP and its adjacent mountains progressively acted as an orographic barrier to the Asian atmospheric circulation, which became a direct cause of the formation of the monsoon climate. BEAST analysis showed that C. wolffianum separated during the early Oligocene (36.78 Ma, 95% HPD: 22.37–52.28 Ma) and the dispersal event at node II (Figure 6) tested in BBM indicated that some populations of Chamaesium migrated eastward to the Hengduan Mountain region. C. viridiflorum and C. delavayi were detected that differentiated in the middle (30.75 Ma, 95% HPD: 17.95–45.41 Ma) and late Oligocene (24.41 Ma, 95% HPD: 12.67–36.69 Ma). Therefore, we infer that the colonization of the newly available climate and terrain facilitated the differentiation of several species in Chamaesium. Similar results have been found in other species, such as Primulina, Cardiocrinum, and Saxifraga (Yang et al., 2016; Ebersbach et al., 2017).
Before the late Miocene (23–10 Ma), both the Himalayas and the Tianshan Mountains experienced considerable elevation. Combined with the global temperature drop since the Miocene, drought events occurred in Central Asia. Some studies have shown that other factors, including changes in the size of global glaciers and the loss of the Tethys Sea, contributed to the Central Asian Aridification. The dramatic reduction in rainfall has led to great changes in many biological communities, such as Cyclocarya paliurus, Cardiocrinum, and Rabdosia (Yu et al., 2014; Yang et al., 2016). Our molecular dating analysis suggested that C. thalictrifolium and C. spatuliferum differentiated in the early (20.25 Ma, 95% HPD: 10.42–31.54 Ma) and middle (13.87 Ma, 95% HPD: 6.82–23.00 Ma) Miocene. Therefore, we speculate that the division of Chamaesium at this time is closely related to the drought event in Central Asia and the change of habitat topography.
In the late Miocene and later (10 Ma–present), QTP experienced further uplift and expansion, especially in the eastern margin region, which contains many mountain ranges, most notably the Hengduan biodiversity hotspot. Warm and moist air from the Indian Ocean is blocked by the Himalayas and the KailasRange, so it enters China from the Hengduan Mountains (Lopez-Pujol et al., 2011; He and Jiang, 2014; Sklenar et al., 2014; Song et al., 2016). This has brought plenty of rain to the southeastern part of QTP, which in turn has had a dramatic effect on species there, such as Allium section Sikkimensia, Cardiocrinum, Dolomiaea, Rheum, and Myricaria (Miehe et al., 2007; Sun et al., 2012; Zhang et al., 2014; Yang et al., 2016; Xie et al., 2018). BEAST analysis showed that the split of C. paradoxum and C. jiulongense occurred in the late Miocene (8.37 Ma, 95% HPD: 3.50–15.18 Ma). In addition, BBM analysis showed that there were some dispersal events in C. thalictrifolium and C. spatuliferum. We infer that complex geological activity and climate change play important roles in the differentiation and dispersal of Chamaesium.
Population and Range Dynamics Within Chamaesium
Quaternary glaciation has always been the background event discussed in the phylogeography study. Drastic fluctuation in the climate is generated by the recurrence of glaciation, which caused large-scale migration of organisms and natural disaster avoidance for survival. At the same time, the genetic structure and distribution of the surviving organisms can change dramatically (Taberlet et al., 1998). QTP never formed a unified ice sheet during the glacial period, and the terrain in the subtropical region is complex and diverse. Even in the harsh climate conditions during the glacial period, there are still some relatively warm and humid places for organisms to survive. Such natural isolation places may also lead to the differentiation of species or promote the formation of subspecies and new species. Therefore, regions with high levels of genetic diversity, ancient haplotypes or endemic haplotypes are often speculated as the glacial refuge of organisms in the study of phylogeography (Tzedakis, 2002).
According to our study mentioned above, nine species of Chamaesium have separated well during the Miocene. Our maxent modeling predicted that the simulated distribution range of Chamaesium did not change much during LIG, LGM and present (Figure 9). Non-significant results of the neutrality test, multimodal distribution shapes of the mismatch distribution analysis (Figure 8 and Table 3) and non-star-like phylogeographical structure of haplotype (Figure 4) implied that the populations are stable and not shrinking. We suggested that the stability of the overall distribution range of Chamaesium may be the result of the combined effects of the characteristics of Chamaesium and the external environment. As a cold-tolerant species, Chamaesium is distributed in the Himalaya-Hengduan Mountains region, and all the plant groups grow in the mountains above 3,000 m. Many studies have shown that the absence of unified ice-sheets covering the entire QTP and bordering mountains and plateau glacier expansion was less pronounced in the QTP than in other regions of the Northern Hemisphere. Therefore, climate change caused by glaciers was not an entirely adverse factor for the flora in our study area. During Quaternary glaciation, some cold-tolerant plants with a wide range of habitats on QTP could survive in multiple refuges. We have detected high levels of genetic diversity (ITS: Hd = 0.8) and endemic haplotypes in populations from spa2, spa13, and spa21 (Supplementary Table 2), suggesting that Hengduan Mountain and its adjacent areas may have provided multiple glacial refuges for Chamaesium. Similar results have also been found in other groups, such as Pedicularis longicornis, Metagentiana striata, Picea likiangensis, Potentilla glabra, Eriophyton wallichi, Primula secundiflora, and Rhodiola alsia (Chen et al., 2008; Wang L.Y. et al., 2009; Yang et al., 2008; Gao et al., 2011; Wang et al., 2011). These studies suggested that the Quaternary glaciation had little effect on the survival and widespread distribution of alpine cold-tolerant plants in the subtropical regions of QTP, in contrast to the results of mountains in temperate regions that were covered by more extensive ice sheets during the Quaternary.
Data Availability Statement
The datasets presented in this study can be found in online repositories. The names of the repository/repositories and accession number(s) can be found below: https://www.ncbi.nlm.nih.gov/genbank/, MT678849–MT678858, MT723793–MT723822, MT827288–MT827802, MT850316–MT851860.
Author Contributions
H-YZ, X-LG, X-JH, and S-DZ conceived the idea. H-YZ and X-LG contributed to the collecting data, designed, and performed the experiment, and prepared the manuscript. H-YZ, X-LG, MP, X-JH, and S-DZ authored the drafts of the article. All authors contributed, made multiple revisions, and approved the final draft.
Funding
This work was supported by the National Natural Science Foundation of China (Grant Nos. 31872647, 32070221) and the National Specimen Information Infrastructure, Educational Specimen Sub-Platform (Grant No. 2005DKA21403-JK).
Conflict of Interest
The authors declare that the research was conducted in the absence of any commercial or financial relationships that could be construed as a potential conflict of interest.
Acknowledgments
We acknowledge Xin-Rui Xu, Yan-Ping Xiao, and Wei Gou for their help in materials collection. We would like to thank Chuan Xie and Deng-Feng Xie for their help in software use.
Supplementary Material
The Supplementary Material for this article can be found online at: https://www.frontiersin.org/articles/10.3389/fpls.2021.673200/full#supplementary-material
Footnotes
- ^ http://beast.bio.ed.ac.uk/Tracer
- ^ http://tree.bio.ed.ac.uk/software/figtree/
- ^ http://mnh.scu.edu.cn/soft/blog/RASP/index.html
References
Aitchison, J. C., Ali, J. R., and Davis, A. M. (2007). When and where did India and Asia collide? J. Geophys. Res. 112:B05423. doi: 10.1029/2006jb004706
An, Z. S., Kutzbach, J. E., Prell, W. L., and Porter, S. C. (2001). Evolution of Asian monsoons and phased uplift of the Himalayan Tibetan plateau since Late Miocene times. Nature 411, 62–66. doi: 10.1038/35075035
Avise, J. C., and Hamrick, J. L. (1996). Conservation Genetics: Case Histories from Nature. Dordrecht: Kluwer Academic Publishers.
Calvino, C. I., Teruel, F. E., and Downie, S. R. (2016). The role of the Southern Hemisphere in the evolutionary history of Apiaceae, a mostly north temperate plant family. J. Biogeogr. 43, 398–409. doi: 10.1111/jbi.12651
Cao, J. L., Shi, Y. L., Zhang, H., and Wang, H. (2009). Numerical simulation of GPS observed clockwise rotation around the eastern Himalayan syntax in the Tibetan Plateau. Chin. Sci. Bull. 54, 1398–1410. doi: 10.1007/s11434-008-0588-7
Chatterjee, S., Goswami, A., and Scotese, C. R. (2013). The longest voyage: tectonic, magmatic, and paleoclimatic evolution of the Indian plate during its northward flight from Gondwana to Asia. Gondwana Res. 23, 238–267. doi: 10.1016/j.gr.2012.07.001
Chen, S. Y., Wu, G. L., Zhang, D. J., Gao, Q., Duan, Y., Zhang, F., et al. (2008). Potential refugium on the Qinghai-Tibet Plateau revealed by the chloroplast DNA phylogeography of the alpine species Metagentiana striata (Gentianaceae). Bot. J. Linn. Soc. 157, 125–140. doi: 10.1111/j.1095-8339.2008.00785.x
Cun, Y. Z., and Wang, X. Q. (2010). Plant recolonization in the Himalaya from the southeastern Qinghai-Tibetan Plateau: geographical isolation contributed to high population differentiation. Mol. Phylogenet. Evol. 56, 972–982. doi: 10.1016/j.ympev.2010.05.007
Danderson, C. A., Downie, S. R., and Hermann, M. (2017). Rampant polyphyly in the Arracacia clade (Apiaceae) and an assessment of the phylogenetic utility of 20 noncoding plastid loci. Mol. Phylogenet. Evol. 118, 286–305. doi: 10.1016/j.ympev.2017.10.006
Drummond, A. J., Ho, S. Y. W., Phillips, M. J., and Rambaut, A. (2006). Relaxed phylogenetics and dating with confidence. PLoS. Biol. 4:e88. doi: 10.1371/journal.pbio.0040088
Drummond, A. J., and Rambaut, A. (2007). BEAST: bayesian evolutionary analysis by sampling trees. BMC Evol. Biol. 7:214. doi: 10.1186/1471-2148-7-214
Dupont-Nivet, G., Lippert, P. C., Van Hinsbergen, D. J. J., Meijers, M. J. M., and Kapp, P. (2010). Palaeolatitude and age of the Indo–Asia collision: palaeomagnetic constraints. Geophys. J. Int. 182, 1189–1198. doi: 10.1111/j.1365-246x.2010.04697.x
Ebersbach, J., Muellner-Riehl, A. N., Michalak, I., Tkach, N., Hoffmann, M. H., Röser, M., et al. (2017). In and out of the Qinghai-Tibet Plateau: divergence time estimation and historical biogeography of the large arctic-alpine genus Saxifraga L. J. Biogeogr. 44, 900–910. doi: 10.1111/jbi.12899
Elith, J., and Leathwick, J. R. (2009). Species distribution models: ecological explanation and prediction across space and time. Annu. Rev. Ecol. Evol. Syst. 40, 677–697.
Excoffier, L., and Lischer, H. E. L. (2010). Arlequin suite ver 3.5: a new series of programs to perform population genetics analyses under Linux and Windows. Mol. Ecol. Resour. 10, 564–567. doi: 10.1111/j.1755-0998.2010.02847.x
Favre, A., Michalak, I., Chen, C. H., Wang, J. C., Pringle, J. S., Matuszak, S., et al. (2016). Out-of-Tibet: the spatio-temporal evolution of Gentiana (Gentianaceae). J. Biogeogr. 43, 1967–1978. doi: 10.1111/jbi.12840
Fielding, A. H., and Bell, J. F. (1997). A review of methods for the assessment of prediction errors in conservation presence/absence models. Environ. Conserv. 24, 38–49. doi: 10.1017/s0376892997000088
Gao, Q., Zhang, D., Duan, Y., Zhang, F., Li, Y., Fu, P., et al. (2011). Intraspecific divergences of Rhodiola alsia (Crassulaceae) based on plastid DNA and internal transcribed spacer fragments. Bot. J. Linn. Soc. 168, 204–215. doi: 10.1111/j.1095-8339.2011.01193.x
Garzione, C. N., Quade, J., DeCelles, P. G., and English, N. B. (2001). Predicting paleoelevation of Tibet and the Himalaya from delta O-18 versus altitude gradients in meteoric water across the Nepal Himalaya (vol 183, pg 215, 2000). Earth Planet. Sci. Lett. 185, 397. doi: 10.1016/s0012-821x(01)00224-2
Grivet, D., and Petit, R. J. (2002). Phylogeography of the common ivy (Hedera sp.) in Europe: genetic differentiation through space and time. Mol. Ecol. 11, 1351–1362. doi: 10.1046/j.1365-294X.2002.01522.x
Guo, X. L., Wang, C. B., Wen, J., Zhou, S. D., and He, X. J. (2018). Phylogeny of Chinese Chamaesium (Apiaceae: Apioideae) inferred from ITS, cpDNA and morphological characters. Phytotaxa 376, 1–16. doi: 10.11646/phytotaxa.376.1.1
Guo, Z. T., Sun, B., Zhang, Z. S., Peng, S. Z., Xiao, G. Q., Ge, J. Y., et al. (2008). A major reorganization of Asian climate by the early Miocene. Clim. Past. 4, 153–174. doi: 10.5194/cp-4-153-2008
Harmon, L. J., Melville, J., Larson, A., and Losos, J. B. (2008). The role of geography and ecological opportunity in the diversification of day geckos (Phelsuma). Syst. Biol. 57, 562–573. doi: 10.1080/10635150802304779
Harpending, H. C. (1994). Signature of ancient population-growth in a low-resolution mitochondrial-DNA mismatch distribution. Hum. Biol. 66, 591–600. doi: 10.1038/hdy.1994.122
He, K., and Jiang, X. L. (2014). Sky islands of southwest China. I: an overview of phylogeographic patterns. Chin. Sci. Bull. 59, 585–597. doi: 10.1007/s11434-013-0089-1
Hijmans, R. J., Cameron, S. E., Parra, J. L., Jones, P. G., and Jarvis, A. (2005). Very high resolution interpolated climate surfaces for global land areas. Int. J. Climatol. 25, 1965–1978. doi: 10.1002/joc.1276
Hoang, D. T., Chernomor, O., von Haeseler, A., Minh, B. Q., and Vinh, L. S. (2018). UFBoot2: improving the ultrafast bootstrap approximation. Mol. Biol. Evol. 35, 518–522. doi: 10.1093/molbev/msx281
Hughes, A. R., Inouye, B. D., Johnson, M. T. J., Underwood, N., and Vellend, M. (2008). Ecological consequences of genetic diversity. Ecol. Lett. 11, 609–623. doi: 10.1111/j.1461-0248.2008.01179.x
Huntington, K. W., Blythe, A. E., and Hodges, K. V. (2006). Climate change and Late Pliocene acceleration of erosion in the Himalaya. Earth Planet. Sci. Lett. 252, 107–118. doi: 10.1016/j.epsl.2006.09.031
Jump, A. S., Marchant, R., and Peñuelas, J. (2009). Environmental change and the option value of genetic diversity. Trends Plant Sci. 14, 51–58. doi: 10.1016/j.tplants.2008.10.002
Kalyaanamoorthy, S., Minh, B. Q., Wong, T. K. F., von Haeseler, A., and Jermiin, L. S. (2017). ModelFinder: fast model selection for accurate phylogenetic estimates. Nat. Methods 14, 587–589. doi: 10.1038/nmeth.4285
Katoh, K., and Standley, D. M. (2013). MAFFT multiple sequence alignment software version 7: improvements in performance and usability. Mol. Biol. Evol. 30, 772–780. doi: 10.1093/molbev/mst010
Keller, I., and Seehausen, O. (2012). Thermal adaptation and ecological speciation. Mol. Ecol. 21, 782–799. doi: 10.1111/j.1365-294X.2011.05397.x
Kutzbach, J. E., Prell, W. L., and Ruddiman, W. F. (1993). Sensitivity of Eurasian climate to surface uplift of the Tibetan plateau. J. Geol. 101, 177–190. doi: 10.1086/648215
Li, J., and Fang, X. (1999). Uplift of the Tibetan Plateau and environmental changes. Chin. Sci. Bull. 44, 2117–2124. doi: 10.1007/BF03182692
Li, Y., Zhai, S. N., Qiu, Y. X., Guo, Y., Ge, X. J., and Comes, H. P. (2011). Glacial survival east and west of the ‘Mekong-Salween Divide’ in the Himalaya-Hengduan Mountains region as revealed by AFLPs and cpDNA sequence variation in Sinopodophyllum hexandrum (Berberidaceae). Mol. Phylogenet. Evol. 59, 412–424. doi: 10.1016/j.ympev.2011.01.009
Librado, P., and Rozas, J. (2009). DnaSP v5: a software for comprehensive analysis of DNA polymorphism data. Bioinformatics 25, 1451–1452. doi: 10.1093/bioinformatics/btp187
Liu, J. Q., Wang, Y. J., Wang, A. L., Hideaki, O., and Abbott, R. J. (2006). Radiation and diversification within the Ligularia-Cremanthodium-Parasenecio complex (Asteraceae) triggered by uplift of the Qinghai-Tibetan Plateau. Mol. Phylogenet. Evol. 38, 31–49. doi: 10.1016/j.ympev.2005.09.010
Lopez-Pujol, J., Zhang, F. M., Sun, H. Q., Ying, T. S., and Ge, S. (2011). Centres of plant endemism in China: places for survival or for speciation? J. Biogeogr. 38, 1267–1280. doi: 10.1111/j.1365-2699.2011.02504.x
Lowry, D. B., Rockwood, R. C., and Willis, J. H. (2008). Ecological reproductive isolation of coast and inland races of Mimulus guttatus. Evolution 62, 2196–2214. doi: 10.1111/j.1558-5646.2008.00457.x
Luo, D., Yue, J. P., Sun, W. G., Xu, B., Li, Z.-M., Comes, H. P., et al. (2016). Evolutionary history of the subnival flora of the Himalaya-Hengduan Mountains: first insights from comparative phylogeography of four perennial herbs. J. Biogeogr. 43, 31–43. doi: 10.1111/jbi.12610
Marchese, C. (2015). Biodiversity hotspots: a shortcut for a more complicated concept. Glob. Ecol. Conserv. 3, 297–309. doi: 10.1016/j.gecco.2014.12.008
Meng, H. H., Su, T., Gao, X.-Y., Li, J., Jiang, X. L., Sun, H., et al. (2017). Warm-cold colonization: response of oaks to uplift of the Himalaya-Hengduan Mountains. Mol. Ecol. 26, 3276–3294. doi: 10.1111/mec.14092
Miehe, G., Miehe, S., Vogel, J., Co, S., and Duo, L. (2007). Highest treeline in the northern hemisphere found in southern Tibet. Mt. Res. Dev. 27, 169–173. doi: 10.1659/mrd.0792
Mosbrugger, V., Favre, A., Muellner-Riehl, A., Pckert, M., and Mulch, A. (2018). “Cenozoic evolution of geo-biodiversity in the Tibeto-Himalayan region,” in Mountains, Climate and Biodiversity, 1st Edn, eds C. Hoorn, A. Perrigo, and A. Antonelli (Hoboken, NJ: Wiley-Blackwell), 429–449.
Mulch, A., and Chamberlain, C. P. (2006). Earth science - The rise and growth of Tibet. Nature 439, 670–671. doi: 10.1038/439670a
Myers, N., Mittermeier, R. A., Mittermeier, C. G., da Fonseca, G. A. B., and Kent, J. (2000). Biodiversity hotspots for conservation priorities. Nature 403, 853–858. doi: 10.1038/35002501
Nei, M., and Li, W. H. (1979). Mathematical-model for studying genetic-variation in terms of restriction endonucleases. Proc. Natl. Acad. Sci. U.S.A. 76, 5269–5273. doi: 10.1073/pnas.76.10.5269
Nei, M., and Tajima, F. (1981). DNA polymorphism detectable by restriction endonucleases. Genetics 97, 145–163. doi: 10.1007/BF00135050
Nguyen, L. T., Schmidt, H. A., von Haeseler, A., and Minh, B. Q. (2015). IQ-TREE: a fast and effective stochastic algorithm for estimating maximum-likelihood phylogenies. Mol. Biol. Evol. 32, 268–274. doi: 10.1093/molbev/msu300
Opgenoorth, L., Vendramin, G. G., Mao, K. S., Miehe, G., Miehe, S., Liepelt, S., et al. (2010). Tree endurance on the Tibetan Plateau marks the world’s highest known tree line of the Last Glacial Maximum. New Phytol. 185, 332–342. doi: 10.1111/j.1469-8137.2009.03007.x
Peterson, A. T., Papes, M., and Soberon, J. (2008). Rethinking receiver operating characteristic analysis applications in ecological niche modeling. Ecol. Model. 213, 63–72. doi: 10.1016/j.ecolmodel.2007.11.008
Petit, R. J., Duminil, J., Fineschi, S., Salvini, D., and Vendramin, G. (2005). Comparative organization of chloroplast, mitochondrial and nuclear diversity in plant populations. Mol. Ecol. 14, 689–701. doi: 10.1111/j.1365-294X.2004.02410.x
Phillips, S. J., Anderson, R. P., and Schapire, R. E. (2006). Maximum entropy modeling of species geographic distributions. Ecol. Model. 190, 231–259. doi: 10.1016/j.ecolmodel.2005.03.026
Polzin, T., and Daneshmand, S. V. (2003). On Steiner trees and minimum spanning trees in hypergraphs. Oper. Res. Lett. 31, 12–20. doi: 10.1016/s0167-6377(02)00185-2
Pons, O., and Petit, R. J. (1996). Measuring and testing genetic differentiation with ordered versus unordered alleles. Genetics 144, 1237–1245. doi: 10.1016/S1050-3862(96)00162-3
Qiang, X. K., An, Z. S., Song, Y. G., Chang, H., Sun, Y. B., Liu, W. G., et al. (2011). New eolian red clay sequence on the western Chinese Loess Plateau linked to onset of Asian desertification about 25 Ma ago. Sci. China Earth Sci. 54, 136–144. doi: 10.1007/s11430-010-4126-5
Qiu, Y. X., Fu, C. X., and Comes, H. P. (2011). Plant molecular phylogeography in China and adjacent regions: tracing the genetic imprints of Quaternary climate and environmental change in the world’s most diverse temperate flora. Mol. Phylogenet. Evol. 59, 225–244. doi: 10.1016/j.ympev.2011.01.012
Ronquist, F., Teslenko, M., van der Mark, P., Ayres, D. L., Darling, A., Höhna, S., et al. (2012). MrBayes 3.2: efficient bayesian phylogenetic inference and model choice across a large model space. Syst. Biol. 61, 539–542. doi: 10.1093/sysbio/sys029
Rowley, D. B., Pierrehumbert, R. T., and Currie, B. S. (2001). A new approach to stable isotope-based paleoaltimetry: implications for paleoaltimetry and paleohypsometry of the High Himalaya since the Late Miocene. Earth Planet. Sci. Lett. 188, 253–268. doi: 10.1016/s0012-821x(01)00324-7
Ruddiman, W. F., and Kutzbach, J. E. (1991). Plateau uplift and climatic change. Sci. Am. 264, 66–75. doi: 10.1038/scientificamerican0391-66
Saylor, J. E., Quade, J., Dettman, D. L., DeCelles, P. G., Kapp, P. A., and Ding, L. (2009). The late miocene through present paleoelevation history of southwestern Tibet. Am. J. Sci. 309, 1–42. doi: 10.2475/01.2009.01
Schneider, S., and Excoffier, L. (1999). Estimation of past demographic parameters from the distribution of pairwise differences when the mutation rates very among sites: application to human mitochondrial DNA. Genetics 152, 1079–1089.
Shahzad, K., Jia, Y., Chen, F. L., Zeb, U., and Li, Z. H. (2017). Effects of mountain uplift and climatic oscillations on phylogeography and species divergence in four endangered Notopterygium Herbs. Front. Plant Sci. 8:1929. doi: 10.3389/fpls.2017.01929
Shaw, J., Lickey, E. B., Beck, J. T., Farmer, S. B., Liu, W., Miller, J., et al. (2005). The tortoise and the hare II: relative utility of 21 noncoding chloroplast DNA sequences for phylogenetic analysis. Am. J. Bot. 92, 142–166. doi: 10.3732/ajb.92.1.142
Shaw, J., Lickey, E. B., Schilling, E. E., and Small, R. L. (2007). Comparison of whole chloroplast genome sequences to choose noncoding regions for phylogenetic studies in angiosperms: the tortoise and the hare III. Am. J. Bot. 94, 275–288. doi: 10.3732/ajb.94.3.275
Shepard, D. B., and Burbrink, F. T. (2008). Lineage diversification and historical demography of a sky island salamander, Plethodon ouachitae, from the Interior Highlands. Mol. Ecol. 17, 5315–5335. doi: 10.1111/j.1365-294X.2008.03998.x
Sklenar, P., Hedberg, I., and Cleef, A. M. (2014). Island biogeography of tropical alpine floras. J. Biogeogr. 41, 287–297. doi: 10.1111/jbi.12212
Soltis, P. S., and Soltis, D. E. (1991). Genetic Variation in Endemic and Widespread Plant Species. Aliso 13, 215–223. doi: 10.5642/aliso.19911301.10
Song, G., Zhang, R. Y., Qu, Y. H., Wang, Z., Dong, L., Kristin, A., et al. (2016). A zoogeographical boundary between the Palaearctic and Sino-Japanese realms documented by consistent north/south phylogeographical divergences in three woodland birds in eastern China. J. Biogeogr. 43, 2099–2112. doi: 10.1111/jbi.12758
Sun, B. N., Wu, J. Y., Liu, Y. S., Dinga, S.-T., Lia, X.-C., Xiea, S.-P., et al. (2011). Reconstructing Neogene vegetation and climates to infer tectonic uplift in western Yunnan, China. Paleogeogr. Paleoclimatol. Paleoecol. 304, 328–336. doi: 10.1016/j.palaeo.2010.09.023
Sun, X., and Wang, P. (2005). How old is the Asian monsoon system? Paleobotanical records from China. Paleogeogr. Paleoclimatol. Paleoecol. 222, 181–222. doi: 10.1016/j.palaeo.2005.03.005
Sun, Y. S., Wang, A. L., Wan, D. S., Wang, Q., and Liu, J. Q. (2012). Rapid radiation of Rheum (Polygonaceae) and parallel evolution of morphological traits. Mol. Phylogenet. Evol. 63, 150–158. doi: 10.1016/j.ympev.2012.01.002
Taberlet, P., Fumagalli, L., Wust-Saucy, A. G., and Cosson, J. F. (1998). Comparative phylogeography and postglacial colonization routes in Europe. Mol. Ecol. 7, 453–464. doi: 10.1046/j.1365-294x.1998.00289.x
Tajima, F. (1989). Statistical-method for testing the neutral mutation hypothesis by dna polymorphism. Genetics 123, 585–595. doi: 10.1101/gad.3.11.1801
Tapponnier, P., Xu, Z. Q., Roger, F., Meyer, B., Arnaud, N., Wittlinger, G., et al. (2001). Geology - Oblique stepwise rise and growth of the Tibet plateau. Science 294, 1671–1677. doi: 10.1126/science.105978
Tzedakis, P. C. (2002). Buffered tree population changes in a Quaternary Refugium: evolutionary implications. Science 297, 2044–2047. doi: 10.1126/science.1079388
Wan, S. M., Li, A. C., Clift, P. D., and Stuut, J. B. W. (2007). Development of the east asian monsoon: mineralogical and sedimentologic records in the northern South China Sea since 20 Ma. Paleogeogr. Paleoclimatol. Paleoecol. 254, 561–582. doi: 10.1016/j.palaeo.2007.07.009
Wang, H., Qiong, L., Sun, K., Lu, F., Wang, Y., Song, Z., et al. (2010). Phylogeographic structure of Hippophae tibetana (Elaeagnaceae) highlights the highest microrefugia and the rapid uplift of the Qinghai-Tibetan Plateau. Mol. Ecol. 19, 2964–2979. doi: 10.1111/j.1365-294X.2010.04729.x
Wang, L. Y., Ikeda, H., Liu, T. L., Wang, Y. J., and Liu, J. Q. (2009). Repeated range expansion and glacial endurance of Potentilla glabra (Rosaceae) in the Qinghai-Tibetan Plateau. J. Integr. Plant Biol. 51, 698–706. doi: 10.1111/j.1744-7909.2009.00818.x
Wang, X. X., Yue, J. P., Sun, H., and Li, Z. M. (2011). Phylogeographical Study on Eriophyton wallichii (Labiatae) from Alpine Scree of Qinghai-Tibetan Plateau. Plant Divers. Resour. 33, 605–614. doi: 10.1093/mp/ssq070
Wang, Y. J., Susanna, A., Von Raab-Straube, E., Milne, R., and Liu, J. Q. (2009). Island-like radiation of Saussurea (Asteraceae: Cardueae) triggered by uplifts of the Qinghai-Tibetan Plateau. Biol. J. Linn. Soc. 97, 893–903. doi: 10.1111/j.1095-8312.2009.01225.x
Wen, J., Yu, Y., Xie, D. F., Peng, C., Liu, Q., Zhou, S. D., et al. (2020). A transcriptome-based study on the phylogeny and evolution of the taxonomically controversial subfamily Apioideae (Apiaceae). Ann. Bot. 125, 937–953. doi: 10.1093/aob/mcaa011
White, T. J., Bruns, S., Lee, S., and Taylor, J. (1990). “Amplification and direct sequencing of fungal ribosomal RNA genes for phylogenetics,” in PCR Protocols, A Guide to Methods and Application, eds M. A. Innis, D. H. Gelfand, J. J. Sninsky, and T. J. White (New York, NY: Academic Press), 315–322. doi: 10.1016/B978-0-12-372180-8.50042-1
Wu, F. L., Fang, X. M., Ma, Y. Z., Herrmann, M., Mosbrugger, V., An, Z. S., et al. (2007). Plio-Quaternary stepwise drying of Asia: evidence from a 3-Ma pollen record from the Chinese Loess Plateau. Earth Planet. Sci. Lett. 257, 160–169. doi: 10.1016/j.epsl.2007.02.029
Wu, Z. Y., Sun, H., Zhou, Z. K., Li, D. Z., and Peng, H. (2011). Floristics Seed Plants From China. Beijing: Science Press.
Xie, C., Xie, D. F., Zhong, Y., Guo, X. L., Liu, Q., Zhou, S. D., et al. (2018). The effect of Hengduan Mountains Region (HMR) uplift to environmental changes in the HMR and its eastern adjacent area: tracing the evolutionary history of Allium section Sikkimensia (Amaryllidaceae). Mol. Phylogenet. Evol. 130, 380–396. doi: 10.1016/j.ympev.2018.09.011
Xu, J., Deng, M., Jiang, X. L., Westwood, M., Song, Y.-G., and Turkington, R. (2015). Phylogeography of Quercus glauca (Fagaceae), a dominant tree of East Asian subtropical evergreen forests, based on three chloroplast DNA interspace sequences. Tree Genet. Genomes 11:805. doi: 10.1007/s11295-014-0805-2
Xu, T. T., Abbott, R. J., Milne, R. I., Mao, K., Du, F. K., Wu, G., et al. (2010). Phylogeography and allopatric divergence of cypress species (Cupressus L.) in the Qinghai-Tibetan Plateau and adjacent regions. BMC Evol. Biol. 10:10. doi: 10.1186/1471-2148-10-194
Yang, F. S., Li, Y. F., Ding, X., and Wang, X. Q. (2008). Extensive population expansion of Pedicularis longiflora (Orobanchaceae) on the Qinghai-Tibetan Plateau and its correlation with the Quaternary climate change. Mol. Ecol. 17, 5135–5145. doi: 10.1111/j.1365-294X.2008.03976.x
Yang, F. S., Qin, A. L., Li, Y. F., and Wang, X. Q. (2012). Great Genetic Differentiation among Populations of Meconopsis integrifolia and Its implication for plant speciation in the Qinghai-Tibetan Plateau. PLoS One 7:e37196. doi: 10.1371/journal.pone.0037196
Yang, L. Q., Hu, H. Y., Xie, C., Lai, S.-P., Yang, M., He, X.-J., et al. (2016). Molecular phylogeny, biogeography and ecological niche modelling of Cardiocrinum (Liliaceae): insights into the evolutionary history of endemic genera distributed across the Sino-Japanese floristic region. Ann. Bot. 119, 59–72. doi: 10.1093/aob/mcw210
Yu, X. Q., Maki, M., Drew, B. T., Paton, A. J., and Li, H. W. (2014). Phylogeny and historical biogeography of Isodon (Lamiaceae): rapid radiation in south-west China and Miocene overland dispersal into Africa. Mol. Phylogenet. Evol. 77, 183–194. doi: 10.1016/j.ympev.2014.04.017
Yu, Y., Blair, C., and He, X. (2020). RASP 4: ancestral state reconstruction tool for multiple genes and characters. Mol. Biol. Evol. 37, 604–606. doi: 10.1093/molbev/msz257
Zhang, M. L., Meng, H. H., Zhang, H. X., Vyacheslav, B. V., and Sanderson, S. C. (2014). Himalayan origin and evolution of Myricaria (Tamaricaeae) in the Neogene. PLoS One 9:e97582. doi: 10.1371/journal.pone.0097582
Zhang, P. Z., Shen, Z., Wang, M., Gan, W., Buñrgmann, R., Molnar, P., et al. (2004). Continuous deformation of the Tibetan Plateau from global positioning system data. Geology 32, 809–812. doi: 10.1130/g20554.1
Zhang, Q. H., Ding, L., and Willems, H. (2012). Initial India-Asia Continental Collision and Foreland Basin Evolution in the Tethyan Himalaya of Tibet: evidence from Stratigraphy and Paleontology (vol 120, pg 175, 2012). J. Geol. 120:347. doi: 10.1086/665732
Zhang, X. M., and He, X. J. (2013). Phylogeography of Angelica nitida (Apiaceae), an endemic to the Qinghai-Tibet Plateau. Plant Divers. Resour. 35, 505–512. doi: 10.11983/CBB16158
Zhang, Y. L., Li, B. Y., and Zheng, D. (2002). A discussion on the boundary and area of the Tibetan Plateau in China. Geogr. Res. 21, 1–18. doi: 10.3321/j.issn:1000-0585.2002.01.001
Zhang, Z. Q., and Sun, J. M. (2011). Palynological evidence for Neogene environmental change in the foreland basin of the southern Tianshan range, northwestern China. Glob. Planet. Change 75, 56–66. doi: 10.1016/j.gloplacha.2010.10.006
Zhao, C., Wang, C. B., Ma, X. G., Liang, Q. L., and He, X. J. (2013). Phylogeographic analysis of a temperate-deciduous forest restricted plant (Bupleurum longiradiatum Turcz.) reveals two refuge areas in China with subsequent refugial isolation promoting speciation. Mol. Phylogen. Evol. 68, 628–643. doi: 10.1016/j.ympev.2013.04.007
Zheng, H. B., Powell, C. M., An, Z. S., Zhou, J., and Dong, G. R. (2000). Pliocene uplift of the northern Tibetan Plateau. Geology 28, 715–718.
Keywords: Chamaesium, phylogeography, phylogeny, Himalayan-Hengduan Mountains, species distribution modeling
Citation: Zheng H-Y, Guo X-L, Price M, He X-J and Zhou S-D (2021) Effects of Mountain Uplift and Climatic Oscillations on Phylogeography and Species Divergence of Chamaesium (Apiaceae). Front. Plant Sci. 12:673200. doi: 10.3389/fpls.2021.673200
Received: 27 February 2021; Accepted: 07 April 2021;
Published: 24 May 2021.
Edited by:
Shilong Chen, Northwest Institute of Plateau Biology (CAS), ChinaReviewed by:
Gulzar Khan, University of Oldenburg, GermanyEduardo Ruiz-Sanchez, University of Guadalajara, Mexico
Copyright © 2021 Zheng, Guo, Price, He and Zhou. This is an open-access article distributed under the terms of the Creative Commons Attribution License (CC BY). The use, distribution or reproduction in other forums is permitted, provided the original author(s) and the copyright owner(s) are credited and that the original publication in this journal is cited, in accordance with accepted academic practice. No use, distribution or reproduction is permitted which does not comply with these terms.
*Correspondence: Xing-Jin He, xjhe@scu.edu.cn; Song-Dong Zhou, zsd@scu.edu.cn
†These authors have contributed equally to this work