Indices and screening tests for subclinical keratoconus.
Indices and screening tests are important to detect early keratoconus and corneal topography is certainly the reference examination that should be systematically performed as part of the preoperative assessment prior to refractive surgery. Iatrogenic corneal ectasia is the most dreaded complication after LASIK. Its most prominent risk factor is the presence of an undiagnosed condition evocative of subclinical keratoconus.
Side view of the Placido disk cupola (specular corneal topography)
NB : In the view of the author of this page, what is called « keratoconus » encompasses a broad spectrum of conditions all characterized by the presence of a corneal deformation. This deformation is caused primarily by eye rubbing. The various ways in intensity, duration, frequency in which (often allergic) patients rub their eyes explain the broad spectrum of corneal topographic changes, from minor to pronounced, from on eye to the other eye (the lack of intereye symmetry reflects the asymmetry in eye rubbing from one side to the other). See many cases supporting this conception here; https://defeatkeratoconus.com/portfolio-filtersearch/
The larger the deformation, the weaker the cornea has become. Performing LASIK on a weakened cornea can increase the corneal wall weakening, and in turn aggravate its deformation.
The minor topographic changes are causing diagnostic challenges, which will be referred here as « detection of subclinical keratoconus ».
Introduction
The detection of subclinical keratoconus is one of the most important step in the preoperative evaluation of a refractive surgery candidate to avoid iatrogenic ectasia. This complication induces similar clinical features to those of keratoconus. Topographically, it usually corresponds to progressive increase of the curvature in the inferior paracentral zone, inducing a decline in best corrected visual acuity. Based on a large series of cases reported in the literature, Randleman et al. (1) proposed a score that can be used to predict the risk of ectasia (Ectasia Risk Score) in order to prevent the development of post-LASIK corneal ectasia. This score takes into account the preoperative topographic appearance, the preoperative central corneal thickness, the residual posterior wall, the patient’s age, and the planned correction.
Among these various parameters, the presence of undiagnosed early keratoconus is the main risk factor for post-LASIK ectasia (2).
Many topographic keratoconus screening tests have been developed to help the clinician to more accurately identify the earliest forms of this disease. These tests are designed to identify topographic criteria allowing even earlier diagnosis of keratoconus at a subclinical stage. Although advanced forms of keratoconus generally do not raise any diagnostic difficulties, no subjective method of topographic mapping is currently available to reliably detect or exclude the presence of early keratoconus, which can be attributed to the following elements:
– the quality of the examination (patient movements or blinking that interfere with interpretation of the examination)
– defective perception or analysis by the clinician
– stage of keratoconus: the early topographic changes of the disease are difficult to detect and characterize: automated screening indices are designed to provide an objective aid to the detection of early subclinical forms.
It should also be stressed that some corneal anomalies can have the same topographic expression as early keratoconus (corneal warpage), and that some healthy corneas can also present isolated topographic variations, with an identical appearance to those observed during early keratoconus (e.g.: inferior steepening of the cornea, skewed radial axes, etc.). Regardless of the criteria adopted, it is impossible at the present time to design an objective method able to totally eliminate incorrectly classified corneal topographies (false-negative and false-positive). However, the role of topographic screening tests is to reduce to a minimum the number of incorrectly classified corneal topographies.
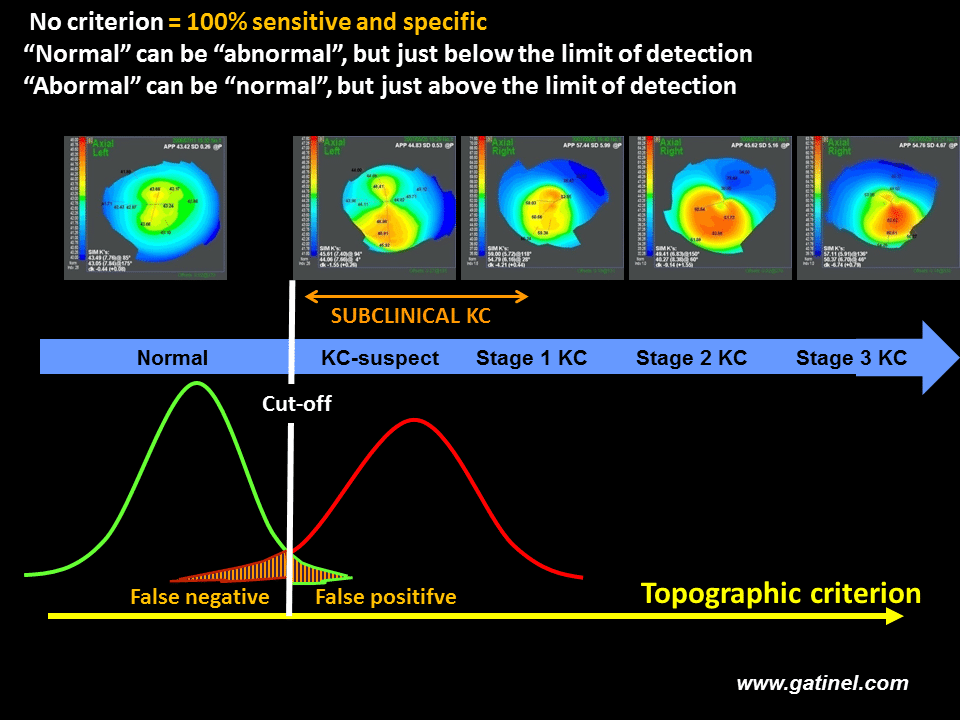
For an isolated index (or a group of indices), and regardless of the cut-off value adopted, a screening method based on a cut-off value is unable to discriminate between two populations (green: reference population, red: population with subclinical keratoconus), which, by definition, present similar characteristics. Comparison of the distributions of the values of the index in each population generally reveals a normal distribution and an overlap between the two populations. However, the cut-off value can be adjusted in order to minimize the false-positive and false-negative rates.
This page deals with the topographic indices and screening tests that have been proposed to facilitate early identification of subclinical keratoconus. The terms “test” and “index” are sometimes used interchangeably in the context of screening.
According to a more rigorous definition, a test is an operation designed to provide a positive or negative result or a diagnostic probability. A test is based on the use of one or several numerical indices, which are then combined to produce a qualitative verdict, or a global numerical score. The verdict depends on the value of the score with respect to the defined cut-off value of the test. A test can also consist of a neural network, or a decision tree, into which are entered the values of various numerical indices. A test generally provides a qualitative or semiquantitative result (diagnostic probability of a particular disease).
This type of test is generally called an index, named after the person who designed the test (e.g. Rabinowitz’s indices), which contributes to the implicit confusion between “test” and “index”. The reader must remember that whenever he or she compares the value of an index to a defined cut-off, he/she performs a test!
History and terminology
Amsler classification
Amsler proposed the first classification of various stages of keratoconus: he used a photographic system equipped with a Placido disk (3). He initially distinguished two groups of keratoconus: one in which keratoconus is associated with detectable clinical signs (visible deformity on biomicroscopic examination, Fleischer’s ring, etc.), and the other in which the diagnosis can only be established by examination of the reflection of Placido rings, thereby anticipating the subsequent importance of corneal topography in this disease. In this second group of keratoconus, which can possibly be described as subclinical, Amsler called the earliest forms observed on examination of reflection of Placido rings “forme fruste” keratoconus.
The introduction of computerized corneal topography subsequently demonstrated the existence of a continuum between the examinations obtained in normal subjects and those with keratoconus.
Since then, terms such as “subclinical keratoconus”, “keratoconus-suspect”, “forme fruste keratoconus”, have been commonly and interchangeably used to describe early forms of keratoconus or forms sharing certain minor features of keratoconus. We have proposed generalizing the term “subclinical keratoconus” to all corneas in which the phenotypic expression of keratoconus is sufficiently minor to remain asymptomatic (4). Subclinical keratoconus is a topographic diagnosis: forme fruste keratoconus constitutes the earliest form of subclinical keratoconus; it cannot be detected by automated Placido topography and requires analysis of posterior corneal topography and corneal wall thickness variations. Early diagnosis of subclinical keratoconus therefore depends on the technology used to obtain topographic data. For example, some forms labelled as keratoconus-suspect in the 1990s would now be described as early forms of clinical keratoconus.
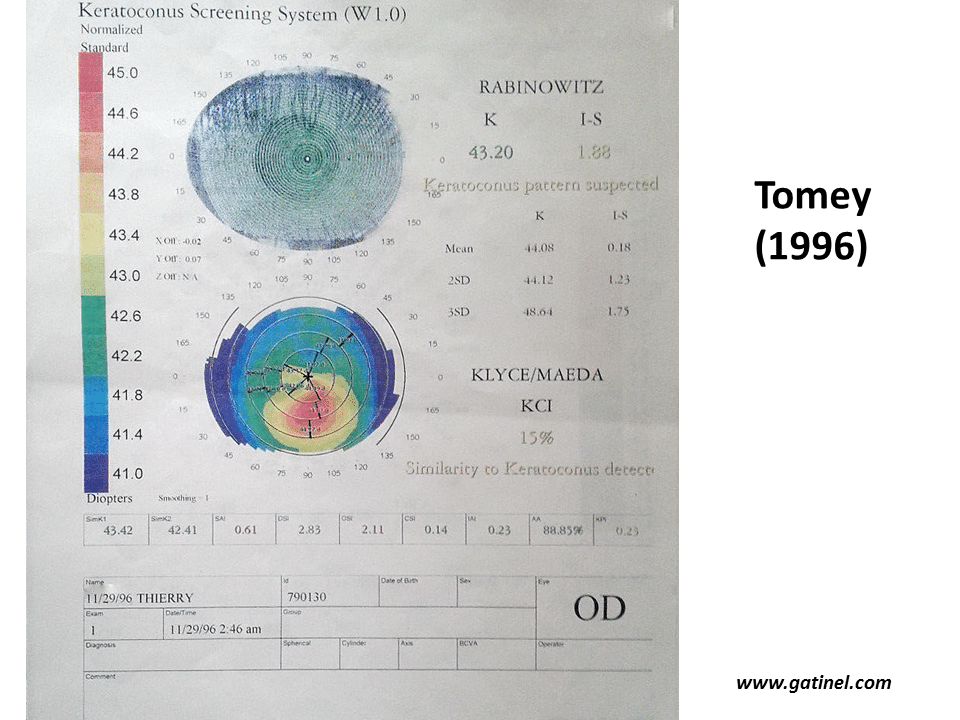
Example of the verdict of the automated keratoconus screening system used in 1996 on the TMS-2 topographer (Tomey): the appearance of the colourimetric map strongly suggests the presence of early but true keratoconus. The verdict of Rabinowitz and Klyce/Maeda automated indices is that of keratoconus-suspect.
This diagnosis implicitly introduces the concept of the risk of post-LASIK ectasia. The definition of forme fruste keratoconus will undoubtedly evolve in the future, as new tests become accepted as new standards for the detection of early subclinical forms of keratoconus.
NB : in the humble opinion of this website owner, eye rubbing is a « sine qua non » cause for keratoconus. Hence, the topographic abnormalities which will be discussed further and considered to correspond to some step in the broad spectrum of a disease named keratoconus could all be simply the consequences of vigorous and chronic eye rubbing. Eye rubbing results in the progressive shearing of the collagen fibers of the corneal stroma, which induces the biomechanical weakening of the corneal dome and promote ectasia susceptibility.
Rabinowitz indices
In the beginning of the 1990s, Rabinowitz et al. established Placido topographic (5) patterns suggestive of early keratoconus, and proposed quantitative indices (e.g. the I-S index) in order to obtain precise numerical cut-off values for test results to define the presence of a topographic form of keratoconus-suspect (6, 7). The fact that Placido topography was developed first, in the middle of the 1980s, partly explains the importance attributed to the anterior surface of the cornea for the positive diagnosis and differential diagnosis of keratoconus (8, 9). The introduction of corneal elevation topography at the end of the 1990s provided clinicians with new data derived from pachymetry and posterior elevation, which can also suggest the presence of keratoconus-suspect (10). Increased central thinning and more marked elevation in relation to the reference sphere were generally observed on the anterior surface and especially on the posterior surface in corneas in which Placido topography was suggestive of keratoconus (11-13). By studying the anterior and posterior corneal elevation characteristics of keratoconus-suspect corneas on Placido topography (objective diagnosis based on Klyce/Maeda criteria), we have demonstrated statistically significant differences with corneas in which anterior topography was considered to be normal. These differences were based on the use of a particular mode of representation of corneal elevation, called aconic; the reference surface used is not spherical, but aspherical and toric. This mode allows more sensitive demonstration of topographic patterns related to surface asymmetry (effects of asphericity and toricity are absorbed by the reference surface).
When anterior Placido topography is considered to be normal (not suspicious of keratoconus), but the cornea is thinner with posterior steepening, the possibility a very early form of subclinical keratoconus cannot be excluded. We have shown that normal Placido topography (according to current criteria: Klyce/Maeda criteria) in no way excluded the possibility of a very early subclinical form (forme fruste) of keratoconus, and we have developed a discriminant analysis model to perform a screening test based on corneal elevation and thickness data (14).
Consistent with these findings and to eliminate any semiological confusion, we reserve the term “keratoconus-suspect” for objectively “suspect” forms, i.e. positive test (or higher than the cut-off) for keratoconus-suspect on Placido topography, according to validated criteria (Rabinowitz’s criteria, Klyce/Maeda criteria): keratoconus-suspect is therefore synonymous with Placido-suspect.
The following table sumarizes the main features of this classification :
| Healthy cornea | Forme fruste keratoconus | Keratoconus-suspect | Clinical keratoconus | |
| Clinical or biomicroscopic signs | NO | NO | NO | YES |
| Detection by Placido topography | NO | NO | YES | YES |
| Detection by elevation topography and pachymetry | NO | YES | YES | YES |
The term “forme fruste” designates topographic forms that raise little or no suspicion, but which are known to constitute a minor form of the disease, either because of the minimal Placido topographic abnormalities, i.e. below the accepted limit of detection for keratoconus-suspect, but other suggestive tomographic or topographic abnormalities (thickness) are present (15), or because of a suggestive clinical context. For example, in a patient presenting keratoconus in one eye, when the cornea of the fellow eye presents a negative test based on Placido topography data, this cornea can be considered to present forme fruste keratoconus, even if the phenotypic expression of keratoconus in this eye is below the limit of detection according to the same criteria.
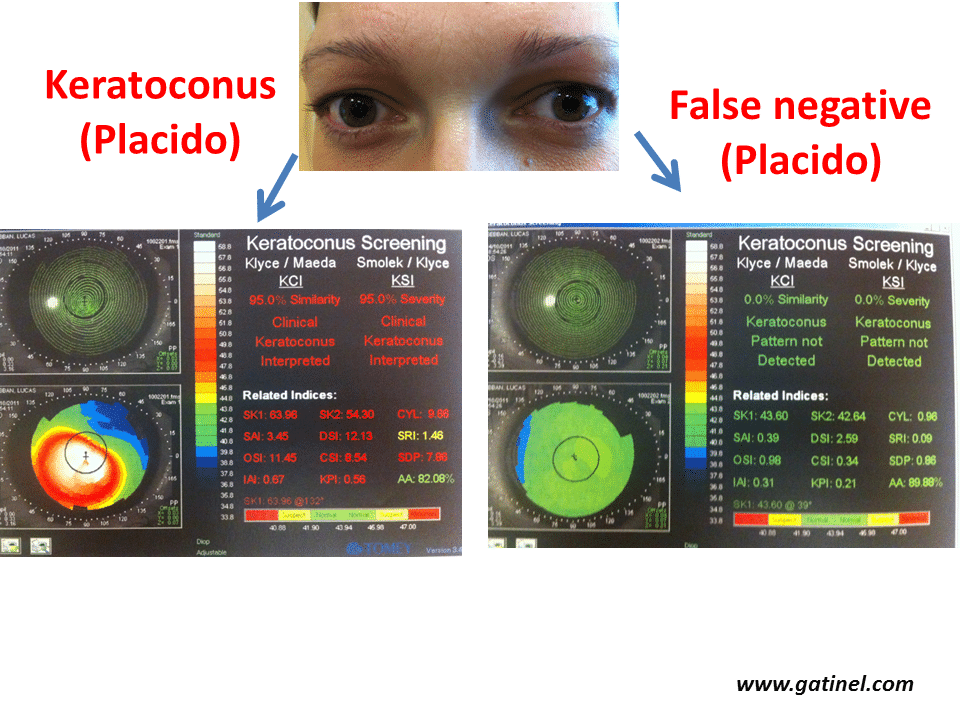
Example of definite forme fruste forms of keratoconus (left eye). The right eye presents advanced keratoconus, while the right eye presents a very early subclinical form, as the values for all indices are below the defined cut-offs (Klyce/Maeda and Smolek/Klyce indices, Keratoconus Screening neural network, Magellan topographer, Nidek, Japan). This eye can be considered to be false-negative for these tests.
Similarly, progression of a cornea initially considered to be normal (Placido topography negative for keratoconus) towards a clinical form of keratoconus can lead to a retrospective interpretation of the initial examination as forme fruste keratoconus. Detailed topographic documentation of these clinical situations is essential, as it allows the definition of new cut-offs or new criteria (indices).
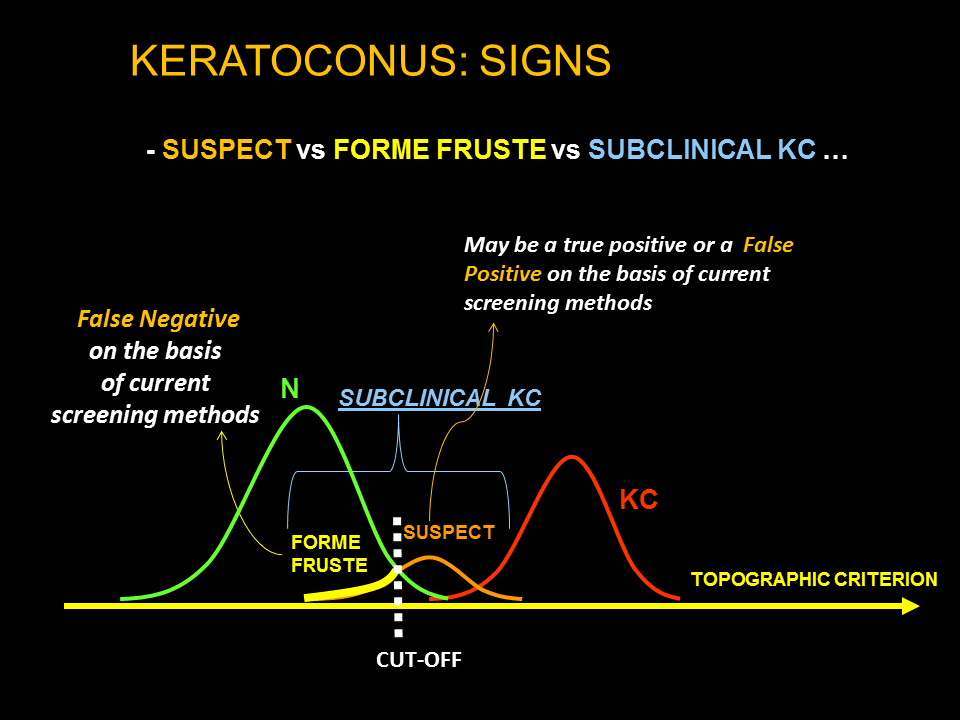
Schematic representation of groups of interest, the distribution of the values of the index, and the verdict based on the value of the index with respect to a cut-off in the context of automated keratoconus screening based on corneal topography indices. Forme fruste keratoconus is not detected, at a given limit of detection, by a validated test recognized by the ophthalmological community. Corneas with a value just beyond the cut-off may correspond to true keratoconus, normal corneas (false-positive) or true subclinical keratoconus (true positives).
The study of the biomechanical properties of these corneas (hysteresis) is a promising alternative approach to facilitate the early detection of subclinical keratoconus (16).
As emphasized above, it must be kept in mind that these nosological distinctions are not immutable: the terminology used depends on the quality of the tests used and can vary over time, or with the topography system used. Regardless of progress in this field, keratoconus-suspect, by definition, will remain topographically more advanced than forme fruste keratoconus, but the screening indices proposed to facilitate the identification of early forms of keratoconus must be able to detect forme fruste keratoconus.
Topographic indices
Background
A topographic index is a numerical value calculated from analysis of the data obtained by topography. Topographic indices allow more quantitative analysis of topographic data and use explanatory variables to perform statistical tests designed to distinguish the population of corneas presenting subclinical keratoconus from normal corneas (discriminant analysis). Mean simulated keratometry (Sim K) is an example of a topographic index, as, in addition to the estimation of the mean apical keratometric power that it provides, this parameter can be indicative of the presence of keratoconus beyond certain cut-off values (e.g. 53 D). Moreover, most indices were initially proposed to facilitate the detection of keratoconus, and their cut-offs were defined from preliminary studies, or were integrated into predictive statistical models. Other fields of application have been developed, ranging from the study of the quality of the topographic examination to the detection of various corneal diseases and conditions (pellucid marginal degeneration, previous photoablative surgery, etc.)
Categories of indices
The various indices can be classified as a function of the type of data from which they are calculated:
- Global indices: they are calculated from all of the topographic data derived from the corneal surface studied (e.g. Q asphericity factor)
- Local indices: they are calculated from partial/local topographic data (e.g. I-S index)
- Composite indices: they are calculated from the values of several indices (e.g. KISA%).
The first indices proposed for keratoconus screening were local indices (6), but in view of their low specificity at cut-offs allowing adequate sensitivity, composite indices were subsequently developed (e.g. KISA%) (15).
In the absence of standardization between the various manufacturers, types of maps, scales, etc., the majority of indices (particularly composite indices) are specific to a particular type of topographer. However, some indices, developed by independent investigators, are common to various topography systems.
Sensitivity and specificity of screening tests
The development of efficient screening techniques is designed to overcome the problems related to detection of early forms of keratoconus. To assess the efficacy of screening techniques, i.e. their ability to detect early forms of keratoconus by discriminating them from healthy corneas, various indices can be studied in a population of corneas comprising a proportion of early forms of keratoconus, as well as normal corneas. These topographic screening tests were therefore performed in a group of patients known to present keratoconus in order to define the variables of interest and their cut-off values.
Isolated analysis of the values of certain topographic variables is not sufficient to reliably discriminate between healthy corneas and corneas with subclinical keratoconus. Calculation of the mean of any non-composite index (e.g. Sim-K) in a reference healthy population may be informative because it provides an overview of the median value of this parameter. However, it is also essential to determine the scatter of these values (e.g. standard deviation), which, to a certain degree, reflects the homogeneity of the group in relation to this index. This mean and this standard deviation can then be compared with those of a population of pathological corneas. When comparing healthy corneas and corneas with early forms of keratoconus, although the two groups present different means, there is a considerable overlap of values, regardless of the index used. It would be reasonable to postulate that this overlap of values would be even more marked for very early forms, corresponding to the earliest stages of the disease.
Even when a so-called “statistically significant” difference is observed between the values of the index measured in the two groups, the essential question that must be resolved is: what cut-off value of this index should be used to diagnose the presence of early subclinical keratoconus? If an excessively high cut-off value is used, a large number of corneas could be missed (increased false-negative rate, decreased sensitivity). An excessively low cut-off value is associated with the opposite risk: normal corneas could be considered to be pathological (increased false-positive rate, decreased specificity).
The combination of a number of indices within a so-called “discriminant” function could allow more effective classification of lesions than that based on a single index: this type of analysis is called “predictive discriminant analysis”. This statistical technique is designed to predictively attribute a population of individuals to several predefined groups based on a series of predictive variables (in this case topographic indices expressed as numerical values). Linear combinations of these predictive variables are used to construct a final score and the value of this score is compared to a cut-off that has been carefully defined to discriminate the various individuals measured as precisely as possible, for example normal corneas vs keratoconus.
Construction of a neural network is another method designed to classify a subject within a group on the basis of successive tests, in which one or several indices are used and compared to a predefined cut-off value. The neural network is constructed according to a set of data (in this case topographic indices) on corneas for which some of the characteristics are already known. Neural network training from a sufficient number of topographic data can define characteristics that can be used to establish effective segregation to test new maps: neural networks are often represented by a group of neurons (each neuron corresponding to a particular test operation) connected by arrows indicating transfer of information within the network. For example, depending on the value of a first predetermined index, the corneal topography studied is classified into one of several subgroups. A second test (using another index) is then performed and a new layer is created to refine the diagnosis. A final diagnosis may be established according to the direction of the connections in the network.
In contrast with methods based on linear discriminant analysis, the order in which the successive tests are performed has an impact on the output. Regardless of the methodology used, the choice of cut-off is particularly important in order to ensure optimal test performance. However, no cut-off is perfectly discriminant: an excessively low cut-off can wrongly consider a high proportion of normal corneas to be pathological and an excessively high cut-off will miss too many pathological corneas that are incorrectly considered to be normal. For example, the degree of central curvature of the cornea could be used as an index of the presence of an early form of keratoconus.
The use of a simulated keratometry (Sim K) cut-off of 45 D for the detection of early keratoconus could result in overdiagnosis of this disease (without detecting all cases of early keratoconus). Using a Sim K cut-off of 49 D would certainly be more selective, but less sensitive, as a large number of pathological corneas would not be considered to be suspect on this simple test. One solution to increase the discriminant capacity consists of adding another variable. For example, taking into account the asphericity factor (Q) in addition to simulated keratometry should allow more accurate detection of early forms of keratoconus, which are characterized by increased apical curvature and a tendency to steeper decline of this curvature at the periphery (more prolate asphericity).
In general, increasing the number of variables results in more efficient, i.e. more discriminant tests, in which an optimal cut-off can be more easily defined. For this reason, the most efficient indices are composite indices (i.e. composed of several variables) in order to increase the probability of clearly discriminating subclinical and normal populations with the various tests used in these indices.
However, descriptive statistics techniques based on the collection and calculation of indices are not infallible, as they always comprise a proportion of patients in whom the cornea may be incorrectly classified. A false-negative (FN) result corresponds to a topographic examination that is considered to be normal, despite the presence of an early form of keratoconus, and a false-positive (FP) result corresponds to a topographic examination considered to be abnormal in the absence of keratoconus. Correctly classified corneas correspond to true negatives (TN) in the absence of keratoconus and true positives (TP) in the presence of keratoconus.
A good screening test is a test associated with a relatively small number of false-positive and false-negative results, which can therefore be considered to be sufficiently reliable. The performances of the examinations used to screen for any given disease can be measured by means of two criteria: sensitivity and specificity .
Sensitivity:
Sensitivity is a criterion that describes the capacity of the test to detect a particular disease. Sensitivity can be measured in a group of patients (keratoconus), selected independently of the test to be analysed. Sensitivity is expressed by a percentage between 0% and 100%, defined by the following ratio:
Sensitivity = TP/ (TP+FN)
0% indicates that the examination fails to detect the disease; 100% indicates that all pathological cases are detected (the test is constantly positive in affected subjects). The higher the sensitivity of the test, the lower is the proportion of subjects in whom the disease studied will not be detected.
Specificity:
Specificity is a criterion that describes the possibility of declaring a subject to be free of the disease studied. It corresponds to the proportion of true negatives (TN) in the overall population of healthy subjects.
Specificity = TN/ (TN+FP).
The higher the specificity and the closer it is to 100%, the lower is the false-positive rate and vice versa.
A specificity of 100% indicates that a healthy person is identified with certainty.
The best screening test would be a test with a specificity and a sensitivity both equal to 100% (no false-positives, no false-negatives). Unfortunately, no tests in medicine are perfectly accurate and each test is associated with a certain number of false-positive or false-negative results.
The false-negative rate must be minimized in order to lower the underdiagnosis rate, as it would be preferable to overdiagnose early keratoconus rather than underdiagnose forme fruste keratoconus. In more technical terms, in order to increase the efficacy of screening for subclinical keratoconus before refractive surgery, the sensitivity of the tests used must be sufficiently high to avoid missing poor candidates for LASIK (forme fruste keratoconus), who would be at increased risk of postoperative ectasia (false-negative). However, the specificity of these tests must not be too low to avoid overdiagnosis of early keratoconus, which would lead to the exclusion of patients who, in reality, would be good candidates for LASIK.
Finally, it should be stressed that, although the diagnosis of keratoconus is based on corneal topography, other elements such as biomicroscopic examination, family history (17, 18, 19) or a predisposing clinical context (7, 20) (atopy, trisomy 21, etc.), unstable refraction, repeated eye rubbing or trauma (the only must be required risk factor according to the author of this page), hysteresis values and a suggestive appearance of biomechanical signals (21), can also contribute to the diagnosis.
This chapter will be confined to a description of the principles governing the choice of topographic indices and the most commonly used screening tests. Many indices are still predominantly based on data derived from Placido topography and mainly depend on the anterior corneal surface. They can be used to diagnose keratoconus-suspect.
However, more recent studies have confirmed the value of criteria established from the study of corneal thickness and/or posterior corneal elevation, to increase the sensitivity of detection of subclinical keratoconus and to identify forms not detected by Placido topography (so-called forme fruste).
Criteria and screening tests for keratoconus-suspect
The first automated screening criteria were developed for Placido topography (particularly the TMS topographer from Tomey). They were based on determination of the curvature calculated at each point of the various meridians studied (the intersection of each meridian with the rings corresponding to reflection of the Placido disks defining a set of measuring points).
The topographic criteria initially proposed by Rabinowitz for rapid identification of keratoconus-suspect were purely qualitative. These features are presented in the following figure:
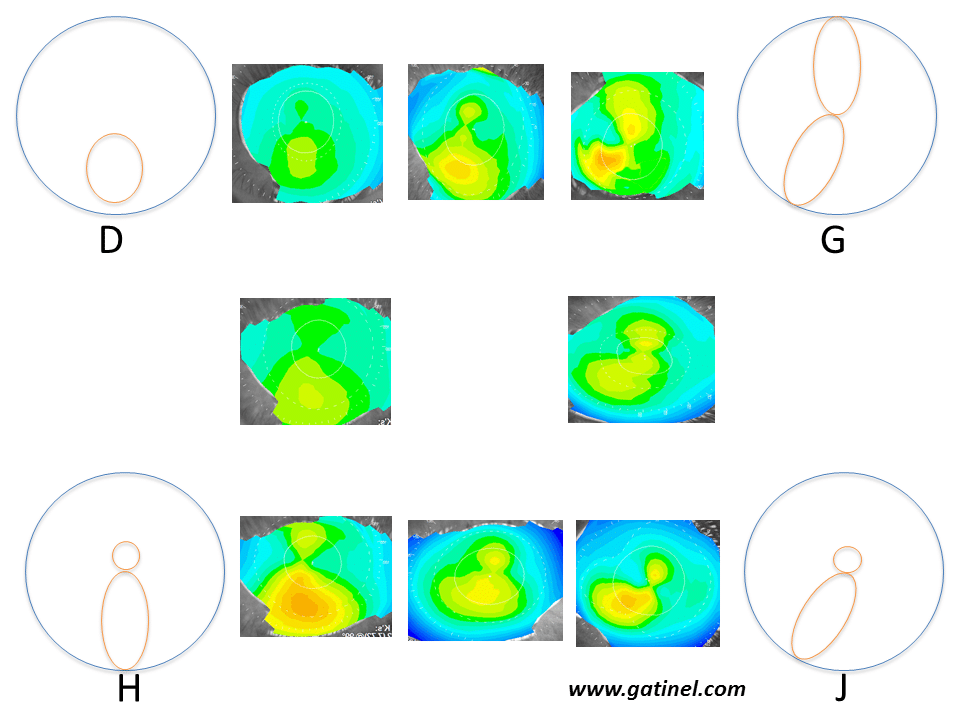
Schematic patterns and corresponding examples (with intermediate forms) of corneas at risk of subclinical keratoconus according to Rabinowitz et al. These appearances were obtained on axial curvature (Placido anterior corneal topography) using an absolute scale, and arbitrarily identified by a letter of the alphabet between A and J. Only appearances particularly suspicious of early keratoconus are presented here:
D: Isolated inferior steepness
G: Skewed Radial Axes (SRAX)
H: Asymmetric Bow tie (AB)
J: Combination of forms G and H: this pattern is designated by the acronym AB/SRAX: this appearance is a risk factor for progression to clinical keratoconus.
Note that areas of warm colour do not correspond to “bumps”, but regions in which the anterior corneal surface presents excessive steepness.
They were described from data recorded in relatives of patients with keratoconus (6), or eyes known to present early forms of keratoconus (sometimes retrospectively, after reviewing previous topographies performed before the onset of more obvious signs) (22). A TMS-1 topographer was used with an absolute scale ranging from 35 to 50 D in increments of 1.5 D (i.e. 10 colours); curvatures situated outside of this range of values were represented by 5 D. This is an important detail, as it is essential to remember that topographic patterns suggestive of keratoconus-suspect can be masked by an excessively large scale. The reliability of the topographic examination (adequate fixation) is also essential to correctly interpret these patterns. It is useful to recall these patterns, as they were the basis for certain quantitative criteria. The AB/SRAX pattern, comprising an asymmetric bow tie (AB) and Skewed Radial Axes (SRAX) is frequently observed (in about 80% of cases) on topography images of the “healthy” eye in patients with “unilateral” keratoconus. This pattern is associated with a greater than 50% risk of progression to clinical keratoconus and is used in the quantitative KISA% index.
Quantitative criteria
Central keratometry
Central keratometry (K) was calculated as the mean value of 768 data points distributed over rings 2, 3 and 4 of Placido topography. A central keratometry value greater than 47.2 D, and/or a central keratometry difference greater than 1 D between the two eyes provides other indices suggestive of the presence of forme fruste keratoconus. Other quantitative elements were subsequently proposed in order to increase the specificity of these indices (a considerable proportion of keratoconus-free corneas can present one or several these characteristics).
I-S index
This index is based on Placido topography data. It consists of averaging keratometric values obtained at various points of the superior hemicornea (I) and subtracting them from the mean of the points corresponding to the inferior hemicornea (S)
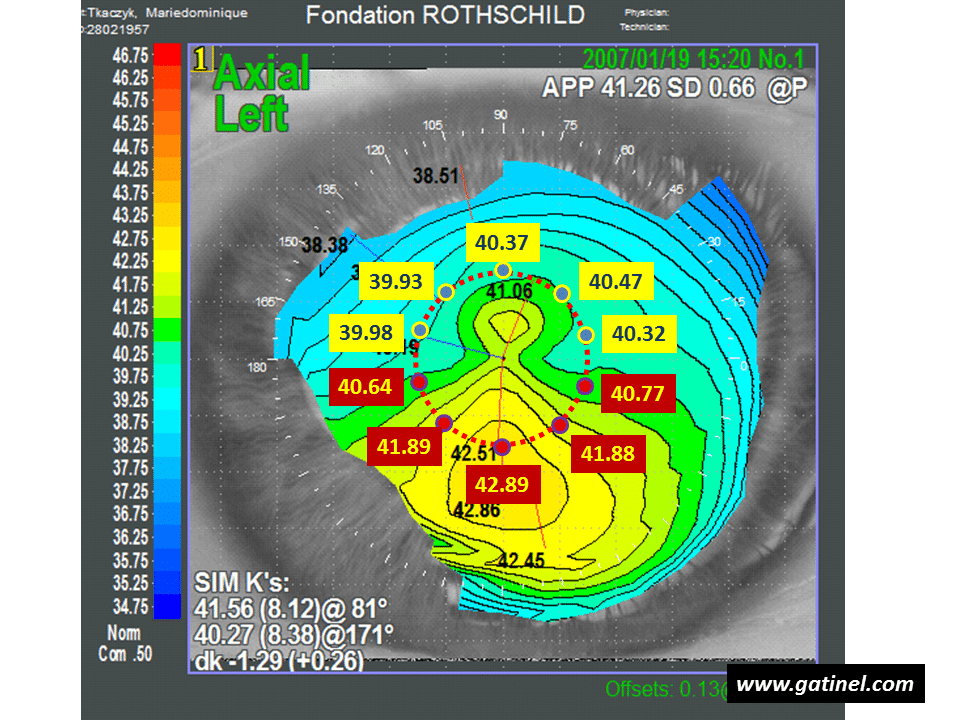
Calculation of the I-S index: the diameter of the circle centered on the vertex is 3 mm. The mean of values measured in the superior hemicornea is S = 40.214 D. The mean of values measured in the inferior hemicornea is I = 41.614 D. The (I-S) index is equal to 1.4 D. Despite keratometry values slightly lower than the mean, the (I-S) index indicates the presence of keratoconus-suspect.
It is calculated by the mean of the 5 keratometric values on the 3 mm central ring, at the intersection of the 210, 240, 270, 300 and 330 meridians. S is calculated according to the same principle on the 30, 60, 90, 120 and 150 meridians. Rabinowitz initially proposed a cut-off value of 1.2 D to suggest the possible presence of subclinical keratoconus, but a cut-off value of 1.4 D was subsequently adopted to more specifically distinguish between physiological asymmetry and the presence of subclinical keratoconus. An I-S value greater than 1.9 D is commonly associated with clinical keratoconus (visible thinning on the slit lamp, Fleischer ring, etc.). In order to increase the sensitivity of this index, it is recommended to place one of the points used to record keratometric values on the steepest inferior semimeridian.
Skewed Radial Axes (SRAX)
SRAX corresponds to the angle between the steepest semimeridians situated above and below the horizontal meridian in the same direction (when the semimeridians are aligned in the same direction, SRAX is equal to zero).
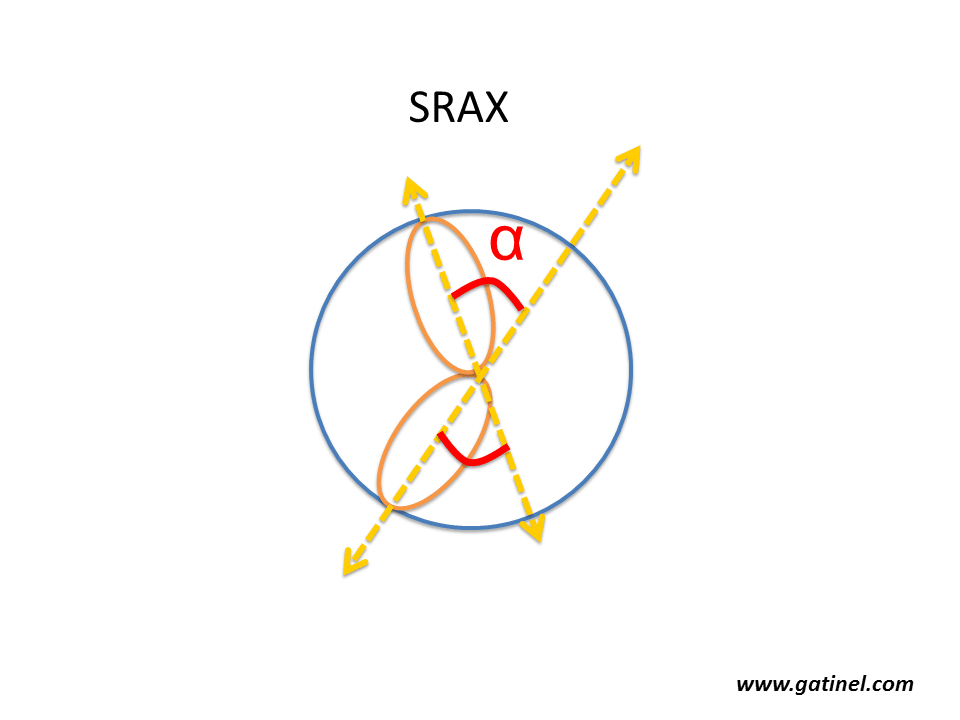
Calculation of SRAX (Radial Skewed Axes). The axis of the steepest semimeridian is identified in each hemicornea (superior and inferior). The SRAX angle is the most acute angle formed by the steepest semimeridians. This index is often determined manually, but is also calculated by the software of the Eyemap topographer (Alcon), which was equipped with a 22-ring Placido disk. SRAX indirectly reflects the partial nature of axial curvature measurements. This pattern is not observed on mean curvature or Gaussian maps.
The position of the steepest semimeridians is determined by taking into account the power measured at the intersection of the semimeridians with rings 5 to 16. According to Rabinowitz, an SRAX value greater than 21 eliminates the presence of early keratoconus.
KISA% index
The KISA% index was developed by Rabinowitz and Rasheed (17). It is based on the value, expressed in degrees, of the two steepest semimeridians (SRAX), as well as the values of maximum keratometry minus 47 D, keratometric astigmatism, and the I-S index. The formula used to calculate the composite KISA% index is:
KISA% = K x (I-S) x AST x SRAX x 0.3
where K = 1 when maximum keratometry is less than 47 D, (I-S) = 1 if (I-S)<1 and Ast =1 if Ast < 1.
According to Rabinowitz and Rasheed:
– KISA% < 60: normal cornea
– 60 < KISA% < 100: early keratoconus with no clinical signs
– KISA% > 100: keratoconus.
Other statistical indices (Placido topography)
Placido topography can be used to calculate the local keratometric power at a large number of points. Various indices can be calculated from these values, sometimes weighted by the corneal surface area concerned. These indices were initially provided by the TMS-1 topographer (22). The indices that can be affected by the presence of keratoconus are listed below (Table 2 indicates the range of normal values and suspect cut-off values, and Figure 8 represents a graphic interpretation of some of these indices).
Indices related to the degree of toricity of the corneal surface:
SimK1/SimK2: Simulated keratometry
Average keratometric powers of the steepest and flattest meridians in the paracentral zone (the power measured for each meridian is the mean power measured at rings 7, 8 and 9 of the TMS-1, which corresponds to a diameter close to 3 mm).
CYL: Simulated keratometric cylinder
Difference between SimK1 and SimK2 values.
Indices related to the degree of variation of keratometric power:
CVP: Coefficient of Variation of corneal Power
This index corresponds to the range of distribution of keratometric powers present on the analysed area around the mean: CVP = 1000 x (standard deviation of total corneal power (SDP) / mean total corneal power).
SDP: Standard Deviation of corneal Power
Value of the standard deviation of total corneal power
AA: Analysed Area
Value of the corneal area covered by the rings that can be analysed. It can be decreased in the presence of advanced keratoconus (excessive deformity of the rings).
Indices related to the degree of asphericity of the corneal surface:
CES: Corneal Eccentricity Index
This index corresponds to the calculated value of corneal eccentricity. Corneal eccentricity becomes increasingly prolate in the presence of keratoconic deformity.
Indices related to the degree of asymmetry and irregularity of the corneal surface:
DSI: Differential Sector Index
The corneal surface is divided into 8 equal sectors, each subtending an angle of 45°. The mean axial keratometric power is calculated for each sector. The DSI index is equal to the greatest difference between any of these sectors and is increased in the case of asymmetrical curvature.
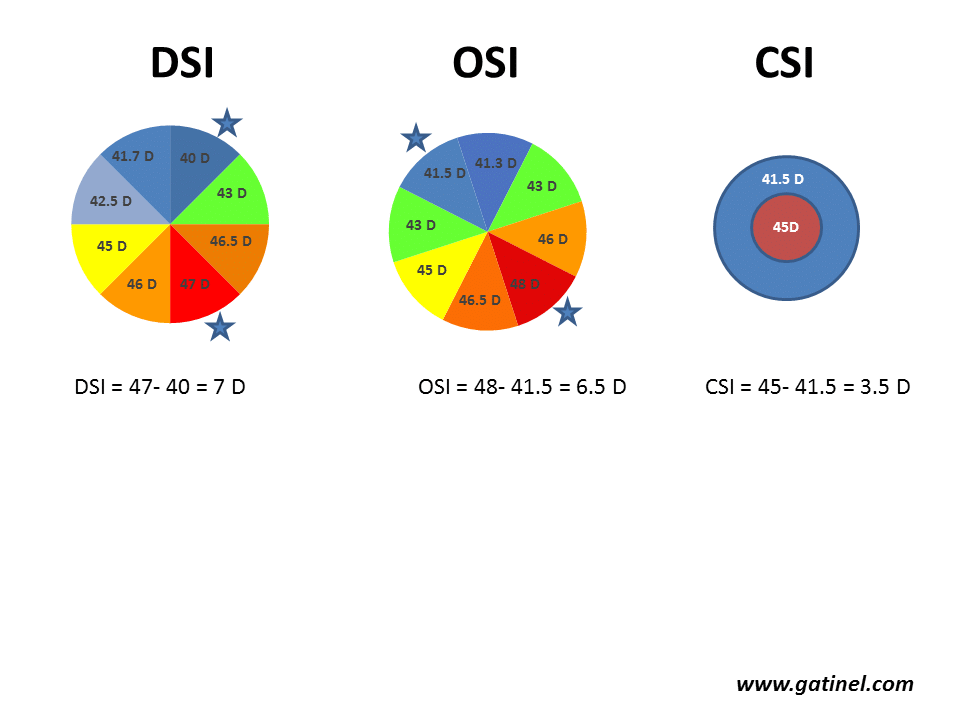
Calculation of the DSI, OSI and CSI indices. The corneal surface is divided into 8 arbitrary sectors (each subtending an angle of 45°). The mean axial curvature is calculated for each sector and is then repeated by rotating each sector until all possible patterns have been scanned (for example, if keratometry is analysed from points distributed according to 256 semimeridians, there will be 256/8 = 32 possible patterns). DSI (Differential Sector Index) corresponds to the maximum difference between any two sectors. OSI (Opposite Sector Index) corresponds to the maximum difference between two opposite sectors. CSI (Center/Surround Index) is the difference in the average area-corrected power between the central area (3.0 mm diameter) and an annulus surrounding the central area (3.0 to 6.0 mm).
SRI: Surface Regularity Index
The SRI is correlated with the potential visual acuity index (PVA), as it corresponds to local irregularities of the corneal surface. It is calculated as the sum of the variation of local powers along 256 regularly spaced semimeridians on the 10 central rings. Any disease responsible for decreased corneal surface regularity results in higher SRI values.
SRC: Area compensated Surface Regularity Index
This index is calculated as the SRI corrected for the analysed area and is increased for the same reasons as SRI.
SAI: Surface Asymmetry Index
The SAI is an index that integrates the keratometric power difference between opposite pairs of points situated on 128 meridians.
IAI: Irregular Astigmatism Index
The IAI reflects the variation of keratometric power between each ring along a given meridian.
OSI: Opposite Sector Index
The corneal surface is divided into 8 equal sectors, each subtending an angle of 45°. The mean power of each sector is calculated, and the OSI is equal to the maximum difference measured between two opposite sectors. The value of OSI is increased in case of irregular astigmatism characterized by the presence of a high degree of asymmetry.
CSI: Centre-Surround Index
The CSI is the difference in the average area-corrected corneal power between the central corneal zone (3 mm in diameter) and a 3 mm annulus surrounding the central area (3 to 6 mm).
Cone Location and Magnitude Index (CLMI).
This index was proposed by Roberts and Mahmoud (23, 24). It consists of detecting, within the central 8 mm of an anterior curvature map (axial, tangential or Gaussian) the area-corrected average steepest 2-mm-diameter circle. The average of all points outside this circle is then subtracted from the average of all points inside the 2 mm circle. It is recommended to use the axial curvature map for the detection of keratoconus. The value corresponding to the difference between the average curvature in the steepest zone (2 mm) and the rest of the analysed zone (8 mm) is called Ma. CLMI has been implemented in Keratron Scout Placido topography software (Optikon 2000, Rome, Italy)
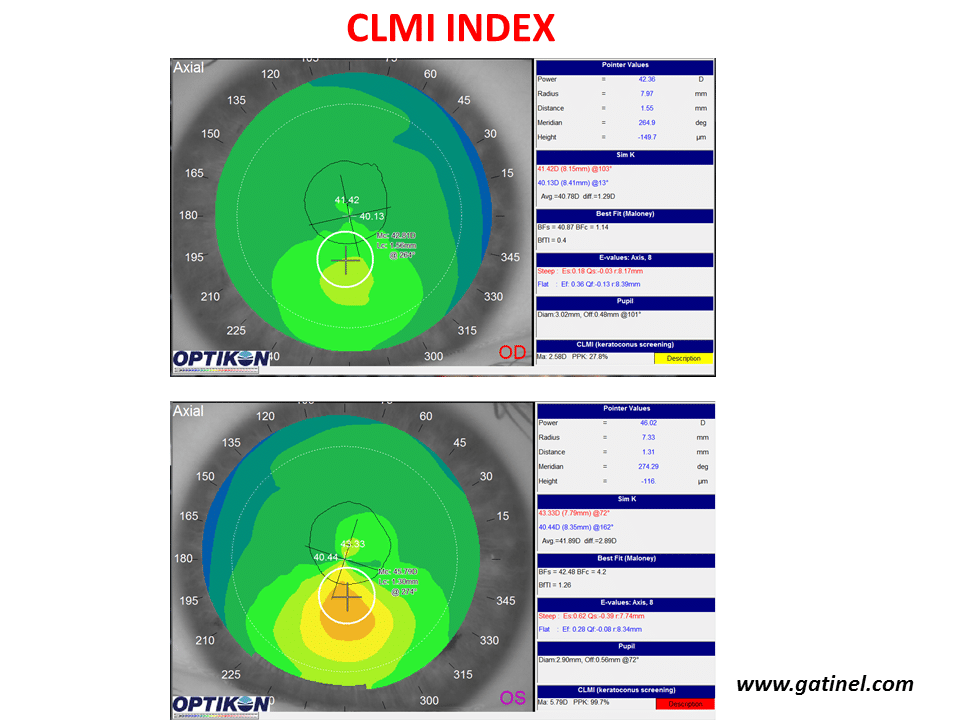
Use of the CLMI index with the Keratron Scout topographer (Optikon) for keratoconus screening. Maps are displayed in axial curvature mode. The right eye (top) presents keratoconus-suspect (PPK slightly higher than 25%, yellow colour code), while the left eye presents definite keratoconus (PPK close to 100%).
The value Ma is accompanied by a PPK index (Percent Probability of Keratoconus). The cut-off value of the PPK index to discriminate healthy corneas from keratoconus-suspect corneas was set at 25%. PPK values higher than 45% indicate the presence of advanced keratoconus.
Composite indices
Some of these indices have been combined in functions called KPI (Keratoconus Prediction Index) and KCI (Klyce/Maeda Keratoconus Index) in order to allow statistical applications of these indices for keratoconus screening. These composite indices provide quantitative data that can be used to construct statistical models designed to classify the corneas examined into diagnostic groups.
KPI: Keratoconus Prediction Index
The KPI is a discriminant function calculated from the values obtained for the following indices: SimKl, SimK2, SAI, DSI, OSI, CSI, IAI, AA and is described in the article: Maeda N, Klyce SD, Smolek MK, Thompson HW: Automated keratoconus screening with corneal topography analysis. Invest Ophthalmol Vis Sci. 1994;35:2749-2757. By using a cut-off value of KPI = 0.3, this index achieves a sensitivity of 68% with a specificity of 99%.
KCI: Klyce/Maeda Keratoconus Index
This index combines the KPI and the DSI, OSI, CSI and simK2 indices within a decision tree. A KCI of 100% indicates the presence of clinical keratoconus, while a KCI value of 0% indicates the absence of keratoconus.
TMS-1 topographer (Tomey) software integrated the Rabinowitz (KISA%) and Klyce/Maeda indices. Figure 10 provides an example in which Rabinowitz’s criteria concluded on the presence of keratoconus-suspect, in contrast with the Klyce/Maeda criteria. This example highlights the absence of absolute sensitivity and specificity of screening tests.
Smolek/Klyce neural network
The development of a neural network requires the calculation of quantitative indices in order to propose a diagnosis, including keratoconus and keratoconus-suspect. The Smolek/Klyce neural network uses 8 indices (DSI, OSI, CSI, simK1, AA, IAI, SAI, SRI, CYL, SDP). It is used on Magellan and OPDscan topographers under the name “Corneal Navigator”. Based on the calculated values of all indices indicated in paragraph c), a percentage of similarity with one of the following clinical conditions is presented: Normal (NRM), Astigmatism (AST), Keratoconus-suspect (KCS), Keratoconus (KC), Pellucid marginal degeneration (PMD), Myopic refractive surgery (MRS), Hypermetropic refractive surgery (HRS), Other (OTH).
Use of Zernike polynomial decomposition
Anterior corneal surface elevation data can be expressed as an expansion of Zernike polynomials, generally described as “corneal aberrations”. Each corneal surface is expressed as a sum of Zernike polynomials, each associated with a coefficient. The relevance of these functions to detect clinical keratoconus by using coefficients calculated within a decision tree has been demonstrated (25).
Gobbe and Guillon used the Keratron topographer to measure anterior elevation and calculate the values of Zernike coefficients (zone 6 mm in diameter) in the corneas of 870 normal eyes, 45 keratoconus eyes and 28 keratoconus-suspect eyes. The coefficient of the vertical coma aberration (Z3-1) was the most discriminant term to distinguish suspect corneas from normal corneas (sensitivity: 89.3%, specificity: 71.9%) (26).
Alio et al. assessed the use of anterior corneal surface higher order aberrations (HOA) as a tool to evaluate the severity of keratoconus using anterior corneal map analysis videokeratoscopy (27). They found that anterior corneal HOA, especially coma-like aberrations, were significantly more frequent in eyes with keratoconus that in normal eyes. Coma-like aberrations could therefore be good indicators for early detection and grading of keratoconus. The choice of cut-off and the corresponding sensitivity and specificity values were not reported, which limit the value of this approach for screening of keratoconus-suspect, at the present time.
We used corneal aberration coefficient values provided by the OPDscan topographer to perform discriminant function analysis designed to distinguish normal corneas (negative Klyce/Maeda indices for the detection of ectasia 4 years after LASIK) from forme fruste keratoconus (negative Klyce/Maeda screening indices on the eye concerned, but positive for keratoconus on the fellow eye) (25). The rates of tilt, vertical coma, and trefoil corneal aberrations were statistically different between the various groups studied and can be used to perform discriminant function analysis, in which the area under the ROC curve was 0.98. These data could be used to develop a test designed to establish a score and a cut-off for the detection of earlier forms of subclinical keratoconus by Placido topography, which has been clinically validated (26).
Detection of forme fruste keratoconus by corneal elevation topography and optical pachymetry
Technologies providing a global pachymetric map, including posterior surface mapping, would certainly provide useful information for the diagnosis of very early subclinical forms of keratoconus, as many variables and indices are abnormal in patients with clinical keratoconus (27): increased maximum anterior elevation and especially posterior elevation values in relation to their respective Best Fit Spheres, central or paracentral corneal thinning with inferotemporal displacement of the thinnest point, etc.
We have demonstrated increased maximum posterior central elevation, more prolate posterior asphericity, and a poorer correlation between anterior and posterior corneal surfaces in patients with keratoconus-suspect (suspicion was objectively based on Placido topography data) (13). The maximum posterior elevation in the central 1 mm was 28.8 ± 10.2 microns for keratoconus-suspect versus 20.6 ± 8.9 microns for normal corneas. A marked overlap in the distribution of posterior elevation was observed for keratoconus-suspect corneas. Note that, with 5-micron increments, a slightly accentuated posterior corneal elevation may not necessarily be detected (a 10-micron difference induces a difference of only two graduations).
The importance of the pachymetry is underlined in the percentage of tissue ablation (PTA) metric, which is weighting the residual bed thickness value to the the preoperative central corneal thickness. This indices shows significant correlation with the incidence of ectasia, which seems to be more pronounced in eyes with minor topographic abnormalities (28)
Pentacam topography screening indices
The Scheimpflug rotating camera system used in the Pentacam topographer (Oculus, Wetzlar, Germany) allows reconstruction of the anterior segment and provides data concerning the anterior surface, posterior surface and thickness of the cornea. Unlike the Orbscan, it does not use a Placido disk. The corneal thickness profile is a qualitative criterion that reflects thickness variations of the thinnest point in the peripheral cornea. It is calculated after dividing the corneal volume into 22 concentric rings around the thinnest point; each ring is 0.4 mm thick, and the spatial profile of corneal thickness is then represented over a total diameter of 8.8 mm. Statistically significant differences have been observed between a group of eyes with early keratoconus and a group of normal eyes (28). Pentacam software also proposes 8 indices, calculated according to undisclosed formulae that have yet to be validated in large series :
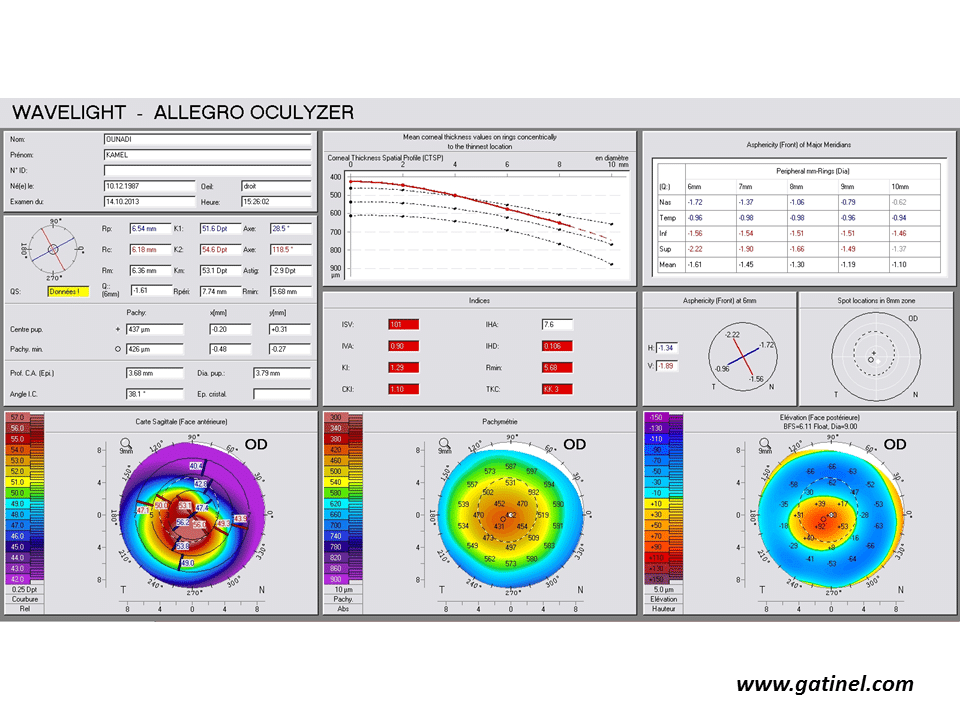
Positive keratoconus screening indices: the right eye presents an advanced form of keratoconus on the Pentacam corneal elevation topographer (Oculus, Germany). Mean corneal thickness is much lower than the mean, and the asphericity calculated for the principal semimeridians is highly prolate.
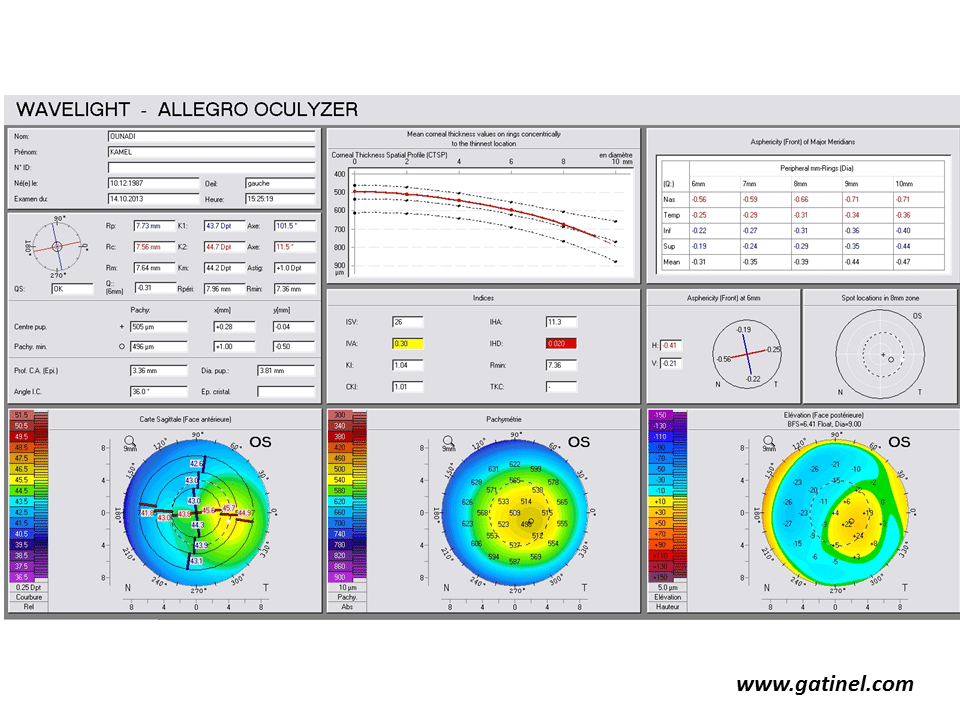
Positive keratoconus screening indices: the right eye presents an advanced form of keratoconus on the Pentacam corneal elevation topographer (Oculus, Germany). Mean corneal thickness is much lower than the mean, and the asphericity calculated for the principal semimeridians is highly prolate.
ISV: Index of Surface Variance
This index reflects the irregularity of curvature of the anterior corneal surface. High ISV values are observed in the case of irregular astigmatism (abnormal value: yellow; > 37 pathological value: red; > 41).
IVA: Index of Vertical Asymmetry
This index reflects the degree of asymmetry between the curvature of the superior cornea and the inferior cornea (abnormal value: yellow; > 0.28 pathological value: red; > 0.32).
KI: Keratoconus index
It is calculated from the indices previously described in Placido topography: DSI, OSI, CSI, SAI, IAI, AA, SimK1 and simK2.
(abnormal value: yellow; > 1.07 pathological value: red; > 1.07)
CKI: Center Keratoconus Index (abnormal value: yellow; > 1.03 pathological value: red; > 1.03)
IHA: Index of height asymmetry
This index is calculated as the difference between the mean elevation of the superior cornea and the mean elevation of the inferior cornea (abnormal value: yellow; > 19 pathological value: red; > 21)
IHD: Index of height decentration
This index reflects the degree of vertical decentration of corneal elevation data (abnormal value: yellow; > 0.014 pathological value: red; > 0.016)
ABR: Aberration coefficient
It is calculated from the value of the Zernike polynomial coefficients used to reconstruct the anterior corneal surface (abnormal value: yellow; > 1 pathological value: red; > 1)
The Pentacam topographer proposes a mode of representation of corneal elevation adapted to the detection of subclinical forms of keratoconus (Belin Ambrósio Enhanced Ectasia Display or BAD Display).
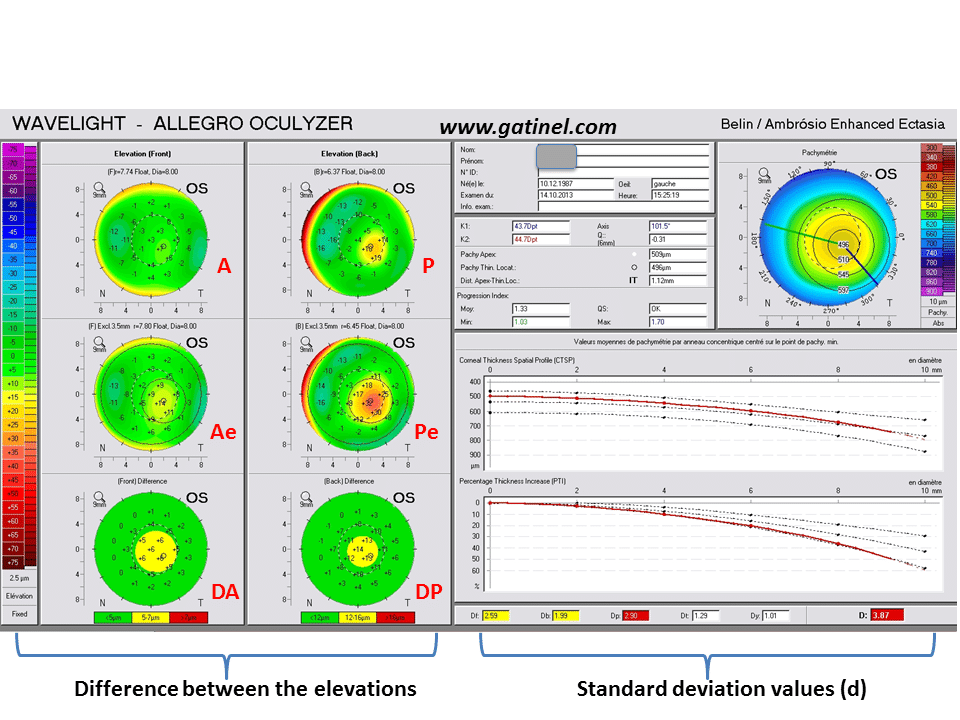
The Belin Ambrósio Enhanced Ectasia Display (left eye corresponding to Fig 12b) comprises calculation of elevation compared to a reference sphere calculated by including all points situated in an 8 mm circle around the thinnest point (A: anterior surface, P posterior surface). A reference sphere is then calculated by excluding the points situated in the central 3.5 mm (Ae: anterior surface, Pe: posterior surface). Finally, a differential map is obtained from the two elevation maps to accentuate any possible differences (note that the colour scale comprises only 3 colours, to highlight elevation differences at least greater than 5 microns). When the central region of the cornea presents an anterior prominence deformity, the reference sphere calculated after exclusion of the central points has a longer radius (7.8 vs 7.74 mm for the anterior surface, and 6.45 to 6.37 mm for the posterior surface in this example). This results in a significant difference in the elevation map of the central points on both the anterior surface and the posterior surface. The corresponding values of the “d” indices are situated in a suspect zone (yellow, more than 1.6 standard deviations from the mean) or even a frankly abnormal zone (red, more than 2.6 standard deviations).
The left half of the map presents corneal elevation data and the right half of the map presents pachymetry data. The previous indices are indicated at the bottom of the graph. Elevation data on the left side of the map are represented according to two modes. The first mode consists of calculating, for the anterior corneal surface and for the posterior corneal surface, a reference sphere for all points situated inside the central 8 mm (mapping concerns a total zone of 9 mm, but only points situated in the central 8 mm are used for calculation of the reference sphere). The second mode consists of calculating another reference sphere, by excluding points situated within a 3.5 mm circle around the thinnest point. A differential map is then calculated to highlight the differences between elevation maps according to the conventionally calculated reference sphere and after exclusion of the points situated in the central 3.5 mm. Depending on the relative contribution of the central points with respect to points situated in the periphery for calculation of the reference sphere, a variable difference will be observed between the radius of the classical reference sphere, and that of the sphere obtained after exclusion of the central points. A more marked difference indicates a more marked difference in corneal elevation maps. This difference, when it is positive (yellow or red disk), indicates a prolate aspherical corneal geometry, i.e. relative protrusion of the central cornea with respect to the peripheral cornea.
The “BAD Display” also comprises a series of indices characterized by a “d” value, which reflect the standard deviation from the mean of a reference population for the following data:
– anterior elevation (df) and posterior elevation (da) calculated in relation to the reference sphere after exclusion of the central 3.5 mm,
– value of the thinnest point (dt)
– distribution of corneal thickness: relationship between the gradient of variation of local curvature and the thinnest point (dp)
– displacement of the thinnest point in relation to the apex (dt).
d values are calculated as the position of the variable concerned in relation to the distribution measured in a reference population (d = 0 corresponds to the mean value, d = 1 corresponds to the sum of the mean value and 1 standard deviation).
A final D value is calculated from a linear regression taking into account all d values in the reference population.
Each parameter is displayed in yellow when its value exceeds 1.6 standard deviations in relation to the mean, and in red when its value exceeds 2.6 standard deviations.
Use of the Galilei topographer
Use of the elevation function of the Galilei topographer (Ziemer Ophthalmic Systems AG, Port, Switzerland) was evaluated for screening for early subclinical forms of keratoconus. A group of eyes with early subclinical keratoconus (fellow eyes of patients with advanced keratoconus on one side and Placido topography considered to be normal on the other side) was compared to a group of healthy eyes. A neural network method was used to study curvature, elevation and pachymetry data. Two nodes were selected to discriminate corneas presenting forme fruste keratoconus with optimal sensitivity and specificity: one concerned posterior corneal elevation (calculated for an aspherical and toric reference surface, equivalent to the Aconic mode on the Orbscan), and the other concerned corneal volume. A cut-off of 21.5 microns was defined for the maximum elevation difference (on a 4 mm radius) and a cut-off of 31.8 mm3 was defined for corneal volume (29).
Combined use of Placido topography, elevation topography and corneal tomography: the SCORE Analyzer (Orbscan)
The ORBSCAN diagnostic device was commercially released in the late 90s. Instead of using the reflexion at the anterior corneal surface, the ORBSCAN collected the images of “slit-scans” of the corneal wall. It was the first corneal topography machine that could map both the anterior and posterior surfaces of the cornea, and display a continuous thickness map of the corneal wall (corneal tomography). Later on, in its second (and now widespread) version, a slightly truncated Placido disk mount was added to obtain anterior curvature data via specular reflexion on the instrument, which was logically renamed ORBSCAN II.
The ORBSCAN II became one of the most commonly used corneal topographers to screen LASIK candidates. Despite initial controversies, surgeons soon acknowledged that the posterior surface elevation and tomography mapping information was useful to better identify “at risk corneas”, by providing additional information as compared to anterior topography alone. The controversy was based on the fact that limited case series, empirical observations and subjective interpretations were only available to support the impression of the real benefit of mapping the whole cornea.
At that time, no quantitative computed indices were available with the instrument’s software, but yet this tool seemed to keep some popularity and resist competing with newer topographers that were introduced later, which were based on Scheimpflug technology.
We used an interesting clinical model (eyes with low but proven expression of early subclinical keratoconus) combined with a pertinent statistical method (discriminant analysis) to develop a clinical decision tool to improve the safety of refractive surgery. We used the data provided by the Orbscan as we could compile the large dataset of eyes, and shown in published and peer-reviewed work (14) that the combination of different Placido derived and tomography indices in a discriminant function provided good accuracy (92% specificity and 92.5% sensitivity) in differentiating normal corneas from those with subclinical keratoconus.
The SCORE Analyzer concept aims to provide the clinician with a unique number to scale the ectasia susceptibility. It is specially designed for and therefore should only be used in myopic eyes. The score is the result of the linear combination of 12 topograpic variables.
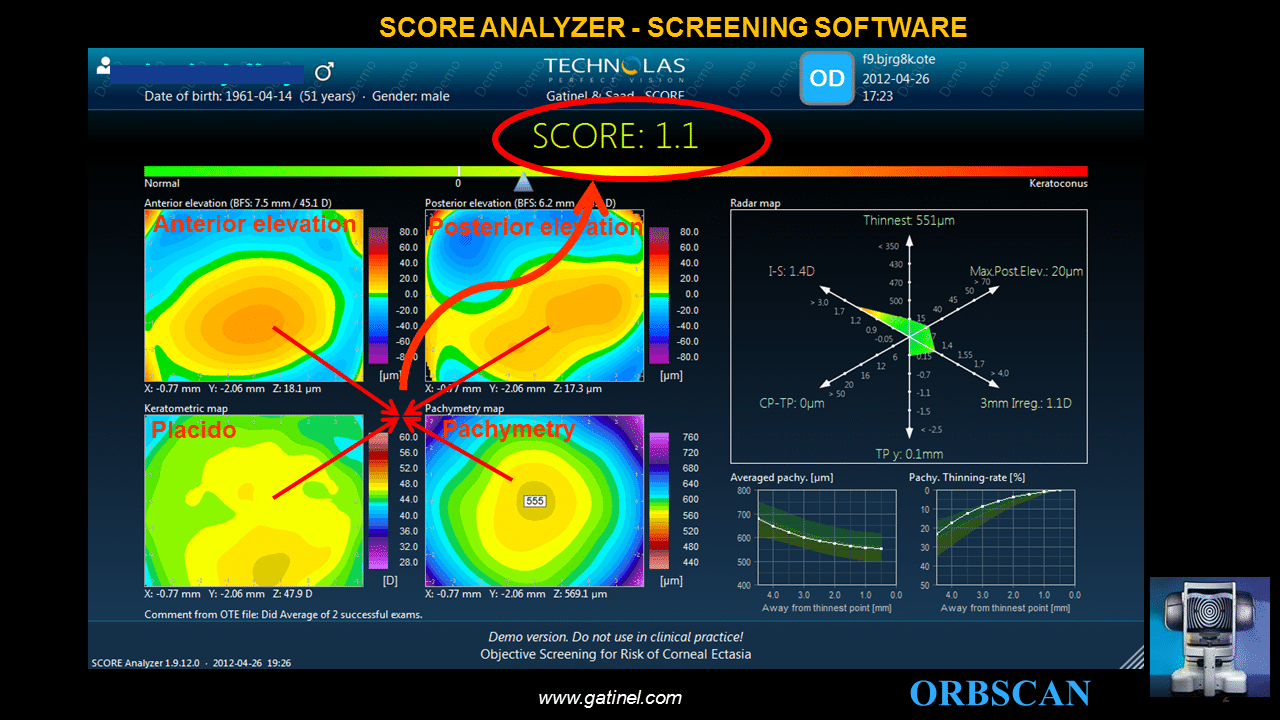
The final SCORE Analyzer GUI provides 3 additional graphs to the classic ORBSCAN quad-map display: – the SCORE bar, which visually locates the SCORE value on a linear color scale bar. – the RADAR map display, which is a new visually appealing and efficient map to help the clinician to appreciate the value of 6 pertinent corneal topography derived indices – the averaged pachymetry and pachymetry thinning curves, which provide meridionally-averaged cross sectional analysis of the corneal thickness profile.
These results confirmed that the combination of Placido, elevation and tomography data is a more sensitive and specific detector of early subclinical keratoconus compared with either Placido-disc topography or elevation data alone. Including elevation and tomography data with other measurements, such as corneal biomechanics or wavefront sensing, could further increase the specificity and sensitivity of these tests for early subclinical keratoconus detection.
The principles and results of this algorithm are described in more details in a specific page
References
- Randleman JB, Trattler WB, Stulting RD. Validation of the Ectasia Risk Score System for preoperative laser in situ keratomileusis screening. Am J Ophthalmol. 2008;145(5):813-8.
- Binder PS, Trattler WB. Evaluation of a risk factor scoring system for corneal ectasia after LASIK in eyes with normal topography. J Refract Surg. 2010;26(4):241-50.
- Amsler M. The “forme fruste” of keratoconus. Wien Klin Wochenschr. 1961;8:842-3
- Gatinel D, Saad A. The Challenges of the detection of subclinical keratoconus at its earliest stage. Int J Keratoco Ectatic Corneal Dis. 2012;1(1):36
- Rabinowitz YS, McDonnell PJ. Computer-assisted corneal topography in keratoconus. Refract Corneal Surg. 1989;5(6):400-8
- Rabinowitz YS, Garbus J, McDonnell PJ. Computer-assisted corneal topography in family members of patients with keratoconus. Arch Ophthalmol. 1990;108(3):365-71.
- Rabinowitz YS. Keratoconus. Surv Ophthalmol. 1998;42(4):297-31.
- Rabinowitz YS. Tangential vs sagittal videokeratographs in the “early” detection of keratoconus. Am J Ophthalmol. 1996;122(6):887-9.
- Smolek MK, Klyce SD. Current keratoconus detection methods compared with a neural network approach. Invest Ophthalmol Vis Sci. 1997;38(11):2290-9.
- Rao SN, Raviv T, Majmudar PA, Epstein RJ. Role of Orbscan II in screening keratoconus suspects before refractive corneal surgery. Ophthalmology. 2002;109(9):1642-6.
- Ambrósio R Jr, Alonso RS, Luz A, Coca Velarde LG. Corneal-thickness spatial profile and corneal-volume distribution: tomographic indices to detect keratoconus. J Cataract Refract Surg. 2006;32(11):1851-9.
- Ambrósio R Jr, Klyce SD, Wilson SE. Corneal topographic and pachymetric screening of keratorefractive patients. J Refract Surg. 2003;19(1):24-9.
- Schlegel Z, Hoang-Xuan T, Gatinel D. Comparison of and correlation between anterior and posterior corneal elevation maps in normal eyes and keratoconus-suspect eyes. J Cataract Refract Surg. 2008;34(5):789-95.
- Saad A, Gatinel D. Topography and Tomography Properties of Forme Fruste Keratoconus Corneas. Invest Ophthalmol Vis Sci. 2010;51(11):5546-55.
- Ambrosio R, Alonso RS, Luz A, Coca Velarde LG. Corneal-thickness spatial profile and corneal-volume distribution: tomographic indices to detect keratoconus. J Cataract Refract Surg,2006;32:1851-1859.
- Saad A, Lteif Y, Azan E, Gatinel D. Biomechanical properties of keratoconus suspect eyes. Invest Ophthalmol Vis Sci. 2010;51(6):2912-6.
- Rabinowitz YS, Rasheed K. KISA% index: a quantitative videokeratography algorithm embodying minimal topographic criteria for diagnosing keratoconus. J Cataract Refract Surg. 1999;25(10):1327-35.
- Salabert D, Cochener B, Mage F, Colin J. Keratoconus and familial topographic corneal anomalies. J Fr Ophtalmol. 1994;17(11):646-56
- Levy D, Hutchings H, Rouland JF, Guell J, Burillon C, Arné JL, Colin J, Laroche L, Montard M, Delbosc B, Aptel I, Ginisty H, Grandjean H, Malecaze F. Videokeratographic anomalies in familial keratoconus. Ophthalmology. 2004;111(5):867-74.
- Jacq PL, Sale Y, Cochener B, Lozach P, Colin J. Keratoconus, changes in corneal topography and allergy. Study of 3 groups of patients. J Fr Ophtalmol. 1997;20(2):97-102.
- Schweitzer C, Roberts CJ, Mahmoud AM, Colin J, Maurice-Tison S, Kerautret J. Screening of forme fruste keratoconus with the ocular response analyzer. Invest Ophthalmol Vis Sci. 2010;51(5):2403-10.
- Li X, Rabinowitz YS, Rasheed K, Yang H. Longitudinal study of the normal eyes in unilateral keratoconus patients. Ophthalmology. 2004;111(3):440-6.
- Mahmoud AM, Roberts C, Herderick EE, Lembach RG, Markakis G. The Cone Location and Magnitude Index (CLMI). Invest Ophthalmol Vis Sci, 2005;82:1038-1046
- Mahmoud AM, Roberts CJ, LembachRG, Twa MD, Herderick EE, McMahon TT, CLEK study group. CLMI: the cone location and magnitude index. Cornea, 2008;27(4):480-7
- Twa MD, Parthasarathy S, Roberts C, Mahmoud AM, Raasch TW, Bullimore MA. Automated decision tree classification of corneal shape. Optom Vis Sci 2005;82:1038-1046
- Gobbe M, Guillon M. Corneal wavefront aberration measurements to detect keratoconus patients. Cont Lens Anterior Eye,2005;28:57-66
- Alió JL, Shabayek MH. Corneal higher order aberrations: a method to grade keratoconus. J Refract Surg. 2006;22(6):539-45
- Smadja D, Touboul D, Cohen A, Doveh E, Santhiago MR, Mello GR, Krueger RR, Colin J. Decision of subclinical keratoconus using an automated decision tree classification. Am J Ophthalmol, 2013;156:237-246
- Saad A, Gatinel D. Evaluation of total and corneal wavefront high order aberrations for the detection of forme fruste keratoconus. Invest Ophthalmol Vis Sci. 2012,17;53(6):2978-92
- Randleman JB, Trattler WB, Stulting RD. Validation of the Ectasia Risk Score System for preoperative laser in situ keratomileusis screening. Am J Ophthalmol. 2008;145(5):813-8.
- Binder PS, Trattler WB. Evaluation of a risk factor scoring system for corneal ectasia after LASIK in eyes with normal topography. J Refract Surg. 2010;26(4):241-50.
- Amsler M. The “forme fruste” of keratoconus. Wien Klin Wochenschr,1961;8:842-3
- Gatinel D, Saad A. The Challenges of the detection of subclinical keratoconus at its earliest stage. Int J Keratoco Ectatic Corneal Dis 2012;1(1):36
- Rabinowitz YS, McDonnell PJ. Computer-assisted corneal topography in keratoconus. Refract Corneal Surg,1989;5(6):400-8
- Rabinowitz YS, Garbus J, McDonnell PJ. Computer-assisted corneal topography in family members of patients with keratoconus. Arch Ophthalmol. 1990;108(3):365-71.
- Rabinowitz YS. Keratoconus. Surv Ophthalmol. 1998;42(4):297-31
- Rabinowitz YS. Tangential vs sagittal videokeratographs in the “early” detection of keratoconus. Am J Ophthalmol. 1996;122(6):887-9.
- Smolek MK, Klyce SD. Current keratoconus detection methods compared with a neural network approach. Invest Ophthalmol Vis Sci. 1997;38(11):2290-9.
- Rao SN, Raviv T, Majmudar PA, Epstein RJ. Role of Orbscan II in screening keratoconus suspects before refractive corneal surgery. Ophthalmology. 2002;109(9):1642-6.
- Ambrósio R Jr, Alonso RS, Luz A, Coca Velarde LG. Corneal-thickness spatial profile and corneal-volume distribution: tomographic indices to detect keratoconus. J Cataract Refract Surg. 2006;32(11):1851-9.
- Ambrósio R Jr, Klyce SD, Wilson SE. Corneal topographic and pachymetric screening of keratorefractive patients. J Refract Surg. 2003;19(1):24-9.
- Schlegel Z, Hoang-Xuan T, Gatinel D. Comparison of and correlation between anterior and posterior corneal elevation maps in normal eyes and keratoconus-suspect eyes. J Cataract Refract Surg. 2008;34(5):789-95.
- Saad A, Gatinel D. Topography and Tomography Properties of Forme Fruste Keratoconus Corneas. Invest Ophthalmol Vis Sci. 2010 Nov;51(11):5546-55.
- Ambrosio R, Alonso RS, Luz A, Coca Velarde LG. Corneal-thickness spatial profile and corneal-volume distribution: tomographic indices to detect keratoconus. J Cataract Refract Surg,2006;32:1851-1859
- Saad A, Lteif Y, Azan E, Gatinel D. Biomechanical properties of keratoconus suspect eyes. Invest Ophthalmol Vis Sci. 2010;51(6):2912-6
- Rabinowitz YS, Rasheed K. KISA% index: a quantitative videokeratography algorithm embodying minimal topographic criteria for diagnosing keratoconus. J Cataract Refract Surg. 1999;25(10):1327-35.
- Salabert D, Cochener B, Mage F, Colin J. Keratoconus and familial topographic corneal anomalies. J Fr Ophtalmol. 1994;17(11):646-56
- Levy D, Hutchings H, Rouland JF, Guell J, Burillon C, Arné JL, Colin J, Laroche L, Montard M, Delbosc B, Aptel I, Ginisty H, Grandjean H, Malecaze F. Videokeratographic anomalies in familial keratoconus. Ophthalmology. 2004;111(5):867-74.
- Jacq PL, Sale Y, Cochener B, Lozach P, Colin J. Keratoconus, changes in corneal topography and allergy. Study of 3 groups of patients. J Fr Ophtalmol. 1997;20(2):97-102.
- Schweitzer C, Roberts CJ, Mahmoud AM, Colin J, Maurice-Tison S, Kerautret J. Screening of forme fruste keratoconus with the ocular response analyzer. Invest Ophthalmol Vis Sci. 2010;51(5):2403-10.
- Li X, Rabinowitz YS, Rasheed K, Yang H. Longitudinal study of the normal eyes in unilateral keratoconus patients. Ophthalmology. 2004;111(3):440-6.
- Twa MD, Parthasarathy S, Roberts C, Mahmoud AM, Raasch TW, Bullimore MA. Automated decision tree classification of corneal shape. Optom Vis Sci 2005;82:1038-1046
- Gobbe M, Guillon M. Corneal wavefront aberration measurements to detect keratoconus patients. Cont Lens Anterior Eye,2005;28:57-66
- Saad A, Gatinel D. Evaluation of total and corneal wavefront high order aberrations for the detection of forme fruste keratoconus. Invest Ophthalmol Vis Sci. 2012 May17;53(6):2978-92
- Saad A, Gatinel D. Combining Placido and Corneal Wavefront data for the Detection of Forme Fruste Keratoconus. J Refract Surg 2016, in press.
- Santhiago MR, Smadja D, Wilson SE, Krueger RR, Monteiro ML, Randleman JB. Role of percent tissue altered on ectasia after LASIK in eyes with suspicious topography. J Refract Surg. 2015;31(4):258-65.
- Maeda N, Klyce SD, Smolek MK, Thompson HW. Automated keratoconus screening with corneal topography analysis. Invest Ophthalmol Vis Sci. 1994;35(6):2749-57.
- Mahmoud AM, Roberts C, Herderick EE, Lembach RG, Markakis G. The Cone Location and Magnitude Index (CLMI). Invest Ophthalmol Vis Sci, 2005;82:1038-1046
- Alió JL, Shabayek MH. Corneal higher order aberrations: a method to grade keratoconus. J Refract Surg. 2006;22(6):539-45
- Kim H, Joo CK. Measure of keratoconus progression using Orbscan II. J Refract Surg. 2008;24(6):600-5.
- Bühren J, Kook D, Yoon G, Kohnen T. Detection of subclinical keratoconus by using corneal anterior and posterior surface aberrations and thickness spatial profiles. Invest Ophthalmol Vis Sci. 2010;51(7):3424-32
- Bühren J, Kühne C, Kohnen T. Defining subclinical keratoconus using corneal first-surface higher-order aberrations. Am J Ophthalmol. 2007;143(3):381-9
- Gatinel D, Malet J, Azar ST. Corneal elevation topography: Best Fit Sphere, elevation distance, asphericity, toricity and clinical implications. Cornea, 2010;June 18, accepted for publication
- Gatinel D, Racine L, Hoang-Xuan T. Contribution of the corneal epithelium to anterior corneal topography in patients having myopic photorefractive keratectomy. J Cataract Refract Surg. 2007;33(11):1860-5.