We’ve all heard about vinyl records and phonographs, with their characteristic vintage sound and warmth, but did you know that videos can also be recorded in what appears to be a similar way?
Developed by RCA in the 1970s, and finally commercially released in 1981, the Capacitance Electronic Disk (CED) is the obscure predecessor of VHS cassettes and laser-read disks such as the DVD.
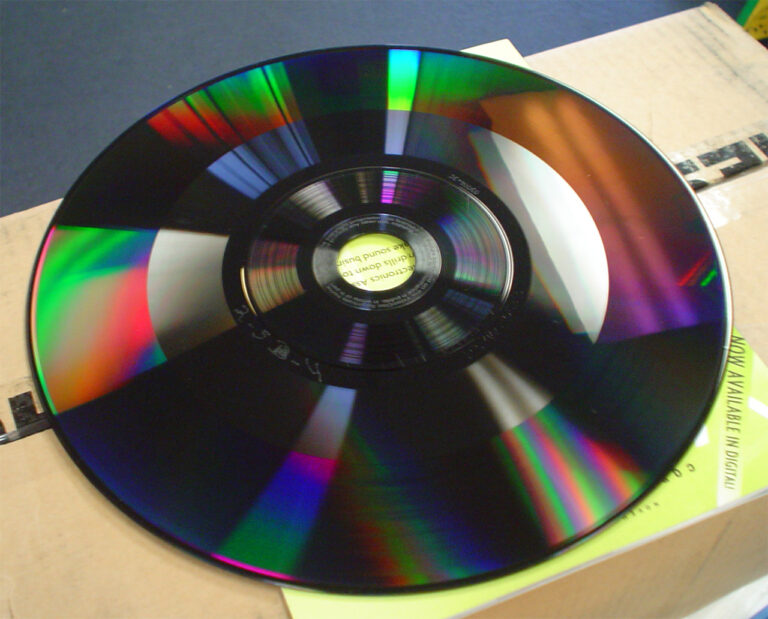
Photo of Capacitance Electronic Disk (CED) (Credit: Athnex at English Wikipedia) https://handwiki.org/wiki/Capacitance_Electronic_Disc#/media/File:Ced_disk.jpg
In this blog post, we’re going to cover:
What is a CED?
How does it work?
What do the structures look like and how can we measure them?
Want a quick explanation? Watch this short:
How does a capacitance electronic disc work?
Rather than reading magnetic domains like in hard disks or optical reflectivity like in CDs or DVDs, a CED is read using a physical stylus like a record player. However, instead of directly translating data from the physical topography of the disk itself as in a record player, the CED video system detects minute changes in capacitance between the disk and stylus.
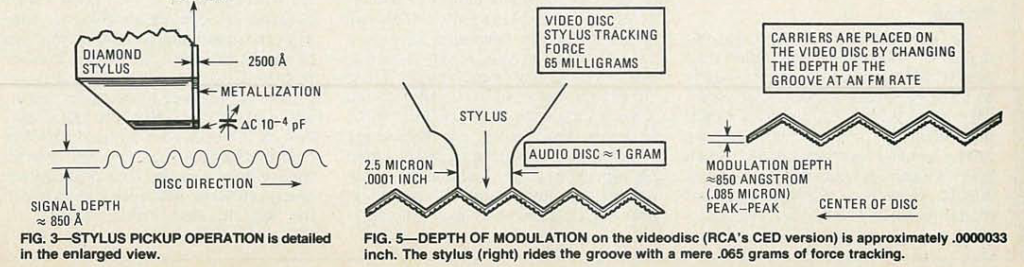
To do this, a diamond stylus with a metal electrode is used along with a conductive vinyl disk, and the capacitance between the electrode and disk are read out as a frequency modulated (FM) signal.
While CEDs do have a similar spiral groove to a vinyl record, the groove’s purpose is primarily to guide the stylus. The sensitivity of the capacitance measurement means that only a tiny modulation depth of about 85 nm is needed!
Diagram of CED stylus system. Source: Paleotronic https://paleotronic.com/2020/10/04/the-horrors-of-capacitance-electronic-disk-ced/
Due to this very small depth of modulation, and no mechanical vibration (as the stylus is much larger than the modulation), with only electrical readout, the modulation frequency and resulting data rate achieved (several MHz) was about 100x greater than LP records.
What happened to the CED?
The CED system never gained broad commercial acceptance due to a long development time and sensitivity to dust and contamination. When the CED was finally commercially available in 1981, VHS was already popular and much more robust.
Structure of a CED
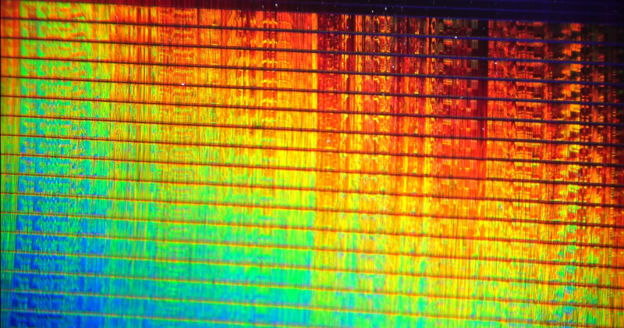
The physical CED itself is fascinating. Despite the intrinsically black material of the CEDs (PVC with carbon black fillers), they have beautiful iridescent colors due to diffraction and interference caused by the interaction of light with nanoscale features sizes on the order of the visible wavelengths.
Photograph of a CED showing the iridescence. Source: Breaking Taps
Due to the small size of these grooves, an optical microscope cannot be used to characterize their actual shape. So after taking some nice images of the colors, the host of Breaking Taps uses a scanning electron microscopy (SEM) to look at the structures on the CED. SEM uses electrons instead of light to scan and SEM can reach resolutions up to 1000x better than optical microscopy.
Scanning a CED with SEM
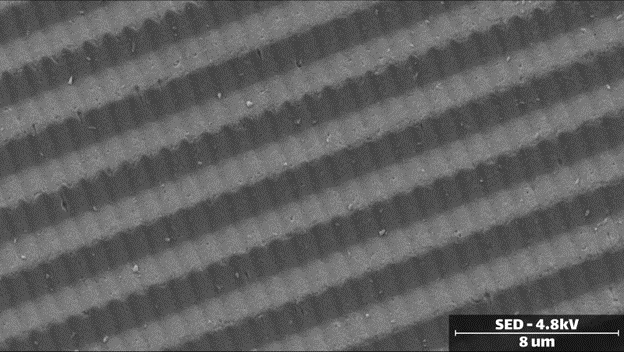
Now we can see some of the grooves of the CED. However, despite the high resolution of SEM, the actual shape and 3D structure of the CED wasn’t very clear at all. From the SEM image, it’s possible to guess the lateral shape, but that depends on the angle you’re looking at, which isn’t reliable at all. Furthermore, the height of the grooves is completely unknown.
Scanning electron microscopy (SEM) micrograph of a CED. Source: Breaking Taps
Scanning a CED with AFM
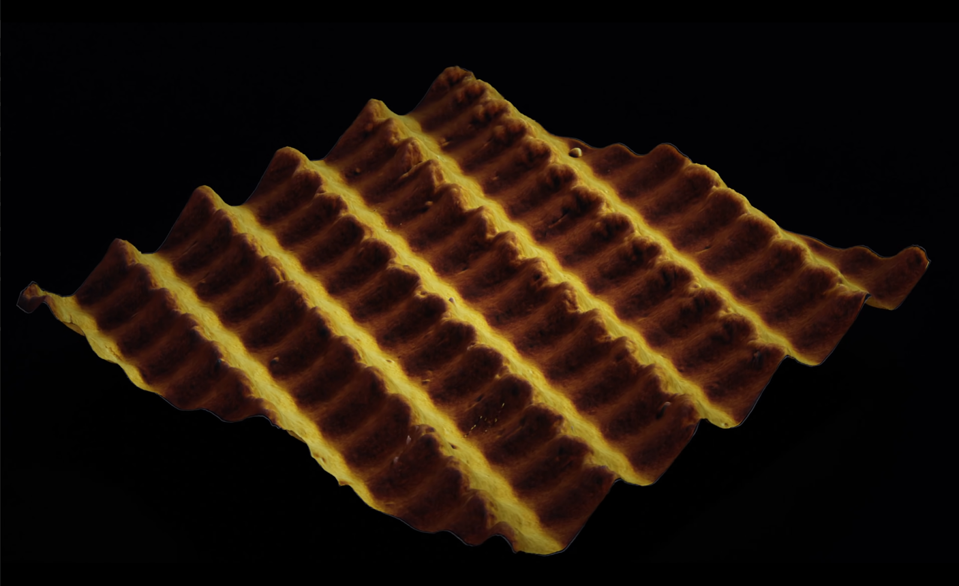
The host (Zach) then quickly moved on to the nGauge Atomic Force Microscope (AFM). Without any sample preparation, he was able to quickly take a scan of the CED at even higher resolution than SEM. He was able to capture not only a lateral view of the CED, but also determine the critical height information, showing that these grooves are 500 nm in depth. Furthermore, the AFM data provides assurance that the lateral size is precise, without any tilt angle skewing the actual dimensions.
3D representation of an AFM topography scan captured using the nGauge AFM. Source: Breaking Taps
Watch the video
Not only that, but Zach from Breaking Taps was even able to find an area on the CED that had no undulations, can you guess why? To find out, watch the full video below!
Want to learn even more about CEDs?
In addition to the two awesome videos from Breaking Taps, to learn more the history of CED’s and their unique quirks, Technology Connection’s 5 part series is also a great watch.
Interested in learning how AFM can help you?
Speak with an application engineer today to see how AFM can help with your research and process development.