Viewing the Details of "America Its History" (sic)

A post on Tangible Books instagram showed that they had got in a copy of Picturing America: The Golden Age of Pictorial Maps, and so I ran over and bought it. I’ve been looking through it. You can click here for much of its contents in the form of an Hornsby-curated exhibition now archived on the Osher Map Library’s site, along with many amazing scans & info from Hornsby’s book.

I keep coming back to this, in the book, a frustratingly small reproduction of a map by Aaron Bohrod, Aaron Bohrod’s America Its History, from 1946. I posted about the book on my instagram feed here. Looking around the internet to find a better version, I came across these links. You can click around and zoom in on the map and see the amazing details, even though the lighting and color isn’t so hot. I’m still looking around for better scans/pics.

Aaron Bohrod is a new character to me. Wikip. says “Bohrod was born in Chicago in 1907, the son of an emigree Bessarabian-Jewish grocer.[6] Bohrod studied at the School of the Art Institute of Chicago and the Art Students League of New York between 1926 and 1930.[2]” (Pictorial History was published by UChicago Press, another Chicago connection. Now that I’m in Chicago is it strange how the universe keeps showing me more and more Chicago, everything connected and nearby? The fire below in the detail is striking.)

I’ll look more into this and try to find a better scan/pic and update this post.

Epistemology Charts

Defense Charts yesterday, this today.

Hired Thought is an amazing name. One problem with “biz.viz” graphics (peace to my friends still in the trenches) is how immediately out-of-date they often look, like immediately. The out-of-date-ness combines with something that I’m still trying to come up with a good name for—lack of a sense of humor is close, but not exactly it…earnestness+complexity—where the result is really funny to me. I hesitate to write about it, because believe me I sympathize. If the tweet embeds correctly, you can see some people involved…Headshots are also tricky. Best go with bald and glasses, like some sci-fi-lite feel, the “brainiac-cyborg-you-can-trust”. Avoid anything like “Big Daddy Slides” or “Cool Chart Guy.com.”

Screen Shot 2021-08-31 at 10.55.57 AM.png
 

Mirrors of Nature

Here's some diagrams I drew while reading Philosophy and the Mirror of Nature by Richard Rorty last year. I don't expect these diagrams will necessarily make much sense to anyone since I'm using my own, like, private language, which is still under construction. Nor will they clear up anything about the book, which is anyways already pretty clear, I think. In other words, I didn't draw them to illustrate the book. (Though I would like to do more comics or diagrams to clearly illustrate philosophy or nonfiction books someday. If you're looking to put out an edition of Mirror of Nature with illustrations by Kevin H, please give me a call!) But these fall more in the category of "inspired by" or notes to myself. All the stuff about dialectics are my own ideas and I'm not even sure I know what I'm talking about yet. Ideally I would type out some paragraphs trying to explain what you're looking at, but I think I'll just put them up as is for now. 


Visualization and Cognition

Visualization and Cognition: Drawing Things Together 
by Bruno Latour
(1986) (link to pdf)

This essay brings together many of the subjects I've become interested in over the past decade and a half. It seems like it should be required reading for people interested in visual thinking. I'm going to give it another read and try to catch up on commentary since 1986 before I write more about it. In the meantime I'm going to let this post be a general catch-all for the topic of visualizations and cognition, and I'll come back to it with new links and notes, etc. (This is part of my plan for moving forward with this blog in a new way...but enough of that for now).

I learned about this essay from Bret Victor's end of the year reading links from 2013 which I am slowly working my way through.


Trees of Life (2/2)

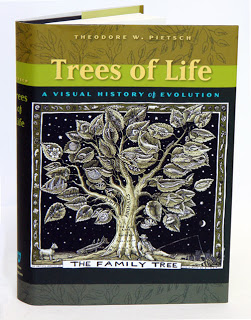
Another thing I liked about Trees of Life: A Visual History of Evolution is the chance to think about how representing evolution itself evolved.* What form does the evolution of forms take? etc. It's disappointing that the author didn't try to draw a tree diagram of the evolution of tree diagrams. That seems like a no-brainer. Also there is no attempt to find or discuss a tree diagram of the evolution of trees, which also would be the ultimate for xeroxing and taping to your office door if you're a biology professor.

It’s weird that animals are shown in “tree” diagrams. Seems insulting to animals. But, an animal diagram of trees? I don’t know.

I think books which survey a variety of forms should include at least one chapter to play around and suggest new possibilities and new forms, and forms of forms. Even if some ideas are kind of dumb, as above. But obviously I’m not just talking about making jokes. Editors may frown, careful not to go “beyond the scope of the book." It’s true that Trees of Life is already 350 pages, and I’m sure many interesting tree diagrams couldn't fit. But if you're going to draw attention to forms, systems, or formal systems, etc., with this kind of history or survey, it would also be valuable to take some space to experiment at this elevated, meta-level and scope out the boundaries of the territory and draw some sketches of what you see from up there.

The form that this book (which its author, Theodore W. Pietsch, calls “a celebration”) takes is that of a standard book with chapters, notes, a bibliography and an index. The chapters consist of brief commentary on a species of tree diagram, and then examples follow, crisply reproduced. I thought the text was interesting and to-the-point, but I also wish the book was more ambitious. Not to seem ungrateful, but it left me wanting more (see above). Again, space was probably the issue. Maybe a positive way to put it would be that it opens up a lot of possibilities.

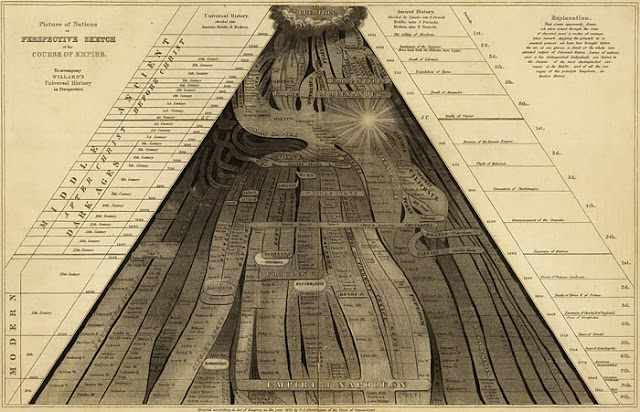
The book begins by discussing the varieties of bracket diagrams used to show taxonomic relationships before the discovery of evolution, and then the development of varieties of tree diagram types, and on from there into boring-looking—but more densely meaningful—computer-aided trees which depend on DNA data and statistics. By the end of the book you’re very sensitive** to how the forms that diagrams take can represent and misrepresent the messy and complex reality of natural history, and you can’t help but be dissatisfied both with the limitations of ink-on-paper tree diagrams and of books.*** Obvously a 3D computer-generated tree that you could rotate and zoom in and out of would be pretty great, and it seems totally doable, too—something huge and editable with many nested hierarchies and expandable branches, like you find in mind-mapping programs.****

Other than 
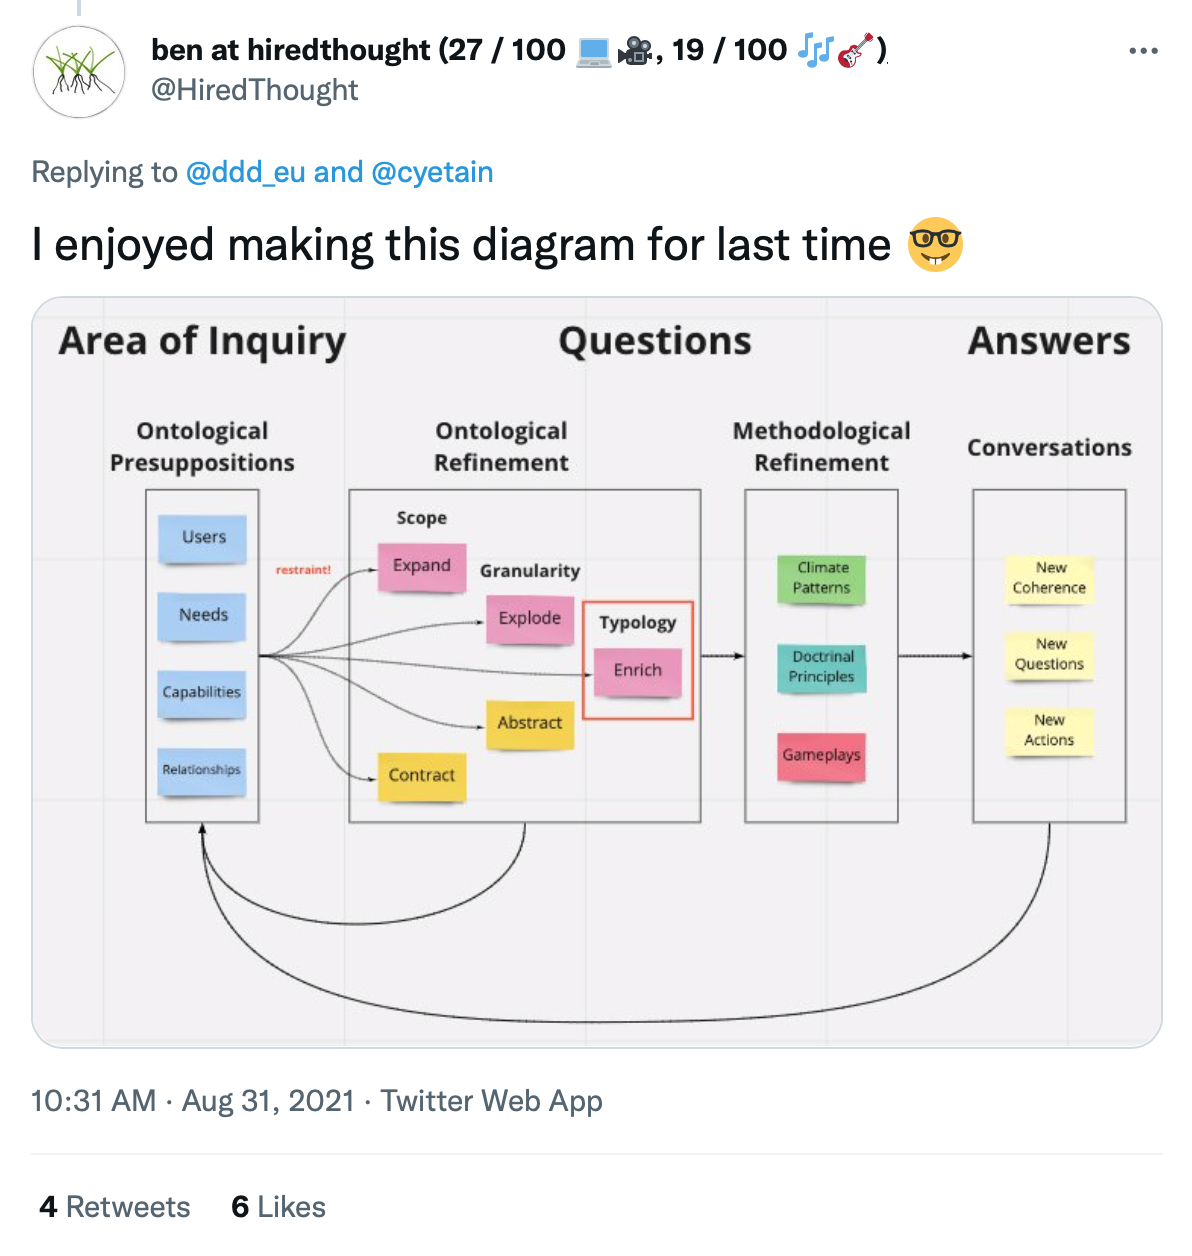
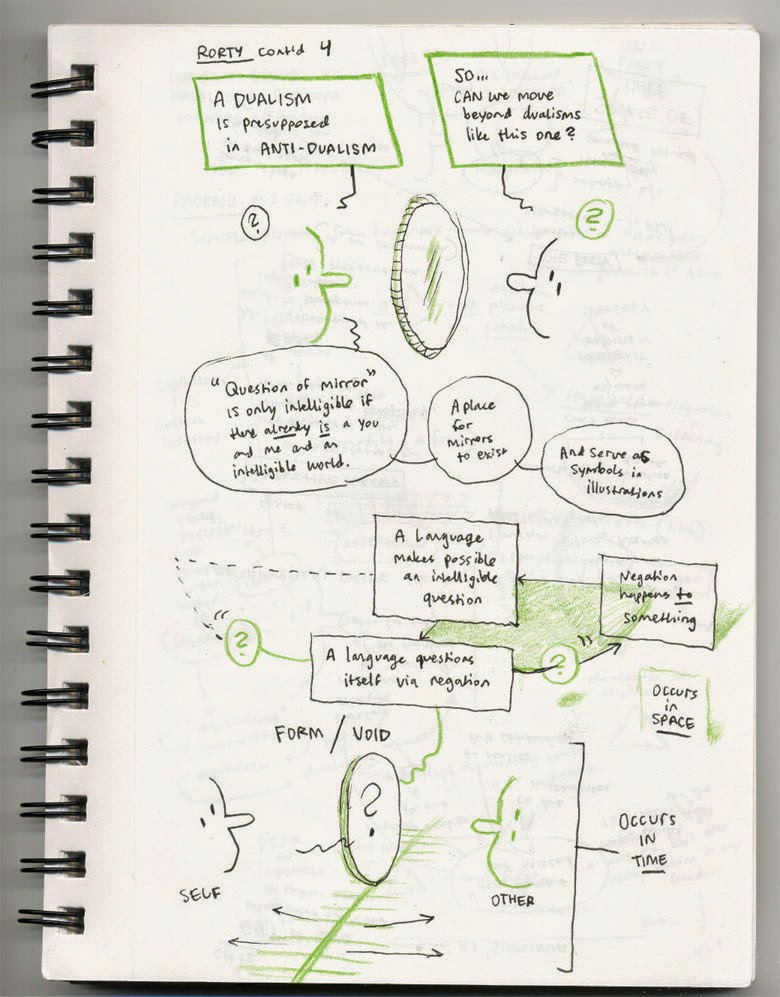
the Quinarians, my other favorite type of tree diagram from the book is where the diagram-maker opens up the 3rd dimension. Examples are below. Dissatisfaction with the limitations of form is on display big time. I think this may be what separates us from the animals?—the working memory capacity to stick with a form and evolve it, moment to moment, sensitive to how changes of form affect functionality, or sensitive to the possibility of bracketing it or framing it or abstracting “up” or “out” to other levels, or into new dimensions, and enjoying all of this, as we enjoy a good story or a joke.


(I added arrows and highlights to show what's happening in this one.)


____

* This evolution-of-evolution thing is just one of those things you have to deal with if you’re going to read about evolution. No writer could possibly still think it’s a witty move? But you can’t escape it. Just be tasteful and don’t overdo it. I avoided a chance to say something about “pruning” tree diagrams later in this reviewthat’s just gross. (Also, the author’s name is Pietsch?! Leave it alone.) There are probably unavoidable meta-groaners in every area of study, and there’s probably a survey article in Cabinet or something.

**Not for the first time, hopefully.

***Very good, though, is the unfolding of animal and plant forms on Earth, which makes up the real subject of all of this.

****Dissatisfaction with the forms of printed-book-divided-into-chapters and mind-mapping apps is beyond the scope of this blog post. 

Trees of Life (1 of 2)


Here's one of my favorite parts of Trees of Life: A Visual History of Evolution:

"…the so called quinarian approach to classification that was embodied in the work of British entomologist named William Sharpe Macleay (1792-1840) but taken up almost immediately by others, principally Nicholas Aylward Vigors (1787-1840) and William Swainson (1789-1855) during the 1820s and 30s. They somehow came to believe that living things existed in natural groups of five, that such groups of five are naturally divisible into five subgroups, each subgroup into five sub-subgroups, and so on. Affinities among taxa formed circular chains…Quinarians were also convinced that similarities between taxa based on affinity as well as analogy could be indicated in the same diagram…"

Here are two examples of these diagrams (check the pentagram…evilution): 


Another quinarian, “…Swainson devoted several years to the development of a new general classification of animals based on quinarianism, applying it, for example, throughout his two-volume Natural History of Birds that appeared in 1836 and 1837.” Imagine spending years on this. Imagine those wonderful days when everything seems to fit, and the frustration when they don’t. Notice, in the diagrams above, that three asterisks were placed where taxa that "had yet to be discovered.” The “ ule of five” predicts them, so they must be out there somewhere. 

Looking for patterns, can't knock it. It's not like they were numerologists or anything. And they were def. way smarter than I am. I’m sure this played out differently in reality than the Borges-lite story in my mind.

The questionable pattern I see reminds me of this post at waggish, the part about Fludd vs. Kepler: 

“I too play with symbols and have planned a little work, Geometric Cabala, which is about the Ideas of natural things in geometry; but I play in such a way that I do not forget that I am playing. For nothing is proved by symbols; things already known are merely fitted [to them]; unless by sure reasons it can be demonstrated that they are not merely symbolic but are descriptions of the ways in which the two things are connected and of the causes of these connections.” (Kepler)

Here's the good part. Why 5? Why not 6? or 9? “…As the approach developed and became more widespread, some proponents of circle arrangements were not content to restrict the number to five.” You can see where this is going... 

Here are diagrams based on numbers 7 and 10:

Timelines


A bundle of beautiful timelines posted over at the Dave Rumsey Map Collection. Many of these are featured and discussed in Cartographies of Time, one of my favorite books I read last year.

Making timelines* seems to be one of those things that we can do on computers very easily now, using gestures and drag-and-drop, instead of the nightmare interface of something like this.

I wanted to add some more to this post, so here's some other TIMELINE links that I came across in about 10 minutes of searching. I haven't done in-depth research or anything. Also -- if you're searching for "timeline" on google you'll want to add "-facebook," to filter out a billion mentions of Facebook's (badly designed) timeline feature.

BeeDocs Timeline App
Verite Timeline App (play with the coal industry power play timeline)
SIMILE Timeline Widget
Tiki-Toki
ChronoZoom Project
Wikipedia list of timelines
Hyperhistory (oldstyle, charming)

Add more in comments if you want. There's gotta be some huge, Wikipedia-type timeline somewhere on the web, right? I thought I saw something like that once, but I couldn't find it just now.

_____
*...and mindmaps, 3D environments, nested documents, etc....

UPDATES:

Here's an interactive timeline thing called "Here is Today."