Lognormal Distribution in Financial Markets
Quantace Research
We leverage Data Science & AI to create a Quantitative Edge in Equity & Derivatives.
Lognormal Distribution in Financial Markets
The journey through the chaotic world of financial markets often points us toward a particular statistical ally, the Lognormal Distribution. Let's take a deep dive into its hidden secrets and practical applicability.
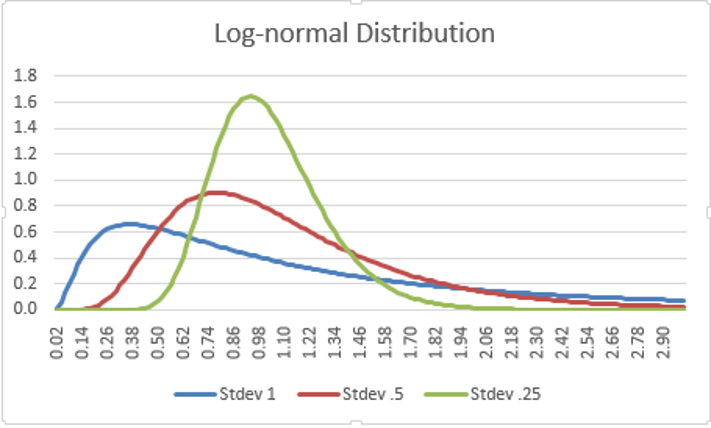
1️⃣ Understanding Lognormal Distribution
In finance, many variables, such as stock prices, are observed not to follow a Normal distribution but a Lognormal one. This distribution emerges when the natural logarithm of the random variable forms a Normal distribution. The implications are significant; a variable following a Lognormal distribution takes only positive real values, reflecting the nature of financial assets.
2️⃣ Practical Application
- Option Pricing: Widely used in the Black-Scholes model for option pricing, the Lognormal distribution accurately depicts stock price dynamics.
- Risk Management: It provides a more realistic model of returns, enabling better risk assessment and management.
3️⃣ Limitations
Despite its usefulness, the Lognormal distribution presents certain challenges:
- Overestimation of Future Prices: It tends to overstate the future price of assets, which can lead to miscalculations in risk and return.
- Difficulty in Handling Negative Prices: While the Lognormal distribution works well for assets with positive values, it fails to handle scenarios with negative asset prices, such as liabilities or specific derivative contracts.
4️⃣ A Simplified Example
Consider a hypothetical stock with a price of INR 100 today. Let's assume its annual return follows a Lognormal distribution with a mean of 5% and a standard deviation of 15%. If we want to know the probability that the price will exceed INR 120 in one year, we would:
Calculate the log return: ln(120/100) = 0.182
Standardize it: (0.182 - 0.05) / 0.15 = 0.88
Check the standard Normal distribution: P(Z > 0.88) ≈ 19%
This implies that, according to the Lognormal distribution, there's a 19% chance that the stock price will rise above INR 120 in one year.
In a nutshell, the Lognormal distribution forms a significant tool in financial market analysis. Its understanding is key to mastering financial forecasting and risk management. Be mindful of its limitations to make informed and prudent decisions.
Follow Quantace Research
#quant #quantace
-------------
Why Should I Do Alpha Investing with Quantace Tiny Titans?
https://quantaceresearch.smallcase.com/smallcase/QUREMO_0037
1) Since Apr 2021, Our premier basket product has delivered +42.5% Absolute Returns vs the Smallcap Benchmark Index return of +5.6%. So, we added a 37% Alpha.
2) Our Sharpe Ratio is at 1.4.
3) Our Annualised Risk is 20.1% vs Benchmark's 20.4%. So, a Better ROI at less risk.
4) It has generated Alpha in the challenging market phase.
5) It has good consistency and costs 6000 INR for 6 Months.
-------------
Disclaimer: Past performance does not guarantee Future Results. Investments are subject to risk. Know it before investing.
-------------
#research #future #investing #investments #markets #finance #riskmanagement #management #strategy #mathematics #algorithms #machinelearning #ai #algotrading #data #financialmarkets #quantitativeanalysis #change #money #help