Central Tendency: Mean, Median, Mode, and Range
Welcome to this complete step-by-step guide to central tendency and how to find the mean, median, and mode of a data set.
This post will share key information, formulas, and vocabulary so that you can use math to determine the mean, median, mode, and range of any data set and understand what these values represent.
After working through two examples, you will also have access to a free mean, median, and mode pdf practice worksheet that includes an answer key.
Key Questions
Now let’s go ahead and begin this lesson by raising two key questions:
For a given set of data…
What does the mean, median, mode, and range represent?
How can you find the mean, median, mode, and range of a data set?
What is Central Tendency?
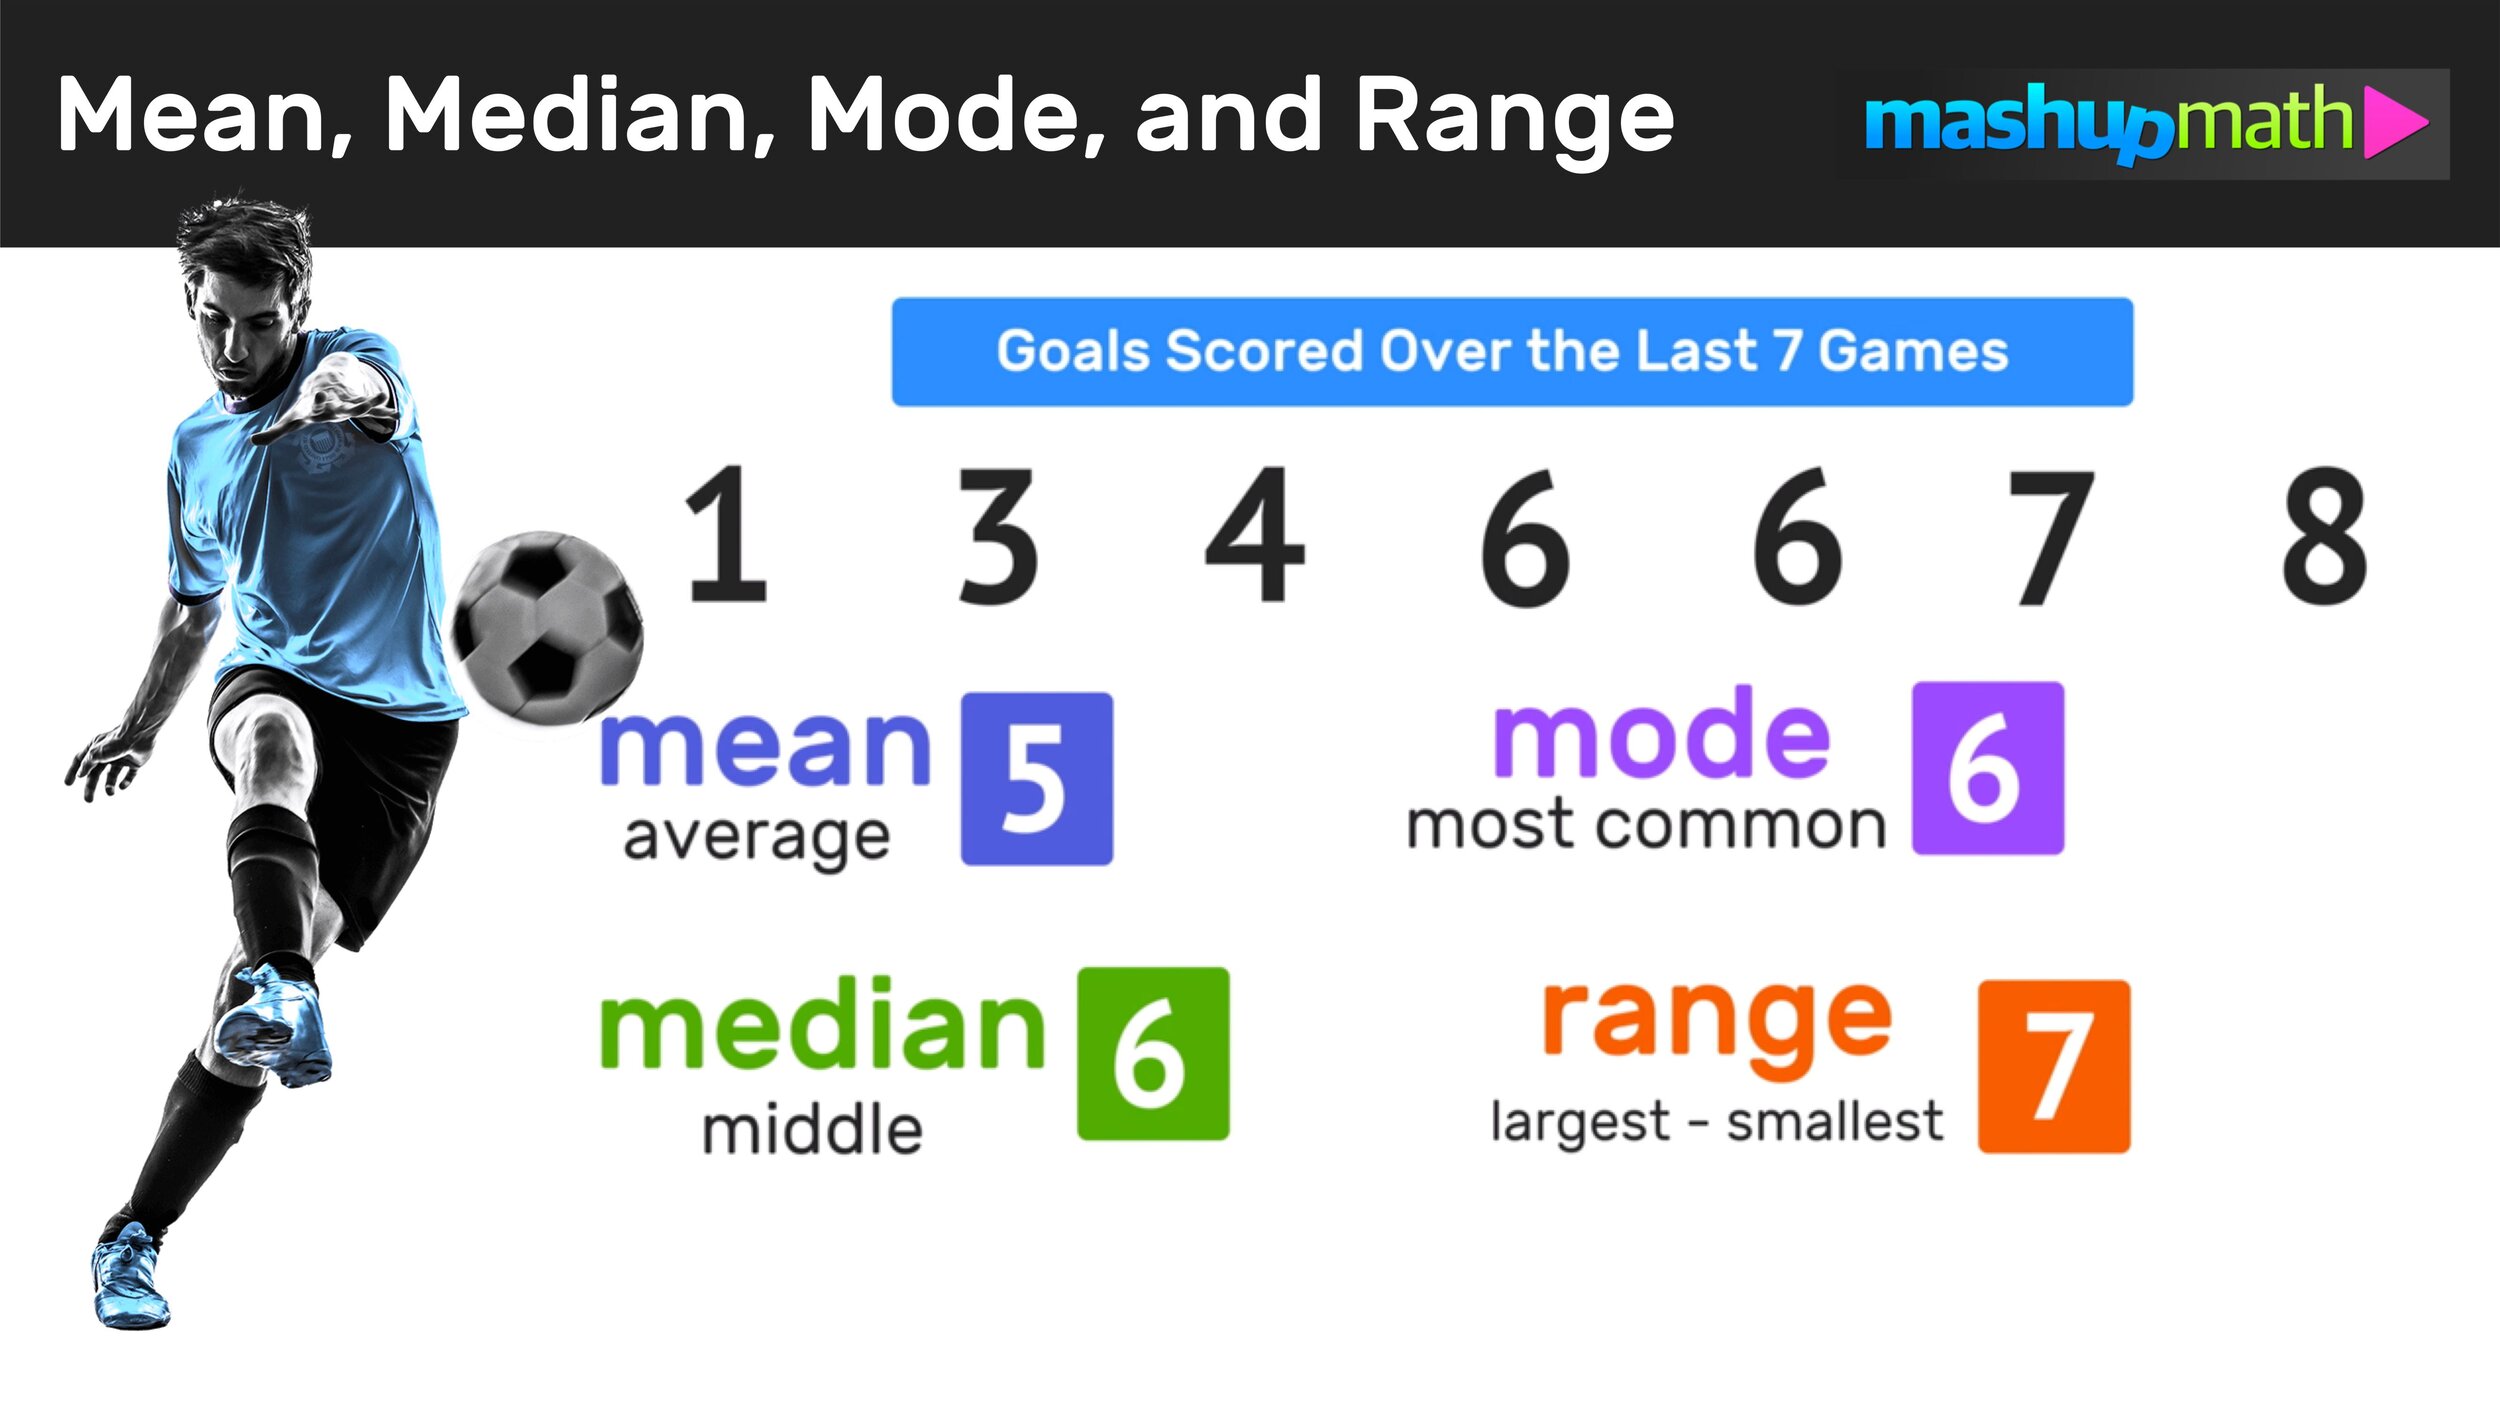
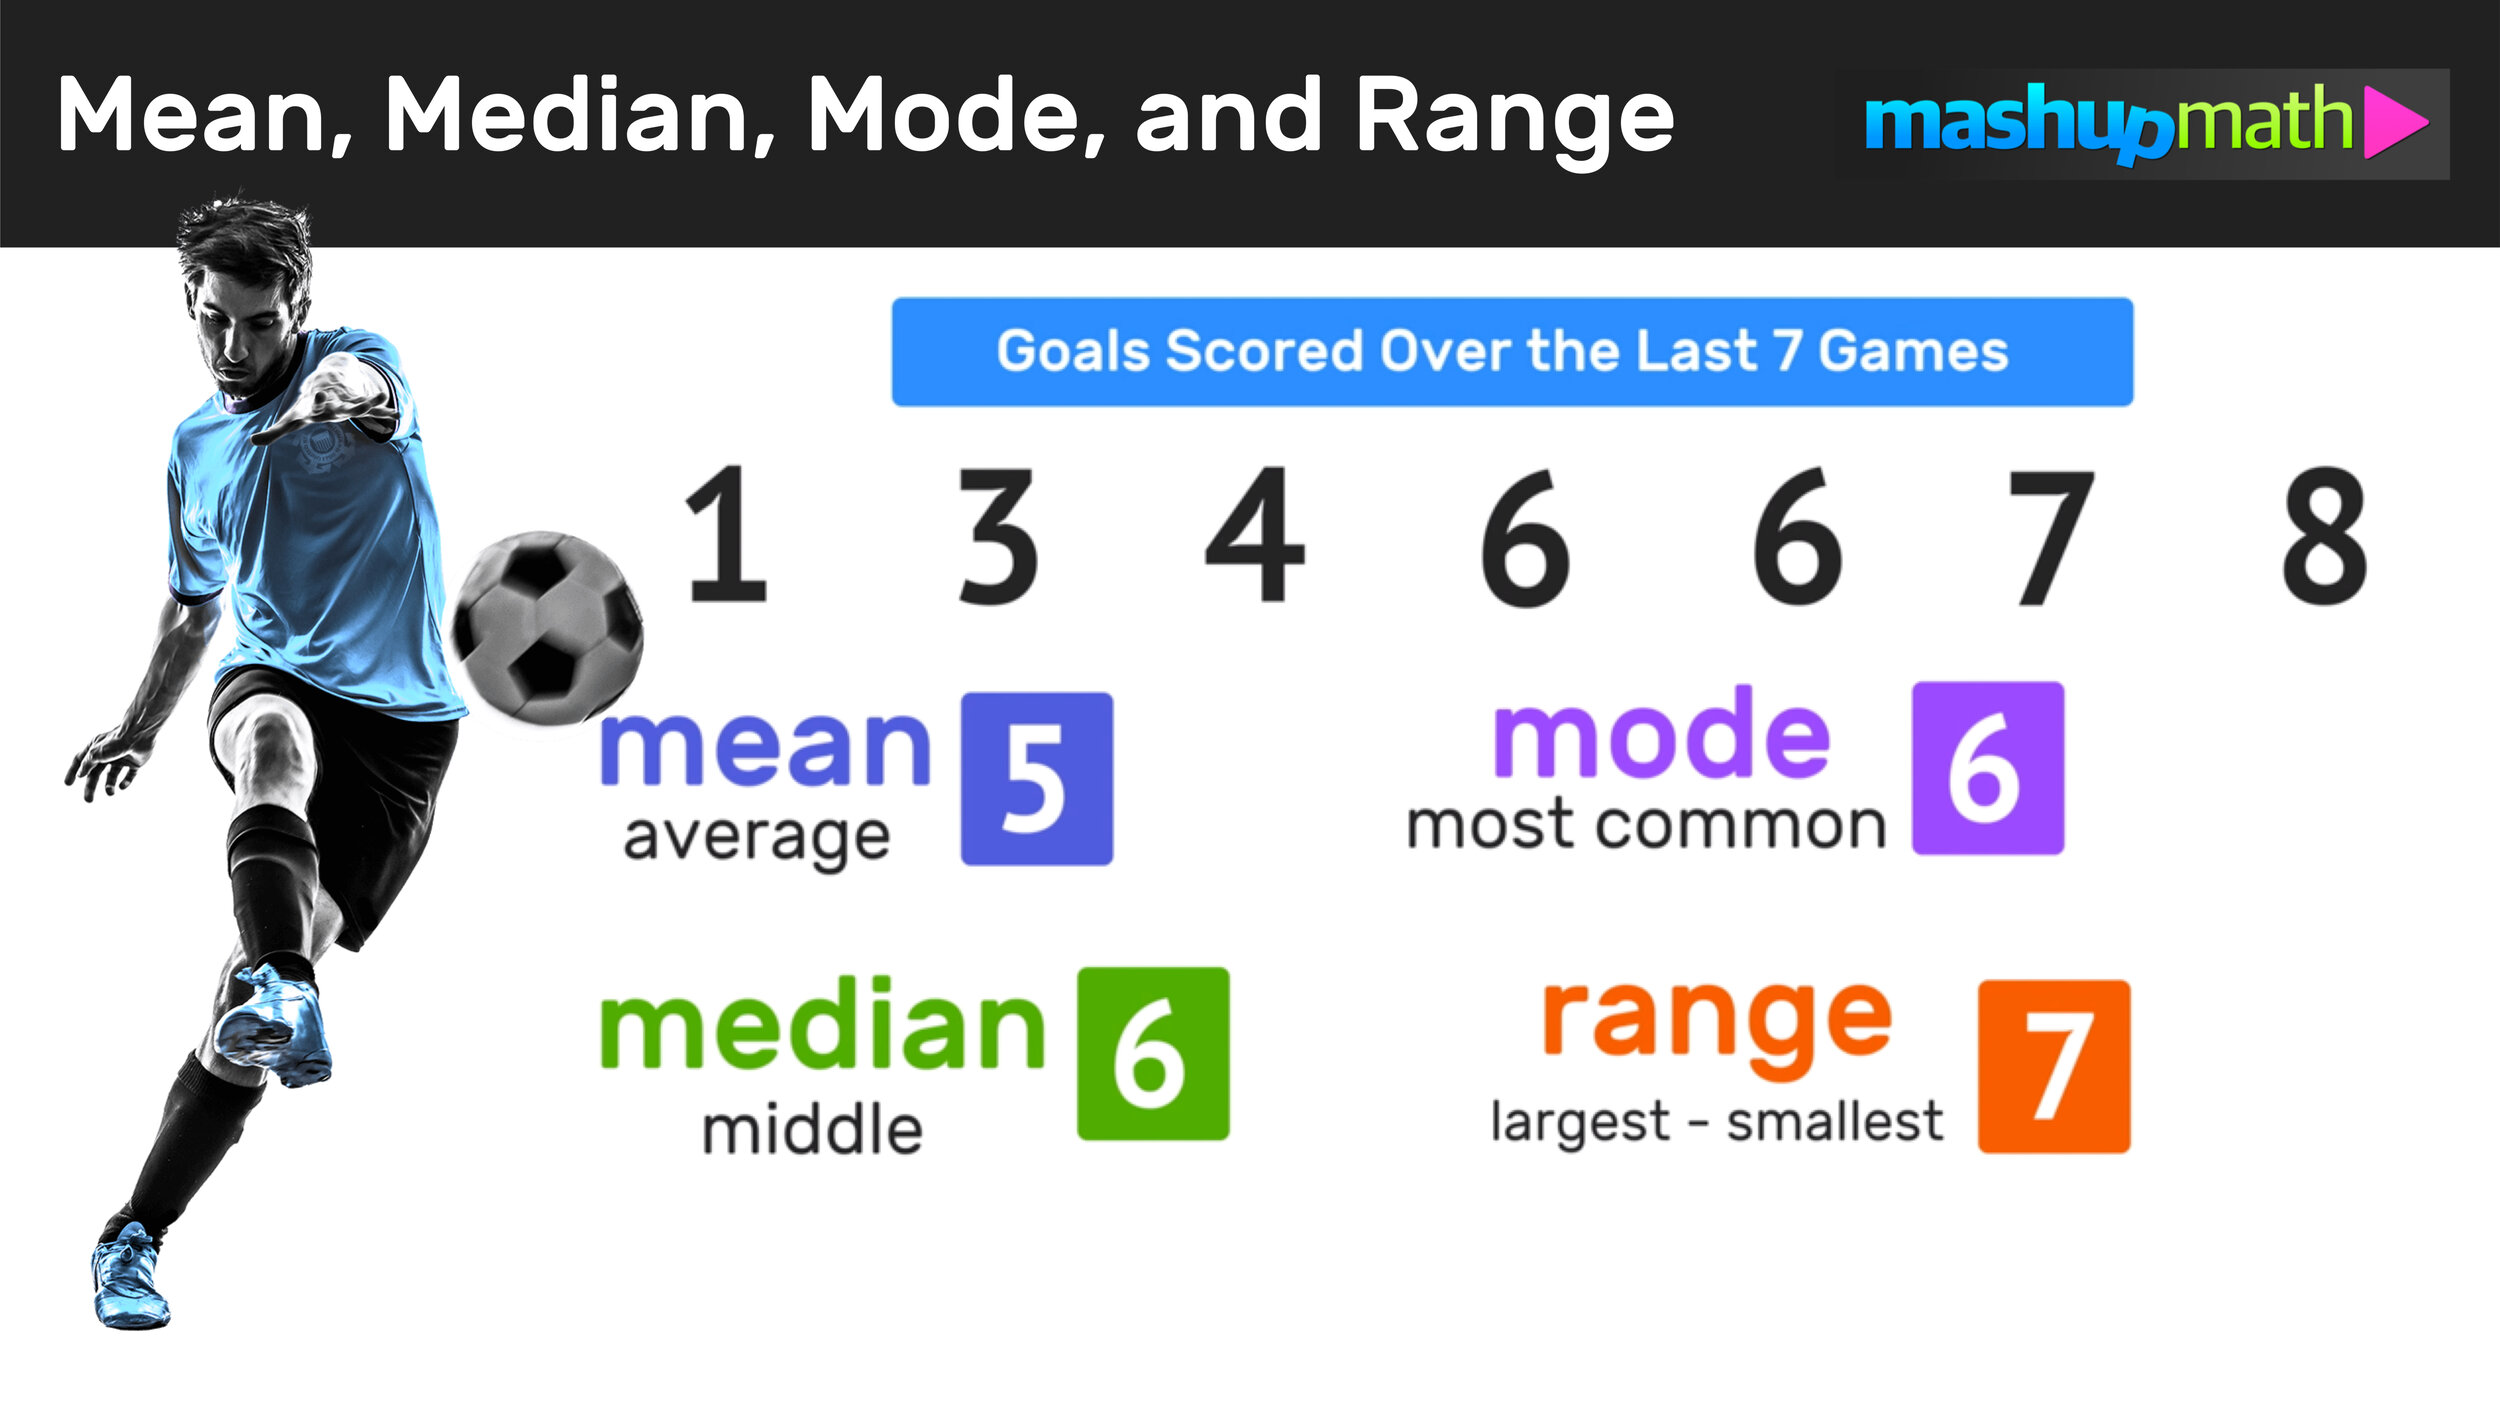
Mean, median, and mode are measures of central tendency and are three different ways of expressing averages of a set of data.
The key term here is average. In math, central tendency is a number or value that can be used to describe a central position, or average value, within a data set.
Furthermore, the range of a set of data is the difference between the highest and lowest values.

With this key math vocabulary in mind, let’s take a look at two examples
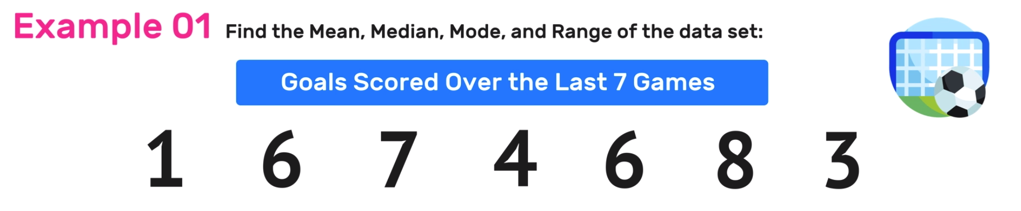
Example 01: Find the Mean, Median Mode, and Range
Find the mean, median, mode and range of the data set: 1, 6, 7, 4, 6, 8, 3
*Before you find the mean, median, mode, and range of a data set, be sure to rewrite the list of values in either ascending (least to greatest) or descending (greatest to least) form.
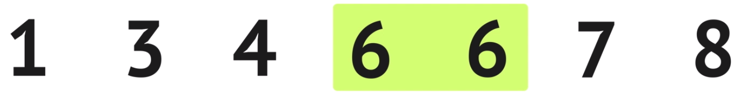
For today’s examples, we will be rearranging the original data set into ascending form where the values are placed in order from least to greatest as follows:

Now that we have rearranged the values of the data set in ascending order, we are ready to find values of central tendency.
Step 01: Find the Mean
How to Find the Mean of a Data Set
The mean is the numerical average of a data set.
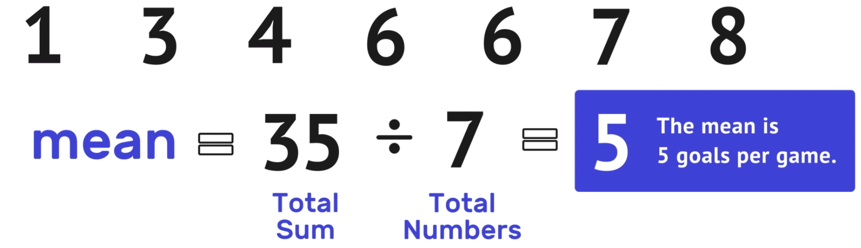
To determine the mean of the data set, divide the total sum by the total amount of numbers.
In this example, to find the total sum, add all seven values in the data set together as follows:
1 + 3 + 4 + 6 + 6 + 7 + 8 = 35
The total sum is 35.
Next, divide the total sum by the total amount of numbers in the data set (which, in this example is 7).
35/7 =5 >>> The mean is 5 goals per game.
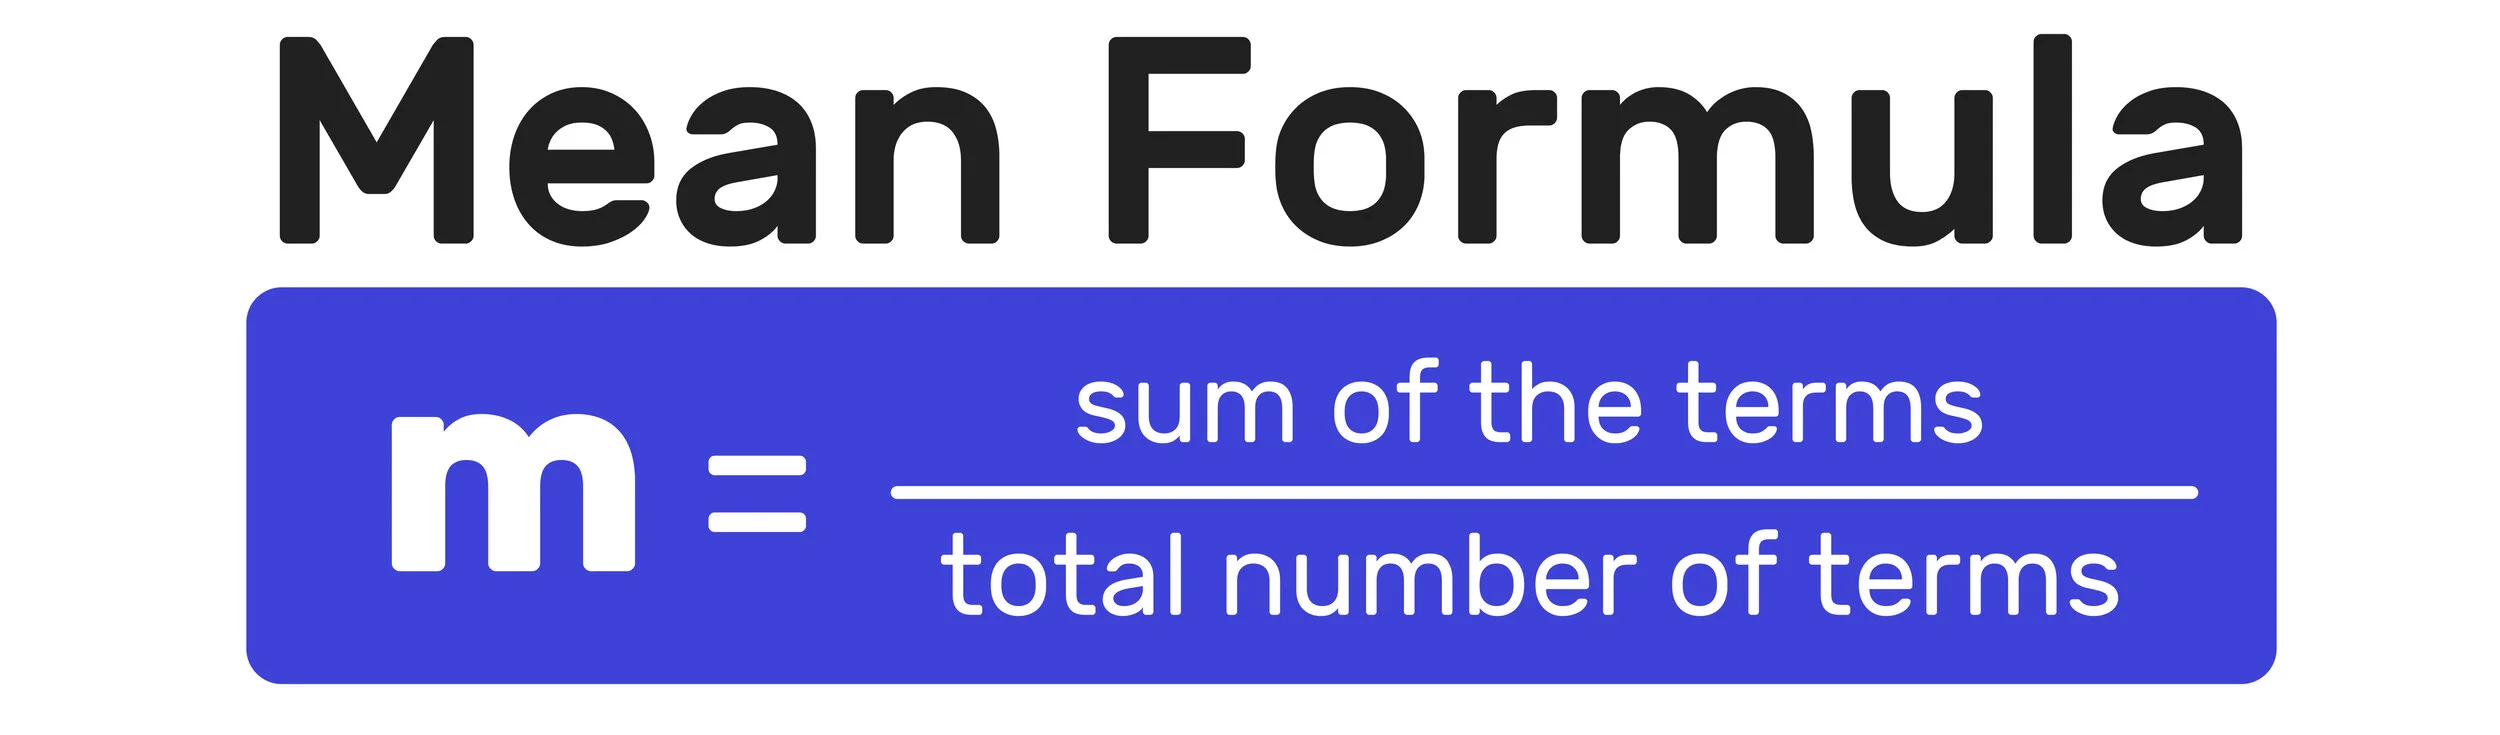
Mean Formula
For future reference, here is a handy formula that you can always use to find the mean of a data set. To determine the mean, simply divide the total sum of all of the values in the data set by the total number of values as follows:
Step 02: Find the Median
The median is the middle number or value of a data set.
To determine the median of numbers in the data set, simply find the middle value.
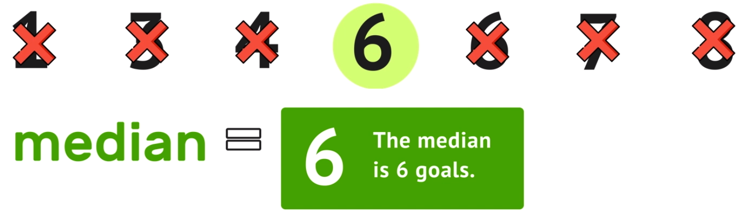
In this example, notice that there is an odd number of values in the data set (7 total). To find the median of numbers, start crossing the “bookend values” on each side of the data set as you make your way towards the middle until only one value remains as follows…

Clearly, the middle value is 6, so you can conclude that the median of the data set is equal to 6.
*Note that when there is an even number of values in the data set, using this strategy to find the median will require one extra step (we will go more in depth in example 2).
Median Calculator

Looking for a quick way to central tendency values? This median calculator (which is really a mean, median, mode calculator from Calculator Soup) is an excellent tool for quickly finding these values. However, this website should only be used a tool for checking your work and not a substitute for understanding how to actually find the mean, median, mode, and range of a data set.
Step 03: Find the Mode
The mode of a data set is the most common number. It is possible to have more than one mode, or no mode at all.
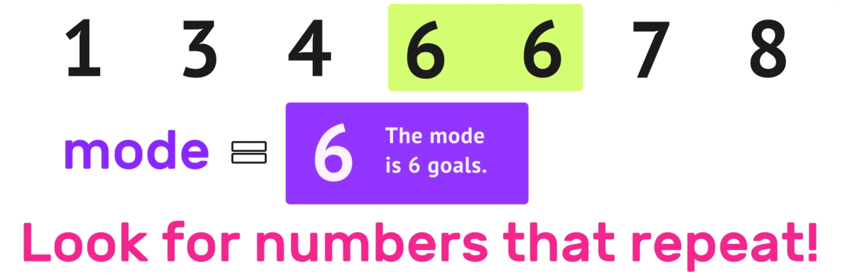
If you’re looking for a simple answer to how to find the mode of a data set, then you’re in the right place. To find the mode, simply look for the value that occurs the most often (i.e. the value that repeats more than any other value).
In this example, notice that the only value that repeats is 6…
Therefore, you can conclude that the mode for this data set is 6.
How to find the mode of a data set…
Just like in example 01, you can find the mode of a data set by determining which value is the most common. You can find this value by looking for numbers that repeat.
And remember that it is possible to have more than one mode or no mode at all!
Step 04: Find the Range
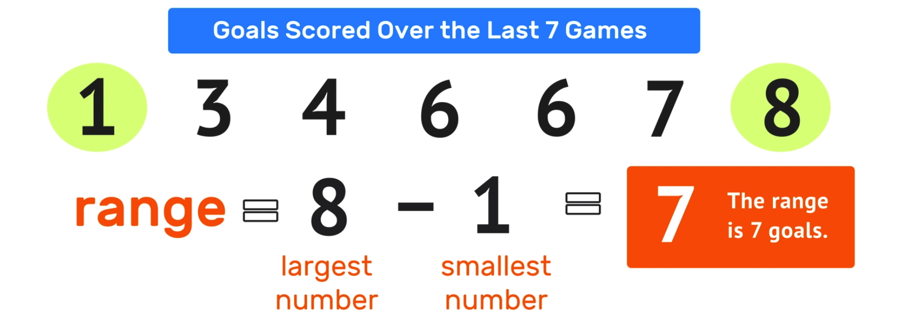
The range is the difference between the highest and lowest values in the data set (the largest number minus the smallest number).
To calculate range math, simply determine the largest and smallest values and then find the difference by subtracting (rearranging the numbers in ascending order at the very start of this example males calculating the range very easy).
In this example, the largest number in the data set is 8 and the smallest number in the data set is 1.
To find the range, simply perform 8 – 1 = 7
Therefore, the range is 7 goals.
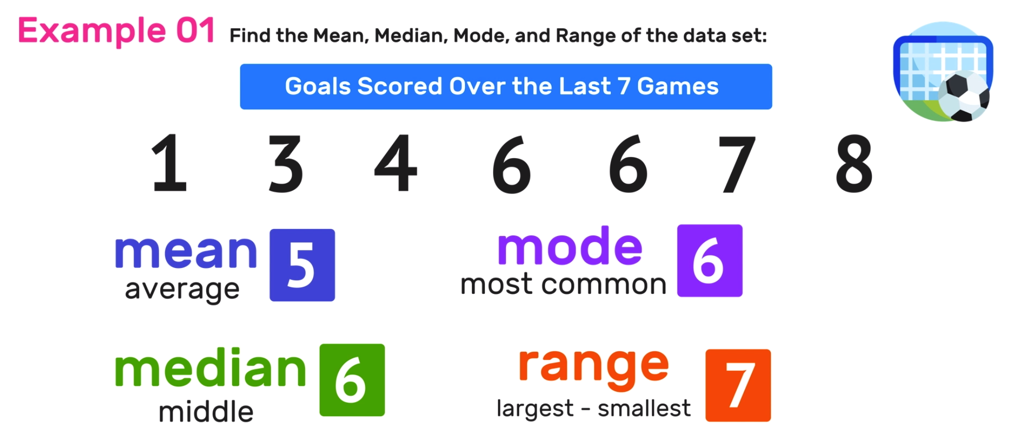
Quick Summary:
And now we have found all values of central tendency for this example. Here is a quick summary of what you just did!
Keep in mind that the process for determining mean, median, mode, and range of any data set is pretty much always the same. So, now let’s try a second example that involves a larger data set!
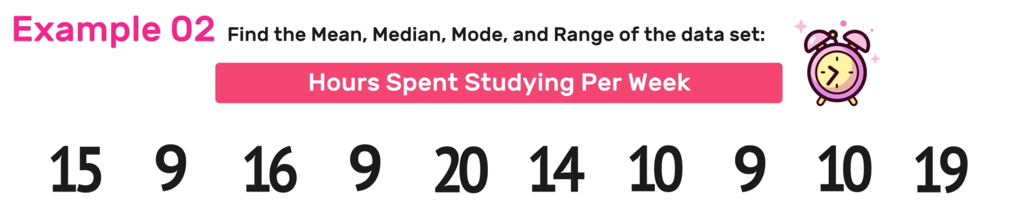
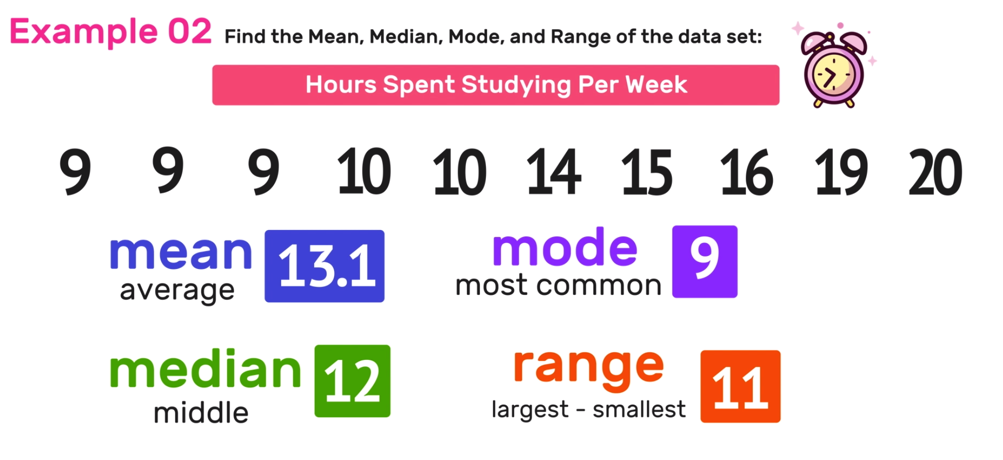
Example 02: Find the Mean, Median Mode, and Range
Find the mean, median, mode and range of the data set: 15, 9, 16, 9, 20, 14, 10, 9, 10, 9
Again, just like in Example 01, start by rearranging the numbers in the data set so that they are in ascending order from left to right…
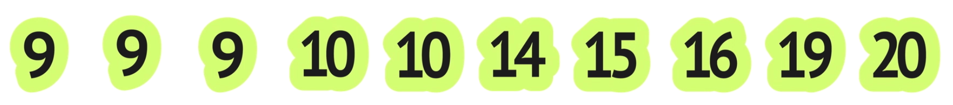
*Note that the values in the data set have not changed. All that you did was rewrite them in order from least to greatest, which will make finding the mean, median, mode, and range much easier for you (with or without a calculator).
Now you are ready to find the mean, median, mode, and range of this data set.
Step 01: Determine the Mean
To find the mean of the data set, remember to apply the mean formula, where you find the total sum of all of the numbers and divide it by the total number of values in the data set.

In this case…
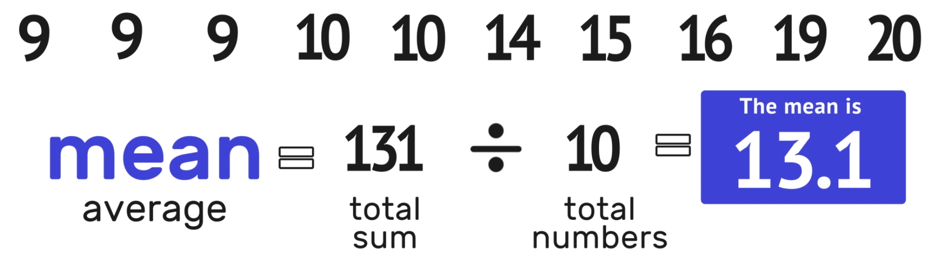
9 + 9 + 9 + 10 + 10 + 14 +15 + 16 + 19 + 20 = 131 (the total sum)
and there are 10 total numbers.
131/10 =13.1 >>> The mean is 13.1 hours studying
*Note that it will often be the case that the mean value is decimal.
Step 02: Find the Median
Remember that the median represents the middle value of a data set.
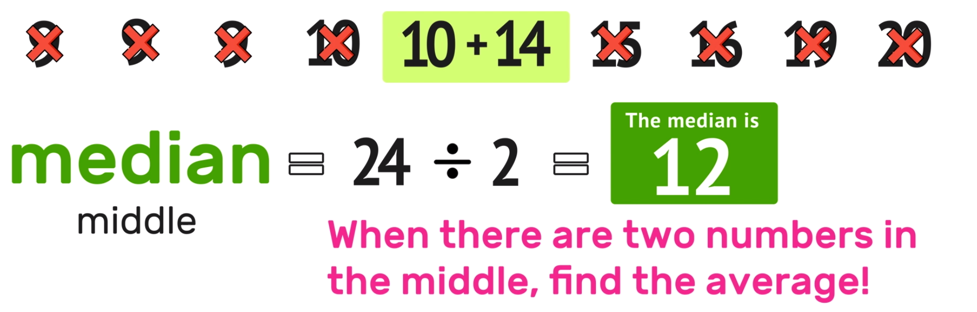
To determine the median of numbers in the data set, you perform the same process of crossing out the “bookend values” on the left and right of the data set until you reach the middle. Unlike the last example where the data set had an odd number of values, this data set has an even number of values (ten in total), which means that there will one be extra step involved to find the median.

After crossing out the outside values and working your way to the middle, you will notice that, because the data set has an even number of values, there are two values in the middle (in this case, 10 and 14).
So, which value is the median?
In cases like this, the median is the average of the two values. To find the average, simply add the two values together and divide the sum by two as follows:
10+ 14 = 24 >>> 24/2 =12
The median of the data set is 12 hours.
Step 03: Find the Mode
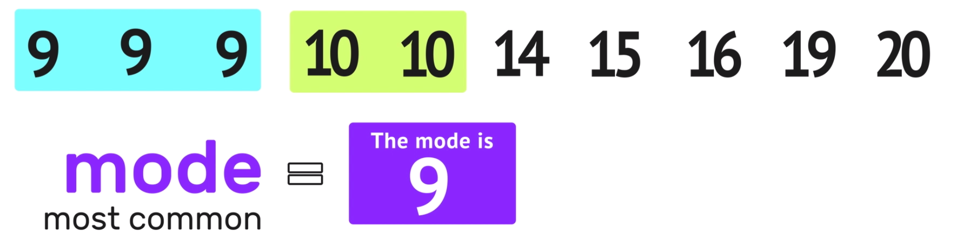
Remember that the mode of any data set is the most common number and that the key to finding the mode is to look for repeat values.

Notice that this data set has two values that occur more than once: 9 and 10. In this case, 9 shows up three times and 10 shows up twice. Since 9 shows up more often than 10, you can conclude that 9 is the most common number in the data set and that the mode is 9.
Step 04: Find the Range Math
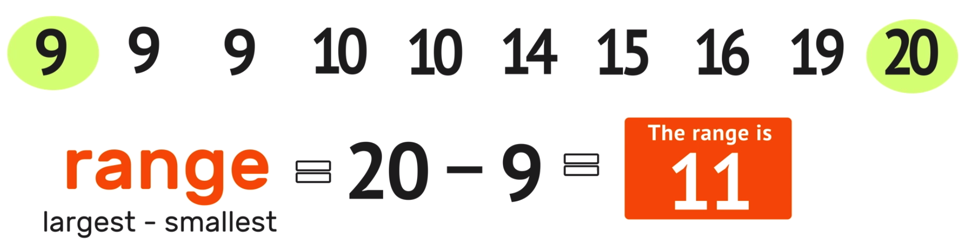
The last remaining measure of central tendency that you must find is the range, which is the difference between the largest number and the smallest number.
To calculate range for this example, look at the data set and identify the largest value (20) and the smallest value (9) and then find the difference as follows
20 -9 = 11 >>> The range of the data set is 11.
Example 02 Conclusion
You can click the link below to watch the animated video that accompanies this lesson.
Have thoughts? Share your thoughts in the comments section below!
(Never miss a Mashup Math blog--click here to get our weekly newsletter!)
More Posts You Will Love:


By Anthony Persico
Anthony is the content crafter and head educator for YouTube's MashUp Math. You can often find me happily developing animated math lessons to share on my YouTube channel . Or spending way too much time at the gym or playing on my phone.