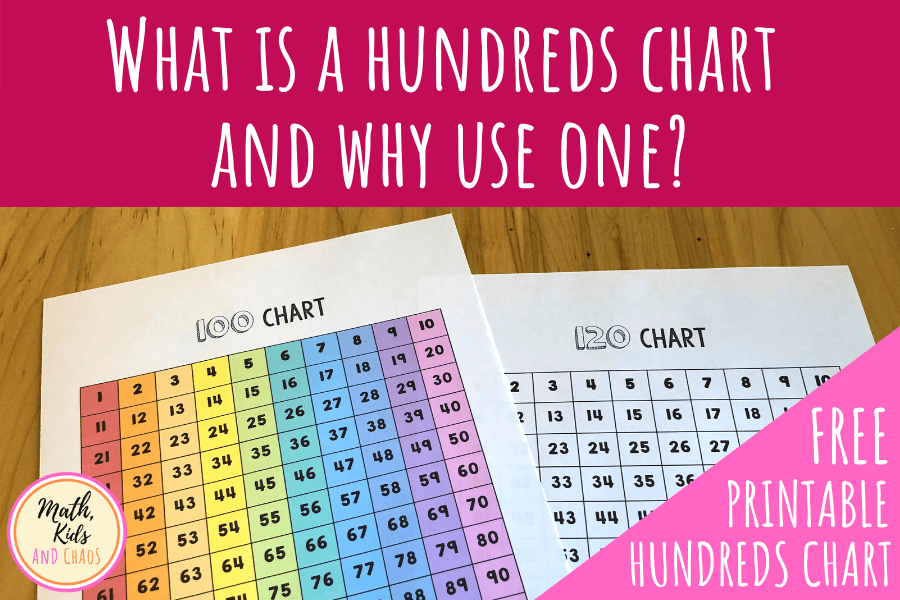
What is a hundreds chart and why use one? (Plus free printable charts)
This post will give you the low-down on hundreds charts – what they are and why they’re useful!
A hundreds chart is a staple in any kindergarten classroom. Why? Because it’s a fantastic tool for learning numbers to 100, developing counting skills and building number sense.
Wondering what all the fuss is about? This post will tell you.
Plus, join our email newsletter and receive your own set of printable hundreds and 120 charts to use at home with your children, or in the classroom with your students.
So, without further ado…
What is a hundreds chart?
A hundreds chart is a 10 x 10 grid showing all the numbers 1 to 100 in order from smallest to largest. It looks like this:
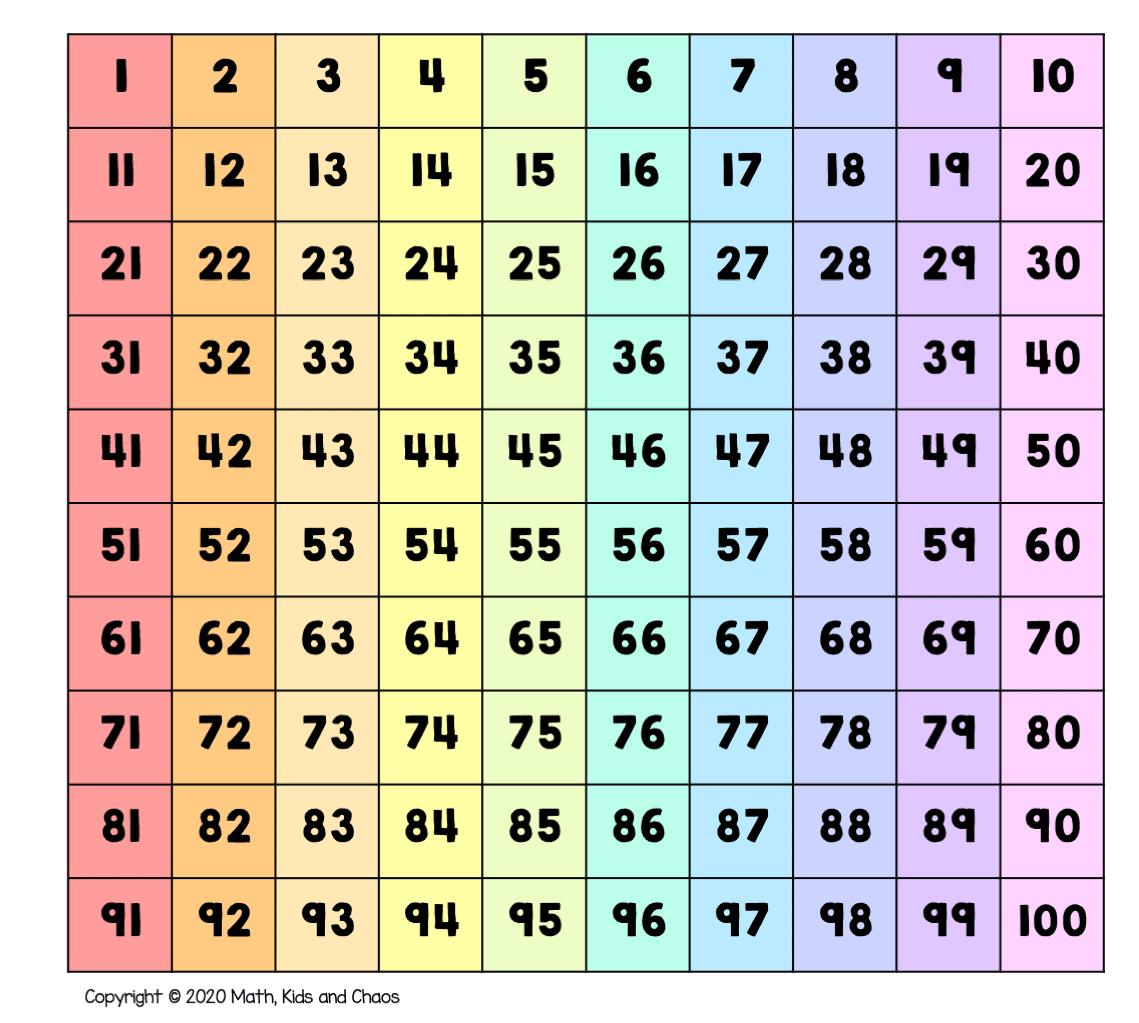
A hundreds chart is very helpful for children who are building fluency with numbers to 100 and developing counting skills.
With a hundreds chart, numbers read from left to right in rows of 10, starting from the top left corner with the number 1, all the way down to 100 in the bottom right corner.
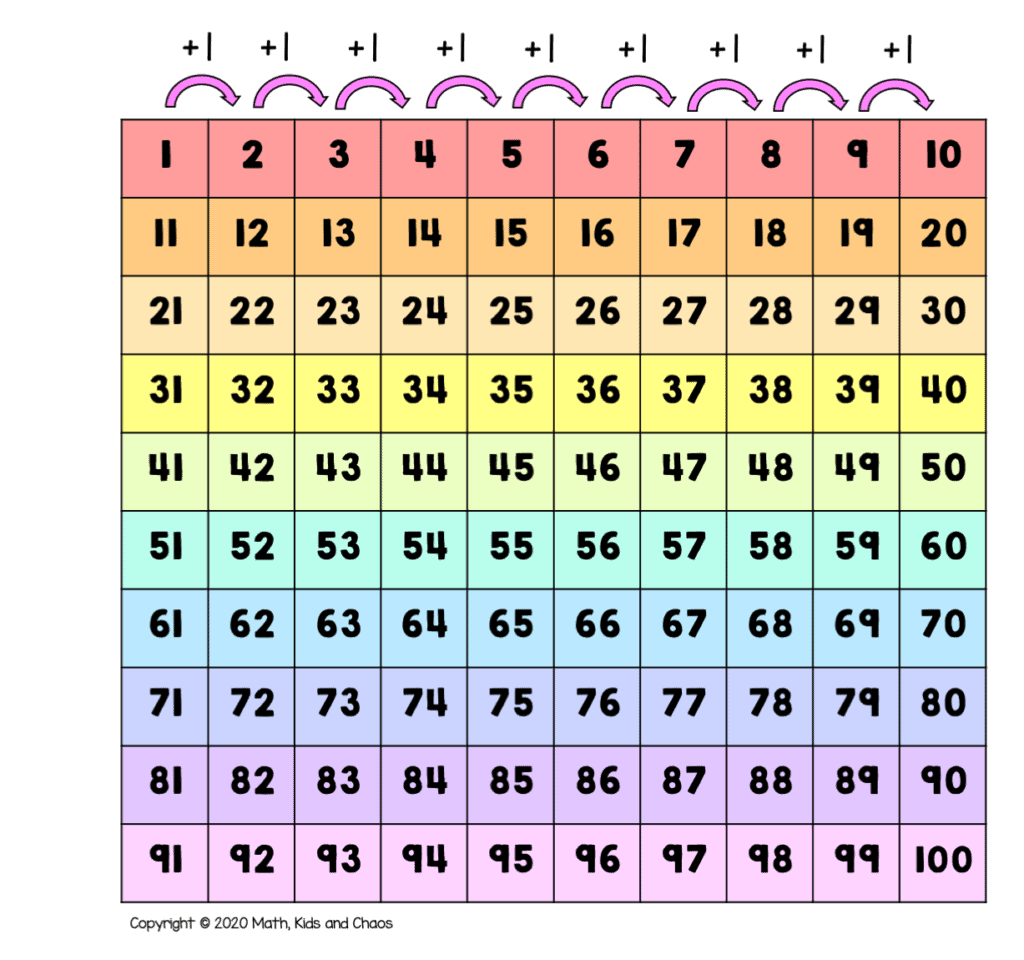
If you look at the horizontal rows of numbers, you can see that as you move from left to right, the numbers increase by 1:
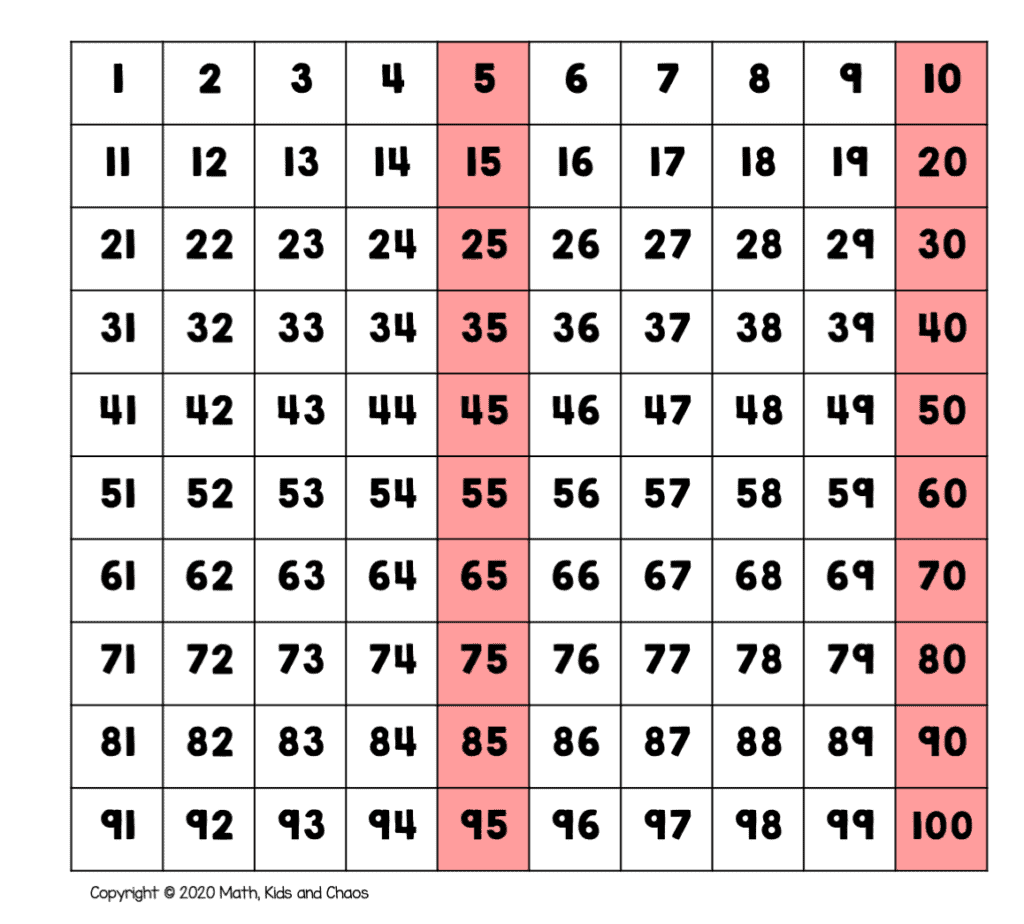
If you look at the vertical columns, you’ll notice that as you move down a square, the number increases by 10.
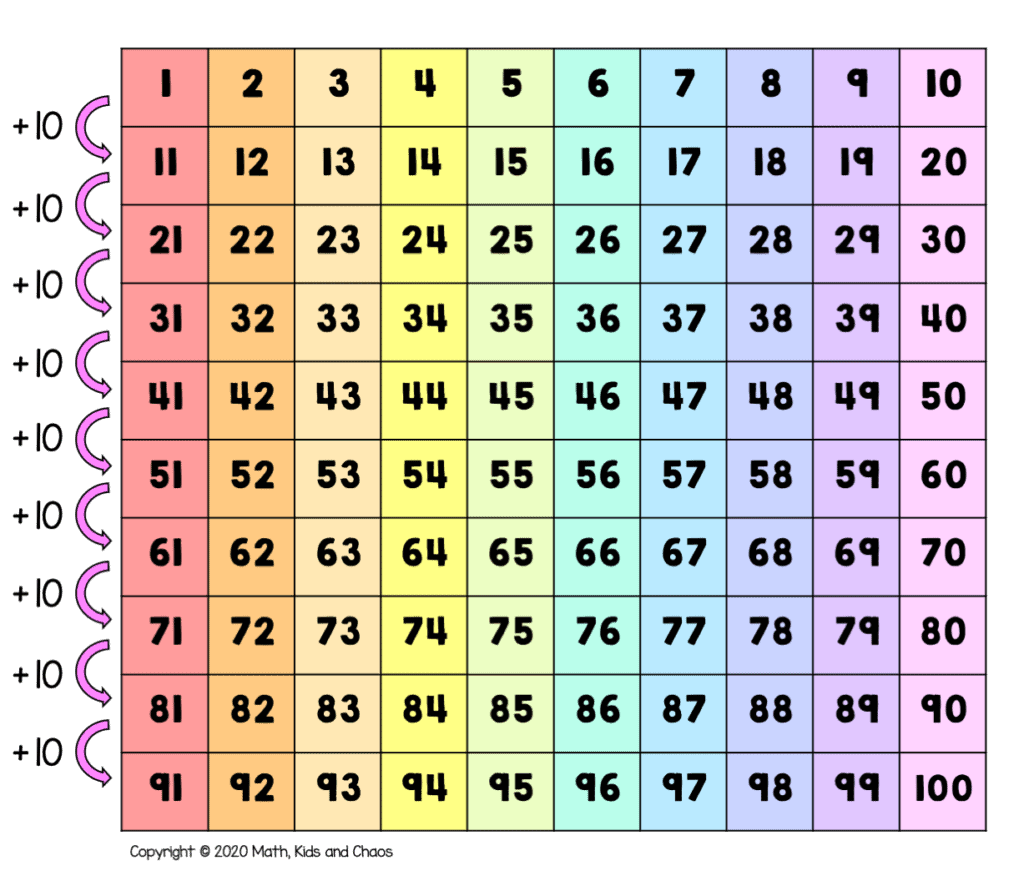
For example, if you look at the column shaded in red above, you’ll see the numbers are increasing by 10 each time (1, 11, 21, 31 and so forth). Each number ends in a 1, but the tens digit is increasing by 1 each time.
Hundreds chart vs 120 chart
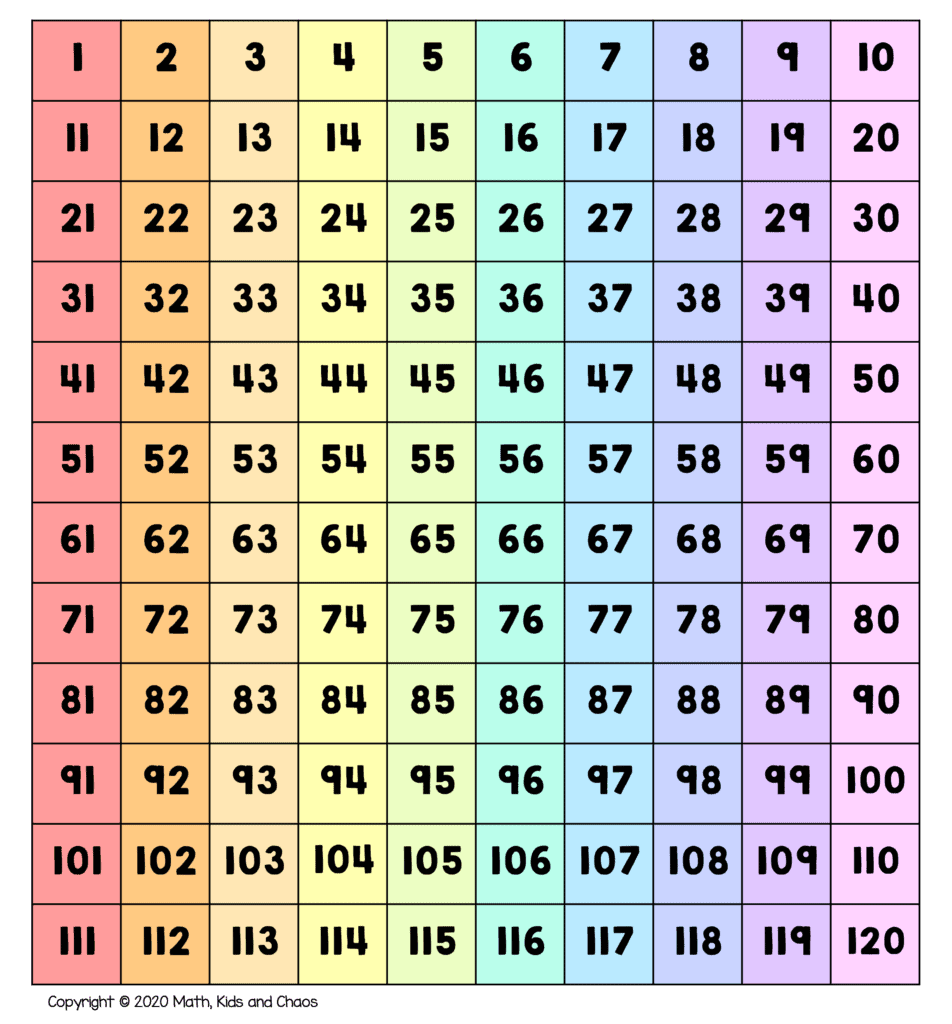
These days you may find that the traditional hundreds chart has been replaced with a chart counting up to 120 (a 120 chart), like so:
Why a 120 chart, you ask?
Well, whilst a hundreds chart is great for helping children become confident with numbers up to 100, it doesn’t help them see how the number system works beyond 100.
When getting to grips with our number system, children often find the transition from one hundred to the next quite tricky. In fact, ask them what number comes after 100 and you may get all manner of answers. Sometimes you get 200, sometimes 110 or 111…
By using a 120 chart, it allows children to become familiar with how numbers progress into the next 100.
So, now we’ve talked about what a hundreds chart is, let’s move on to why it might be useful.
Why use a hundreds chart?
There are lots of reasons to use and explore a hundreds chart with your child. Here are a few:
1. To develop counting skills and number sense
This one may sound obvious, but a hundreds chart is a brilliant tool for children who are working on building number sense and learning to count.
Let’s think about counting for a second. Ask a young child to count to 100 and you may well find that they lose their place, skip over or repeat numbers along the way.
Using a hundreds chart to practise counting means they can follow along with the numbers on the chart as they count. (After all, if you think about it, a hundreds chart is basically a really long number line to 100, but packaged in a handy and compact 10 x 10 grid.)
Plus, by counting using a hundreds chart, they can see the number as they say it, which means they start to connect the number name to the numerals that represent that number.
You can also use a number chart to practise counting backwards – simply read numbers from right to left instead of left to right.
In addition to counting by 1s, hundreds charts are great way to introduce skip counting, which leads me on nicely to point 2 below…
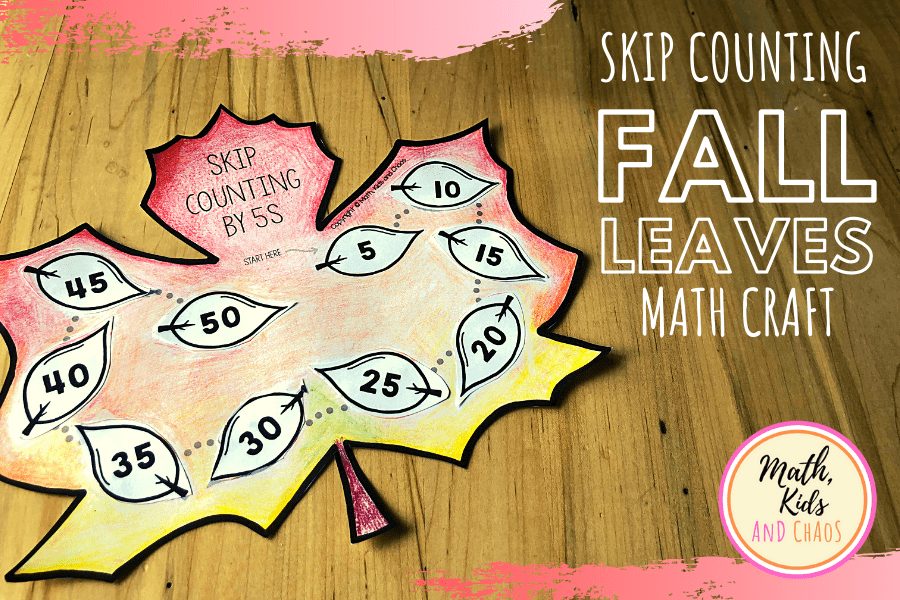
2. Skip counting
Hundreds charts are really helpful when children begin with skip counting.
For example, let’s use the hundreds chart to show how to skip count by 5.
Using a blank hundreds chart, shade in every 5th number on a chart, like so:
By using a hundreds chart to introduce skip counting, a child is able to really see the idea behind it, i.e. that we are skipping over 4 numbers and then shading in the 5th (and then repeating this process over and over as we skip count).
When skip counting, it’ also a great idea to take time to look at the patterns that emerge in the hundreds square, both in terms of the numbers you are shading in and also the patterns that the shaded squares create.
For example, with the 5s (above), you can see that the shaded squares create two vertical lines. In terms of the numbers we have shaded in, they all end in either a 5 or a 0.
Skip counting by 2s is another good one to try.
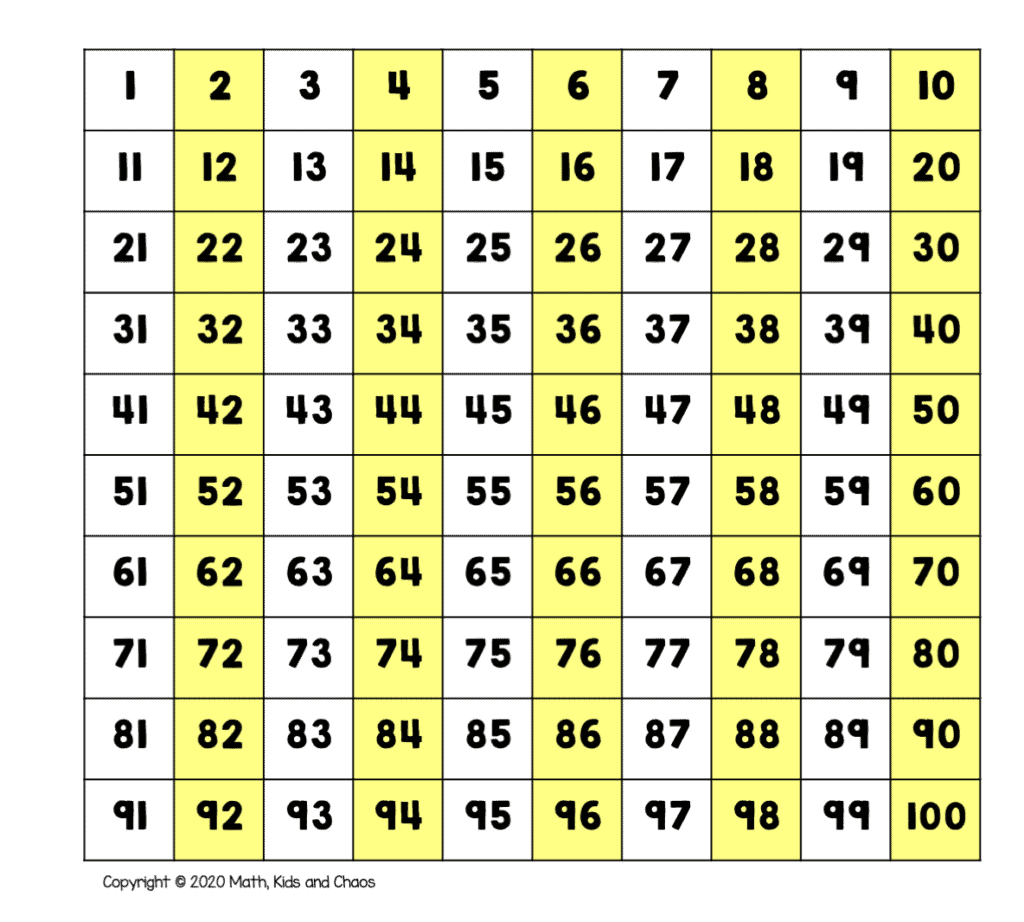
Here you can see that it creates even more vertical columns of shaded squares. Of course, starting at 0 and skip counting by 2 means that we shade in all the even numbers (ending in 0, 2, 4, 6 and 8).
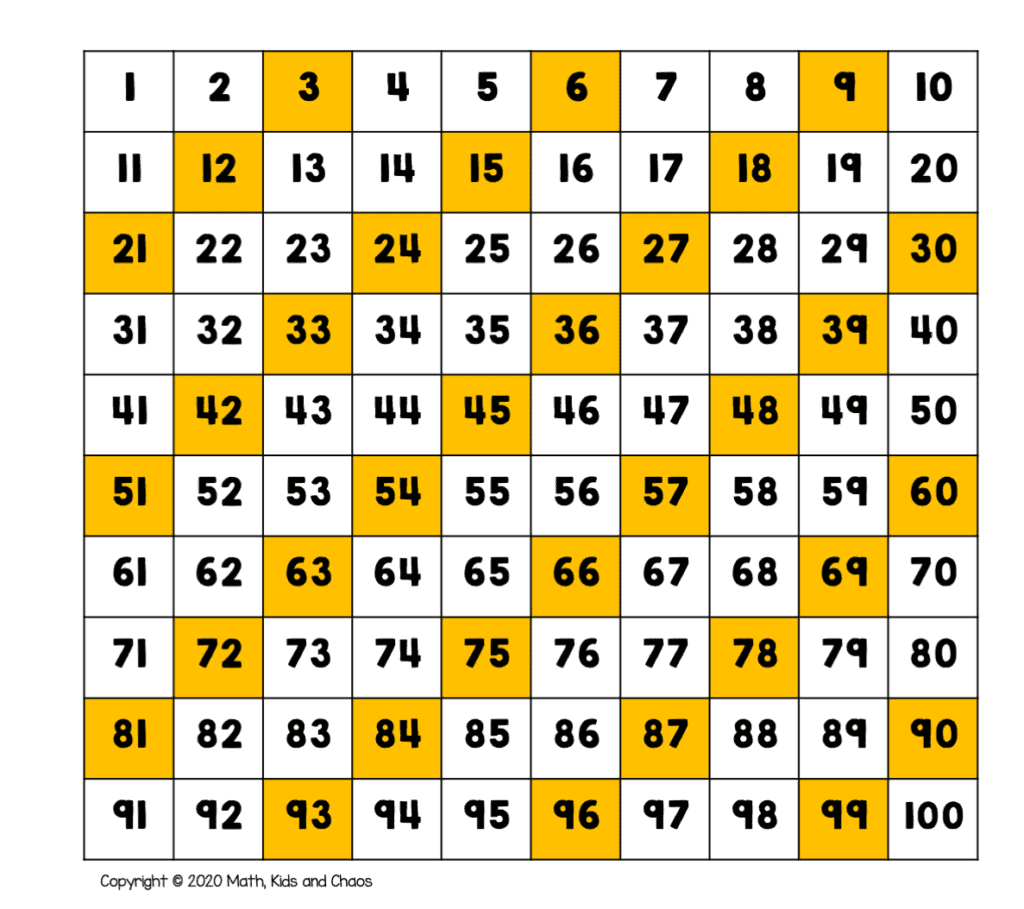
And by means of a last example, we have skip counting by 3. This is a fun one as the numbers always make such a great pattern on the chart. It’s really fun to see the diagonal stripes emerge as you skip count.
3. Adding and subtracting numbers
Another great use for the hundreds chart is for adding and subtracting numbers within 100. Although that sounds like it might be complicated, it’s actually really straightforward.
Let me show you how.
How to add using a hundreds chart
Let’s take 23 + 30 as an example.
Firstly, find the number 23. This is where you’ll start.
Next, you want to add 30. We know that with each hop down the chart, we are adding 10. We know that 30 is equal to 3 groups of 10. So this means we want to move 3 squares down the chart like so:
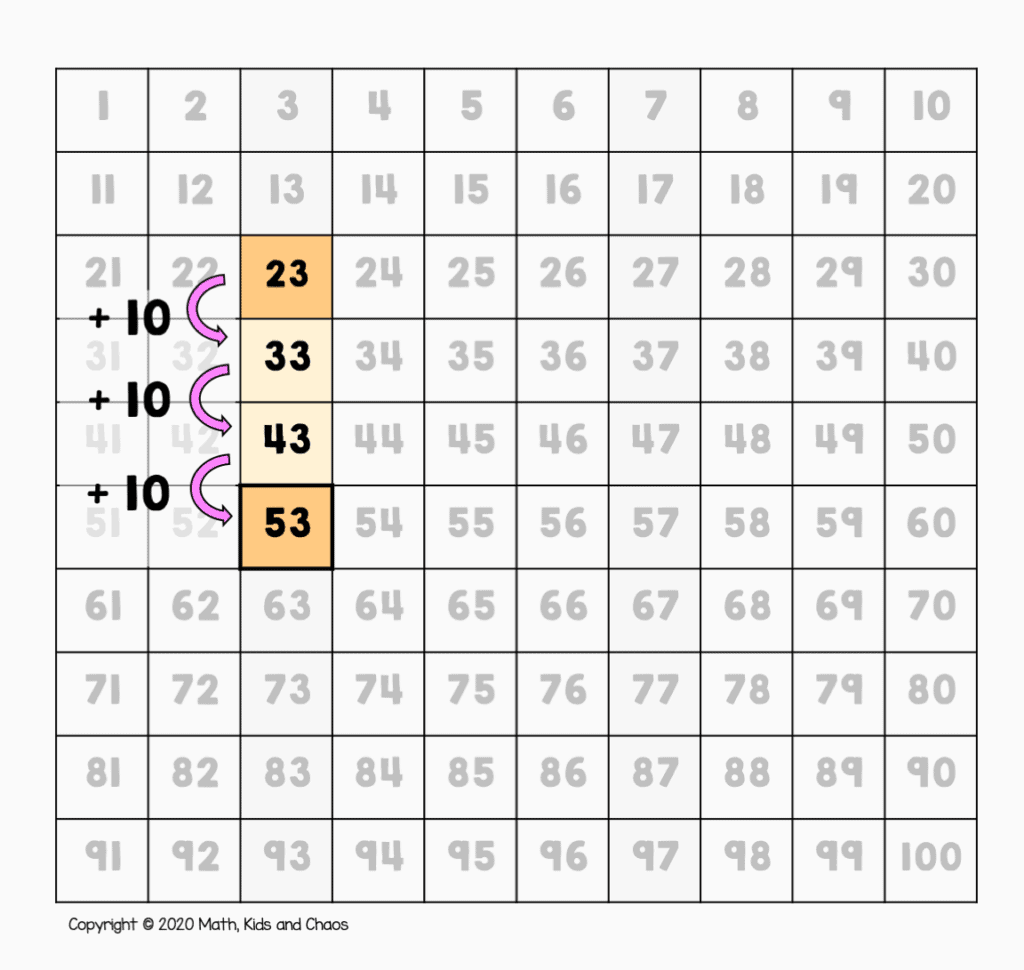
And we land on is 53, so this tells us that 23 + 30 = 53.
Let’s take another example: 49 + 13.
Start by finding 49 on the hundreds chart. As we are adding 13, we want to first add 10 and then the 3 ones.
So, starting at 49, move down one square to add 10. Then move along the row 3 squares to the right. In this example we actually finish one row so just move down to the next.
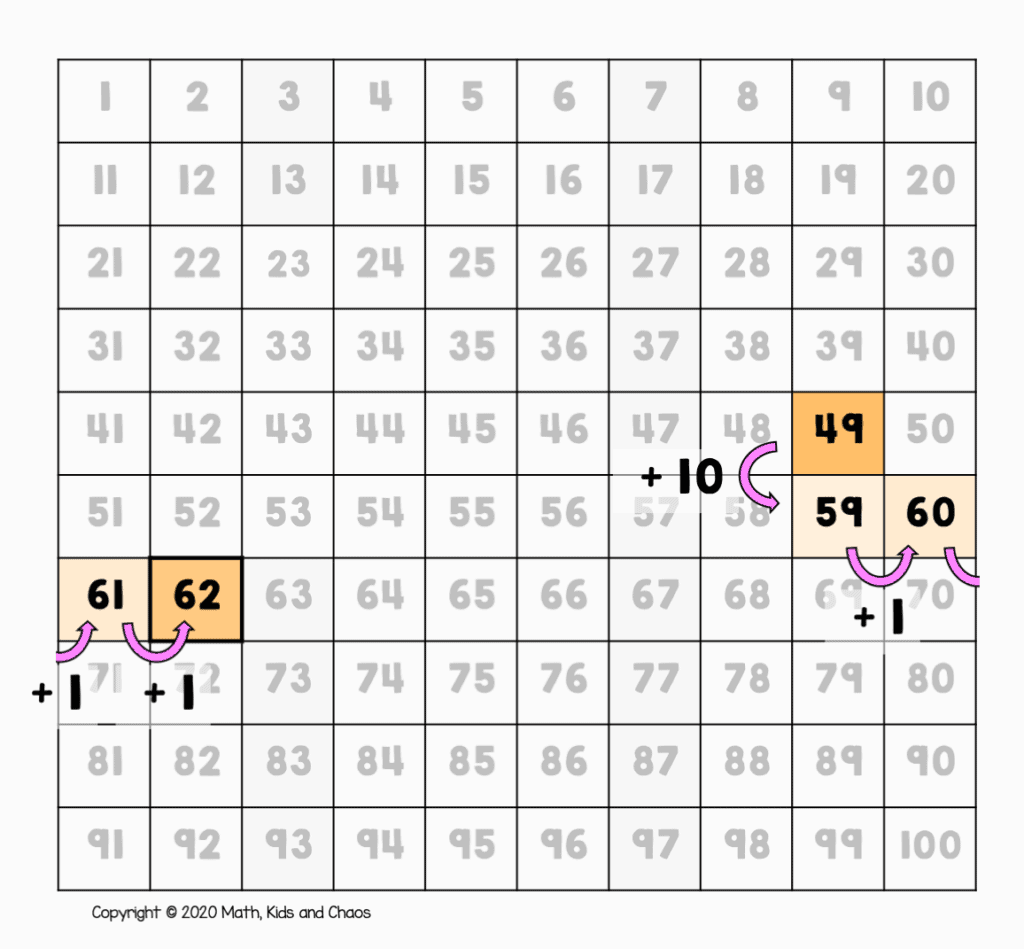
And we land on 62. So 49 + 13 = 62.
How to subtract using a hundreds chart
Once you know how to add numbers, subtracting them is basically the same but in reverse.
Let’s take an example, say 68 – 27.
We start by finding 68 on the hundreds chart. We are subtracting 27, so we want to subtract 20 first and then 7 ones.
To subtract 20, move up the chart 2 squares (2 tens). Then subtract the 7 ones by moving 7 squares to the left.
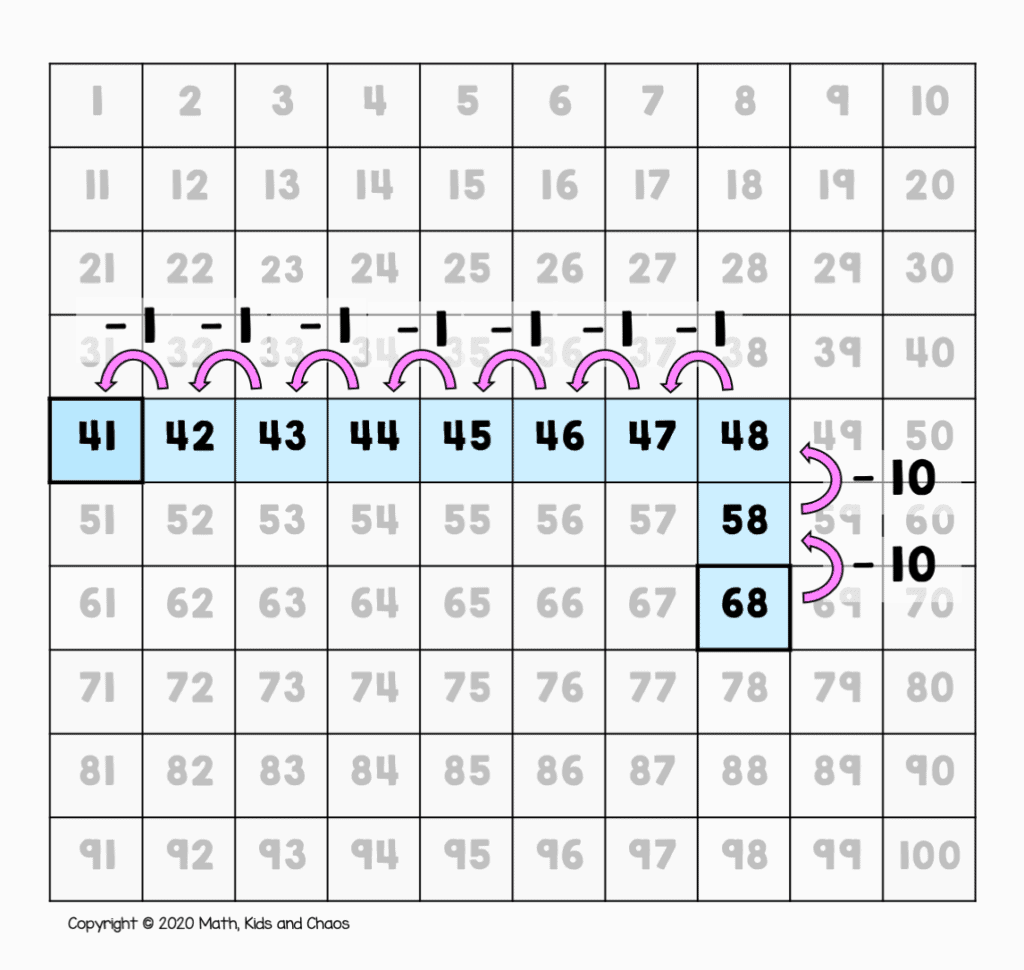
And we finish on 41. So 68 – 27 = 41.
Once children understand how the numbers in the chart work (with adding and subtracting 10s and 1s) it’s easy to use the chart to solve addition and subtraction questions involving 2 digit numbers.
And there we have it! Just a few of the ways that you can use a hundreds chart in math.
Want your own 100 and 120 charts?
When helping your child with number work in math, I find it’s always helpful to have a hundreds chart to hand that you can refer to if need be.
Subscribe to our email newsletter and access your own set of printable charts! Just use the sign-up box below:
If your child is working on counting to 100, you’ll find a whole section of activities for practising counting to 100 by 1s and 10s in our new Kindergarten Number Pack.
This pack is full to the brim with 120 printable activities just for kindergarteners.
Click on the ‘learn more’ button below to find out more and to watch the video sneak peek!
I hope you’ve found today’s post about 100 charts helpful! Thanks for stopping by.
If you liked this post, why not pin it? Thanks for your help!
More from Math, Kids and Chaos:
Choose your grade level: