Article

The Qc5 Allele Increases Wheat Bread-Making Quality by Regulating SPA and SPR

1
State Key Laboratory of Crop Gene Exploration and Utilization in Southwest China, Sichuan Agricultural University, Chengdu 611130, China
2
Triticeae Research Institute, Sichuan Agricultural University, Chengdu 611130, China
*
Authors to whom correspondence should be addressed.
These authors contributed equally to this work.
Int. J. Mol. Sci. 2022, 23(14), 7581; https://doi.org/10.3390/ijms23147581
Submission received: 4 June 2022 / Revised: 1 July 2022 / Accepted: 6 July 2022 / Published: 8 July 2022
(This article belongs to the Special Issue Molecular Genetics and Plant Breeding 2.0)

Abstract

:
Common wheat (Triticum aestivum L.) is an important food crop with a unique processing quality. The Q gene positively regulates the processing quality of wheat, but the underlying mechanism remains unclear. Here, a new Q allele (Qc5) responsible for compact spikes and good bread performance was identified. Compared with the Q allele widely distributed in modern common wheat cultivars, Qc5 had a missense mutation outside the miRNA172-binding site. This missense mutation led to a more compact messenger RNA (mRNA) secondary structure around the miRNA172-binding region, resulting in increased Qc5 expression during the spike development stage and a consequent increase in spike density. Furthermore, this missense mutation weakened the physical interaction between Qc5 and storage protein activator (SPA) in seeds and suppressed the expression of storage protein repressor (SPR). These changes increased the grain protein content and improved the bread-making quality of wheat. In conclusion, a missense mutation increases Q expression because of the resulting highly folded mRNA secondary structure around the miRNA172-binding site. Furthermore, this mutation improves the bread-making quality of wheat by repressing the expression of SPR and influencing the physical interaction between Q and SPA. These findings provide new insights into the miRNA172-directed regulation of gene expression, with implications for wheat breeding.

Graphical Abstract

1. Introduction

Common wheat (Triticum aestivum; 2n = 6x = 42, AABBDD) originated about 8000 years ago in the Fertile Crescent of the Middle East [1,2] and has since spread worldwide to become one of the most important food crops. Common wheat resulted from the hybridization between the domesticated tetraploid wheat Triticum turgidum (2n = 4x = 28, AABB) and the diploid Aegilops tauschii (2n = 2x = 14, DD) [2]. The Food and Agriculture Organization of the United Nations estimates that wheat provides approximately 20% of the calories and 22% of the proteins consumed by humans worldwide [3].
The unique processing quality of wheat is due to its seed storage proteins (SSPs), including gliadins and glutenins (i.e., gluten) [4]. Gliadins, which are monomeric compounds, can be classified as α- (α/β-), γ-, and ω-gliadins [5]. Glutenins consist of high molecular weight glutenin subunits (HMW-GS) and low molecular weight glutenin subunits (LMW-GS) [6], which form large macropolymers during the grain desiccation stage [7]. Glutenins strengthen wheat dough by conferring elasticity, whereas gliadins affect dough viscosity by conferring extensibility [8]. The SSP content (grain protein content; GPC) and composition are critical factors influencing the processing quality of wheat, and thus affect wheat price. Therefore, elucidating the mechanisms mediating SSP synthesis is necessary.
The synthesis of SSPs during the grain filling stage is primarily regulated by a network of cis-elements and their interacting transcription factors (TFs) [9,10,11]. Previous studies revealed that the accumulation of SSPs is controlled by several TF families, namely basic leucine zipper (bZIP), DNA binding with one finger (DOF), myeloblastosis (MYB), B3 DNA-binding domain transcription factor (B3), and no apical meristem (NAM)/ATAF subfamily/cup-shaped cotyledon (CUC) family transcription factor (NAC). The bipartite endosperm box consists of a GCN4-like motif (GLM; 5′-ATGAG/CTCAT-3′) and a prolamin box (P-box; 5′-TGTAAAG-3′). Earlier research indicated that GLM is recognized by bZIP TFs, such as BLZ1 and BLZ2 in barley [12,13] or storage protein activator (SPA) in wheat [14], whereas P-box is a binding site for DOF TFs, including prolamin box-binding factor (PBF) and scutellum and aleurone-expressed DOF (SAD) [12,15,16]. The RY repeat (5′-CATGCATG-3′), which is also a conserved motif in SSP gene promoters, is recognized by the B3 protein FUSCA3 [17,18,19]. Moreover, TaGAMyb regulates glutenin gene expression by directly binding to a 5′-C/TAACAAA/C-3′-like motif in the promoter of HMW-GS genes and by recruiting GCN5 to modulate histone acetylation [20]. Additionally, the MYB TFs TuODORANT1 and TaODORANT1 are suppressors of SSP synthesis [21]. An NAC family TF (i.e., storage protein repressor; SPR) binds to the cis-element 5′-CANNTG-3′ to suppress the accumulation of SSPs [22]. Another endosperm-specific NAC TF (TaNAC019) directly activates the expression of HMW-GS genes by binding to their promoters and by interacting with TaGAMyb [23]. Opaque-2, which is an endosperm-specific bZIP family member in maize, binds to the promoter of the gene encoding the 22 kD zein protein to activate transcription [24]. In wheat, SPA is an opaque-2-like protein, which activates the transcription of LMW-GS genes by binding to two GLMs [14]; furthermore, SPA also enhances the expression of HMW-GS genes by binding to two GLMs and G-box in their promoters [25,26]. Moreover, SPA can activate the expression of ω-gliadin genes [27]. In addition to binding to DNA, TFs may interact with each other (i.e., protein–protein interactions) to form relatively large TF complexes that regulate the expression of SSP genes [28]. Furthermore, the SPA heterodimerizing protein (SHP) represses HMW-GS and LMW-GS gene promoter activities [26].
MicroRNAs (miRNAs) comprise approximately 22 nucleotides and inhibit gene expression mainly by eliminating DNA, cleaving mRNA, and repressing translation [29]. In plants, miRNA172 targets the transcripts of APETALA2 (AP2) [30,31] and a few AP2-like genes [32,33,34]. In wheat, the miRNA172–AP2-like system is crucial for regulating spike morphology [35,36].
The Q gene encodes an AP2 TF that regulates spike morphology along with miRNA172. This gene is located on chromosome 5AL and contains two AP2-binding domains as well as a miRNA172-binding site in the 10th exon [37,38]. Additionally, Q was critical for wheat domestication [37] and de-domestication [39]. A previous study demonstrated that four overexpressed Q alleles (Qc1Qc4) with point mutations in their miRNA172-binding site are associated with increases in spike density, GPC, and wheat bread-making quality [40]. However, the underlying molecular mechanisms remain unclear.
In this study, another wheat mutant with increased spike density and improved bread-making quality was identified. We demonstrated that a missense mutation flanking the miRNA172-binding site of the Q gene (Qc5 allele) is responsible for the mutant phenotype. How Qc5 increases the spike density and enhances the bread-making quality of wheat was also investigated.

2. Results

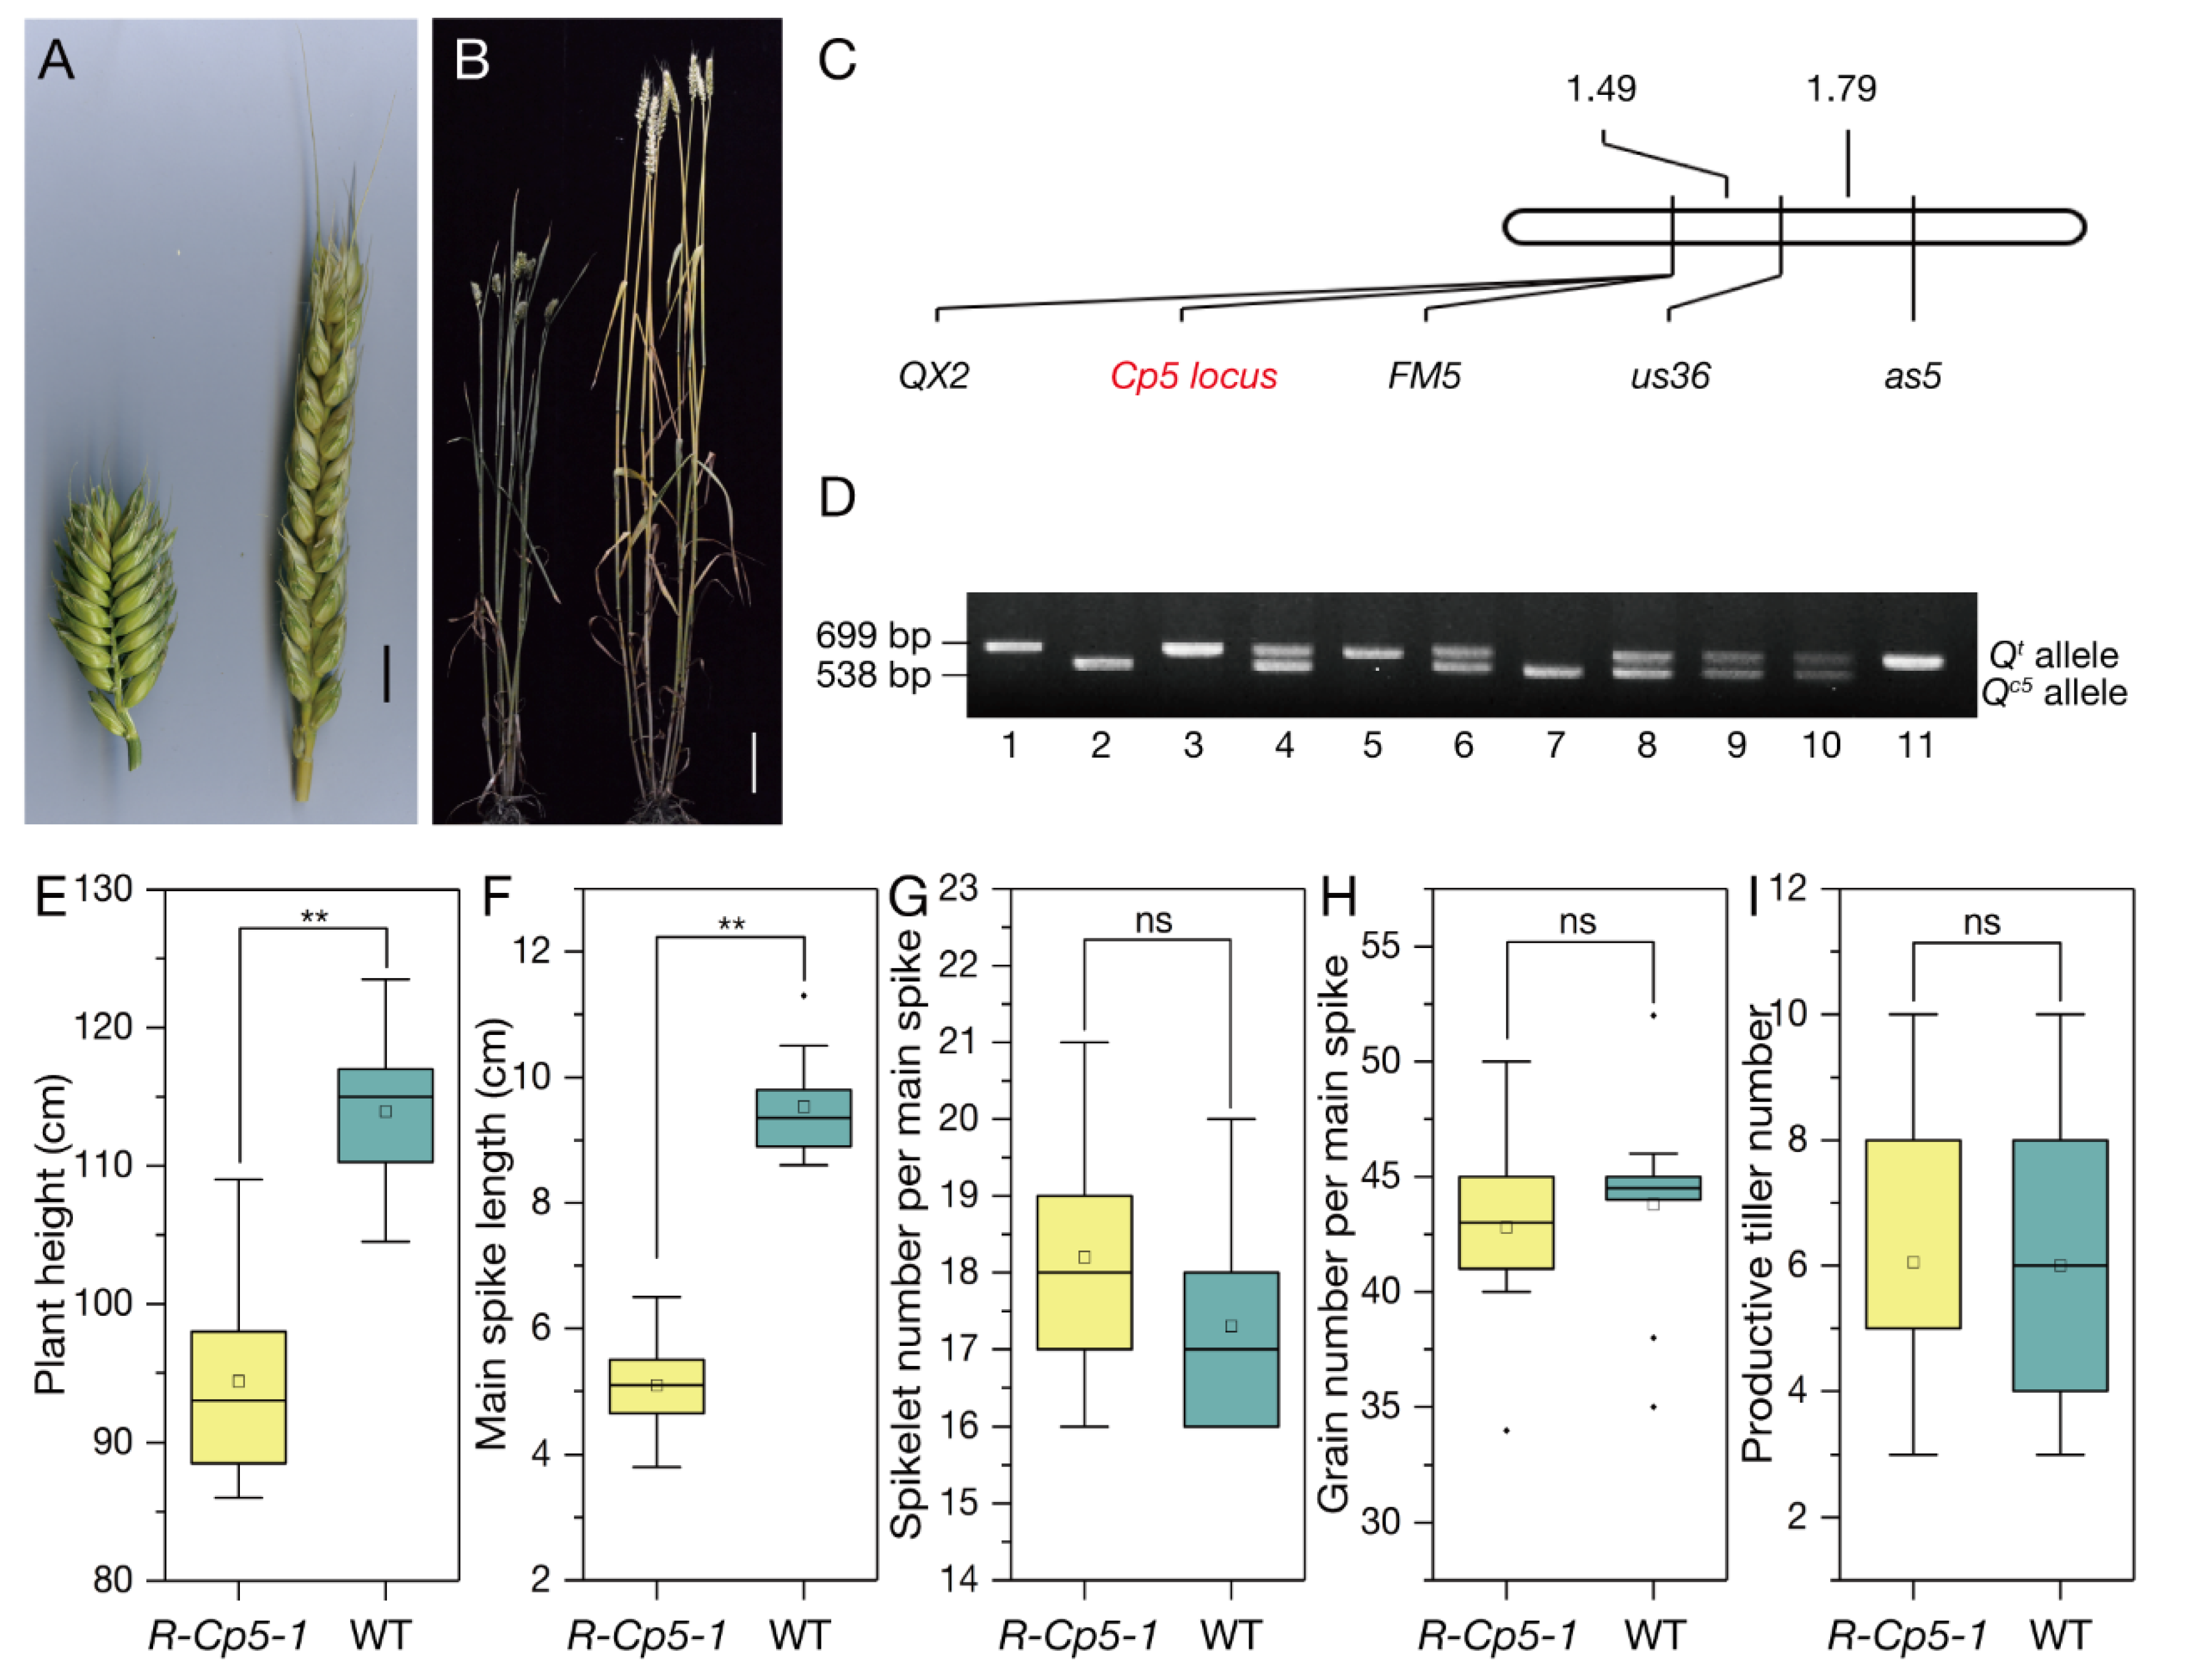
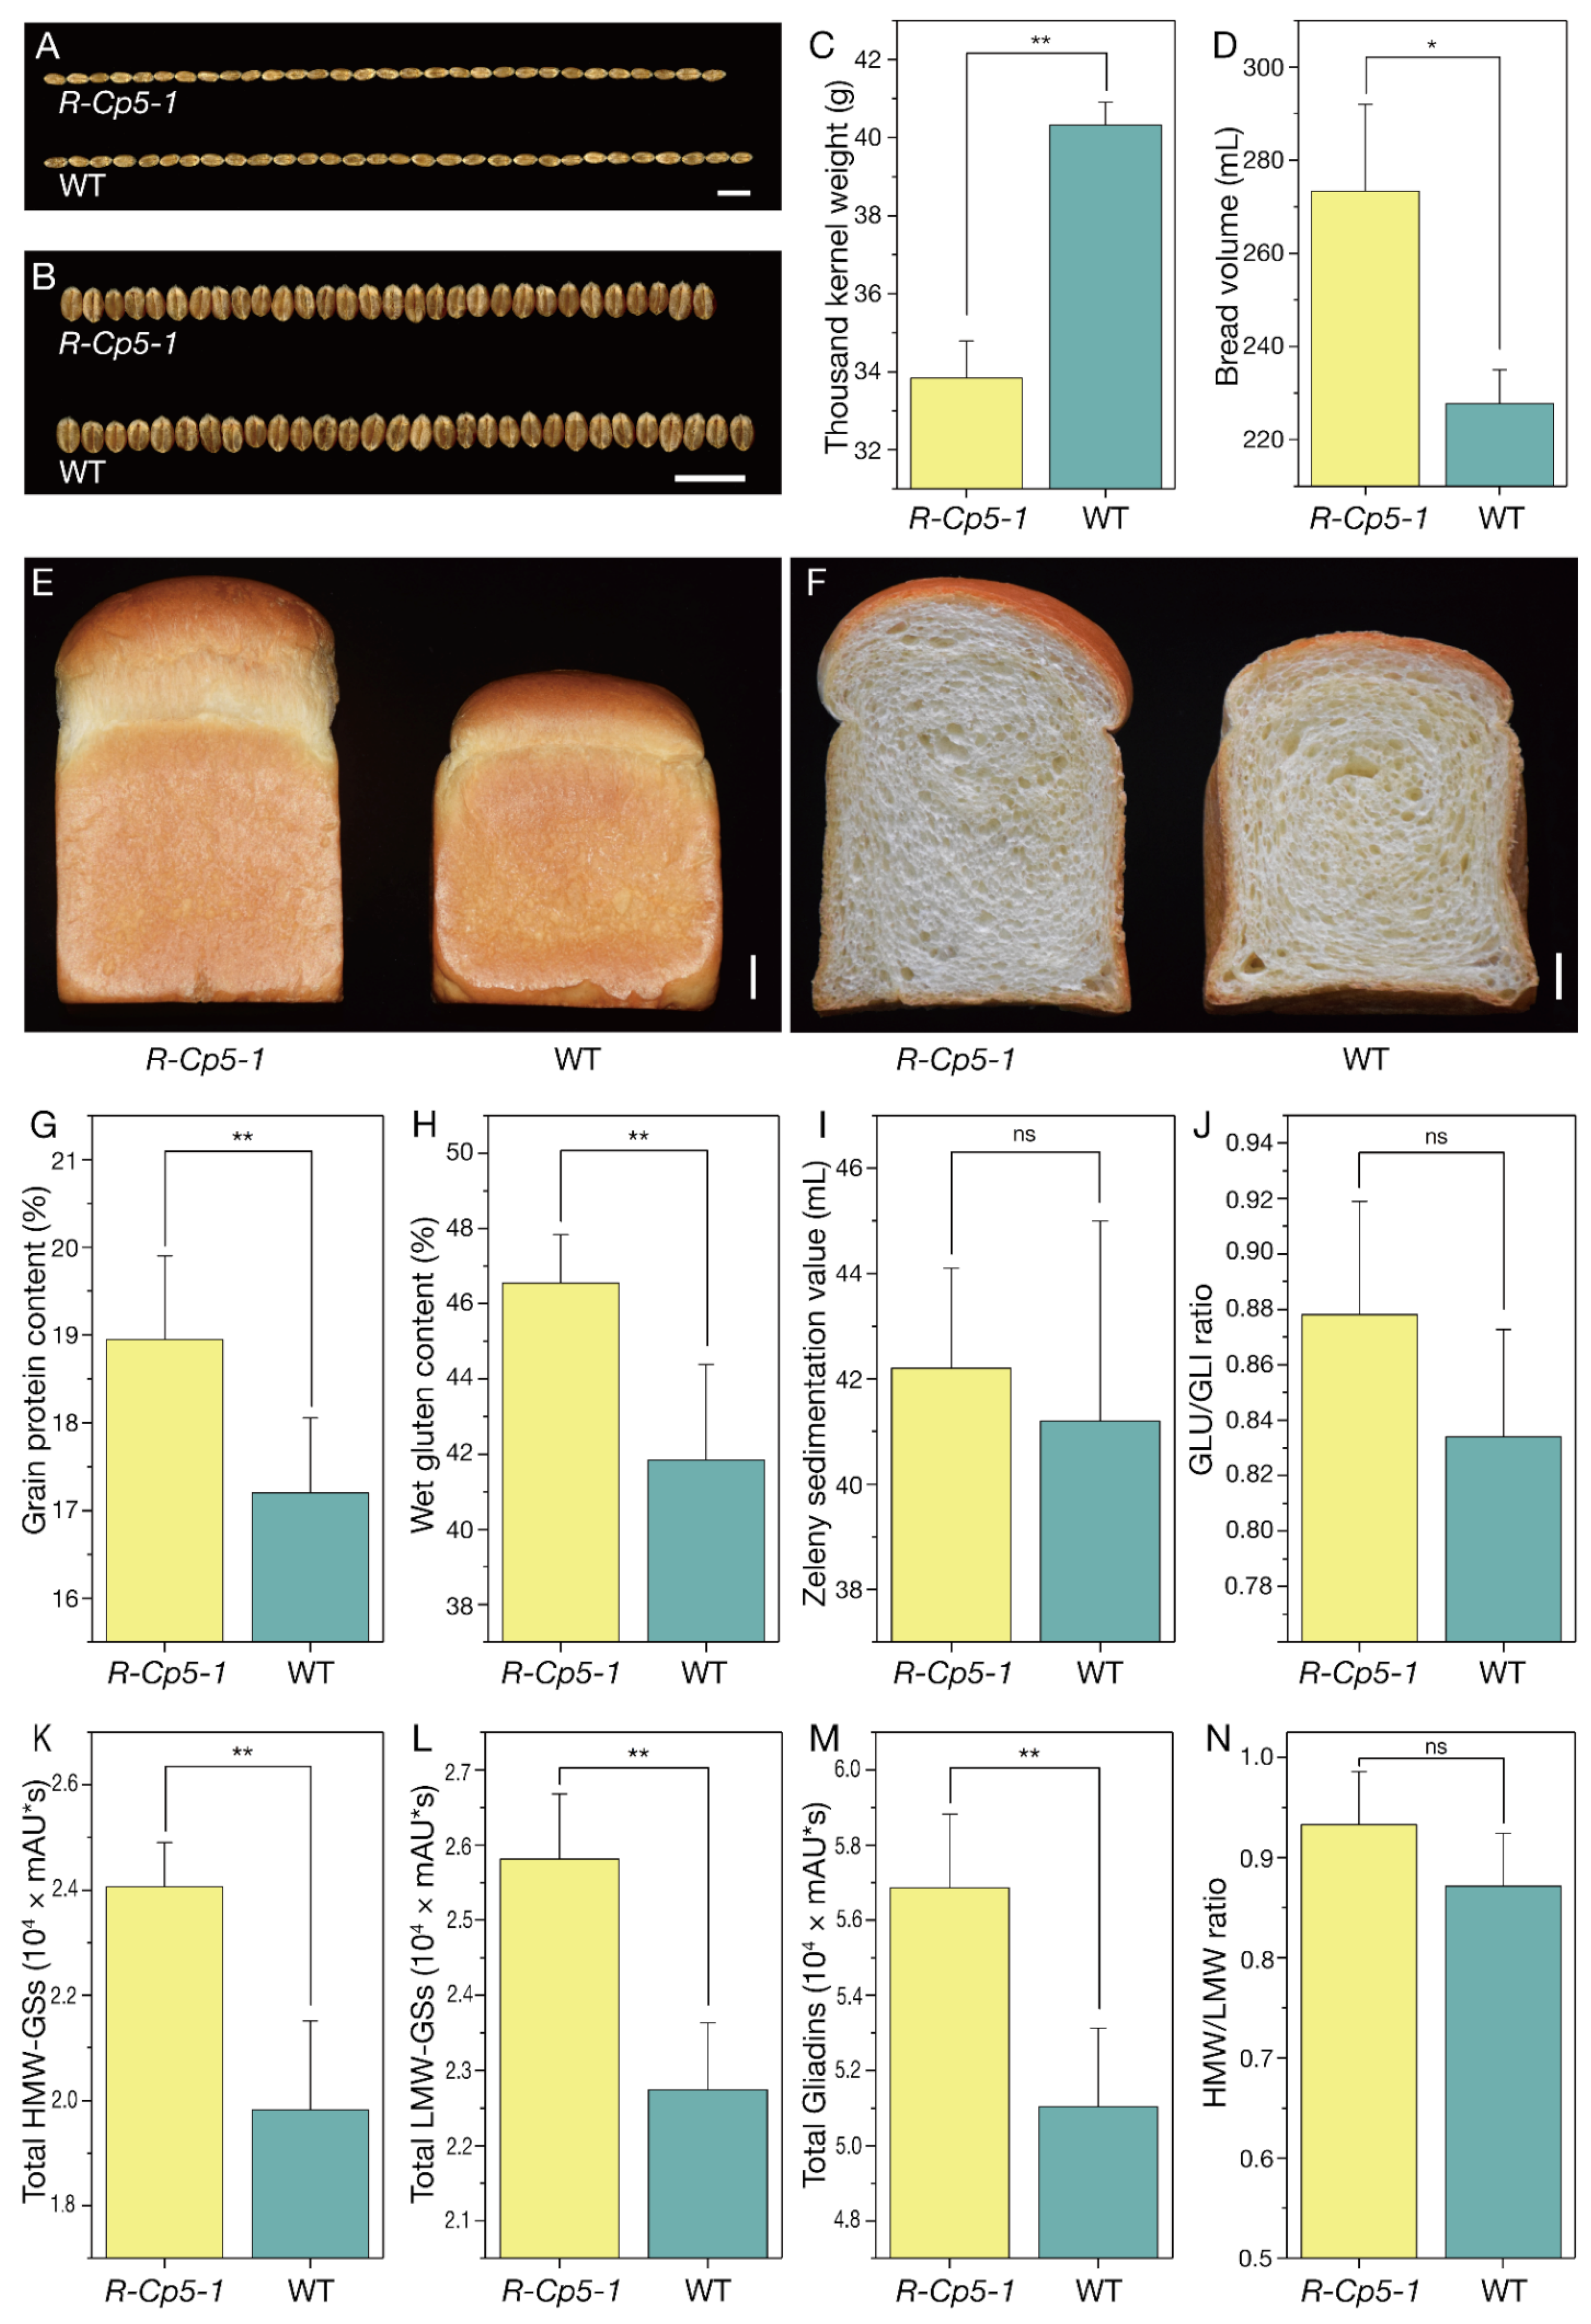
2.1. Phenotype and Segregation Analyses

Compared with wild type (WT) wheat, the common wheat mutant R-Cp5-1, which was identified in a “Roblin” mutant population, was shorter in plant height and had a higher spike density (Figure 1A,B,E,F). There was no significant difference between R-Cp5-1 and WT plants regarding spikelet number per spike, grain number per spike, and tiller number (Figure 1G–I). Using the compact spike as the target trait, the 160 F2 plants were segregated in the expected 3:1 ratio (χ2 = 0.533; p = 0.47), suggesting that the mutant phenotype was controlled by a single dominant locus (Cp5).
The R-Cp5-1 mutant is phenotypically similar to the S-Cp1-1 mutant, which carries the overexpressed Qc1 allele with a point mutation in the miRNA172-binding site [40]. Therefore, we cloned the Q alleles in R-Cp5-1 and “Roblin”. Unexpectedly, there were no variations in the miRNA172-binding region between the R-Cp5-1 and “Roblin” Q sequences (Figure S1). The available molecular markers around Q [39] were used to determine whether the R-Cp5-1 mutant phenotype is associated with Q. According to the linkage map, the markers FM5 and QX2 were closely linked with Cp5 in the F2 population (Figure 1C). Additionally, QX2 co-segregated with Cp5 in the F3 population consisting of 1101 individuals (Figure 1D). Notably, QX2 is an intragenic molecular marker of Q [39]. These results implied that Q is most likely responsible for the phenotype associated with the Cp5 locus.

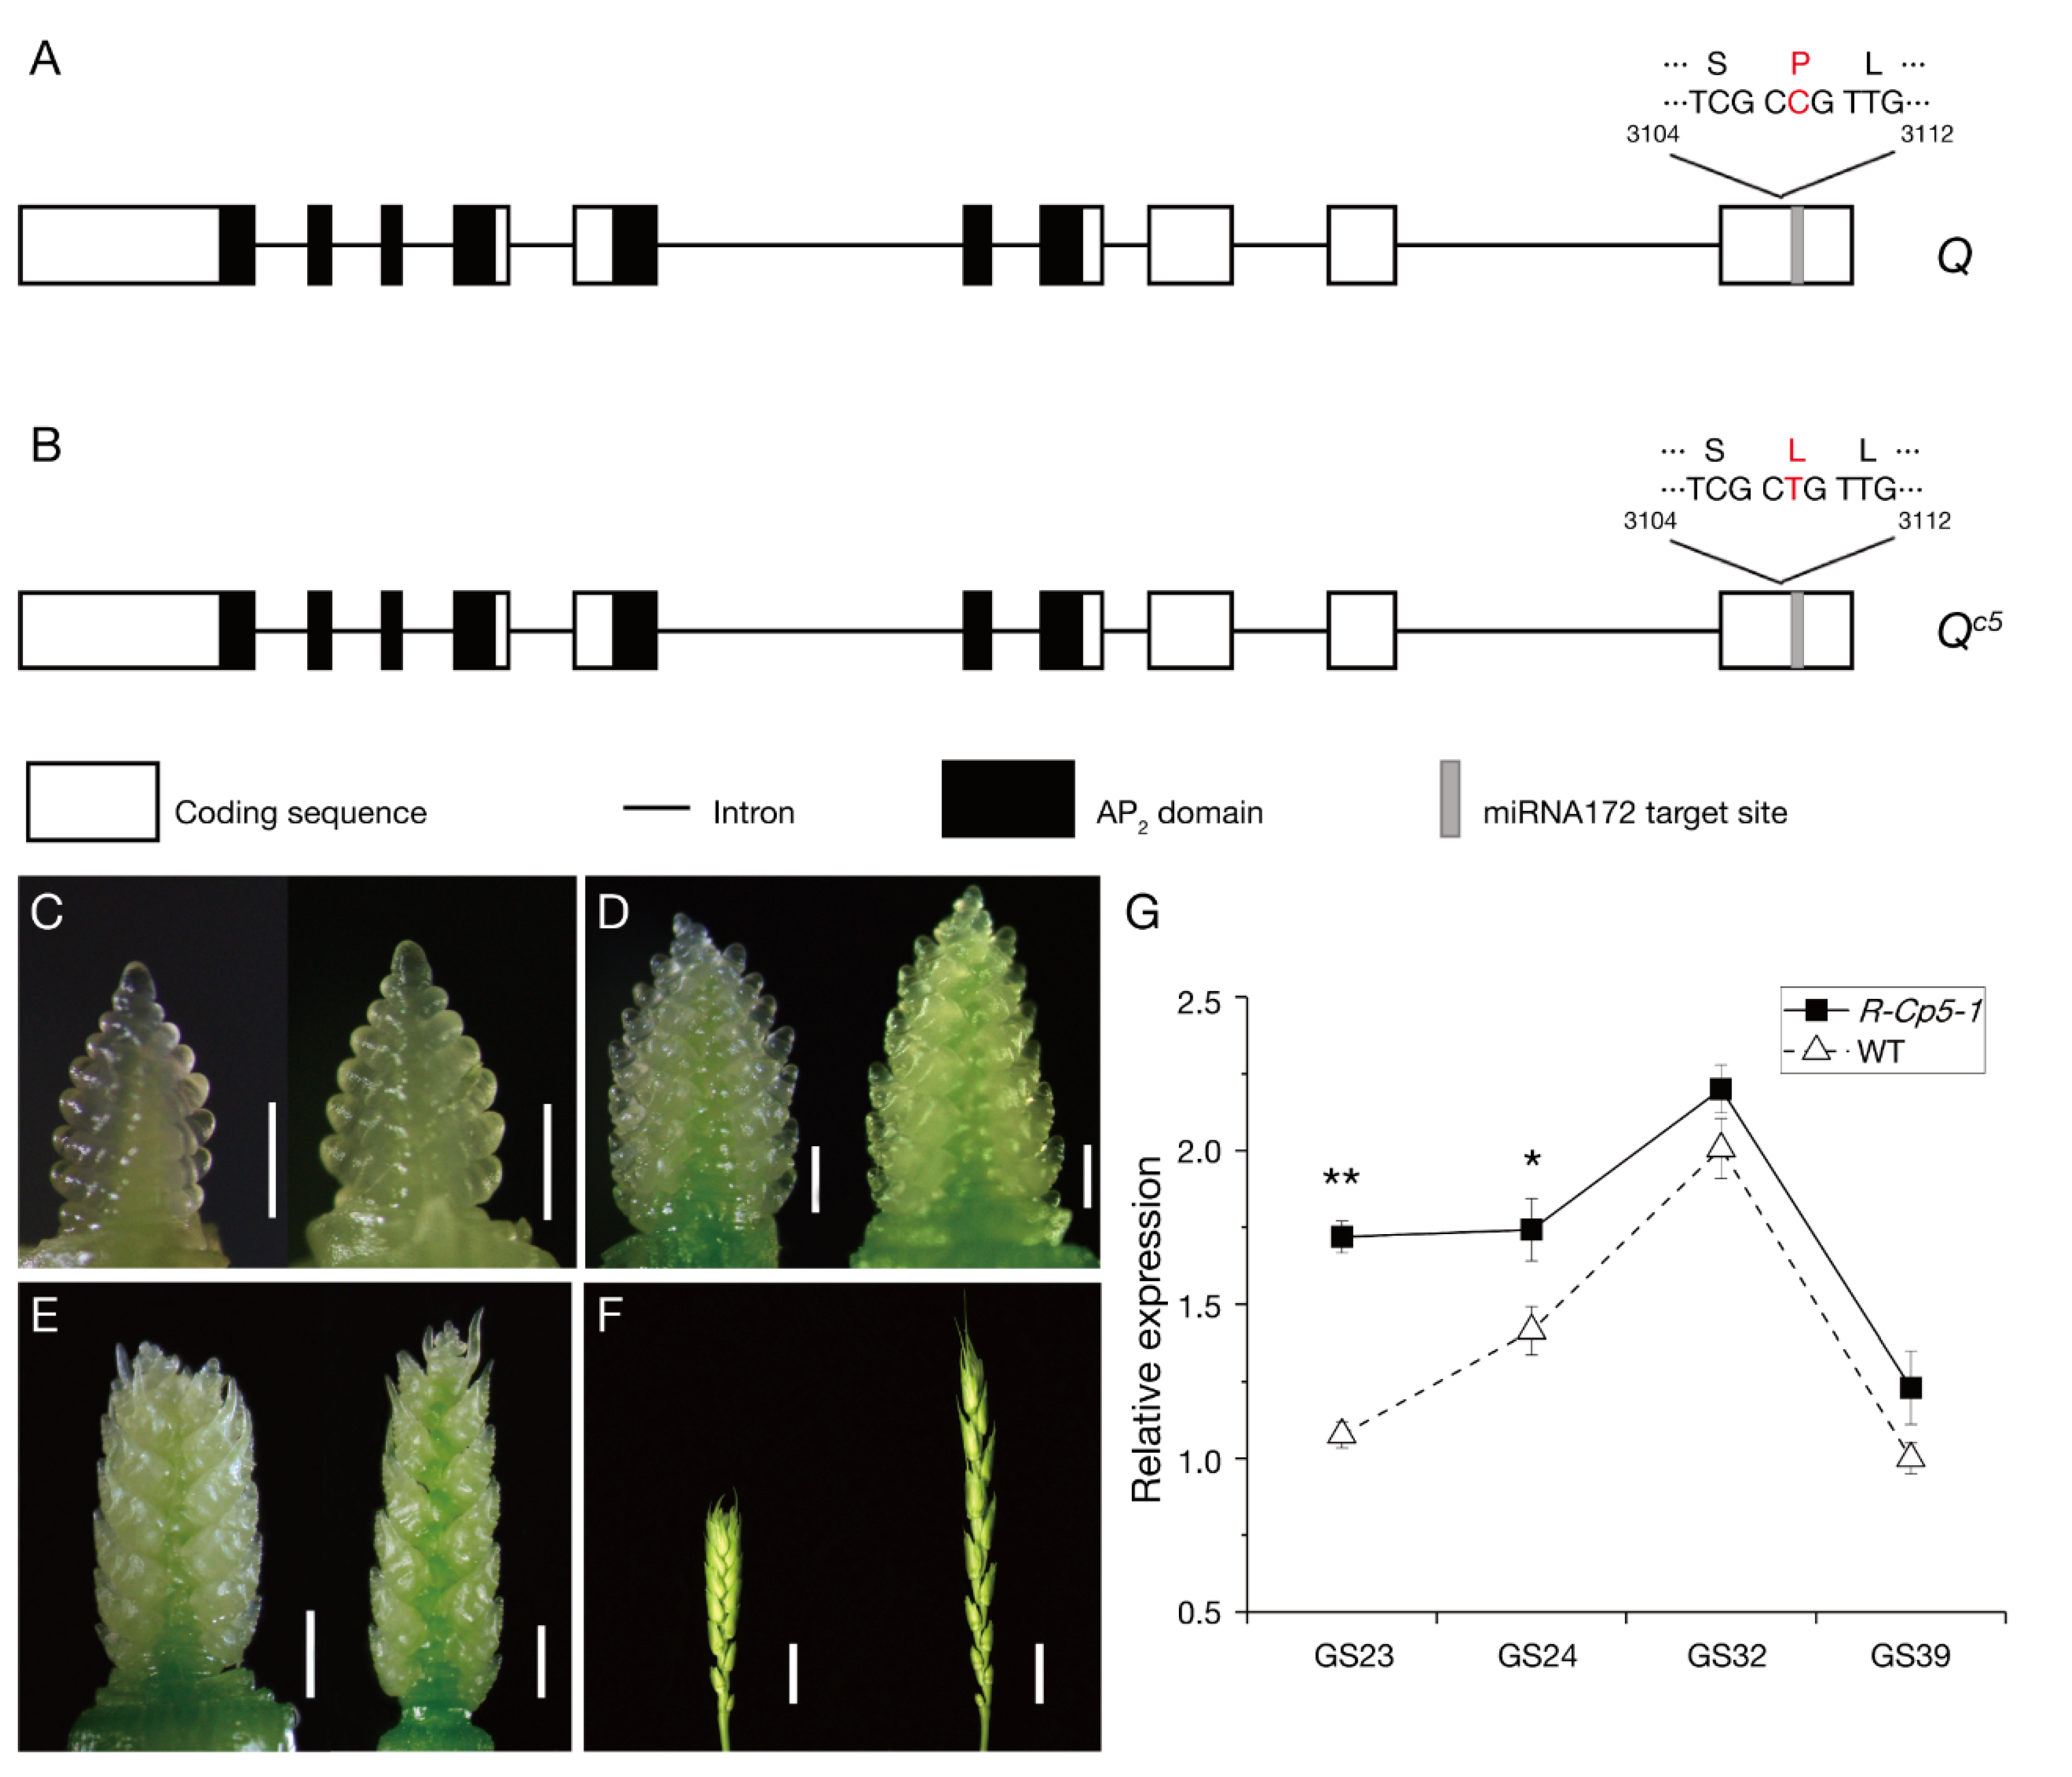
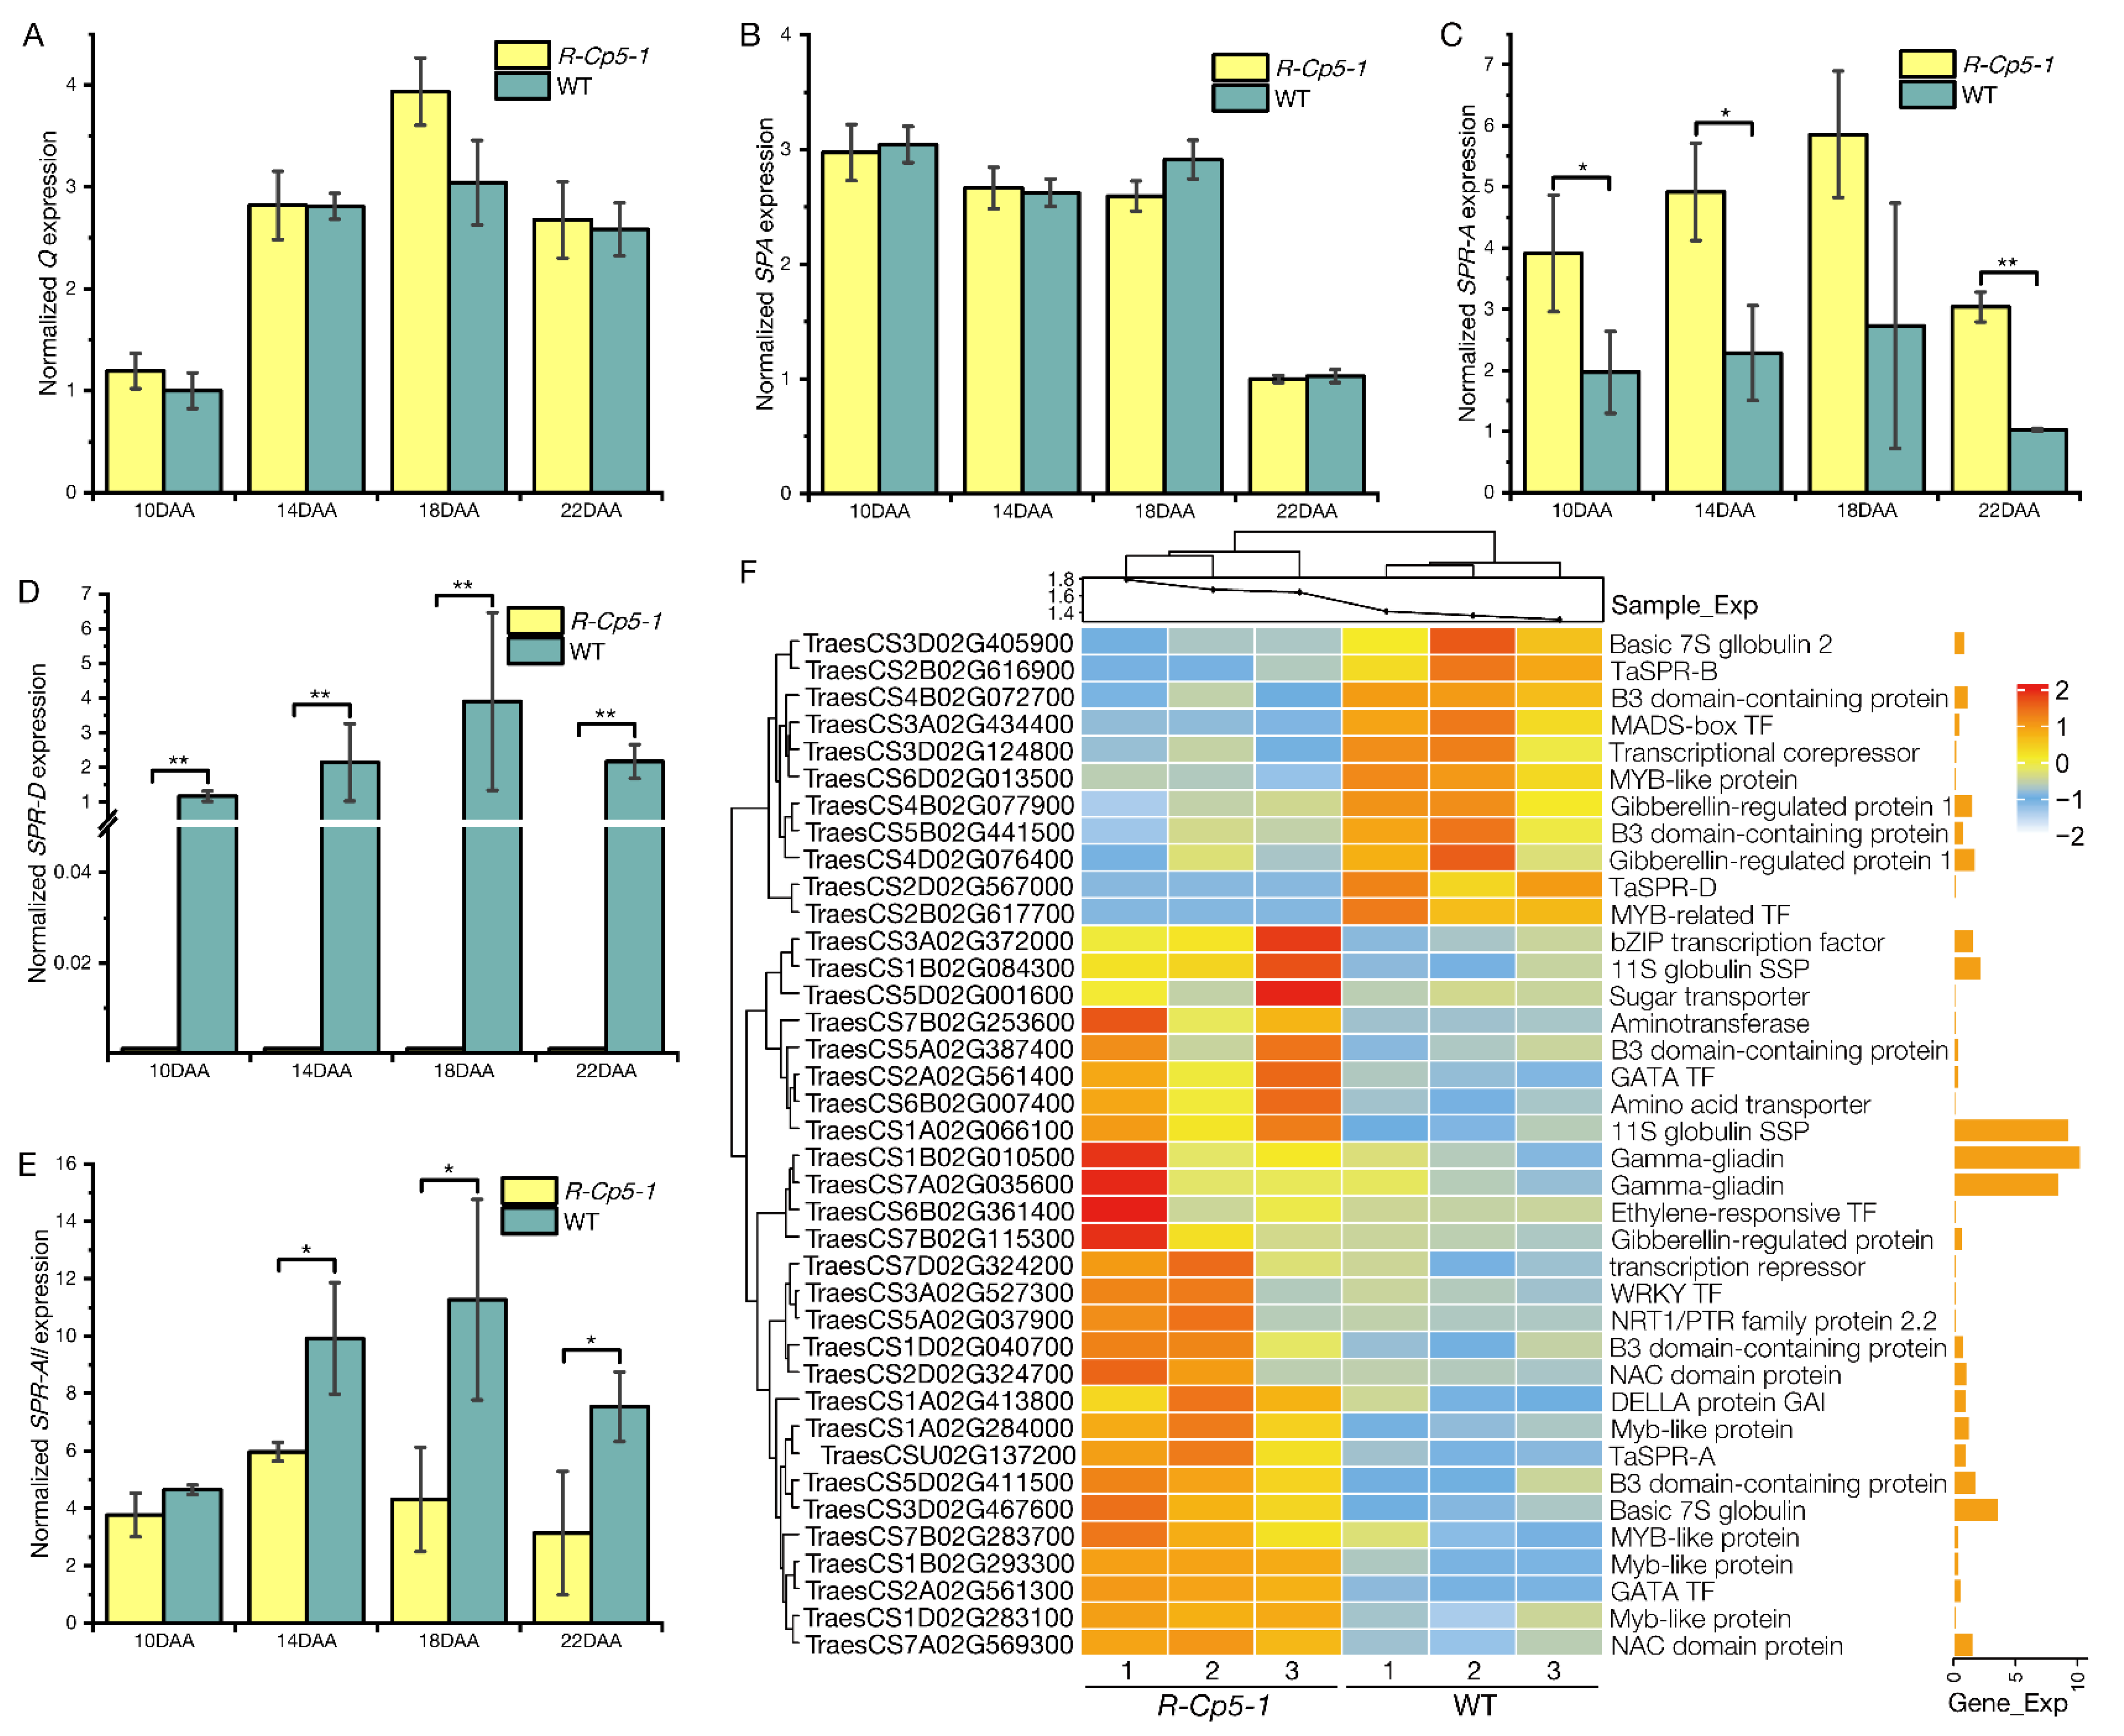
2.2. Gene Cloning and Expression Analysis

The full-length cDNA and genomic DNA sequences of Q in R-Cp5-1 (GenBank No. MW419115) and “Roblin” (KX620763.1) were cloned and sequenced; then, sequence alignment revealed a missense mutation (C–T; Figure 2A,B; Figure S1) flanking the miRNA172-binding region. The new Q allele was named Qc5, which was added to the four reported Qc alleles (Qc1Qc4; Figure S2) [40].
A qRT-PCR analysis was performed to assess whether this missense mutation increases the Q expression level. The Qc5 and Q allele expression patterns in the mutant and the WT control, respectively, were similar, but Qc5 was consistently more highly expressed (significantly higher at Growth Stage 23 (GS23) and GS24 [41]) than the Q allele in spikes at four growth stages (Figure 2C–G).
To clarify how the missense mutation enhances Qc5 expression, the Q and Qc5 mRNA secondary structures were compared. Unlike the corresponding region in Q, the miRNA172-binding region of Qc5 was highly folded (Figure S3), which inhibited the binding of miRNA172.

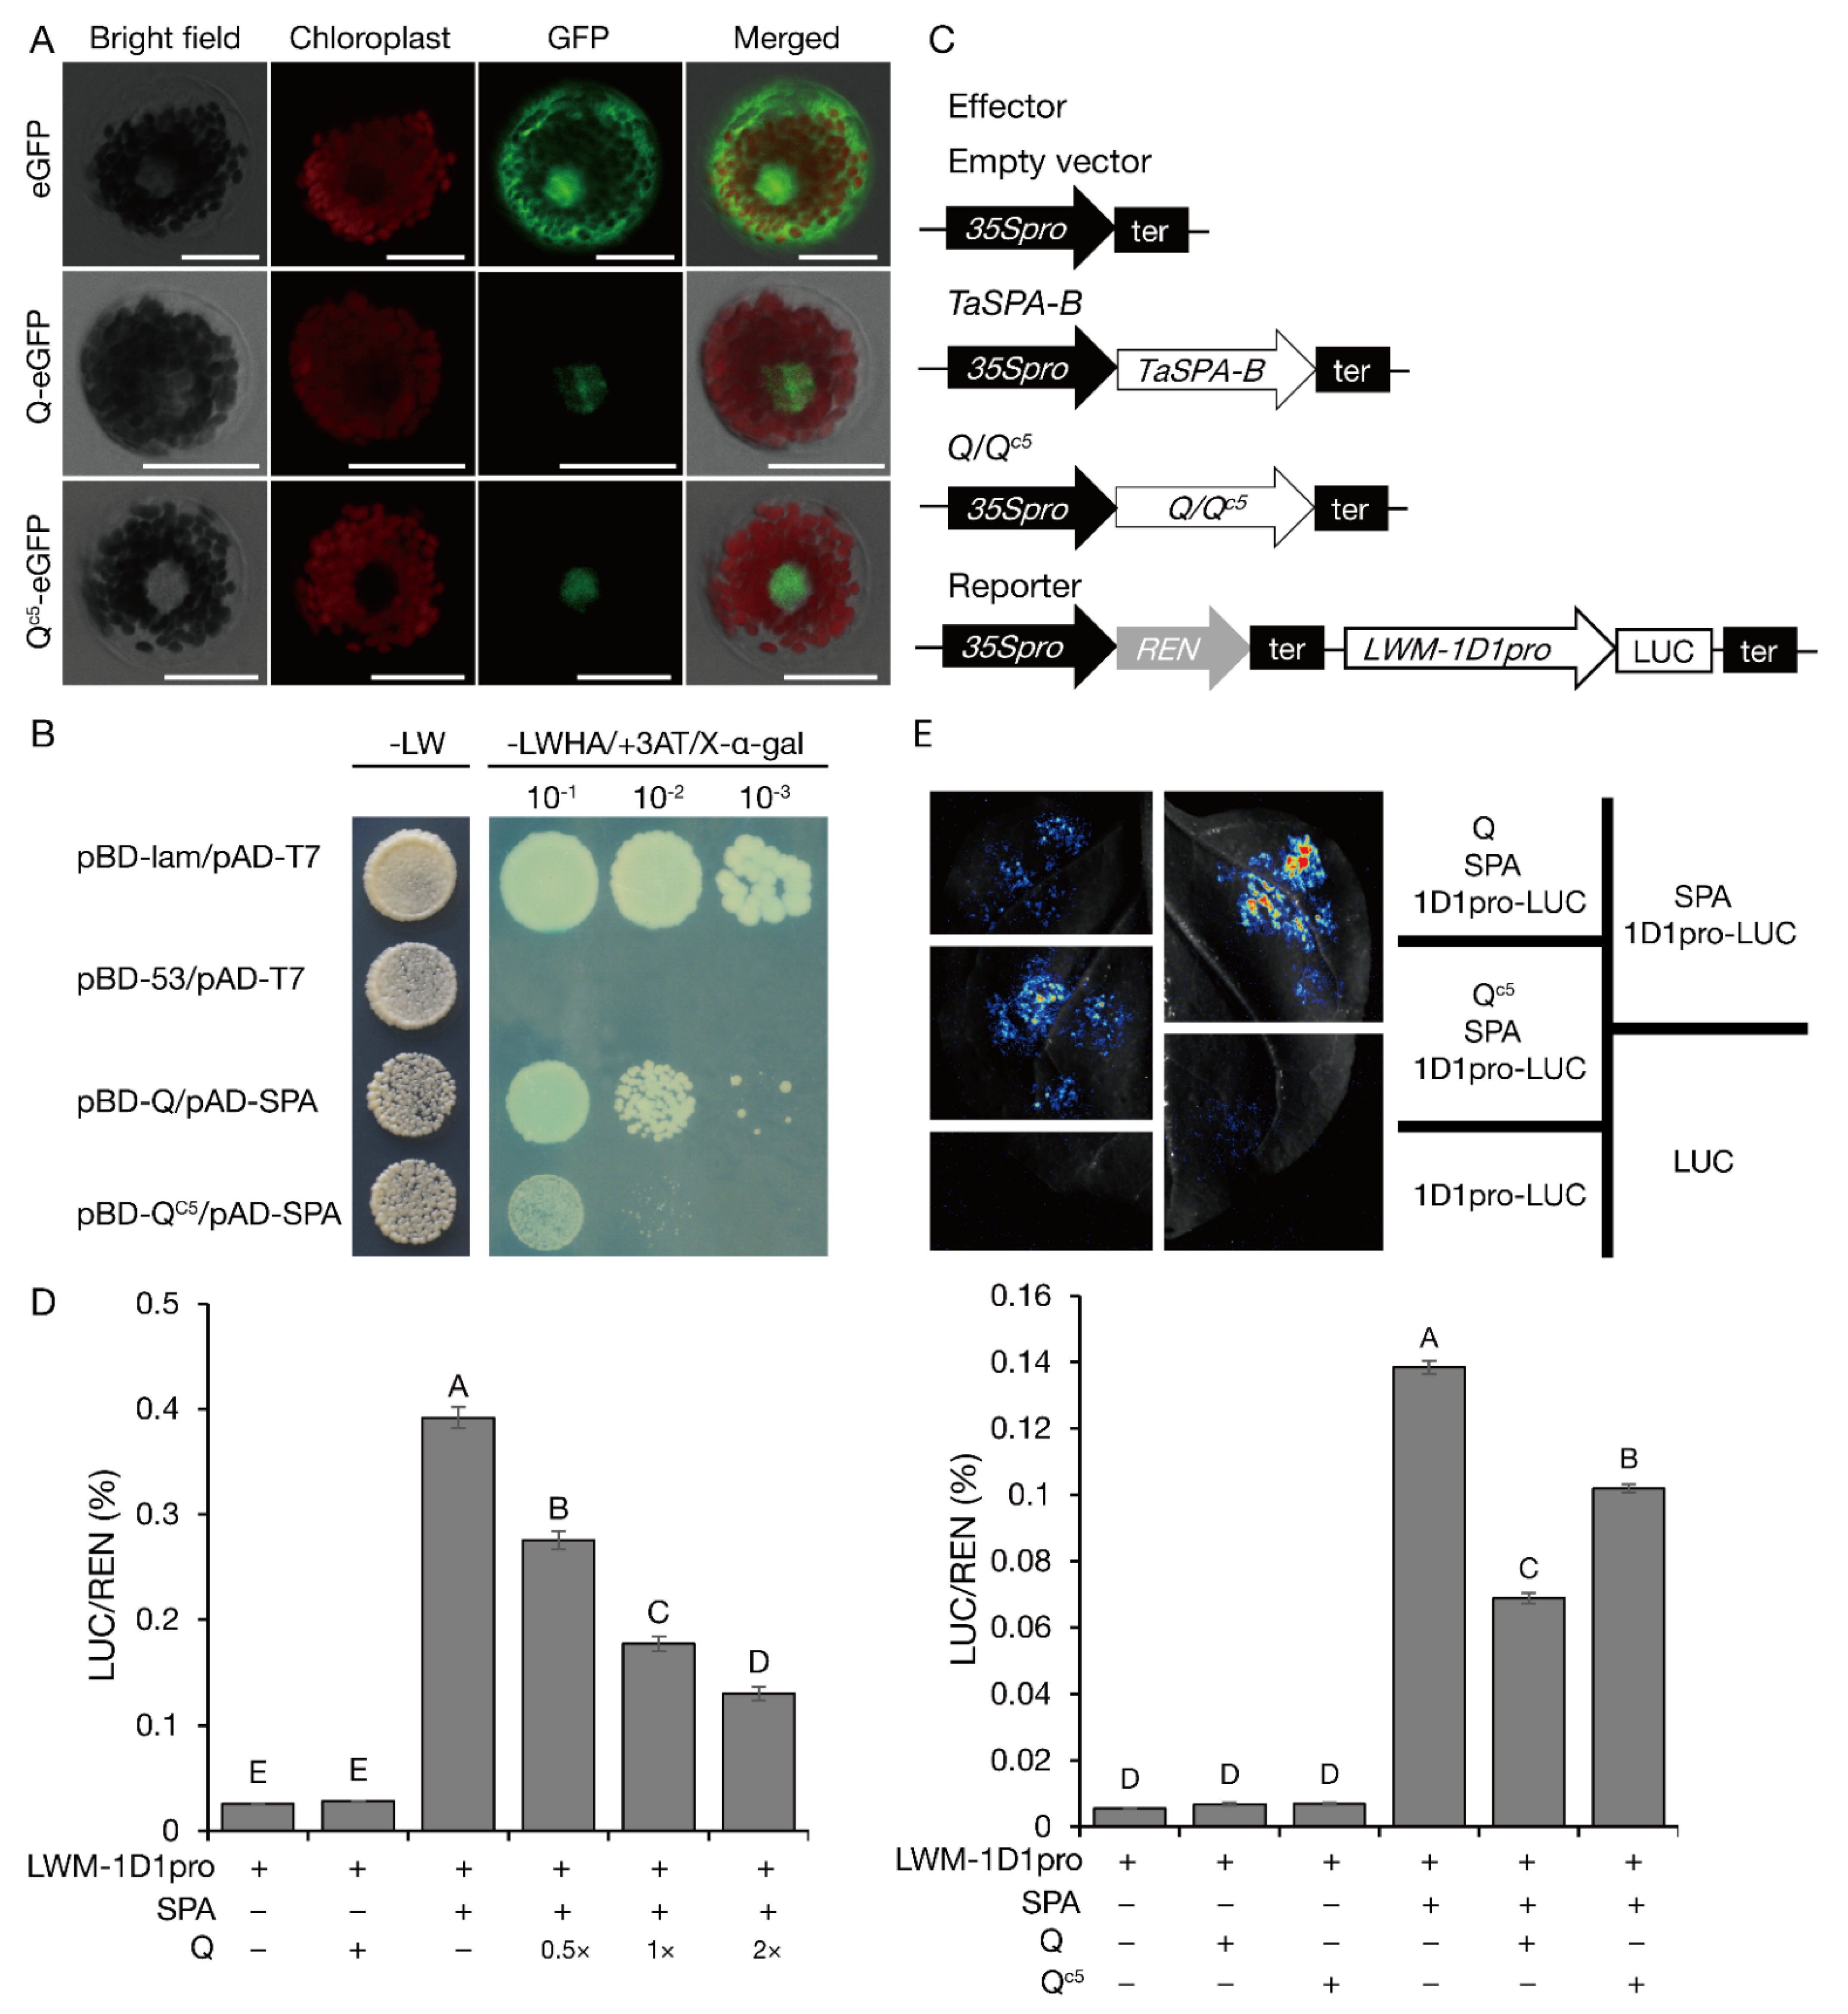
2.3. Protein Structure Analysis

The secondary and tertiary (i.e., 3D) structures of the Q and Qc5 proteins were predicted to assess the biological significance of the amino acid substitution. The predicted structures indicated that compared with Q, Qc5 had more amino acid residues that can form an α-helix in the region around the changed residue (Figure S4).

2.4. Processing Quality Analysis

To determine whether Qc5 affects the wheat processing quality, the quality-related parameters of R-Cp5-1 and WT were compared (Figure 3D–N). The GPC, wet gluten content, and Zeleny sedimentation value were higher for R-Cp5-1 than for WT (Figure 3G–I). Additionally, the average bread volume was 20% greater for R-Cp5-1 than for WT (Figure 3D–F). The glasshouse experiment also showed that GPC was significantly higher for R-Cp5-1 than for WT (Figure S5). The RP-HPLC analysis indicated that the Glu/Gli and HMW/LMW ratios as well as the total HMW-GS, total LMW-GS, and total gliadin contents were greater for R-Cp5-1 than for WT (Figure 3J–N; Figure S6). In contrast to its positive effect on processing quality, Qc5 negatively affected grain size (Figure 3A,B) and thousand kernel weight (TKW) (Figure 3C).

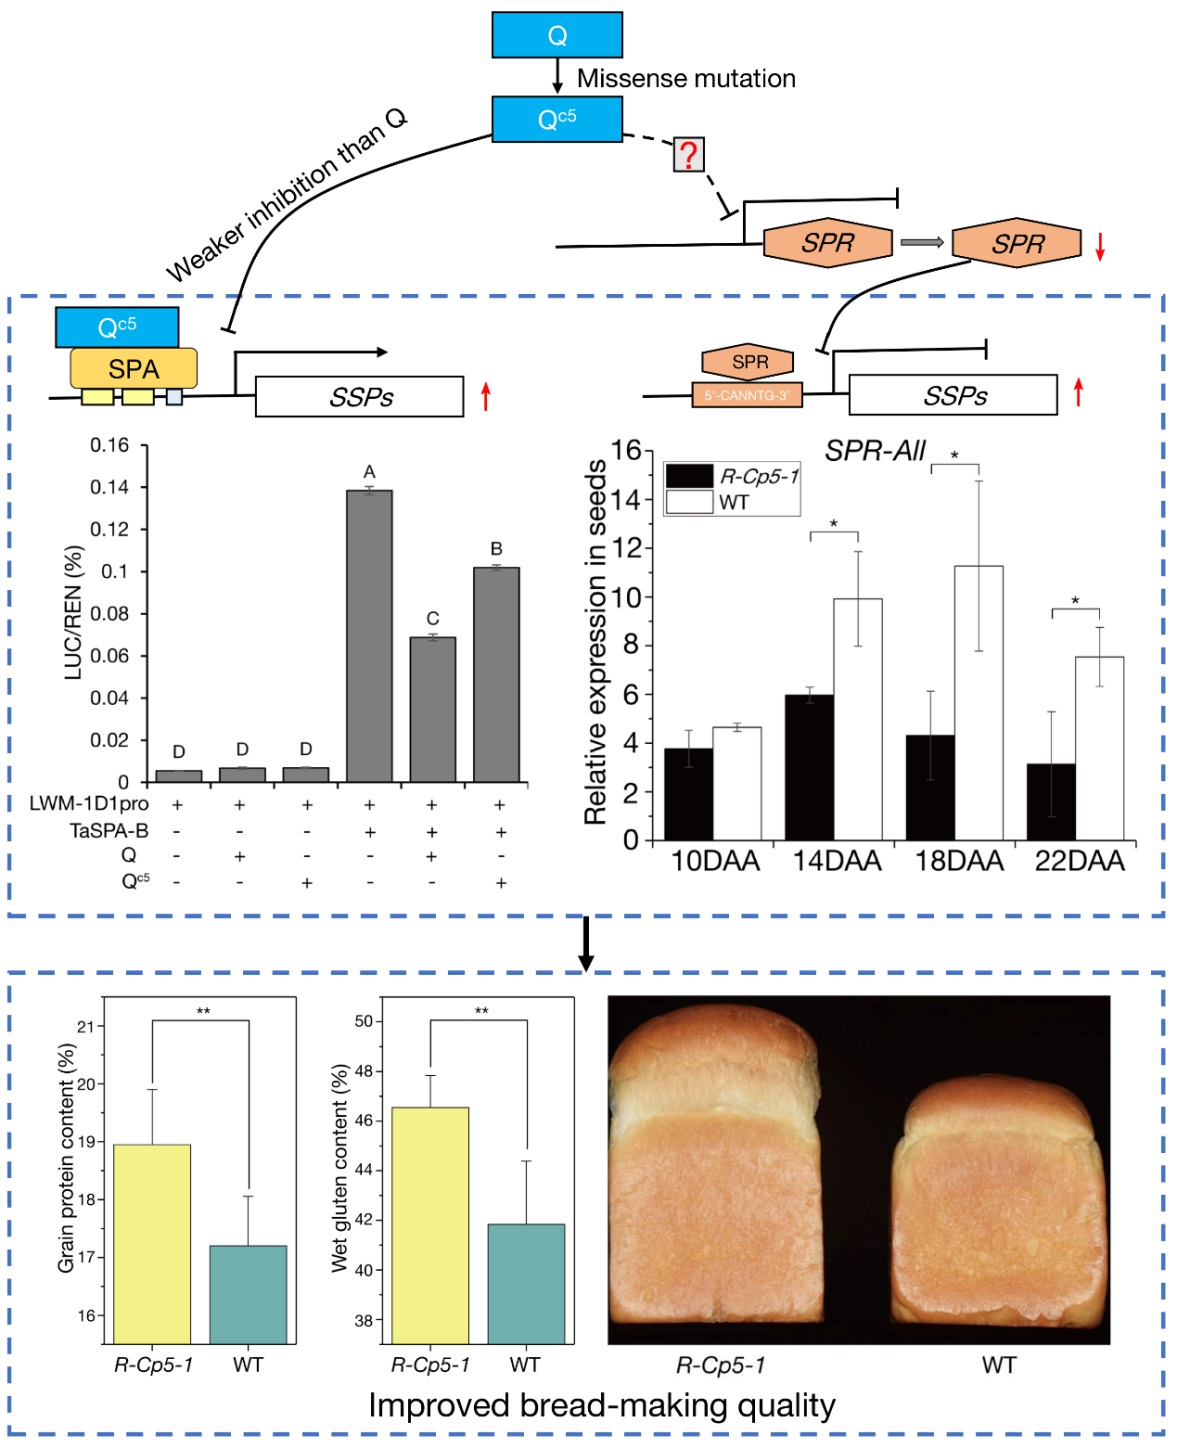
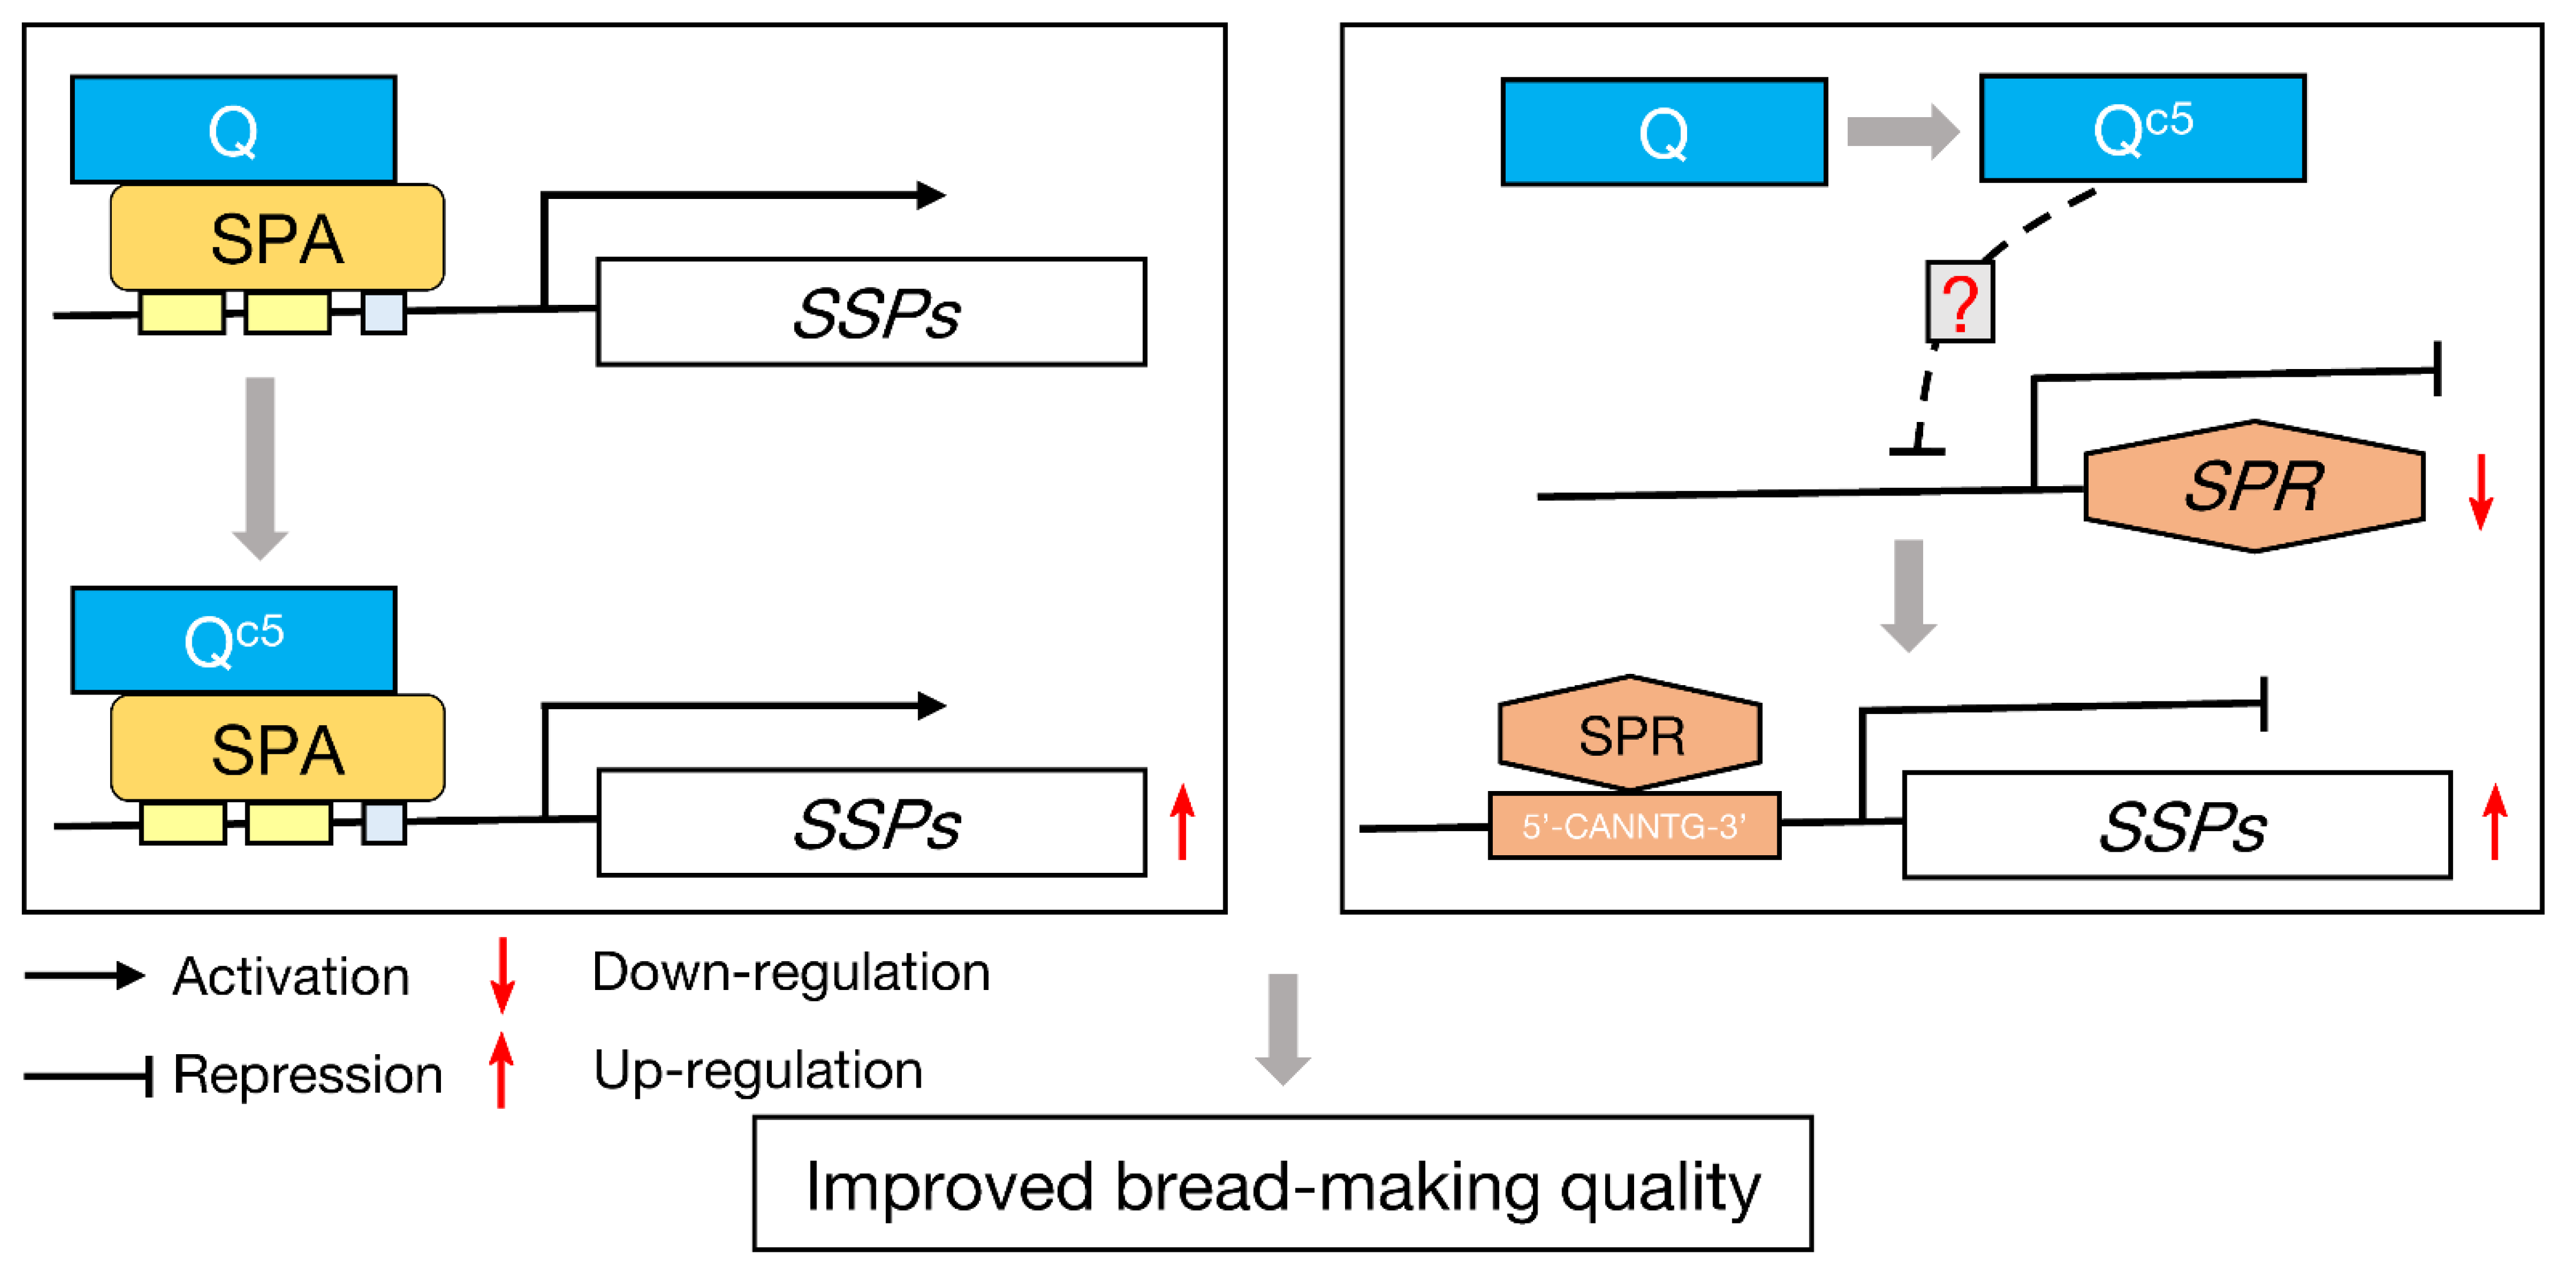
2.5. Mechanisms Underlying the Effect of Qc5 on Processing Quality

The starch granule (SG) and protein body (PB) morphological characteristics in the mature seeds of R-Cp5-1 and WT were examined using a scanning electron microscope. Compared with the WT samples, the PBs and SGs in three representative areas of R-Cp5-1 were more tightly arranged, with fewer and smaller gaps. Furthermore, the SGs in WT were relatively exposed, whereas the SGs in R-Cp5-1 were more tightly packed with PBs (Figure S7).
In the subcellular localization experiment involving wheat mesophyll protoplasts, Qc5 and Q were distributed in the nucleus (Figure 4A). However, Q cannot directly activate the transcription of SSP genes (Figure S8). Therefore, we speculated that Q indirectly regulates the expression of SSP genes by interacting with other TFs. Hence, a yeast two-hybrid assay was performed to identify the TFs encoded in a cDNA library that can interact with Q. Among the six TFs that were obtained (Table S1), SPA encoded by TraesCS1B02G343500 was the most likely interacting partner of Q. Previous research demonstrated that SPA directly regulates the expression of SSP genes [14,25,26]. Accordingly, SPA was selected for further research and was verified to interact with Q. The Qc5 expression level was slightly, but not significantly, higher than the Q expression level in developing seeds, but there was no correlation between the SPA and Q expression patterns (Figure 5A,B), suggesting that Q does not regulate SPA expression. Notably, the interaction between Qc5 and SPA was weaker than that between Q and SPA (Figure 4B).
Because SPA is reportedly an activator of LMW-GS gene expression [14], dual-luciferase reporter assays were performed to determine whether Q and SPA can regulate LMW-1D1 expression (Figure 4C–E). As expected, SPA significantly increased the LUC activity, whereas Q and Qc5 had no effect. However, compared with the effect of SPA alone, the co-infiltration of Q/Qc5 and SPA resulted in decreased LUC activity. The extent of this decrease was positively associated with the abundance of Q (i.e., dosage effect) (Figure 4D). The inhibitory effect of Qc5 was weaker than that of Q (Figure 4E) because of the weaker physical interaction between Qc5 and SPA than between Q and SPA (Figure 4B). Overall, the activation of LMW-GS gene expression by SPA can be inhibited by Q, but a mutation from Q to Qc5 weakens this inhibition.

2.6. Effect of Qc5 on the Seed Transcriptome

To further clarify how Qc5 improves the bread-making quality of wheat, the transcriptomes of immature seeds at 14 days after anthesis (DAA) were compared between R-Cp5-1 and WT (Table S2). A total of 597 DEGs were identified, including 391 up-regulated and 206 down-regulated genes in R-Cp5-1 (Tables S3 and S4; Figure S9). The GO enrichment analysis revealed 31 significantly enriched terms associated with Qc5 (Table S5; Figure S10). A total of 90 KEGG pathways were assigned to 108 up-regulated and 17 down-regulated genes (Table S6; Figure S10).
We searched for TFs that reportedly regulate SSP gene expression. Only SPR expression was significantly altered (Table 1), suggesting that Q regulates the expression of SSP genes by modulating SPR expression. The homologous alleles of SPR in the three sub-genomes were differentially regulated. Specifically, SPR-B (TraesCS2B02G616900) and SPR-D (TraesCS2D02G567000) expression levels were down-regulated in R-Cp5-1, which was in contrast to the up-regulated expression of SPR-A (TraesCSU02G137200) (Table 1; Figure 5C–F). Additionally, SPR-D was unexpressed in R-Cp5-1 and SPR-B was expressed at very low levels in WT and R-Cp5-1 (Table S4). The qRT-PCR analysis of SPR expression indicated that the total expression of all SPR alleles (SPR-All) decreased significantly in R-Cp5-1 developing seeds (Figure 5C–E).

3. Discussion

Wheat domestication was a long process that was closely related to the development of human societies and the establishment of civilizations [42]. Additionally, Q is arguably the most important domestication gene in cultivated wheat. The Q allele was the result of a spontaneous mutation in the miRNA172-binding region of the q allele in wild wheat, which increased the Q expression level [37]. The Q allele confers the free-threshing characteristic of wheat and influences several domestication-related traits, including rachis fragility, glume toughness, spike architecture, flowering time, and plant height [37,38,43,44,45,46,47]. The Qc1 allele originated from a point mutation within the miRNA172-binding region of the Q allele, which decreases the miRNA172-directed cleavage of Qc1 transcripts, thereby leading to increased expression levels and enhanced wheat bread-making quality [40]. Therefore, point mutations in the miRNA172-binding site can increase the Q transcription level and influence multiple traits, including processing quality.
Processing quality is a major trait of interest among wheat breeders, but relatively few genetic loci with significant effects on processing quality and useful for wheat breeding have been reported. Joppa [48] detected a QTL explaining 66% of the variation in GPC. The identified gene in this QTL encodes a NAC TF that is associated with GPC increases of approximately 14 g kg−1, but it also accelerates senescence [49]. Gao [23] identified an elite TaNAC019 allele related to bread-making quality. Compared with the effects of the Q allele common among modern wheat cultivars, we demonstrated that Qc1 is correlated with a GPC increase of about 60 g kg−1 and a loaf volume increase of 37%. In this study, we analyzed the Qc5 allele to confirm Q affects GPC (Figure 3G; Figure S5) and loaf volume (Figure 3D–F). Unfortunately, Qc1 is inappropriate for breeding because it leads to decreased grain yields, extreme dwarfism, and the production of compact spikes [40]. A previous study identified Qc1-N8 as a new allele derived from Qc1, with a missense mutation in the sequence encoding the second AP2 domain [50]. This new allele reverses the unfavorable agronomic characteristics resulting from Qc1 while also positively affecting GPC and grain yields [50]. Wheat is an important protein source for humans [3]. Therefore, the influence of Q on GPC suggests that Q should be targeted by wheat breeding programs.
The Qc5 allele improves the bread-making quality of wheat by enhancing the accumulation of SSPs and by increasing the Glu/Gli ratio (Figure 3J). The unique properties of wheat depend on its SSPs [4]. An increase in the SSP contents in mutant grains inevitably leads to the production of more PBs, which combine to form a matrix protein that binds to SGs during the seed dehydration stage (Figure S7).
The value of Q is associated with the number of point mutations in its miRNA172-binding site. The transition from q to Q (one point mutation in the miRNA172-binding site) during wheat domestication had a profound effect on the grain yield and shape [51]. The stepwise mutation from the Q allele to the Qc1-N8 allele (another point mutation in the miRNA172-binding site) further increased the grain yield by increasing TKW and the grain number per spike [50]. In plants, a high sequence complementarity between a specific miRNA and its target mRNA is required for the miRNA–target interaction [52,53]. The cleavage efficiency of miRNAs can be modified by changes in their binding regions within target genes [52,54]. Several studies have focused on the interactions between miRNA172 and AP2-like genes in grass species [55,56,57,58]. In addition to sequence complementarity, another factor influencing miRNA regulatory effects is the mRNA secondary structure [59]. In this study, Qc5, which has a point mutation outside of the miRNA172-binding site, was more highly expressed than Q because the miRNA172-binding region is more highly folded in Qc5 than in Q (Figure S3). This finding may form the basis of a new method for further increasing the Q expression level.
The C-terminal region of Q protein is related to grain size. Both Qc5 and Qc1 are transcribed at a higher level than the Q allele (Figure 2G) [40]. However, increased grain size is associated with Qc1 (Figure S11), but not Qc5 (Figure 3A,B). The missense mutation that changes a proline in Q to a leucine in Qc5 is outside the AASSGF box. Moreover, the amino acid change alters the protein structure, resulting in decreased protein activity. Proline is detrimental to the formation of α-helices [60,61], whereas leucine tends to be included in helical structures. Therefore, replacing the proline (amino acid 408) at the end of the α-helix in Q with leucine extends the α-helix in Qc5 by two residues. Specifically, the α-helix ends at amino acid residues 409 and 411 in Q and Qc5, respectively (Figure S4B–E). The missense mutations in the first four Qc alleles affect the conserved AASSGF box of Q (Figure S12), resulting in minor changes to the secondary structure of the AASSGF domain in the four Qc proteins (Figures S13 and S14). Moreover, there were no differences in the 3D structures of Q and Qc. Therefore, the opposite effects of Qc5 and Qc1 on grain size may be due to the diversity in their protein structures.
The results of this study have clarified the mechanism underlying the effect of Qc5 on wheat processing quality (Figure 6). Specifically, Qc5 enhances SSP gene expression in two ways. First, SPA can activate the transcription of glutenin genes [14], but Q has an inhibitory effect on SPA (Figure 4E). The missense mutation in Qc5 weakens the physical interaction between the encoded protein and SPA, leading to a weaker inhibitory effect on SPA and then increased LMW-GS gene expression (Figure 4D–E). Second, the missense mutation in Qc5 is related to the down-regulated expression of SPR. However, our ChIP-seq analysis did not detect the enrichment of Q in the SPR region (unpublished data). Accordingly, how Q regulates SPR expression remains to be elucidated.

4. Materials and Methods

4.1. Plant Materials and Growth Conditions

Common wheat cultivar “Roblin” was treated with 0.6% ethyl methanesulfonate (Sigma-Aldrich, St Louis, MO, USA). A mutant (R-Cp5-1) with increased spike density and its corresponding wild-type (WT) control were isolated from a single M7 heterozygous plant. A total of 160 F2 individuals derived from the R-Cp5-1 × QZ96 hybridization were used for the chi square (χ2) test and segregation analysis. An F3 population comprising 1101 individuals was generated from heterozygous F2 plants (R-Cp5-1 × QZ96) and then used for the segregation analysis. Hexaploid wheat line QZ96 has speltoid-like spikes and contains the Qt allele (i.e., Q allele with a transposon insertion [39]). Plants were grown in a plot with a row spacing of 20 cm × 10 cm at the experimental farm of Sichuan Agricultural University, Chengdu, China. A nitrogen: phosphorous: potassium (15:15:15) compound fertilizer was applied (750 kg per hectare) before sowing.
A field experiment was conducted according to a randomized block design with five replicates during the 2017–2018 wheat growing seasons to compare the agronomic traits and processing parameters of R-Cp5-1 and WT. Each replicate was planted in a 2 m × 4 m plot with a row spacing of 20 cm × 5 cm. At GS80 [41], 20 plants per line were randomly selected for an analysis of agronomic traits, including plant height (cm), main spike length (cm), spikelet number per main spike, grain number per main spike, and productive tiller number. The wheat materials were grown as described above.
One glasshouse (16 h day (23 °C)/8 h night (18 °C) cycle) experiment was conducted in 2019 to analyze gene expression in grains. Plants were grown in 2 L pots (four R-Cp5-1 plants and four WT plants per pot) filled with a loam-based substrate (Pindstrup, Ryomgaard, Denmark). The pots were arranged according to a randomized complete block design with three replicates. Plants were watered as needed and fertilized before planting with a nitrogen: phosphorous: potassium (15:15:15) compound fertilizer.
Nicotiana benthamiana plants were grown in a glasshouse at 22 °C with a 16 h day/8 h night cycle. When plants had six leaves, the youngest leaves longer than 1 cm were infiltrated with Agrobacterium tumefaciens and maintained in the glasshouse for the duration of the dual-luciferase reporter assay.

4.2. DNA Extraction and Segregation Analysis

Genomic DNA was extracted from the young leaves of 160 F2 individuals and 1101 F3 individuals derived from the R-Cp5-1 × QZ96 hybridization using cetyltrimethylammonium bromide [62]. The subsequent PCR amplifications were performed using the following program: 94 °C for 4 min; 35 cycles of 94 °C for 30 s, 55 °C for 30 s, and 72 °C for 30 s; 72 °C for 10 min. The PCR products were separated on 8% polyacrylamide gels or 1% agarose gels. Compact/normal spike was selected as the target trait for the segregation analysis. The spike morphology of all individuals was investigated at GS80.
Four molecular markers [39] that were polymorphic between the parents (R-Cp5-1 and QZ96) were used for the segregation analysis; then, a linkage map was constructed using the MAP function of IciMapping 4.1 (Institute of Crop Science and CIMMYT China, CAAS, Beijing, China).

4.3. RNA Extraction and Gene Expression Analysis

Developing spikes were collected from the R-Cp5-1 and WT plants grown for the field experiment at GS23, GS24, GS32, and GS39. Three biological replicates were collected, with at least 10 spikes per replicate. Developing grains were collected from the R-Cp5-1 and WT plants grown for the glasshouse experiment at 10, 14, 18, and 22 DAA. Three biological replicates were collected per time-point. The collected samples were immediately frozen in liquid nitrogen and then stored at −80 °C. The plant samples were ground to a fine powder in liquid nitrogen. Total RNA was extracted from the ground material using the Plant RNA Extraction kit (Biofit, Chengdu, China) and then was quantized using the NanoDrop 8000 spectrophotometer (Thermo Scientific, Waltham, MA, USA). First-strand cDNA was synthesized from 1 μg total RNA using the PrimeScript™ II 1st Strand cDNA Synthesis Kit (Takara, Dalian, China).
All RNA samples extracted from spikes and seeds were used for qRT-PCR analysis by using the ChamQ™ Universal SYBR® qPCR Master Mix (Vazyme, Nanjing, China). All experiments were performed according to the manufacturer’s instructions. Housekeeping genes, namely the genes encoding the scaffold-associated region DNA-binding protein (NCBI UniGene: Ta.14126) and methionine aminopeptidase 1 (Ta.7894) [63], were used for normalizing gene expression data. The qRT-PCR primers are listed in Table S7.
The RNA extracted from seeds at 14 DAA was used for a transcriptome analysis. Specifically, the RNA was sequenced using the Illumina NovaSeq platform at Tcuni Biotech (Chengdu, China). The RNA quantity and integrity were determined using the NanoDrop 8000 spectrophotometer (Thermo Scientific, Waltham, MA, USA) and the Agilent 4200 TapeStation (Agilent Technologies, Santa Clara, CA, USA). The RNA-seq libraries were constructed using the VAHTS® Stranded mRNA-seq Library Prep Kit for Illumina. The libraries were amplified by PCR and quantified by qRT-PCR. The default parameters of Kallisto (v0.42.4) [64] were used for quantifying transcript abundances. The edgeR (v3.12.1) program was used to detect differentially expressed genes (DEGs) between R-Cp5-1 and “Roblin” according to the following criteria: adjusted p < 0.05 and an absolute fold-change > 2.0 [65]. The GOseq (v1.22.0) program was used for a Gene Ontology (GO) enrichment analysis of the DEGs [66] on the basis of the Wallenius non-central hyper-geometric distribution, which can adjust for the gene length bias among DEGs. A Kyoto Encyclopedia of Genes and Genomes (KEGG) pathway enrichment analysis of the DEGs was completed using KOBAS (v2.0) [67]. The transcripts per kilobase of exon model per million mapped reads (TPM) value was used for calculating gene expression levels.

4.4. Gene Cloning

The cDNA and genomic DNA sequences of candidate genes in R-Cp5-1 and “Roblin” were amplified by PCR. The HMW-Bx7, HMW-Dx5, HMW-Dy10, and LMW-1D1 promoters in “Roblin” were also amplified. Phanta Max Super-Fidelity DNA Polymerase (Vazyme) was used for the PCR amplifications, which were conducted in a 50 μL mixture comprising genomic DNA or cDNA, 100 μΜ each dNTP, 4 pmol each primer, 1 U DNA polymerase, and 25 μL 2× buffer (with 4 mM Mg2+). The PCR amplifications were completed in the Mastercycler® nexus programmable thermal cycler (Eppendorf, Wesseling-Berzdorf, Germany) using the following program: 95 °C for 3 min; 35 cycles of 95 °C for 15 s, 60 °C for 15 s, and 72 °C for 1–2 min; 72 °C for 10 min. The PCR products were separated on a 1.5% agarose gel. The expected fragments were purified and inserted into the pMD19-T vector (Takara). Positive colonies were verified by Sanger sequencing (Sangon, Chengdu, China). The cloning and sequencing experiments were repeated at least three times. The primers used are listed in Table S7.

4.5. Structure Prediction

The secondary structures of the mRNA sequences of q (GenBank No. AY702957.1), Q (KX620763.1), Qc5 (MW419115), and another four overexpressed Q alleles (i.e., Qc1Qc4, KX620765, KX620766, KX620767, and KX620768) [40] were predicted using the Vienna RNA fold server (http://rna.tbi.univie.ac.at/; accessed on 1 March 2018) [68,69]. The secondary structures around the miRNA172-binding site were clipped and compared. The secondary structures of the deduced peptides encoding by q, Q, Qc5, and Qc1Qc4 were predicted using the default parameters of Antheprot 6.9.3 [70].
The three-dimensional (3D) structures of q, Q, Qc5, and Qc1Qc4 were predicted using I-TASSER (http://zhanglab.ccmb.med.umich.edu/I-TASSER/; accessed on 10 August 2018) [71,72,73] as described by Zhao [74]. The full-length Q and Qc5 structures were compared using TM-align (https://zhanggroup.org/TM-align/; accessed on 27 December 2018) as described by Zhang [75]. After simulating the substitution of the 408th residue (from proline in Q to leucine in Qc5), the resulting sequences were aligned using STRUM (https://zhanggroup.org/STRUM/; accessed on 1 January 2019) [76]. The q/Q and Q/Qc1–Qc4 protein structures were also compared using TM-align. Moreover, the 3D protein structures were visualized using UCSF Chimera (version 1.13.1; http://www.rbvi.ucsf.edu/chimera/; accessed on 1 January 2019) as described by Pettersen [77].

4.6. Processing Quality Analysis

All plants grown in the experimental plot were harvested, threshed, and sun-dried at approximately 35 °C to a constant weight. Grain samples were stored at room temperature for 2 months before milling. Two grain portions (500 kernels) were randomly selected and weighed to calculate the TKW (the difference in kernel weight between the two portions was less than 5%). The grain moisture content was measured using the MJ33 moisture analyzer (Mettler Toledo, Switzerland) and adjusted to 16.5% before milling. Each grain sample (1 kg) was milled using the Chopin® CD1 Mill (Chopin Technologies, Villeneuve-la-Garenne, France). The GPC (dry weight), Zeleny sedimentation value, and wet gluten content were determined as described by Wang [78].
A baking test was performed according to the AACC method 10.09-01 [40], with some modifications. Briefly, the standard rapid-mix-test with 35 g flour (14% moisture content) was used. The test was performed using three biological replicates, with two loaves of bread per flour sample. The bread volume was determined using the BVM6630 volume meter (Perten, Hägersten, Sweden).

4.7. Reversed-Phase High-Performance Liquid Chromatography (RP-HPLC)

An RP-HPLC analysis was performed to quantify the gliadin, HMW-GS, and LMW-GS contents and calculate the glutenins-to-gliadins (Glu/Gli) and HMW-GS-to-LMW-GS (HMW/LMW) ratios as described by Dupont [79] and Zheng [80], with some modifications. The total HMW-GS, LMW-GS, and gliadin contents were estimated by integrating the relevant RP-HPLC peaks in the chromatograms. The Glu/Gli ratio was calculated according to the relative contents.

4.8. Subcellular Localization

The full Q and Qc5 coding sequences (CDSs) were cloned into the pCAMBIA2300-eGFP (enhanced green fluorescent protein) vector. The primers used are listed in Table S7. The resulting vectors were inserted into wheat mesophyll protoplasts. After a 16 h incubation, the transfected protoplasts were examined using the STELLARIS STED/EM CPD300 confocal microscope (Leica, Germany). Wheat mesophyll protoplasts were prepared and transfected as described by Brandt [81].

4.9. Yeast One- and Two-Hybrid Analyses

To screen for Q-interacting proteins, equal amounts of RNA extracted from grain samples at 5, 10, 15, 20, 25, and 30 DAA were combined for the construction of an AD-prey yeast library (pGADT7-Rec) (Oebiotech, Shanghai, China). The Q CDS was inserted into the pGBKT7 vector (Q-BD). Subsequently, Q-BD and the AD-prey library were used for an examination of protein–protein interactions according to the Matchmaker Gold Yeast Two-Hybrid Library screening user manual (Clontech, Saint-Germain-en-Laye, France).
To compare the physical interaction between Q/Qc5 and SPA (GenBank No. Y09013.1), the SPA CDS was cloned from the cDNA of 14 DAA grains and then incorporated into the prey vector pGADT7 (AD-SPA). The resulting vector and the Q-BD or Qc5-BD bait vector were used for the co-transformation of Y2H Gold yeast cells. After preparing gradient dilutions, the two yeast strains containing Q-BD + AD-SPA and Qc5-BD + AD-SPA were cultured on double (SD/−Leu/−Try) and quadruple (SD/−Leu/−Try/−His/−Ade + X-α-Gal) dropout SD media (Clontech) in plates incubated at 28 °C for 3 days.
To determine whether Q can bind to the promoters of SSP genes, yeast one-hybrid assays were performed according to the Matchmaker Gold Yeast One-Hybrid Library screening user manual (Clontech). The HMW-GS (Bx7, Dx5, and Dy10) and LMW-GS (1D1) gene promoters were used as the bait sequences. The prey sequence (Q) was cloned into the pGADT7-Rec vector and then inserted into the bait yeast strains. To examine the potential interaction between Q and the SSP gene promoters, the bait yeast strains were grown on medium lacking uracil but supplemented with different aureobasidin A concentrations. The yeast cells were subsequently added to medium lacking leucine and the resulting colonies were photographed. The primers used are listed in Table S7.

4.10. Dual-Luciferase Reporter Assay

A dual-luciferase reporter assay was performed as described by Song [82], with some modifications. The SPA, Q allele, and Qc5 allele CDSs were inserted into the pGreenII 62-SK vector [83] under the control of the cauliflower mosaic virus 35S promoter (35S:SPA, 35S:Q, and 35S:Qc5). The LMW-1D1 promoter was incorporated into the pGreenII 0800-LUC (firefly luciferase) vector, which contains the 35S:REN (Renilla reniformis luciferase) cassette [83], to produce the reporter vector LMW-1D1pro:LUC. The primers used are listed in Table S7. The constructs were separately inserted into A. tumefaciens strain GV3101 cells (Weidi Biotechnology, Shanghai, China) along with the helper plasmid pSoup-19. The transformed A. tumefaciens cells were used in the following assay. Briefly, individual colonies carrying the above constructs were grown in YMB (yeast mannitol medium) liquid medium containing appropriate antibiotics, harvested, and resuspended in infiltration solution (10 mM MgCl2, 10 mM 4-morpholineethanesulfonic acid hydrate, and 150 mM acetosyringone) for an OD600 of 0.2. The cell suspensions were mixed (1:1 volume or a specific ratio) and injected into N. benthamiana leaves. The leaves co-infiltrated with LMW-1D1pro:LUC and the empty pGreenII 62-SK vector served as controls. All infiltrations were repeated at least three times, with at least three leaves per infiltration.
Leaf samples were collected using a hole punch at 48–60 h post-infiltration and then the LUC and REN activities were measured using the Dual Luciferase Reporter Assay Kit (Vazyme) and the GloMax® 96 Microplate Luminometer (Promega, Madison, WI, USA) as previously described [83]. The LUC-to-REN activity (LUC/REN) ratio was used to estimate the transactivation by the effectors. Images of fluorescence were captured using the ChemiDoc™ Touch Imaging System (Bio-Rad, Hercules, CA, USA). Three biological replicates were examined per experiment.

4.11. Statistical Analysis

All data were compiled using Excel 2016 (Microsoft 2016, Redmond, WA, USA) and analyzed using the Data Processing System software (version 17.10) [84]. A one-tailed Student’s t-test was used for comparing two groups. For multiple comparisons, the Student’s t-test and an analysis of variance were performed (least significant difference). Data were recorded as the mean ± standard deviation.

5. Conclusions

The present study verified the positive effect of Q on GPC and the bread-making quality of wheat on the basis of an analysis of a new Q allele (Qc5). A missense mutation outside of the Qc5 miRNA172-binding site leads to increased expression because of the associated highly folded mRNA secondary structure around the miRNA172-binding site, ultimately leading to an increase in spike density. Additionally, the missense mutation in Qc5 increases GPC and the bread-making quality of wheat by repressing the expression of SPR and modulating the interaction between Q and SPA.

Supplementary Materials

The following supporting information can be downloaded at: https://www.mdpi.com/article/10.3390/ijms23147581/s1. Reference [85] is cited in the supplementary figures.

Author Contributions

Investigation, Z.G., J.Z., Y.W. (Yan Wang), Y.L. (Yang Li), Q.L., K.Z., Y.L. (Yue Li), R.T., X.S., K.T. and L.K.; Data curation and Formal analysis, Z.G. and Q.C.; Writing—original draft, Z.G.; Methodology, Z.G., Y.Z. and P.Q.; Resources, Y.J., Q.J., J.W., G.C. and Y.W. (Yuming Wei); Writing—review and editing and funding acquisition, Y.Z. and P.Q. All authors have read and agreed to the published version of the manuscript.

Funding

This study was supported by the National Natural Science Foundation of China (grant numbers 32072054, 31971939 and 31901961), Science and Technology Department of Sichuan Province (2019YFH0066 and 2020YFH0150).

Institutional Review Board Statement

Not applicable.

Informed Consent Statement

Not applicable.

Data Availability Statement

All data supporting the findings of this study are available within this article and the Supplementary Materials published online.

Conflicts of Interest

The authors declare no conflict of interest.

References

  1. Nesbitt, M.; Samuel, D. From the staple crop to extinction? The archaeology and history of hulled wheats. In Hulled Wheats; Padulosi, S., Hammer, K., Heller, J., Eds.; International Plant Genetic Resources Institute: Rome, Italy, 1996; Volume 4, pp. 41–100. [Google Scholar]
  2. Huang, S.; Sirikhachornkit, A.; Su, X.; Faris, J.; Gill, B.; Haselkorn, R.; Gornicki, P. Genes encoding plastid acetyl-CoA carboxylase and 3-phosphoglycerate kinase of the Triticum/Aegilops complex and the evolutionary history of polyploid wheat. Proc. Natl. Acad. Sci. USA 2002, 99, 8133–8138. [Google Scholar] [CrossRef] [Green Version]
  3. FAOSTAT. FAO Database. Food and Agriculture Organization of the United Nations. Available online: http://www.fao.org/faostat/en/#data (accessed on 26 July 2021).
  4. Shewry, P.R. Wheat. J. Exp. Bot. 2009, 60, 1537–1553. [Google Scholar] [CrossRef] [PubMed]
  5. Qi, P.F.; Wei, Y.M.; Yue, Y.W.; Yan, Z.H.; Zheng, Y.L. Biochemical and molecular characterization of gliadins. Mol. Biol. 2006, 40, 713–723. [Google Scholar] [CrossRef]
  6. Payne, P.I. Genetics of wheat storage proteins and the effect of allelic variation on bread-making quality. Annu. Rev. Physiol. 1987, 38, 141–153. [Google Scholar] [CrossRef]
  7. Don, C.; Mann, G.; Bekes, F.; Hamer, R.J. HMW-GS affect the properties of glutenin particles in GMP and thus flour quality. J. Cereal Sci. 2006, 44, 127–136. [Google Scholar] [CrossRef]
  8. Tian, J.; Deng, Z.; Zhang, K.; Yu, H.; Jiang, X.; Li, C. Genetic detection of main quality traits in wheat. In Genetic Analyses of Wheat and Molecular Marker-Assisted Breeding; Science Press: Beijing, China, 2015; Volume 5, pp. 177–350. [Google Scholar]
  9. Rubio-Somoza, I.; Martinez, M.; Abraham, Z.; Diaz, I.; Carbonero, P. Ternary complex formation between HvMYBS3 and other factors involved in transcriptional control in barley seeds. Plant J. 2006, 47, 269–281. [Google Scholar] [CrossRef]
  10. Verdier, J.; Thompson, R.D. Transcriptional regulation of storage protein synthesis during dicotyledon seed filling. Plant Cell Physiol. 2008, 49, 1263–1271. [Google Scholar] [CrossRef] [Green Version]
  11. Xi, D.M.; Zheng, C.C. Transcriptional regulation of seed storage protein genes in Arabidopsis and cereals. Seed Sci. Res. 2011, 21, 247–254. [Google Scholar] [CrossRef]
  12. Vicente-Carbajosa, J.; Moose, S.P.; Parsons, R.L.; Schmidt, R.J. A maize zinc-finger protein binds the prolamin box in zein gene promoters and interacts with the basic leucine zipper transcriptional activator Opaque2. Proc. Natl. Acad. Sci. USA 1997, 94, 7685–7690. [Google Scholar] [CrossRef] [Green Version]
  13. Oñate, L.; Vicente-Carbajosa, J.; Lara, P.; Diaz, I.; Carbonero, P. Barley BLZ2, a seed-specific bZIP protein that interacts with BLZ1 in vivo and activates transcription from the GCN4-like motif of B-hordein promoters in barley endosperm. J. Biol. Chem. 1999, 274, 9175–9182. [Google Scholar] [CrossRef] [Green Version]
  14. Albani, D.; Hammond-Kosack, M.C.; Smith, C.; Conlan, S.; Colot, V.; Holdsworth, M.; Bevan, M.W. The wheat transcriptional activator SPA: A seed-specific bZIP protein that recognizes the GCN4-like motif in the bifactorial endosperm box of prolamin genes. Plant Cell 1997, 9, 171–184. [Google Scholar] [CrossRef] [PubMed]
  15. Mena, M.; Vicente-Carbajosa, J.; Schmidt, R.J.; Carbonero, P. An endosperm-specific DOF protein from barley, highly conserved in wheat, binds to and activates transcription from the prolamin-box of a native B-hordein promoter in barley endosperm. Plant J. 1998, 16, 53–62. [Google Scholar] [CrossRef] [PubMed] [Green Version]
  16. Diaz, I.; Martinez, M.; Isabel-LaMoneda, I.; Rubio-Somoza, I.; Carbonero, P. The DOF protein, SAD, interacts with GAMYB in plant nuclei and activates transcription of endosperm-specific genes during barley seed development. Plant J. 2005, 42, 652–662. [Google Scholar] [CrossRef]
  17. Bäumlein, H.; Nagy, I.; Villarroel, R.; Inzé, D.; Wobus, U. Cis-analysis of a seed protein gene promoter: The conservative RY repeat CATGCATG within the legumin box is essential for tissue-specific expression of a legumin gene. Plant J. 1992, 2, 233–239. [Google Scholar] [CrossRef] [PubMed]
  18. Moreno-Risueno, M.A.; González, N.; Díaz, I.; Parcy, F.; Carbonero, P.; Vicente-Carbajosa, J. FUSCA3 from barley unveils a common transcriptional regulation of seed-specific genes between cereals and Arabidopsis. Plant J. 2008, 53, 882–894. [Google Scholar] [CrossRef] [Green Version]
  19. Sun, F.; Liu, X.; Wie, Q.; Liu, J.; Yang, T.; Jia, L.; Wang, Y.; Yang, G.; He, G. Functional characterization of TaFUSCA3, a B3-superfamily transcription factor gene in the wheat. Front. Plant Sci. 2017, 8, 1133. [Google Scholar] [CrossRef] [Green Version]
  20. Guo, W.; Yang, H.; Liu, Y.; Gao, Y.; Ni, Z.; Peng, H.; Xin, M.; Hu, Z.; Sun, Q.; Yao, Y. The wheat transcription factor TaGAMyb recruits histone acetyltransferase and activates the expression of a high-molecular-weight glutenin subunit gene. Plant J. 2015, 84, 347–359. [Google Scholar] [CrossRef]
  21. Luo, G.; Shen, L.; Song, Y.; Yu, K.; Ji, J.; Zhang, C.; Yang, W.; Li, X.; Sun, J.; Zhan, K.; et al. The MYB family transcription factor TuODORANT1 from Triticum urartu and the homolog TaODORANT1 from Triticum aestivum inhibit seed storage protein synthesis in wheat. Plant Biotechnol. J. 2021, 19, 1863–1877. [Google Scholar] [CrossRef]
  22. Shen, L.; Luo, G.; Song, Y.; Xu, J.; Ji, J.; Zhang, C.; Gregová, E.; Yang, W.; Li, X.; Sun, J.; et al. A novel NAC family transcription factor SPR suppresses seed storage protein synthesis in wheat. Plant Biotechnol. J. 2021, 19, 992–1007. [Google Scholar] [CrossRef]
  23. Gao, Y.; An, K.; Guo, W.; Chen, Y.; Zhang, R.; Zhang, X.; Chang, S.; Rossi, V.; Jin, F.; Cao, X.; et al. The endosperm-specific transcription factor TaNAC019 regulates glutenin and starch accumulation and its elite allele improves wheat grain quality. Plant Cell 2021, 33, 603–622. [Google Scholar] [CrossRef]
  24. Schmidt, R.; Burr, F.A.; Aukerman, M.J.; Burr, B. Maize regulatory gene opaque-2 encodes a protein with a “leucine-zipper” motif binds to zein DNA. Proc. Natl. Acad. Sci. USA 1990, 87, 46–50. [Google Scholar] [CrossRef] [PubMed] [Green Version]
  25. Ravel, C.; Fiquet, S.; Boudet, J.; Dardevet, M.; Vincent, J.; Merlino, M.; Michard, R.; Martre, P. Conserved cis-regulatory modules in promoters of genes encoding wheat high-molecular-weight glutenin subunits. Front. Plant Sci. 2014, 5, 621. [Google Scholar] [CrossRef] [PubMed] [Green Version]
  26. Boudet, J.; Merlino, M.; Plessis, A.; Gaudin, J.C.; Dardevet, M.; Perrochon, S.; Alvarez, D.; Risacher, T.; Martre, P.; Ravel, C. The bZIP transcription factor SPA Heterodimerizing Protein represses glutenin synthesis in Triticum aestivum. Plant J. 2019, 97, 858–871. [Google Scholar] [CrossRef] [Green Version]
  27. Guo, D.; Hou, Q.; Zhang, R.; Lou, H.; Li, Y.; Zhang, Y.; You, M.; Xie, C.; Liang, R.; Li, B. Over-expressing TaSPA-B reduces prolamin and starch accumulation in wheat (Triticum aestivum L.) grains. Int. J. Mol. Sci. 2020, 21, 3257. [Google Scholar] [CrossRef] [PubMed]
  28. Rubio-Somoza, I.; Martinez, M.; Diaz, I.; Carbonero, P. HvMCB1, a R1MYB transcription factor from barley with antagonistic regulatory functions during seed development and germination. Plant J. 2006, 45, 17–30. [Google Scholar] [CrossRef] [Green Version]
  29. Mallory, A.C.; Vaucheret, H. Functions of microRNAs and related small RNAs in plants. Nat. Genet. 2006, 38, S31–S36. [Google Scholar] [CrossRef]
  30. Park, W.; Li, J.; Song, R.; Messing, J.; Chen, X. Carpel factory, a Dicer homolog, and HEN1, a novel protein, act in microRNA metabolism in Arabidopsis thaliana. Curr. Biol. 2002, 12, 1484–1495. [Google Scholar] [CrossRef] [Green Version]
  31. Chen, X. A microRNA as a translational repressor of APETALA2 in Arabidopsis flower development. Science 2004, 303, 2022–2025. [Google Scholar] [CrossRef] [Green Version]
  32. Aukerman, M.J.; Sakai, H. Regulation of flowering time and floral organ identity by a microRNA and its APETALA2-like target genes. Plant Cell 2003, 15, 2730–2741. [Google Scholar] [CrossRef] [Green Version]
  33. Schmid, M.; Uhlenhaut, N.H.; Godard, F.; Demar, M.; Bressan, R.; Weigel, D.; Lohmann, J.U. Dissection of floral induction pathways using global expression analysis. Development 2003, 130, 6001–6012. [Google Scholar] [CrossRef] [Green Version]
  34. Schwab, R.; Palatnik, J.F.; Riester, M.; Schommer, C.; Schmid, M.; Weigel, D. Specific effects of microRNAs on the plant transcriptome. Dev. Cell 2005, 8, 517–527. [Google Scholar] [CrossRef] [PubMed] [Green Version]
  35. Debernardi, J.M.; Lin, H.Q.; Chuck, G.; Faris, J.D.; Dubcovsky, J. MicroRNA172 plays a crucial role in wheat spike morphogenesis and grain threshability. Development 2017, 144, 1966–1975. [Google Scholar] [CrossRef] [PubMed] [Green Version]
  36. Debernardi, J.M.; Greenwood, J.R.; Finnegan, E.J.; Jernstedt, J.; Dubcovsky, J. APETALA 2-like genes AP2L2 and Q specify lemma identity and axillary floral meristem development in wheat. Plant J. 2020, 101, 171–187. [Google Scholar] [CrossRef] [PubMed] [Green Version]
  37. Simons, K.J.; Fellers, J.P.; Trick, H.N.; Zhang, C.; Tai, Y.S.; Gill, B.S.; Faris, J.D. Molecular characterization of the major wheat domestication gene Q. Genetics 2006, 172, 547–555. [Google Scholar] [CrossRef] [PubMed] [Green Version]
  38. Zhang, Z.C.; Belcram, H.; Gornicki, P.; Charles, M.; Just, J.; Huneau, C.; Magdelenat, G.; Couloux, A.; Samain, S.; Gill, B.S.; et al. Duplication and partitioning in evolution and function of homoeologous Q loci governing domestication characters in polyploid wheat. Proc. Natl. Acad. Sci. USA 2011, 108, 18737–18742. [Google Scholar] [CrossRef] [Green Version]
  39. Jiang, Y.F.; Chen, Q.; Wang, Y.; Guo, Z.R.; Xu, B.J.; Zhu, J.; Zhang, Y.Z.; Gong, X.; Luo, C.H.; Wu, W.; et al. Re-acquisition of the brittle rachis trait via a transposon insertion in domestication gene Q during wheat de-domestication. New Phytol. 2019, 224, 961–973. [Google Scholar] [CrossRef]
  40. Xu, B.J.; Chen, Q.; Zheng, T.; Jiang, Y.F.; Qiao, Y.Y.; Guo, Z.R.; Cao, Y.L.; Wang, Y.; Zhang, Y.Z.; Zong, L.J.; et al. An overexpressed Q allele leads to increased spike density and improved processing quality in common wheat (Triticum aestivum). G3 Genes Genom. Genet. 2018, 8, 771–778. [Google Scholar] [CrossRef] [Green Version]
  41. Zadoks, J.C.; Chang, T.T.; Konzak, C.F. A decimal code for the growth stages of cereals. Weed Res. 1974, 14, 415–421. [Google Scholar] [CrossRef]
  42. Eckardt, N.A. Evolution of domesticated bread wheat. Plant Cell 2010, 22, 993. [Google Scholar] [CrossRef]
  43. Muramatsu, M. Dosage effect of the spelta gene q of hexaploid wheat. Genetics 1963, 48, 469–482. [Google Scholar] [CrossRef]
  44. Muramatsu, M. The vulgare super gene, Q: Its universality in durum wheat and its phenotypic effects in tetraploid and hexaploid wheats. Can. J. Genet. Cytol. 1986, 28, 30–41. [Google Scholar] [CrossRef]
  45. Endo, T.R.; Gill, B.S. The deletion stocks of common wheat. J. Hered. 1996, 87, 295–307. [Google Scholar] [CrossRef]
  46. Förster, S.; Schumann, E.; Baumann, M.; Weber, W.E.; Pillen, K. Copy number variation of chromosome 5A and its association with Q gene expression, morphological aberrations, and agronomic performance of winter wheat cultivars. Theor. Appl. Genet. 2013, 126, 3049–3063. [Google Scholar] [CrossRef]
  47. Faris, J.D.; Zhang, Q.; Chao, S.; Zhang, Z.; Xu, S. Analysis of agronomic and domestication traits in a durum × cultivated emmer wheat population using a high-density single nucleotide polymorphism-based linkage map. Theor. Appl. Genet. 2014, 127, 2333–2348. [Google Scholar] [CrossRef] [PubMed]
  48. Joppa, L.R.; Du, C.; Hart, G.E.; Hareland, G.A. Mapping gene (s) for grain protein in tetraploid wheat (Triticum turgidum L.) using a population of recombinant inbred chromosome lines. Crop Sci. 1997, 37, 1586–1589. [Google Scholar] [CrossRef]
  49. Uauy, C.; Distelfeld, A.; Fahima, T.; Blechl, A.; Dubcovsky, J. A NAC gene regulating senescence improves grain protein, zinc, and iron content in wheat. Science 2006, 314, 1298–1301. [Google Scholar] [CrossRef] [Green Version]
  50. Chen, Q.; Guo, Z.R.; Shi, X.L.; Wei, M.Q.; Fan, Y.Z.; Zhu, J.; Zheng, T.; Wang, Y.; Kong, L.; Deng, M.; et al. Increasing the Grain Yield and Grain Protein Content of Common Wheat (Triticum aestivum) by Introducing Missense Mutations in the Q Gene. PREPRINT (Version 1) Available at Research Square. Available online: https://www.researchsquare.com/article/rs-899571/v1 (accessed on 18 October 2021).
  51. Xie, Q.; Li, N.; Yang, Y.; Lv, Y.; Yao, H.; Wei, R.; Sparkes, D.L.; Ma, Z. Pleiotropic effects of the wheat domestication gene Q on yield and grain morphology. Planta 2018, 247, 1089–1098. [Google Scholar] [CrossRef]
  52. Mallory, A.C.; Reinhart, B.J.; Jones-Rhoades, M.W.; Tang, G.; Zamore, P.D.; Barton, M.K.; Bartel, D.P. MicroRNA control of PHABULOSA in leaf development: Importance of pairing to the microRNA 5′ region. EMBO J. 2004, 23, 3356–3364. [Google Scholar] [CrossRef] [Green Version]
  53. German, M.A.; Pillay, M.; Jeong, D.H.; Hetawal, A.; Luo, S.; Janardhanan, P.; Kannan, V.; Rymarquis, L.A.; Nobuta, K.; German, R.; et al. Global identification of microRNA-target RNA pairs by parallel analysis of RNA ends. Nat. Biotechnol. 2008, 26, 941–946. [Google Scholar] [CrossRef]
  54. Liu, Q.; Wang, F.; Axtell, M.J. Analysis of complementarity requirements for plant microRNA targeting using a Nicotiana benthamiana quantitative transient assay. Plant Cell 2014, 26, 741–753. [Google Scholar] [CrossRef] [Green Version]
  55. Chuck, G.; Meeley, R.; Irish, E.; Sakai, H.; Hake, S. The maize tasselseed4 microRNA controls sex determination and meristem cell fate by targeting Tasselseed6/indeterminate spikelet1. Nat. Genet. 2007, 39, 1517–1521. [Google Scholar] [CrossRef] [PubMed]
  56. Zhu, Q.H.; Upadhyaya, N.M.; Gubler, F.; Helliwell, C.A. Over-expression of miR172 causes loss of spikelet determinacy and floral organ abnormalities in rice (Oryza sativa). BMC Plant Biol. 2009, 9, 149. [Google Scholar] [CrossRef] [PubMed] [Green Version]
  57. Nair, S.K.; Wang, N.; Turuspekov, Y.; Pourkheirandish, M.; Sinsuwongwat, S.; Chen, G.; Sameri, M.; Tagiri, A.; Honda, I.; Watanabe, Y.; et al. Cleistogamous flowering in barley arises from the suppression of microRNA-guided HvAP2 mRNA cleavage. Proc. Natl. Acad. Sci. USA 2010, 107, 490–495. [Google Scholar] [CrossRef] [PubMed] [Green Version]
  58. Houston, K.; McKim, S.M.; Comadran, J.; Bonar, N.; Druka, I.; Uzrek, N.; Cirillo, E.; Guzy-Wrobelska, J.; Collins, N.C.; Halpin, C.; et al. Variation in the interaction between alleles of HvAPETALA2 and microRNA172 determines the density of grains on the barley inflorescence. Proc. Natl. Acad. Sci. USA 2013, 110, 16675–16680. [Google Scholar] [CrossRef] [Green Version]
  59. Zheng, Z.; Reichel, M.; Deveson, I.; Wong, G.; Li, J.; Millar, A.A. Target RNA secondary structure is a major determinant of miR159 efficacy. Plant Physiol. 2017, 174, 1764–1778. [Google Scholar] [CrossRef] [Green Version]
  60. Chou, P.Y.; Fasman, G.D. Conformational parameters for amino acids in helical, beta-sheet, and random coil regions calculated from proteins. Biochemistry 1974, 13, 211–222. [Google Scholar] [CrossRef]
  61. Barlow, D.J.; Thornton, J.M. Helix geometry in proteins. J. Mol. Biol. 1988, 201, 601–619. [Google Scholar] [CrossRef]
  62. Doyle, J.J.; Doyle, J.L.; Doyle, J.A.; Doyle, F.J. A rapid DNA isolation procedure for small quantities of fresh leaf tissue. Phytochem. Bull. 1987, 19, 11–15. [Google Scholar]
  63. Long, X.Y.; Wang, J.R.; Ouellet, T.; Rocheleau, H.; Wei, Y.M.; Pu, Z.E.; Jiang, Q.T.; Lan, X.J.; Zheng, Y.L. Genome-wide identification and evaluation of novel internal control genes for Q-PCR based transcript normalization in wheat. Plant Mol. Biol. 2010, 74, 307–311. [Google Scholar] [CrossRef]
  64. Bray, N.L.; Pimentel, H.; Melsted, P.; Pachter, L. Near-optimal probabilistic RNA-seq quantification. Nat. Biotechnol. 2016, 34, 525–527. [Google Scholar] [CrossRef]
  65. Robinson, M.D.; McCarthy, D.J.; Smyth, G.K. edgeR: A Bioconductor package for differential expression analysis of digital gene expression data. Bioinformatics 2010, 26, 139–140. [Google Scholar] [CrossRef] [PubMed] [Green Version]
  66. Young, M.D.; Wakefield, M.J.; Smyth, G.K.; Oshlack, A. Gene ontology analysis for RNA-seq: Accounting for selection bias. Genome Biol. 2010, 11, R14. [Google Scholar] [CrossRef] [Green Version]
  67. Xie, C.; Mao, X.; Huang, J.; Ding, Y.; Wu, J.; Dong, S.; Kong, L.; Gao, G.; Li, C.Y.; Wei, L. KOBAS 2.0: A web server for annotation and identification of enriched pathways and diseases. Nucleic Acids Res. 2011, 39, W316–W322. [Google Scholar] [CrossRef] [Green Version]
  68. Gruber, A.R.; Lorenz, R.; Bernhart, S.H.; Neuböck, R.; Hofacker, I.L. The vienna RNA websuite. Nucleic Acids Res. 2008, 36, W70–W74. [Google Scholar] [CrossRef] [PubMed] [Green Version]
  69. Lorenz, R.; Bernhart, S.H.; Höner zu Siederdissen, C.; Tafer, H.; Flamm, C.; Stadler, P.F.; Hofacker, I.L. ViennaRNA Package 2.0. Algorithms Mol. Biol. 2011, 6, 26. [Google Scholar] [CrossRef] [PubMed]
  70. Deleage, G.; Combet, C.; Blanchet, C.; Geourjon, C. ANTHEPROT: An integrated protein sequence analysis software with client/server capabilities. Comput. Biol. Med. 2001, 31, 259–267. [Google Scholar] [CrossRef]
  71. Roy, A.; Kucukural, A.; Zhang, Y. I-TASSER: A unified platform for automated protein structure and function prediction. Nat. Protoc. 2010, 5, 725–738. [Google Scholar] [CrossRef] [Green Version]
  72. Yang, J.; Yan, R.; Roy, A.; Xu, D.; Poisson, J.; Zhang, Y. The I-TASSER Suite: Protein structure and function prediction. Nat. Methods 2015, 12, 7–8. [Google Scholar] [CrossRef] [Green Version]
  73. Yang, J.; Zhang, Y. I-TASSER server: New development for protein structure and function predictions. Nucleic Acids Res. 2015, 43, W174–W181. [Google Scholar] [CrossRef] [Green Version]
  74. Zhao, K.; Xiao, J.; Liu, Y.; Chen, S.; Yuan, C.; Cao, A.; You, M.F.; Yang, D.; An, S.; Wang, H.; et al. Rht23 (5Dq’) likely encodes a Q homeologue with pleiotropic effects on plant height and spike compactness. Theor. Appl. Genet. 2018, 131, 1825–1834. [Google Scholar] [CrossRef]
  75. Zhang, Y.; Skolnick, J. TM-align: A protein structure alignment algorithm based on TM-score. Nucleic Acids Res. 2005, 33, 2302–2309. [Google Scholar] [CrossRef] [PubMed]
  76. Quan, L.; Lv, Q.; Zhang, Y. STRUM: Structure-based stability change prediction upon single-point mutation. Bioinformatics 2016, 32, 2936–2946. [Google Scholar] [CrossRef] [PubMed] [Green Version]
  77. Pettersen, E.F.; Goddard, T.D.; Huang, C.C.; Couch, G.S.; Greenblatt, D.M.; Meng, E.C.; Ferrin, T.E. UCSF Chimera—A visualization system for exploratory research and analysis. J. Comput. Chem. 2004, 25, 1605–1612. [Google Scholar] [CrossRef] [PubMed] [Green Version]
  78. Wang, Y.; Chen, Q.; Li, Y.; Guo, Z.R.; Liu, C.H.; Wan, Y.F.; Hawkesford, M.; Zhu, J.; Wu, W.; Wei, M.Q.; et al. Post-translational cleavage of HMW-GS Dy10 allele improves the cookie-making quality in common wheat (Triticum aestivum). Mol. Breed. 2021, 41, 49. [Google Scholar] [CrossRef]
  79. Dupont, F.M.; Chan, R.; Lopez, R.; Vensel, W.H. Sequential extraction and quantitative recovery of gliadins, glutenins, and other proteins from small samples of wheat flour. J. Agr. Food Chem. 2005, 53, 1575–1584. [Google Scholar] [CrossRef]
  80. Zheng, T.; Qi, P.F.; Cao, Y.L.; Han, Y.N.; Ma, H.L.; Guo, Z.R.; Wang, Y.; Qiao, Y.Y.; Hua, S.Y.; Yu, H.Y.; et al. Mechanisms of wheat (Triticum aestivum) grain storage proteins in response to nitrogen application and its impacts on processing quality. Sci. Rep. 2018, 8, 11928. [Google Scholar] [CrossRef]
  81. Brandt, K.M.; Gunn, H.; Moretti, N.; Zemetra, R.S. A streamlined protocol for wheat (Triticum aestivum) protoplast isolation and transformation with CRISPR-Cas ribonucleoprotein complexes. Front. Plant Sci. 2020, 11, 769. [Google Scholar] [CrossRef]
  82. Song, Y.; Li, G.; Nowak, J.; Zhang, X.; Xu, D.; Yang, X.; Huang, G.; Liang, W.; Yang, L.; Wang, C.; et al. The rice actin-binding protein RMD regulates light-dependent shoot gravitropism. Plant Physiol. 2019, 181, 630–644. [Google Scholar] [CrossRef] [Green Version]
  83. Hellens, R.P.; Allan, A.C.; Friel, E.N.; Bolitho, K.; Grafton, K.; Templeton, M.D.; Karunairetnam, S.; Gleave, A.P.; Laing, W.A. Transient expression vectors for functional genomics, quantification of promoter activity and RNA silencing in plants. Plant Methods 2005, 1, 13. [Google Scholar] [CrossRef] [Green Version]
  84. Tang, Q.Y.; Zhang, C.X. Data Processing System (DPS) software with experimental design, statistical analysis and data mining developed for use in entomological research. Insect Sci. 2013, 20, 254–260. [Google Scholar] [CrossRef]
  85. Gil-Humanes, J.; Pistón, F.; Martín, A.; Barro, F. Comparative genomic analysis and expression of the APETALA2-like genes from barley, wheat, and barley-wheat amphiploids. BMC Plant Biol. 2009, 9, 66. [Google Scholar] [CrossRef] [PubMed] [Green Version]
Figure 1. The mutant phenotype is controlled by the Cp5 locus. (A) Spikes of R-Cp5-1 (left) and the wild-type (WT) control (right). Scale bar, 1 cm. (B) R-Cp5-1 (left) and WT (right) plants. Scale bar, 10 cm. (C) Segregation analysis of the Cp5 locus. (D) Polymorphic molecular marker between Qt and Qc5, which co-segregated with the compact spike trait. Lane 1: QZ96; Lane 2: R-Cp5-1; Lanes 3–11: representative F3 individuals from R-Cp5-1/QZ96. (EI) Comparison between R-Cp5-1 and WT in terms of the plant height, spike length, spikelet number per spike, grain number per spike, and tiller number (n = 20; **, p ≤ 0.01; ns, not significant).
Ijms 23 07581 g001
Figure 2. One missense mutation flanking the miRNA172-binding site increased the spike density and the Qc5 expression level. (A) and (B) Schematic diagrams of the Q and Qc5 alleles. A missense mutation (C in “Roblin” and T in R-Cp5-1) changes the 408th residue from proline (P) to leucine (L). (CF) R-Cp5-1 (left) and WT (right) spikes at GS23 (C), GS24 (D), GS32 (E), and GS39 (F). Scale bars, 0.05 cm in (C,D), 0.1 cm in (E), and 1 cm in (F). (G) Comparison of the Q and Qc5 transcription levels in spikes at GS23, GS24, GS32, and GS39. Data are presented as the mean ± standard deviation (n = 3; *, p ≤ 0.05; **, p ≤ 0.01).
Ijms 23 07581 g002
Figure 3. Qc5 results in relatively small seeds and increased processing quality. Length (A) and width (B) of 30 seeds from R-Cp5-1 (upper) and WT (lower). Scale bar, 1 cm. (C) Thousand kernel weight of R-Cp5-1 and WT. (DF) Comparison of bread made from R-Cp5-1 and WT wheat. Scale bar, 1 cm. (GI) Comparison of the grain protein content (G), wet gluten content (H), and Zeleny sedimentation value (I) between R-Cp5-1 and WT. (JN) The Glu/Gli ratio (J), total HMW-GS (K), total LMW-GS (L), total gliadins (M), and HMW/LMW ratio (N) were greater for R-Cp5-1 than for WT. Data are presented as the mean ± standard deviation (n = 4; *, p ≤ 0.05; **, p ≤ 0.01).
Ijms 23 07581 g003
Figure 4. Q physically interacts with SPA to regulate the expression of SSP genes. (A) Q and Qc5 are localized to the nucleus of wheat mesophyll protoplasts. (B) Qc5 interacts with SPA more weakly than Q in yeast two-hybrid assays. Y2HGold yeast cells transformed with the labeled constructs were assayed for growth on SD medium lacking LW and for LacZ activities on SD-LWHA medium supplemented with X-α-gal. pAD, GAL4 activation domain; pBD, GAL4 DNA-binding domain; 4 mM 3AT was added to the SD-LWHA medium to repress self-activation. The pGBKT7 and pGADT7 empty vectors were used as the negative control, whereas the interaction between p53 and Lam served as the positive control. (CE) Ability of Q/Qc5 and SPA to activate the LMW-GS gene promoter revealed by dual-luciferase transcriptional activity assays. (C) Schematic diagrams of the effector and reporter plasmids. 35S:SPA, 35S:Q, and 35S:Qc5 were constructed as effectors. The promoter of the LMW-GS gene LMW-1D1 was fused to LUC to generate the reporter LMW-1D1pro:LUC. LUC, firefly luciferase; 35Spro, CaMV 35S promoter; REN, Renilla reniformis luciferase; ter, terminator. (D) Q inhibits the ability of SPA to activate the LMW-1D1 promoter. (E) Qc5 + SPA activates the promoter more than Q + SPA. Representative leaves are shown in the upper panel, whereas the relative luciferase activities are presented in the lower panel. LUC/REN indicates the LUC-to-REN activity ratio. Data are presented as the mean ± standard deviation (n = 3). Capital letters above each column indicate significant differences at p ≤ 0.01. + and − respectively indicate the presence and absence of the indicated effector/reporter constructs, whereas × indicates the Q concentration.
Ijms 23 07581 g004
Figure 5. Relative expression of Q (A), SPA (B), SPR-A (C), SPR-D (D), and SPR-All (E) in developing seeds. Data are presented as the mean ± standard deviation (n = 3; *, p ≤ 0.05; **, p ≤ 0.01). (F) Heat map presenting the mean normalized expression of selected DEGs. The scale bar indicates the mean normalized expression level. Sample_Exp is the mean expression of all genes in every sample; Gene_Exp is the mean expression of each gene. The histograms reflect the relative expression levels. All DEGs are listed in Tables S5 and S6.
Ijms 23 07581 g005
Figure 6. Schematic diagram of the regulatory effect of Qc5 on SSP gene expression in wheat seeds. The activation of SSP expression by SPA is inhibited by Q, but the missense mutation from Q to Qc5 weakens this inhibition, resulting in more SSP accumulation. Moreover, the missense mutation in Qc5 down-regulates SPR expression; since SPR functions as a repressor of SSP genes, the suppression of SPR results in up-regulated SSP expression levels. Taken together, the up-regulated SSPs expression results in improved bread-making quality. Solid and dotted arrows indicate direct and indirect regulation, respectively. The question mark indicates the regulatory effect of Q on SPR expression remains to be elucidated.
Ijms 23 07581 g006
Table 1. Expression of the genes encoding transcription factors that regulate SSP gene expression.
Gene IDLog2FCGene Name
TraesCSU02G1372001.42SPR-A [22]
TraesCS2B02G616900−3.89SPR-B [22]
TraesCS2D02G567000−8.22SPR-D [22]
TraesCS3A02G077900−0.31TaNAC019-A [23]
TraesCS3B02G092800−0.0037TaNAC019-B [23]
TraesCS3D02G0785000.996TaNAC019-D [23]
TraesCS5A02G4404000.32TaSHP [26]
TraesCS5B02G4441000.46TaSHP [26]
TraesCS5D02G4475000.34TaSHP [26]
TraesCS1B02G3435000.13SPA-B [14,24]
TraesCS1D02G3322000.35SPA-D [14,24]
TraesCS3A02G336500−0.61TaGAMYB-A [20]
TraesCS3B02G3675000.58TaGAMYB-B [20]
TraesCS3D02G3294000.49TaGAMYB-D [20]
TraesCS3A02G249100−0.07TaFUSCA3 [19]
TraesCS3B02G278000−0.38TaFUSCA3 [19]
TraesCS3D02G2491000.07TaFUSCA3 [19]
TraesCS5A02G1559000.47TaPBF
TraesCS5B02G1541000.49TaPBF
TraesCS5D02G1610000.14TaPBF
TraesCS7A02G205100−0.23TaODORANT1 [21]
TraesCS7B02G1124000.12TaODORANT1 [21]
TraesCS7D02G208000−0.04TaODORANT1 [21]
Publisher’s Note: MDPI stays neutral with regard to jurisdictional claims in published maps and institutional affiliations.

