
Glutathione Depletion and MicroRNA Dysregulation in Multiple System Atrophy: A Review


1
Department of Pharmacology, Teikyo University School of Medicine, 2-11-1 Kaga, Itabashi, Tokyo 173-8605, Japan
2
Teikyo University Support Center for Women Physicians and Researchers, 2-11-1 Kaga, Itabashi, Tokyo 173-8605, Japan
*
Authors to whom correspondence should be addressed.
Int. J. Mol. Sci. 2022, 23(23), 15076; https://doi.org/10.3390/ijms232315076
Submission received: 31 October 2022
/
Revised: 25 November 2022
/
Accepted: 29 November 2022
/
Published: 1 December 2022
(This article belongs to the Special Issue Neuroprotective Effect of Glutathione 2.0)
Abstract
:Multiple system atrophy (MSA) is a rare neurodegenerative disease characterized by parkinsonism, cerebellar impairment, and autonomic failure. Although the causes of MSA onset and progression remain uncertain, its pathogenesis may involve oxidative stress via the generation of excess reactive oxygen species and/or destruction of the antioxidant system. One of the most powerful antioxidants is glutathione, which plays essential roles as an antioxidant enzyme cofactor, cysteine-storage molecule, major redox buffer, and neuromodulator, in addition to being a key antioxidant in the central nervous system. Glutathione levels are known to be reduced in neurodegenerative diseases. In addition, genes regulating redox states have been shown to be post-transcriptionally modified by microRNA (miRNA), one of the most important types of non-coding RNA. miRNAs have been reported to be dysregulated in several diseases, including MSA. In this review, we focused on the relation between glutathione deficiency, miRNA dysregulation and oxidative stress and their close relation with MSA pathology.
1. Introduction
Multiple system atrophy (MSA) is a rare, adult-onset, fatal neurodegenerative disease (ND) characterized by progressive loss of neuronal and oligodendroglial cells in various sites in the brain [1]. Disease onset is usually around 50 years old or later, with the age distribution of onset peaking in the late 50s. Currently, MSA is diagnosed when parkinsonism or cerebellar ataxia presents with prominent autonomic failure, and it is often accompanied by rapid eye movement (REM) sleep behavior disorder [2]. MSA belongs to the group of α-synucleinopathies, which are morphologically characterized by abnormal accumulation of fibrillary α-synuclein (α-syn) in the neurons and oligodendrocytes [3]. Oligodendroglial inclusions are specifically detected in the brains of MSA patients; these inclusions are the main hallmark of the disease and are considered to play a critical role in the primary events leading to MSA [4]. Although the origin of α-syn inclusions in the oligodendrocytes has been controversial, the leading hypotheses are that either internalization of neuron-secreted α-syn or de novo α-syn abnormality in oligodendrocytes is a key event in the pathogenic cascade leading to the propagation and spread of α-synucleinopathies of MSA [5]. Symptomatic therapies are available for MSA-associated parkinsonism and autonomic failures, but the response to these treatments is often poor [6]. Moreover, there is currently no effective medicine to ameliorate or even slow the progress of MSA. The rapid and devastating disease progression of MSA symptoms results in a relatively short survival period after disease onset [7]. Indeed, the estimated survival is approximately 9 years from symptom onset [8].
Because of the low incidence and uncertain diagnosis, there have been far fewer studies on MSA than on major NDs such as Alzheimer’s disease (AD), Parkinson’s disease (PD) and amyotrophic lateral sclerosis (ALS). Recently, however, improvements in the diagnostic certainty and advances in genetic technologies have promoted investigation of the etiological mechanisms of MSA. Although no hereditable mutations have been identified in MSA, some family history of genetic mutations as well as polymorphisms in unrelated patients with MSA have been found [9,10,11,12,13,14]. Recently, microRNA (miRNA) has emerged as a novel component of the gene expression regulation for maintaining brain functions [15]. Abnormalities in miRNA expression have been reported to cause several NDs, including MSA [16,17]. The first genome-wide miRNA analysis of MSA brain tissue revealed dysregulation of miRNAs, resulting in downregulation of the solute carrier family transporters for glutathione (GSH) and taurine, both of which are important antioxidants for neuroprotection against oxidative stress [18]. It is generally thought that the initiation and progression of NDs are likely induced by oxidative stress via an imbalance of oxidants and antioxidants [19,20]. GSH is known as a key protector against oxidative stress, and both nuclear magnetic resonance spectral and postmortem analyses have shown GSH depletion in the brains of patients with NDs [21,22,23,24,25,26,27,28]. In this review, we focus on the relation between miRNA dysregulation and oxidative stress, both of which appear to play a role in MSA pathology.
2. An Overview of MSA
MSA is a rare, rapidly progressing, fatal neurodegenerative disorder of uncertain etiology that is clinically characterized by a variable combination of parkinsonism, cerebellar impairment, autonomic failure and motor dysfunctions [29]. The term “multiple system atrophy” was coined by Graham and Oppenheimer in 1969, who proposed it as the combination of various separate neurological disorders into a single disease with symptoms and signs of lesions affecting several central nervous system (CNS) structures and multiple physiological systems [30]. Differential diagnosis between MSA and other forms of neurodegenerative parkinsonism such as PD is often difficult in practice. Useful biomarkers for clinically distinguishing MSA from other NDs are urgently needed.
2.1. Clinical Classification of MSA
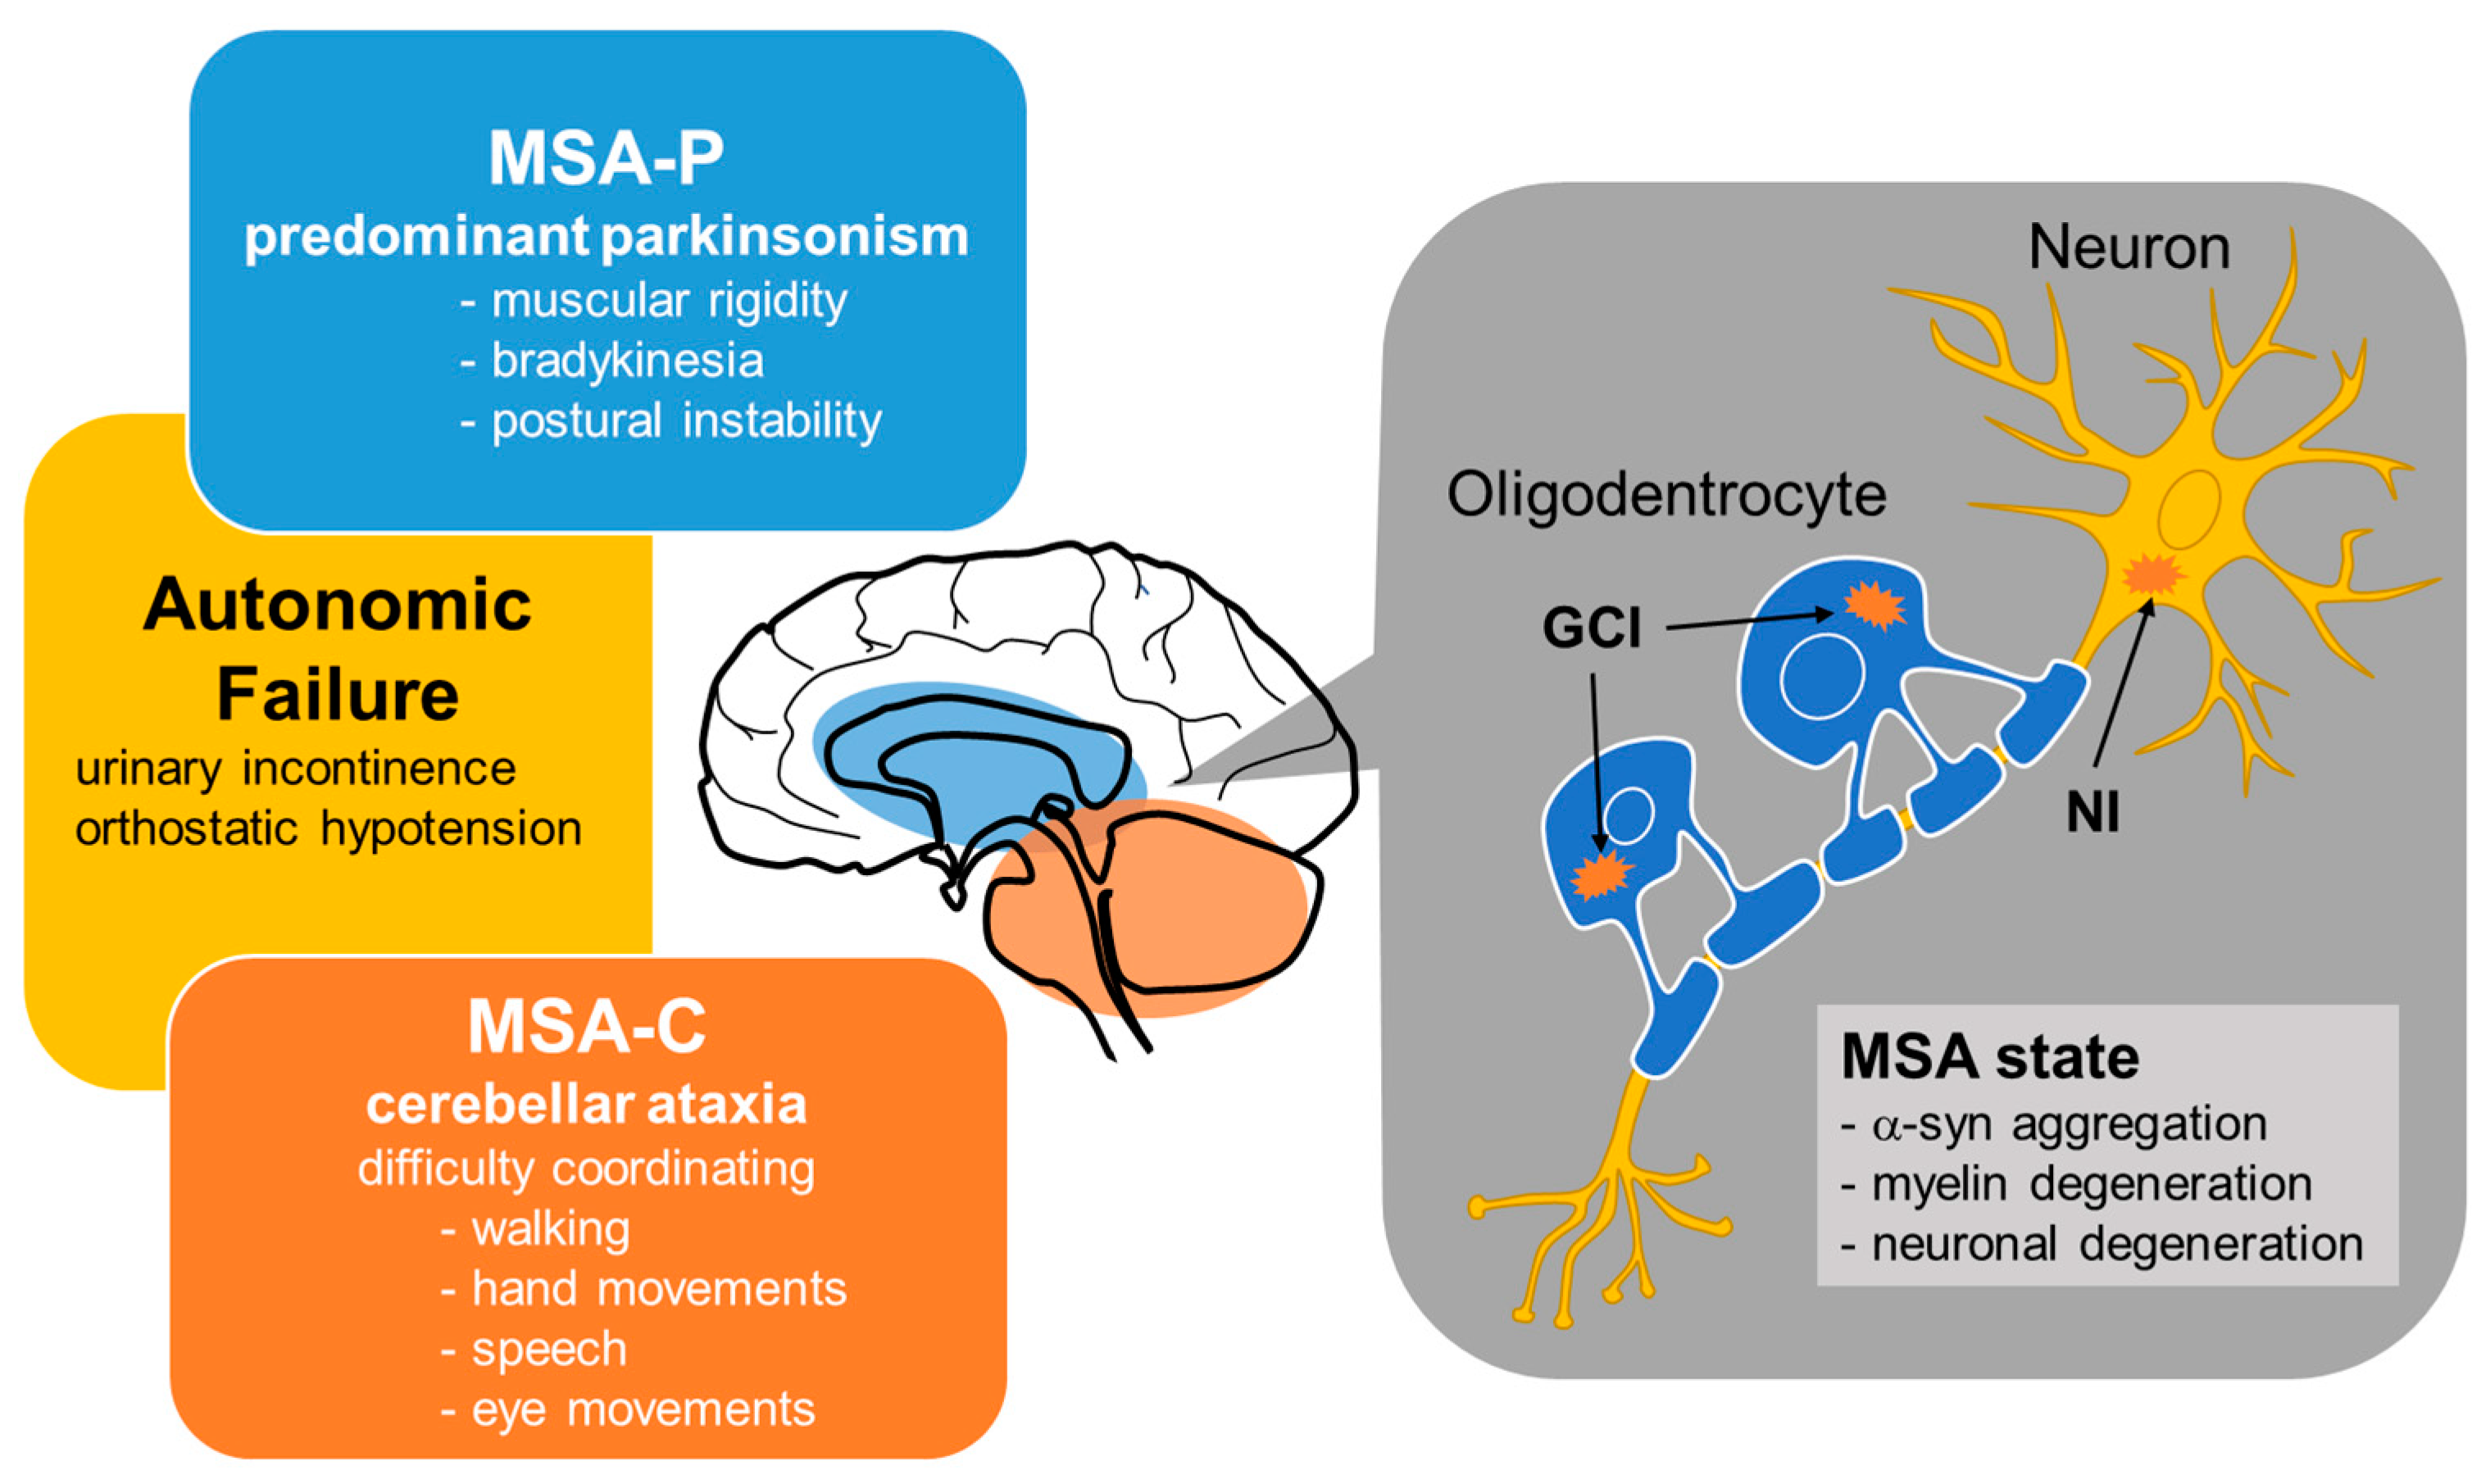
Until fairly recently, MSA cases were classified into three types—olivopontocerebellar atrophy (OPCA), striatonigral degeneration (SND), and Shy-Drager syndrome (SDS)—which are characterized by prominent cerebellar and extrapyramidal signs, atypical parkinsonism, and parkinsonism with autonomic failure, respectively [31]. In 1998, consensus criteria for the clinical diagnosis of MSA yielded a simpler classification into two subtypes depending on whether the initial symptoms were predominantly parkinsonian (MSA-P) or cerebellar (MSA-C) [29,32,33] (Figure 1). MSA-P is associated with SND, the symptoms of which are similar to those of PD—namely, muscular rigidity, bradykinesia and postural instability—although resting tremor appears to be less severe in MSA-P than in PD. On the other hand, MSA-C is roughly synonymous with OPCA from the previous classification, the main symptoms of which are cerebellar ataxia characterized by difficulty coordinating walking, hand movements, speech, and eye movements. SDS is not included as a subtype in this new consensus criteria, but it is known to be a clinical form of MSA with autonomic failure as the primary symptom.
2.2. Pathological Features of MSA
Pathologically, MSA is characterized by abnormal glial cytoplasmic inclusions (GCIs) and neuronal inclusions (NIs) of aggregated α-syn in several areas of the nervous system, including the cerebellar cortex, pons, striatum, substantia nigra and brain stem [34] (Figure 1). Most of the studies assessing the pathogenesis of MSA have focused on the mechanisms underlying intracellular accumulation of α-syn, an approximately 14.5-kDa protein composed of 140 amino acids that is physiologically expressed in the human brain [35]. Accumulating evidence has suggested that either α-syn is transferred from neurons to oligodendroglia or that α-syn pathology spreads in a prion-like manner [34]. Although the cause of misfolded α-syn deposition in the oligodendrocytes and neurons of patients with MSA is still obscure, it is known that the uptake, accumulation, and oligomerization of extracellular α-syn is promoted by oxidative stress in oligodendrocytes [36].
Oxidative stress is basically characterized by an imbalance of oxidants and antioxidants that results in an excess of reactive oxygen species (ROS) [37]. Because mitochondria are a major source and an immediate target of ROS, a vicious circle of oxidative stress and mitochondrial dysfunction may trigger and exacerbate NDs including MSA [38]. The majority of cellular ROS are generated by the mitochondrial respiratory chain and oxidative phosphorylation system, which consists of five complexes, I–V, through which electrons pass [39]. In Complex I, electrons borne on nicotinamide adenine dinucleotide dehydrogenase (NADH) are transferred to coenzyme Q10; in Complex II, electrons from succinate in the tricarboxylic acid cycle pass to coenzyme Q10. Complex III then passes the electrons on to cytochrome c, and Complex IV completes the chain, passing the electrons to O2, thereby reducing it to H2O. Finally, ATP is generated by the influx of these protons back into the mitochondrial matrix through ATP synthase (Complex V). The majority of physiological ROS production is generated from this electron transport system. Mitochondrial dysfunction possibly caused by genetic mutation and/or environmental stimuli provokes oxidative stress, and thus mitochondrial dysfunction may be associated with MSA pathogenesis [40].
MSA is classified into two subtypes depending on whether the initial symptoms are predominantly parkinsonian (MSA-P) or cerebellar (MSA-C). MSA is pathologically characterized by glial cytoplasmic inclusions (GCIs) and neuronal inclusions (NIs) containing abnormal aggregations of α-syn in several areas of the nervous system. In the brains of patients with MSA, α-syn aggregation in oligodendrocytes may cause myelin degeneration.
2.3. Distinction between MSA and Lewy Body Diseases
Since MSA (especially MSA-P subtype) shares many symptoms and signs with PD (e.g., parkinsonism, autonomic failure and REM sleep behavior disorder), it is often difficult to distinguish between them at an early stage even with recent diagnostic criteria [41,42]. Clinically, levodopa responsiveness is a supporting feature of PD while MSA is often unresponsive to levodopa [43,44]. MSA, PD, and other Lewy body diseases (LBD) form a group of synucleopathies characterized by pathologic aggregates of α-syn [45], mainly differing in the sites of α-syn aggregation in the brain. Glial cytoplasmic inclusions of α-syn are hallmarks of MSA while aggregates of α-syn in the perikarya and neurites of neurons are known as Lewy bodies and Lewy neurites, respectively, and are present in PD, PD with dementia and dementia with Lewy body [45,46]. Recently, accumulating evidence suggests the existence of distinct strains of α-syn, possibly because of genetic polymorphism or protein modification, and their association with different patterns of disease propagation and atrophic regions [47]. Interestingly, several studies have indicated that α-syn derived from GCIs of MSA has more potent activity than that from Lewy bodies of PD [47,48]. The diversity of seeding propensities of α-syn in different brain regions supports the notion of the clinical and morphological heterogeneity of MSA as well as clinical difference between MSA and PD/LBD [41,49]. In addition, different forms of α-syn aggregates may also affect the distinct pathogenesis and/or pathology between MSA and PD/LBD [50]. Interestingly, several studies have reported that an α-syn seeding assay using CSF, abdominal skin or olfactory mucosa of patients was able to detect α-synucleinopathies (see reference review [51] for details), which could be a valuable diagnostic tool in the future pending further studies and analysis.
3. Genes Associated with MSA Features
MSA (previously termed OPCA, SND and SDS) was primarily categorized into spinocerebellar degenerations (SCDs), which comprise a group of sporadic and hereditary NDs with lesions involving the cerebellum and spinal cord [51,52]. Among SCD subtypes, MSA has been recognized as a sporadic disease, and many of the dominantly inherited SCDs have been renamed spinocerebellar ataxia (SCA) [53]. Thus, MSA has not generally been considered a genetic disease. However, a few familial cases of MSA have recently been reported, and genomic analysis of these cases revealed that MSA is transmitted in an autosomal dominant or recessive inheritance pattern in some pedigrees (Table 1). The gene encoding α-syn (SNCA) is one of the candidate genes for causing MSA. A study of a British family with an SNCA variant revealed the neuropathological hallmarks of both MSA and PD with autosomal dominant parkinsonism [54]. In addition, a Finnish family with another SNCA variant showed neuropathological findings comparable with both PD and MSA, although the possibility that the two diseases may coexist cannot be excluded [14].
Unexpectedly, several studies identified recessive mutations of the gene encoding 4-hydroxybenzoate polyprenyltransferase (COQ2) in several unrelated Japanese families with MSA [9,55]. In addition, functionally impaired COQ2 variants were shown to be associated with sporadic MSA in a Japanese population [9,55]. The COQ2 gene encodes an enzyme essential for the biosynthesis of coenzyme Q10 [56]. Coenzyme Q10, in turn, plays a crucial role in mitochondrial electron transport; it transfers electrons from complex I and II to complex III as described in Section 2.2, and deficiencies in the transfer cause mitochondrial dysfunction and oxidative stress [57]. Moreover, it has been reported that cerebellar and plasma levels of coenzyme Q10 were lower, and the mitochondrial dysfunction and oxidative stress levels higher, in MSA cases compared to controls, indicating that COQ2 and MSA are strongly associated [58,59]. Although several reports attempting to identify a COQ2 mutation in patients with MSA have failed in this effort [11,60,61], mitochondrial dysfunction and/or oxidative stress in the brains of patients with MSA could play a role in MSA etiology. In addition, a recent study reported that, in rare cases, COQ2 variants are related to the onset of familial PD, suggesting that COQ2 variants might share similar pathways and be involved in induction of the phenotype of PD or parkinsonism [62].
Genes associated with other NDs, such as microtubule associated protein tau gene (MAPT), leucine-rich repeat kinase 2 (LRRK2), β-glucocerebrosidase (GBA1), TATA-box binding protein gene (TBP), coiled-coil-helix-coiled-coil-helix domain containing 2 (CHCHD2) and chromosome 9 open reading frame 72 (C9orf72), might be involved in the MSA pathogenesis [63,64,65,66,67,68], but more research is required to determine whether these genes have specific association with MSA pathology.

Table 1.
List of genes that are mutated and/or altered in MSA.
| Gene Name | Encoding Protein | Physiological Function | Pathology | Related NDs [69] |
|---|---|---|---|---|
| SNCA | α-synuclein | regulation of synaptic vesicles and neurotransmitter release | inclusion formation | PD, LBD |
| COQ2 | polyprenyl transferase | catalyzing coenzyme Q10 biosynthesis | coenzyme Q10 deficiency, followed by mitochondrial dysfunction | PD |
| MAPT | microtubule-associated protein tau | formation and stabilization of axonal microtubules | tau accumulation | AD, FTD, PD |
| LRRK2 | leucine rich-repeat kinase 2 | involved in neuronal plasticity, autophagy, and vesicle trafficking | associated with pathologies of α-syn | PD |
| GBA1 | β-glucocerebrosidase | hydrolysis of glucosylceramide and glucosylsphingosine | α-syn accumulation | AD, FTD, PD |
| TBP | TATA-box binding protein | component of the eukaryotic transcription initiation machinery | formation of aggregates | PD, HD |
| CHCHD2 | coiled-coil-helix-coiled-coil-helix domain containing 2 | regulating electron flow in the mitochondrial electron transport chain | mitochondrial dysfunction | AD, FTD, PD, ALS, |
| c9orf72 | chromosome 9 open reading frame 72 | regulation of autophagy and vesicular trafficking | formation of aggregates | FTD, ALS |
| ASCT1 | alanine/serine/cysteine/threonine transporter 1 | uptake of neutral amino acids | enhanced oxidative stress | No data |
| EAAC1 | excitatory amino acid carrier 1 | cysteine uptake | GSH depletion, followed by oxidative stress | No data |
| TauT | taurine transporter | taurine uptake | taurine depletion, followed by oxidative stress | No data |
| NOVA1 | neuro-oncological ventral antigen-1 | alternative splicing, involved in the formation and activity of the synapses | autoantigen in paraneoplastic opsoclonus myoclonus ataxia | No data |
| Oct1 | organic cation transporter1 | Translocation of organic cations across the blood–brain barrier | unknown | No data |
Abbreviations: AD; Alzheimer’s disease, FTD; Frontotemporal dementia, PD; Parkinson’s disease, LBD; Lewy body disease, HD; Huntington’s disease.
4. The Association between GSH Dysregulation and MSA
The fact that mutations of COQ2, which is an important factor for regulating redox states, were found in specific populations of patients with MSA [70] suggests that oxidative stress in the brain is associated with the cause or progress of the disease. The brain might be inherently more vulnerable to oxidative damage due toROS, since the brain consumes more oxygen to produce energy—and consequently generates higher levels of toxic ROS—compared to other organs [71]. In addition, the brain contains an abundance of lipids with unsaturated fatty acids that act as a source of peroxidation [72]. Both features indicate the importance of neuroprotective antioxidants in the context of MSA and other NDs.
4.1. GSH Levels in Patients with MSA
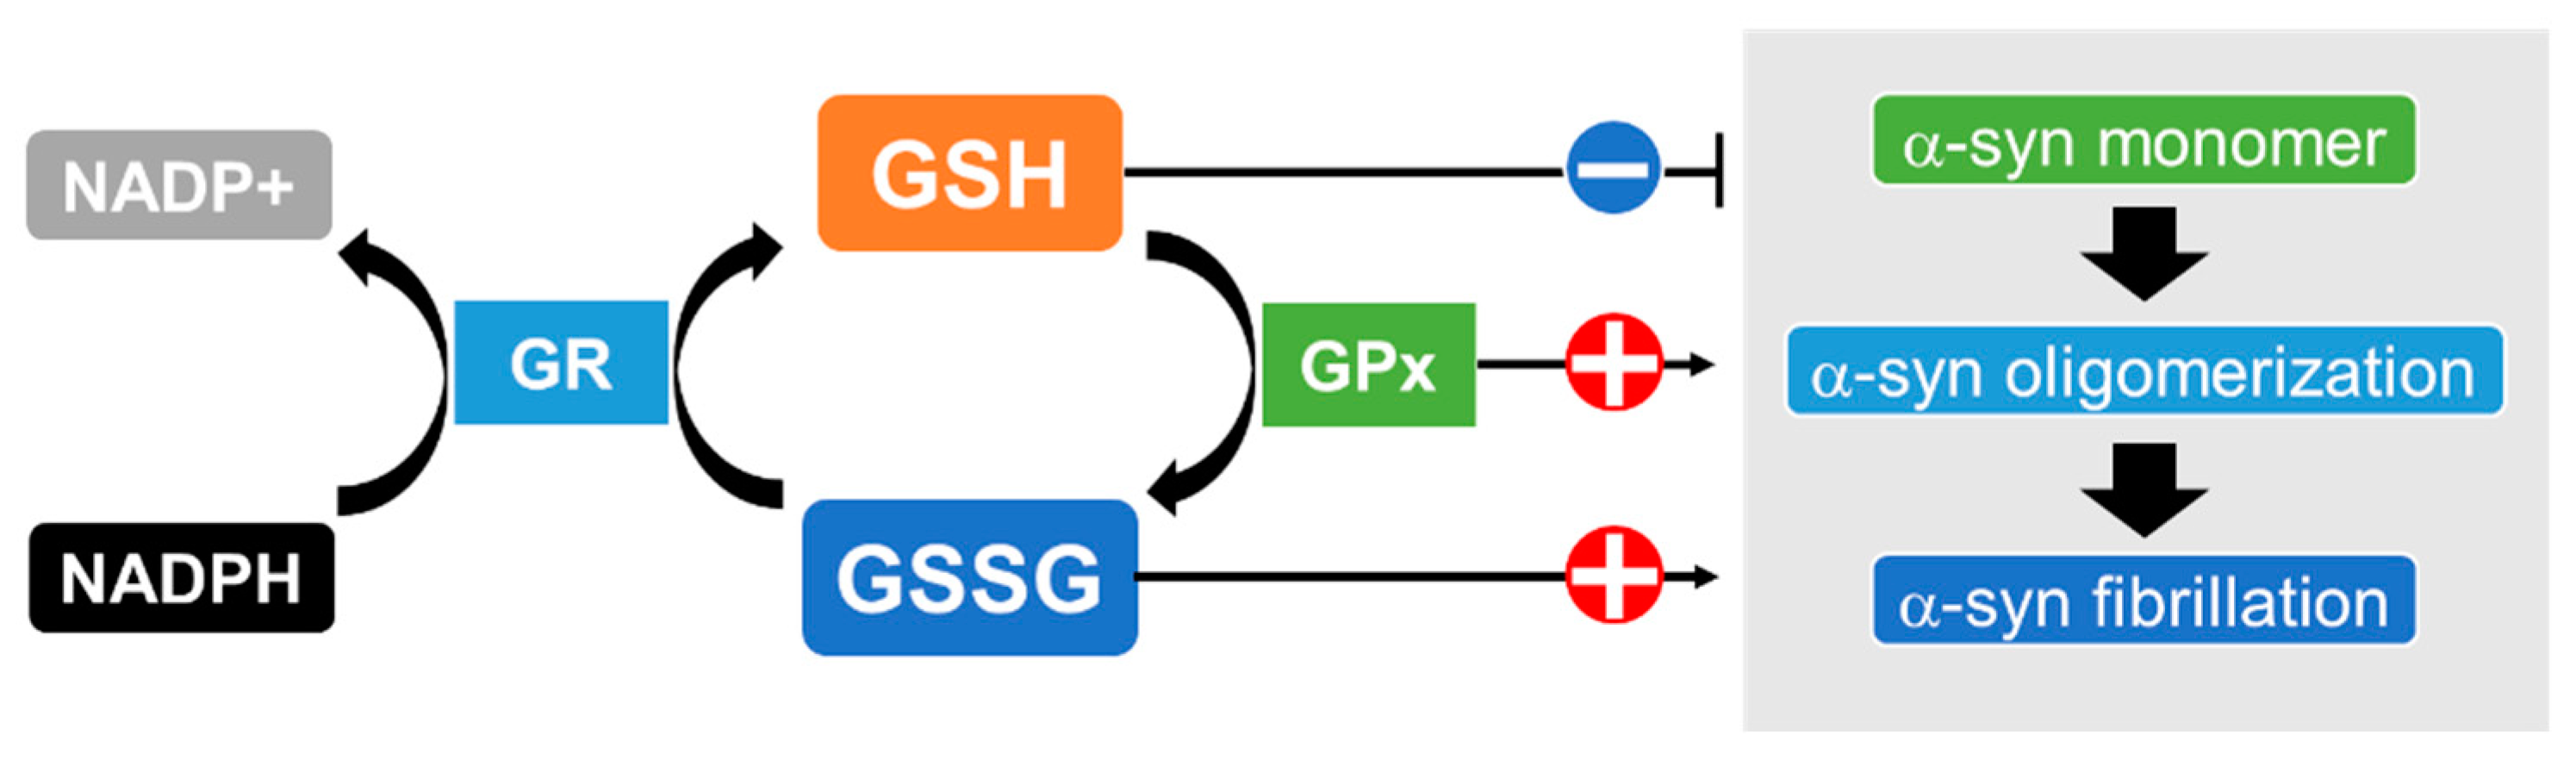
GSH is one of the most effective antioxidants against oxidative stress in the brain [73]; other antioxidants, such as catalase, superoxide dismutase (SOD) and glutathione peroxidase (GPx), are present but expressed at lower levels there [74,75]. GSH detoxifies all types of ROS, including superoxide anions (O2−), hydroxyl radicals (•OH), hydroperoxyl radicals (HO2•) and hydrogen peroxide (H2O2), and also acts as an electron donor, resulting in disulfide bond formation to produce oxidized glutathione (GSSG) [76]. GSSG is a substrate of the flavoenzyme glutathione reductase (GR), which transfers an electron from nicotinamide adenine dinucleotide phosphate (NADPH) to GSSG, thereby regenerating GSH and constituting a system for recycling GSH [77]. A trend of decreased levels of nigral GSH has been reported in the postmortem brains of patients with MSA compared to healthy controls, although the difference did not reach statistical significance [78,79]. Another report found a lower ratio of reduced GSH to oxidized GSSG, an index of oxidative stress, in the substantia nigra of patients with MSA, although, the change was not statistically significant [80]. These reports suggest that a decline in GSH exacerbates oxidative stress in the brains of MSA patients. Interestingly, in vitro experiments showed that the amyloid formation of α-syn was significantly facilitated by GSSG while GSH suppressed aggregation [81]. Furthermore, several studies have shown that increased intracellular GSH levels partially alleviated α-syn oligomerization and its cytotoxicity [82,83,84]. These results suggest that GSH depletion followed by oxidative stress promotes the pathological fibrillation of α-syn (Figure 2).
The states of α-synuclein (α-syn) may depend on the redox states of glutathione, which are regulated by glutathione reductase (GR) and glutathione peroxidase (GPx). GR transfers an electron from nicotinamide adenine dinucleotide phosphate (NADPH) to GSSG and thereby catalyzes the reduction of GSSG to GSH. GPx reduces peroxide to a harmless compound by gathering the needed reducing equivalents from GSH. The aggregation ofα-syn is suppressed by ample GSH while the amyloid formation of α-syn is facilitated by GSSG. In addition, GPx markedly enhances the fibrillation of α-syn.
4.2. Possible Association of the Enzymes for GSH Synthesis and Metabolism with MSA
Synthesized GSH has been shown to react non-enzymatically with ROS or to function as an electron donor for the reduction of peroxides in the GPx reaction [85]. The formation of a disulfide bond between two GSH molecules gives rise to GSSG during this process. In a 1986 report, there were no significant alterations in GPx activity in the autopsied brains of patients with SND compared to healthy controls, suggesting that neuronal cell loss is unlikely to result from reduced activity of brain GPx [86]. However, there has been a report showing that α-syn enhanced in vitro GPx activity which in turn markedly enhanced fibrillation of α-syn [87]. Further studies at the cellular level are required to elucidate the role of GPx activity in the brains of patients with MSA.
Glutathione-S-transferases (GSTs) are a superfamily of phase 2 detoxification enzymes that detoxify both ROS and toxic xenobiotics, primarily by catalyzing GSH-dependent conjugation and redox reactions [88]. It has been reported that immunopositivity of GST in oligodendroglial inclusions did not show topographical linkage to neuronal degeneration [89]. In addition, a PubMed search revealed no studies showing dysregulation of the enzymes related to GSH synthesis and metabolism in the brains of patients with MSA. However, since the number of studies describing the physiological characteristics of MSA is still quite limited, further investigations are warranted to determine whether GSH and its related enzymes are dysregulated in the brains of patients with MSA.
4.3. Association between Transporters Related to GSH Biosynthesis and MSA
GSH is known to be ubiquitously distributed in many cells as a major non-protein thiol, which also functions as a storage and transport form of cysteine and an important player in antioxidative defense [90]. An excess amount of cysteine can be toxic to cells, because excess cysteine induces free radical generation and extracellular glutamate production [91,92]. Additionally, cysteine can impair mitochondrial respiration by limiting iron bioavailability through an oxidant-based mechanism [93].
GSH is a tripeptide composed of three amino acids: cysteine, glutamate, and glycine [73]. Among these amino acids, cysteine is the rate-limiting substrate for enzyme activity for GSH synthesis, because the other precursor amino acids, glutamate and glycine, have much higher intracellular concentrations than cysteine [90,94]. In agreement with these findings, it has been shown that GSH concentrations can only be elevated by increasing cytosolic cysteine availability [95]. The biosynthesis of GSH occurs via a two-step ATP-requiring enzymatic process that is catalyzed by glutamate-cysteine ligase (GCL; also known as γ-glutamylcysteine synthetase) and glutathione synthetase (GSS) [96,97]. GCL, which is composed of catalytic and modulatory subunits (GCLc and GCLm, respectively), catalyzes the formation of a dipeptide, γ-glutamylcysteine (γ-GluCys), from glutamate and cysteine, the rate-limiting step in GSH biosynthesis [96]. GSS is the critical enzyme for the second step in GSH biosynthesis, which couples γ-GluCys with glycine to generate GSH [97].
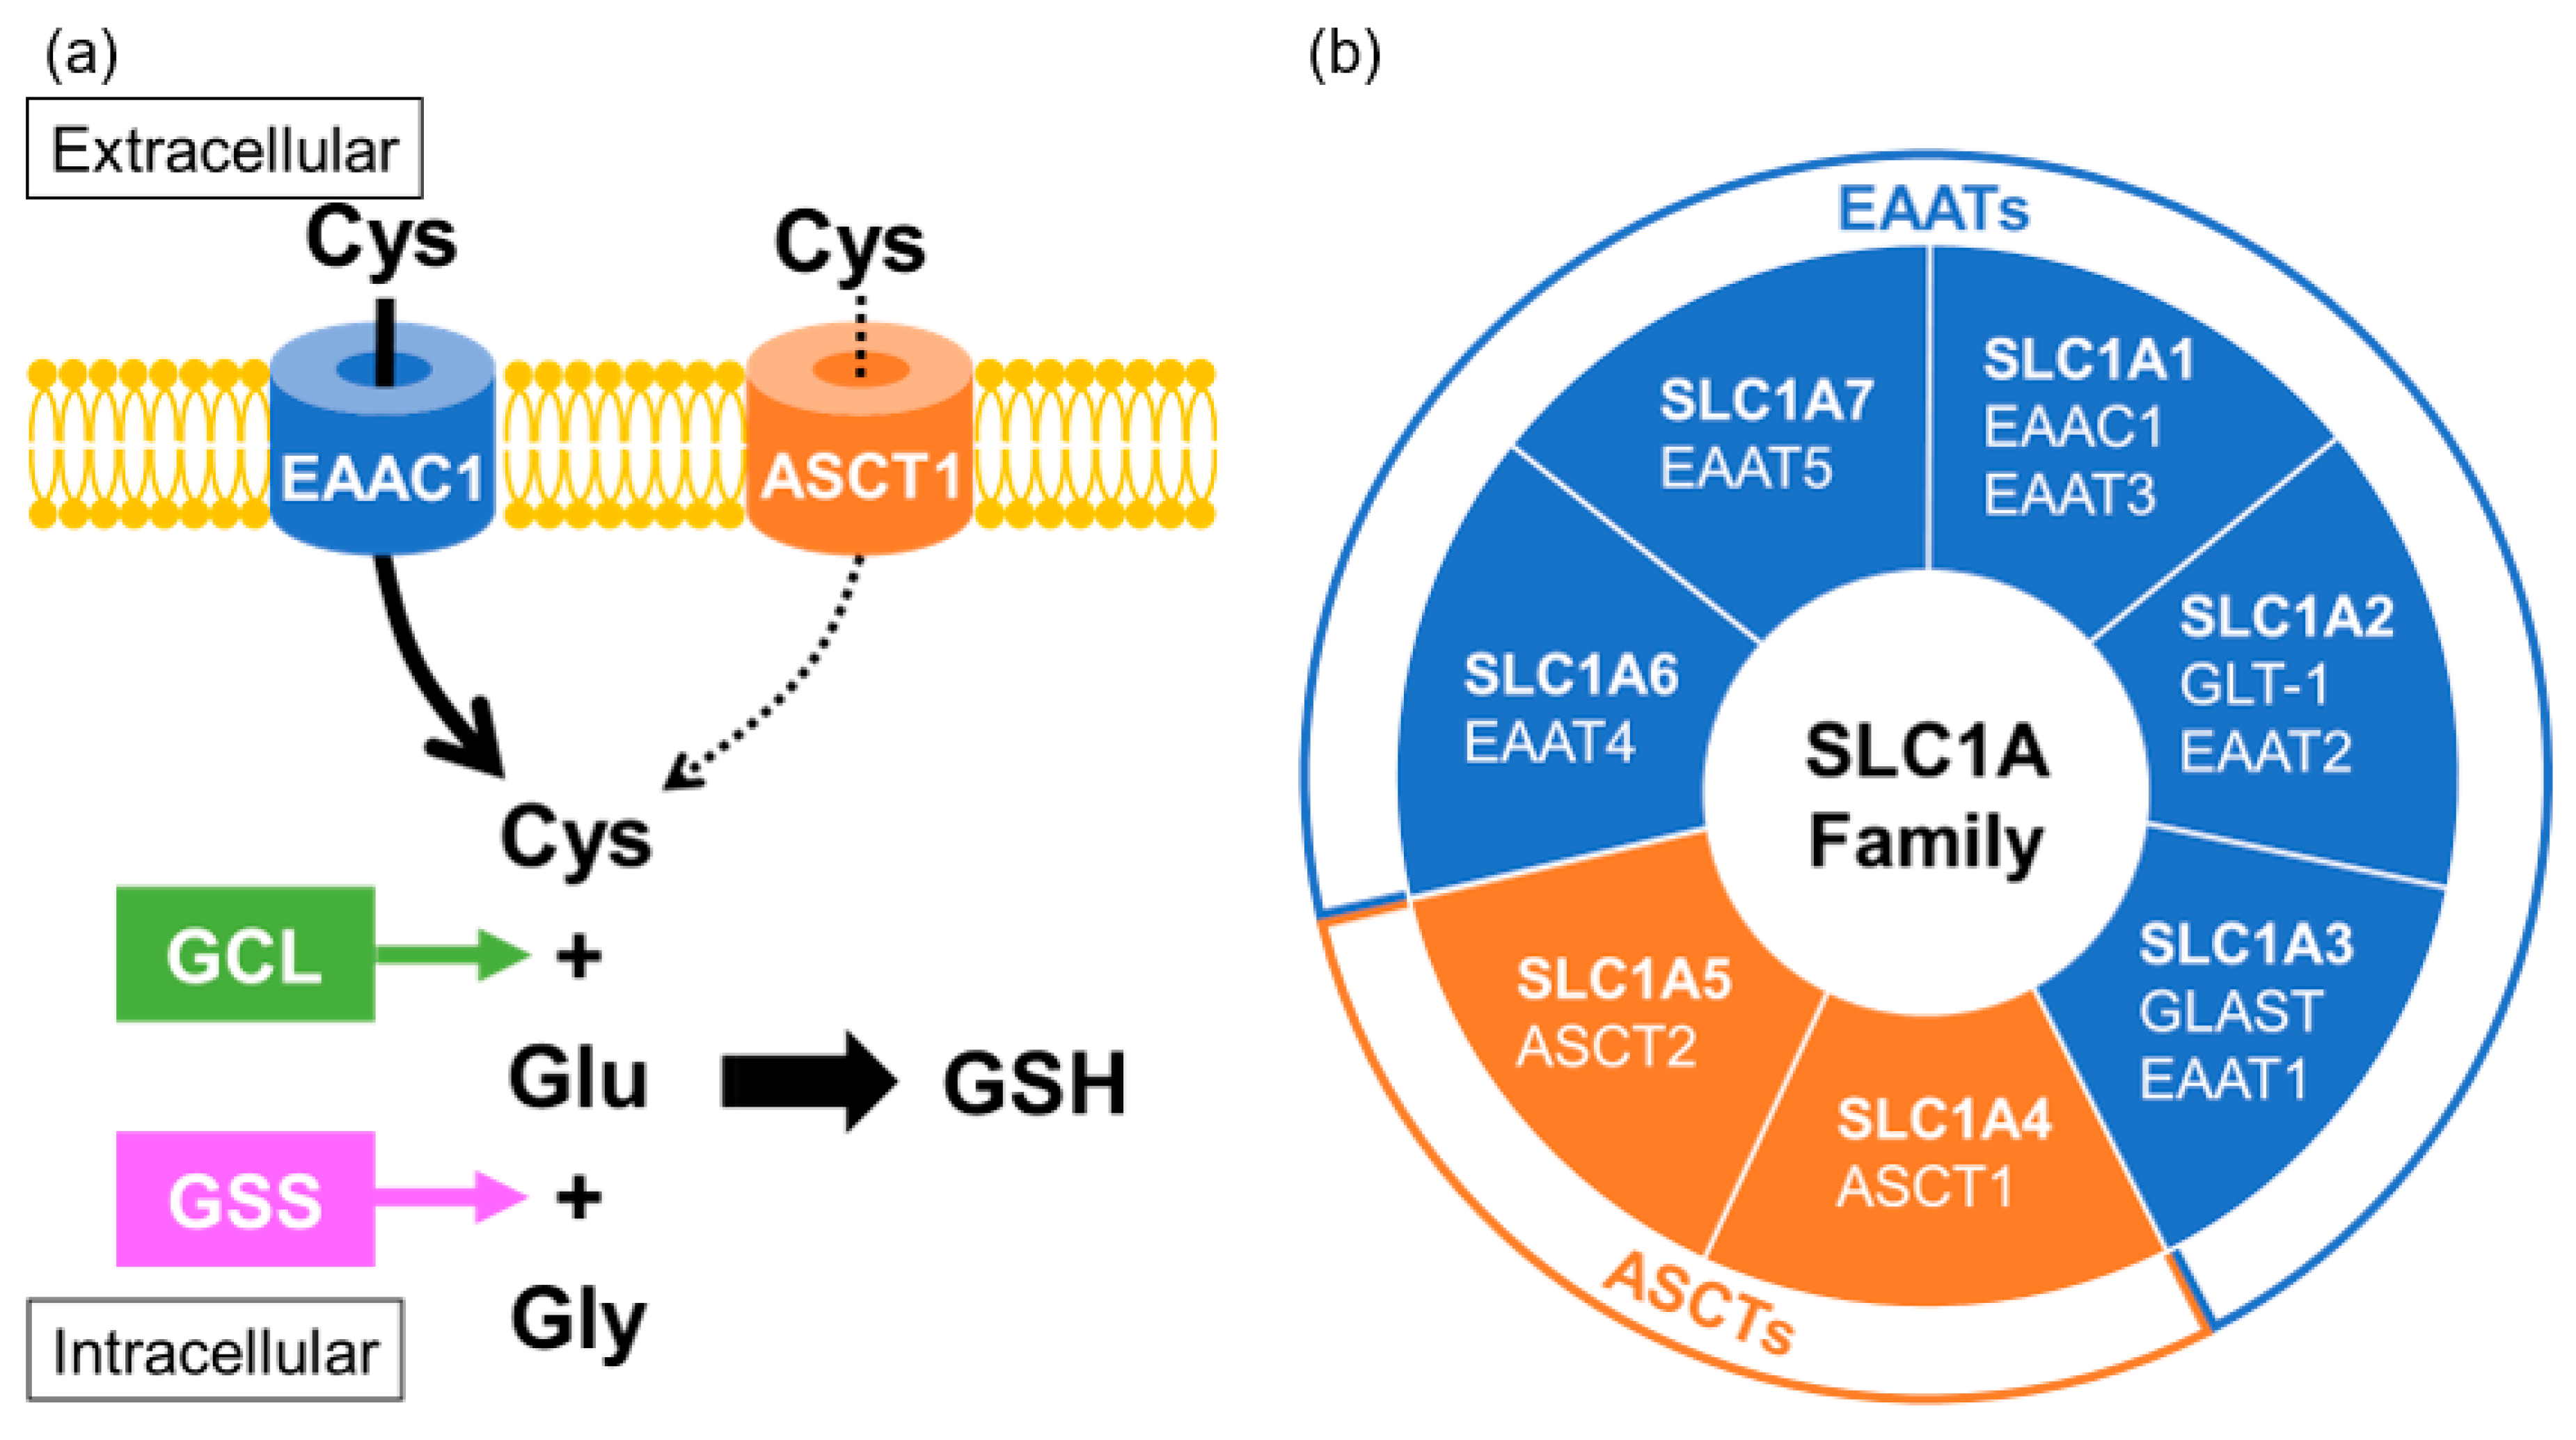
In neurons, cysteine uptake is mostly mediated through a neuronal sodium-dependent transporter known as excitatory amino acid carrier 1 (EAAC1; also known as EAAT3 or SLC1A1) [98]. EAAC1 is a member of the excitatory amino acid transporters (EAATs) that belong to the solute carrier family SLC1A. Acidic amino acid transport by the EAATs is coupled to the co-transport of three sodium ions and one proton, and the counter-transport of one potassium ion [99]. It has been reported that EAAC1 is expressed mainly in neurons and partially in subsets of oligodendrocytes, in immature oligodendrocytes, and in oligodendrocyte progenitor cells, but not expressed in mature astrocytes, in the brain [100]. EAAC1-deficient mice showed the age-dependent brain atrophy of both the hippocampal CA1 cell layer and the corpus callosum [101]. Interestingly, EAAC1 has been found to be downregulated in the postmortem brains of patients with MSA and in an animal model of MSA [18]. Alanine-serine-cysteine transporters (ASCTs) are also included among the SLC1A family members, which share sequence homology with the EAATs, and transport the neutral amino acids serine, alanine and cysteine [102]. ASCTs have been shown to participate in an amino acid antiport cycle, in which the exchange of neutral amino acids between the extracellular and intracellular sides is coupled to the co-transport of sodium ions from the extracellular side, without involvement of potassium ions or protons. Cysteine might act as a substrate of ASCT1 (also known as SLC1A4), which is mainly distributed in the astrocytes but also partially localized in neurons. Since cysteine uptake for GSH biosynthesis is mainly mediated by EAAC1, the contribution of ASCT1 to GSH generation might be limited, but could possibly support the function of EAAC1 [103] (Figure 3). Polymorphism of ASCT1 has been confirmed in some pathological conditions characterized by alterations of brain development and function [104,105,106,107,108,109]. Indeed, a study investigating oxidative-stress gene in MSA found significant associations between MSA and polymorphisms of ASCT1 [110], suggesting that the function of ASCT1 in neurons and oligodendrocytes is important for the maintenance of redox states.
5. The Association of miRNA Dysregulation and MSA Pathology
Increasing lines of evidence suggest that over-expression or down-regulation of non-coding RNAs is involved in the onset and progression of NDs [111]. Among several kinds of non-coding RNAs, microRNAs (miRNAs) have been the most well-studied. Accumulating evidence indicates that several miRNAs are abnormally expressed in the serum, plasma, cerebrospinal fluid, cerebellum, pons, striatum, and frontal cortex of patients with MSA [18,112,113,114,115,116,117,118,119].
5.1. Molecular Mechanisms of miRNA Biogenesis
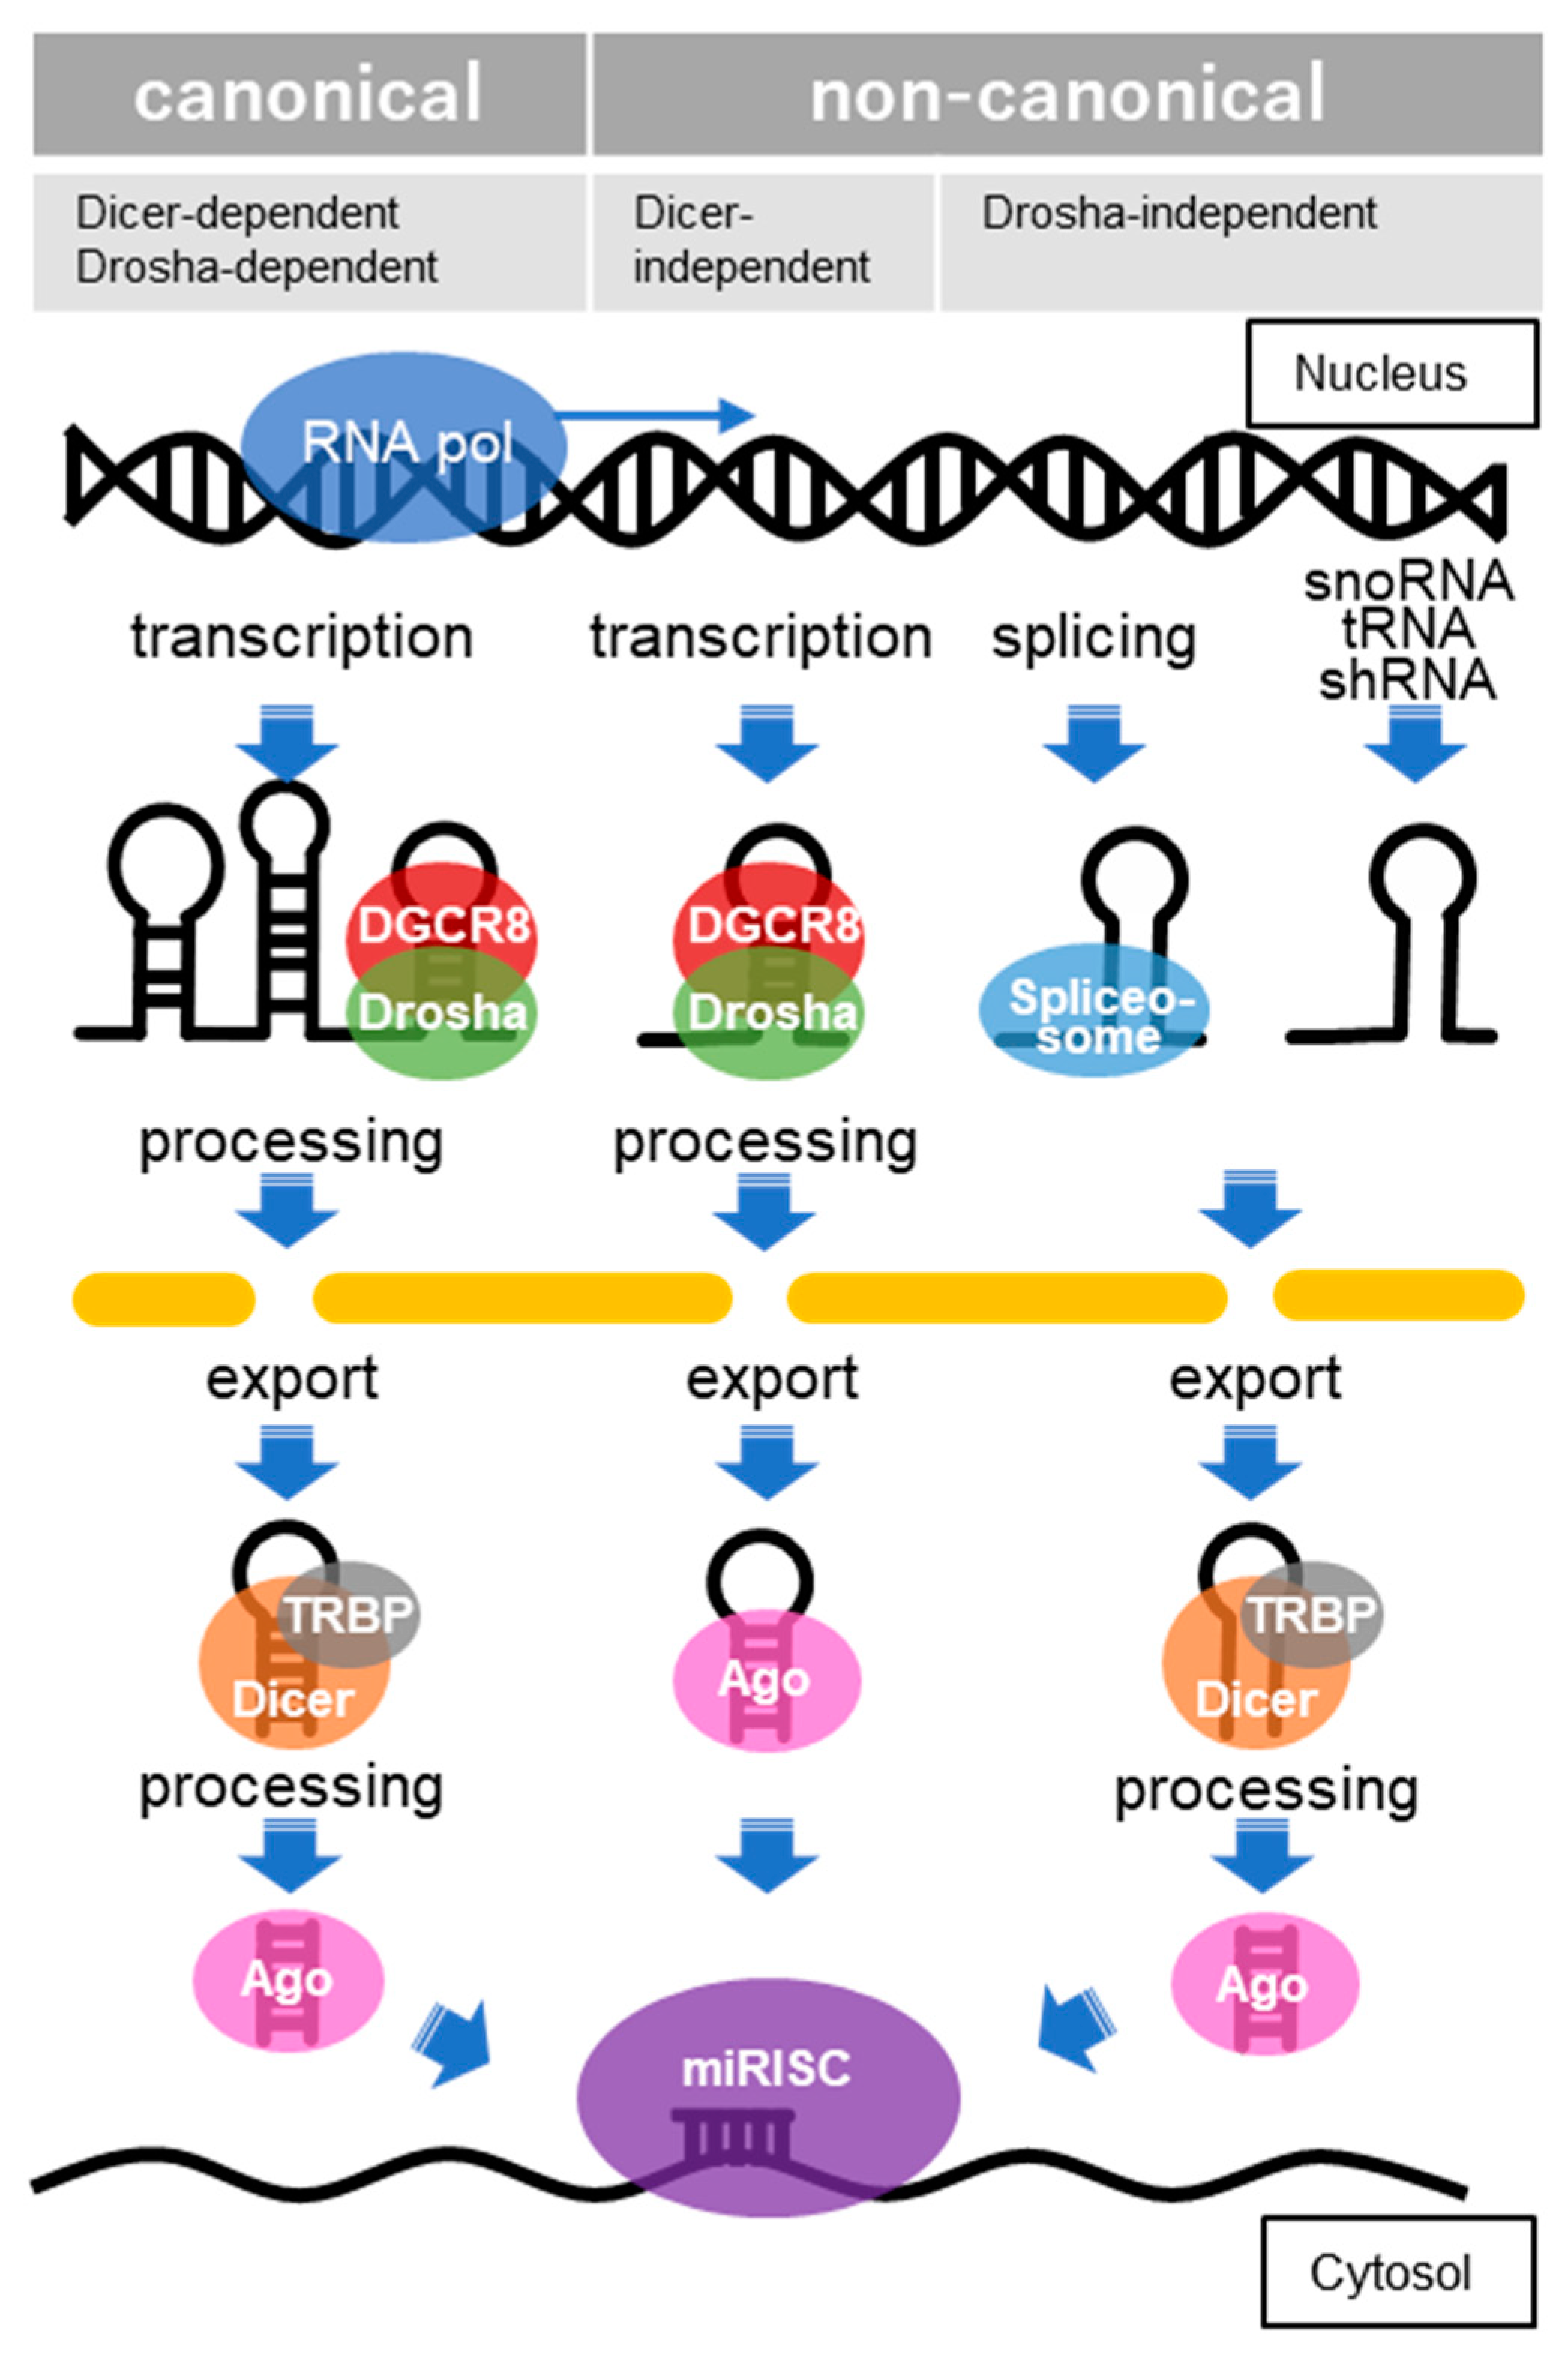
The function of miRNAs is basically to silence target gene expressions by binding to transcripts located mainly at the 3′-untranslated regions (3′-UTR), although there are also cases in which such silencing occurs by binding to transcripts in the 5′-UTR and coding region [120]. Clustered miRNAs can either be simultaneously transcribed from single polycistronic transcripts or independently transcribed. RNA polymerase II typically transcribes the primary miRNAs (pri-miRNAs), which are cleaved by a complex called a microprocessor consisting of an RNA-binding protein known as DiGeorge syndrome critical region 8 (DGCR8) and a ribonuclease III (RNase III) enzyme called Drosha [121]. DGCR8 recognizes an N6-methyladenylated GGAC and other motifs within the pri-miRNA, while Drosha cleaves the pri-miRNA duplex at the base of the characteristic hairpin structure of pri-miRNA [122]. The small, microprocessor-generated hairpin-shaped RNAs that form the 3′ overhang, called miRNA precursors (pre-miRNAs), are exported by exportin-5 in complex with RAN-GTP and are processed by a double-stranded RNase III enzyme termed Dicer, which is complexed with the trans-activation response RNA-binding protein (TRBP) [123]. The mature miRNA duplexes are loaded onto Argonaute (AGO) family proteins in an ATP-dependent manner to form an effector complex called the RNA-induced silencing complex (RISC) [124]. One strand of miRNA is then removed from the RISC to generate the mature RISC that induces gene silencing. In the earlier versions of miRBase, the removed strand of miRNA was called the “passenger” strand and represented as miRNA*. However, since it has been reported that miRNAs from the 5′ and 3′ arms of a pre-miRNA precursor both exist, these miRNAs are now represented as miRNA-5p and miRNA-3p, respectively. Post-transcriptional regulation by the RISC complex is mediated by incomplete base-paring of miRNA-mRNA interactions, likely due to the targeting of multiple transcripts, which contributes to the complexity or redundancy of miRNA systems. Recently, multiple non-canonical miRNA biogenesis pathways have been progressively identified, and have been grouped into Drosha/DGCR8-independent and Dicer-independent pathways [125] (Figure 4).
In the canonical pathway, miRNA biogenesis begins with the transcription of primary miRNAs (pri-miRNAs), which a microprocessor composed of DGCR8 and Drosha cleaves to generate miRNA precursors (pre-miRNAs), which are hairpin forms of small RNA. Pre-miRNAs are exported by exportin-5 in complex with RAN-GTP and processed by Dicer, complexed with TRBP. In the Dicer-independent pathways, after the pre-miRNA, processed by DGCR8/Drosha, is exported, it is further processed via AGO-dependent cleavage but is not cleaved by Dicer. In the Drosha/DGCR8-independent pathway, miRNAs derived from snoRNA, tRNA, shRNA, splicing and others are exported without processing and then processed by Dicer. Through these processes, the mature miRNA is combined with members of the AGO family of proteins to form miRNA-induced silencing complexes (miRISCs).
5.2. Dysregulation of Genes and miRNAs in Patients with MSA
The first study of the miRNA profiles in MSA cases in comparison with controls and in transgenic (tg) models of MSA compared with non-tg mice was reported in 2014, much later than the corresponding studies in NDs such as AD, PD and ALS [18]. The screening of dysregulated miRNAs in both humans and animal models of MSA revealed that miR-96 is upregulated in these cases (probably miR-96-5p, since miR-96-3p was displayed as miR-96* in the earlier version of miRBase), resulting in downregulation of EAAC1 and a taurine transporter (TauT, also known as SLC6A6), another solute carrier family protein [18]. These proteins are particularly colocalized in neuronal and glial cells neighboring the α-syn-positive oligodendrocytes. Interestingly, we have shown that administration of an miR-96-5p inhibitor to the mouse brain improves neuroprotection against oxidative stress via upregulation of EAAC1 and the resulting increase in GSH levels [126,127]. In addition, several reports have shown that miR-96-5p expression is upregulated in the serum, striatum, and frontal cortex of MSA patients [18,128,129]. Moreover, the administration of FTY720-Mitoxy, which is known to increase the expression of neurotrophic factors in oligodendrocytes, reduced the expression of miR-96-5p in an MSA-mimicking mouse model [130]. These results suggest that agents that increase GSH levels in the brain and thereby manipulate miR-96-5p levels might be used to ameliorate the symptoms of MSA.
Another report has shown that both miR-339-5p and miR-96-5p are increased in the serum of patients with MSA [128]. In that study, miR-339-5p was shown to target strong mRNA-miRNA interactions with the RNA-binding protein neuro-oncological ventral antigen-1 (NOVA1). Interestingly, we have shown that NOVA1 regulates EAAC1 expression via glutamate transport-associated protein 3–18 (GTRAP3-18), which is an endoplasmic reticulum (ER)-localized protein and negative regulator of EAAC1, by trapping EAAC1 in the ER [127]. NOVA1 is also directly regulated by miR-96-5p, suggesting that the cysteine uptake system for GSH biosynthesis is impaired in patients with MSA.
There is another report that miR-202 (probably miR-202-3p, since miR-202-5p was displayed as miR-202* in the earlier version of miRBase) is upregulated in the cerebellums of patients with MSA, in correlation with reductions in the expression of the organic cation uptake transporter (Oct1, encoded by SLC22A1) [117]. Oct1 is known to regulate numerous target genes related to cellular stress. Deficiency in Oct1 expression results in hypersensitivity to hydrogen peroxide, which in turn elevates ROS levels. In the brain, Oct1 is expressed in the endothelial cells that form the blood–brain barrier (BBB) and may be involved in translocation of organic cations across the BBB in both directions [131]. The upregulation of miR-202-3p accompanied by a low level of Oct1 has been detected in the MSA cerebellum, which could result in decreased resistance of neurons to oxidative damage and subsequent cerebellar disease. Moreover, miR-202-3p has been reported to be linked to mitochondrial dysfunction, suggesting that increasing oxidative stress by miR-202-3p dysfunction contributes to the pathology of MSA [132].
Furthermore, miR-101 (probably miR-101-3p, since miR-101-5p was displayed as miR-101* in the earlier version of miRBase) has been observed to be upregulated in the striatum of MSA patients compared to controls [129]. Overexpression of miR-101-3p in an oligodendroglial cell line inhibited autophagy by altering the expression of autophagy-related genes that promote α-syn accumulation. In addition, we previously showed that EAAC1 expression is negatively regulated by miR-101-3p in a direct manner [126]. Interestingly, lentiviral delivery of an anti-miR-101-3p construct has been shown to reduce α-syn-induced autophagy deficits in a mouse model of MSA, indicating that anti-miR-101-3p is a promising therapeutic agent for MSA [129].
5.3. Candidate miRNA Biomarkers for MSA
Several studies have used miRNA microarrays to elucidate the profile of miRNA in patients with MSA, revealing the dysregulation of several miRNAs, some of which overlapped across the studies [133,134,135] (Table 2). The most frequently reported miRNA to be dysregulated in MSA patients (6 reports) was miR-24-3p, which has also been reported to be dysregulated in AD and PD [136,137]. It has also been shown that inhibition of the miR-24-3p “sponge”, CircRtn4—one of the CircularRNAs, decreased ROS levels concomitant with increases in SOD and GSH levels [138]. In addition, miR-24-3p was also detected as a possible regulator of GPx3 in response to oxidative stress and related pathologies [139]. Four independent miRNA microarrays revealed several dysregulated miRNAs in MSA patients: miR-19b-3p, miR-25-3p and miR-92a-3p [18,112,113,114,115,119]. miR-19b-3p has been reported as a biomarker of PD in several studies [140,141]. Interestingly, both miR-25-3p and miR-19b-3p have been detected in the serum of patients with an isolated form of REM sleep behavior disorder, representing the prodromal state of the α-synucleinopathies, suggesting that these miRNAs could be potential prognostic biomarkers for α-synucleinopathies [142]. miR-92a-3p has been reported as a dysregulated miRNA in ALS [143,144]. miR-92a-3p has repeatedly been reported in connection to oxidative stress and could be a regulator of GPx3 [139,145]. Further investigation will be needed to clarify the functions of these miRNAs and whether they might have potential as either biomarkers or therapeutic agents for MSA.
6. Prospective for Diagnosis and Treatment of NDs including MSA
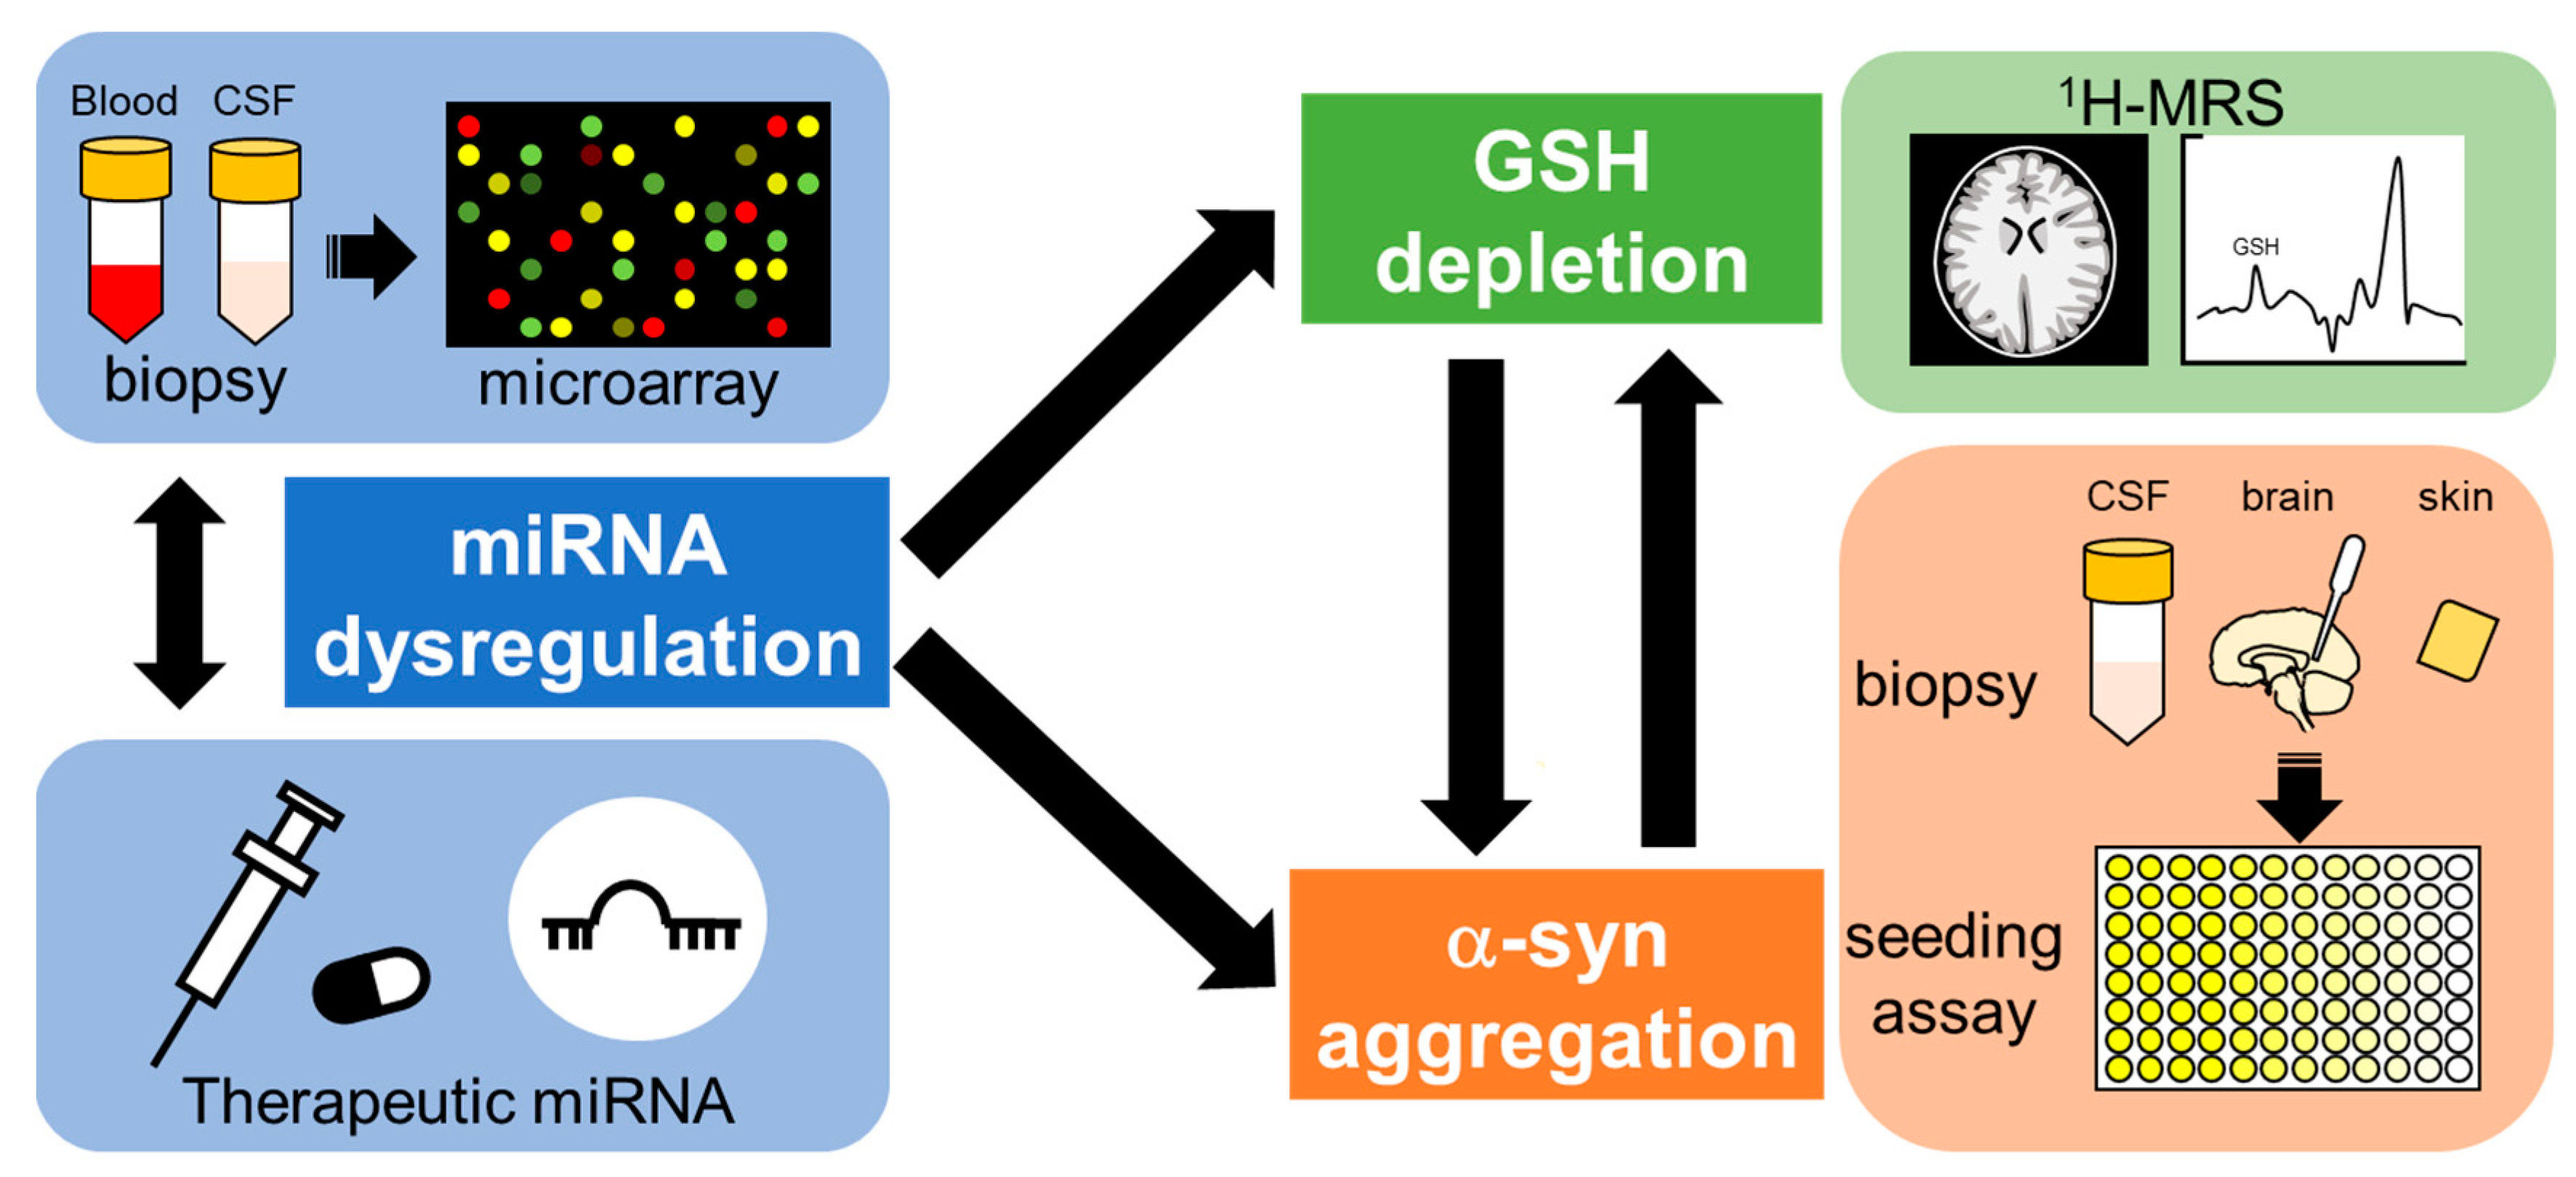
Since no NDs, including MSA, are currently curable, radically different approaches for diagnosis and treatment are needed (Figure 5). One of the important targets for the treatment of NDs is early detection, as it may be too late to start treatment after symptoms emerge and/or α-syn deposition appears [146,147,148]. Understanding the precise mechanisms of pathogenesis and early pathological features should contribute to therapeutics of NDs in the future. One of the candidate markers for early detection of NDs is GSH levels, as decreases in specific brain areas of patients with NDs have been reported in several clinical studies, and this decline seems to occur at very early stages of the disease [79,90,149]. A recent advance in the field of proton magnetic resonance spectroscopy (1H-MRS) enables the measurement of in vivo GSH levels with a non-invasive technique for brain metabolite quantification [26]. According to recent clinical studies, GSH levels in the blood as well as specific areas of the brain measured by 1H-MRS were significantly decreased in patients with AD and mild cognitive impairment, considered early-stage AD, compared to those of healthy older-age controls [23,150,151,152]. In addition, GSH reduction rates in the frontal cortex of patients with AD were correlated with decline in cognitive functions [153]. GSH levels in the brains of ALS patients were also decreased compared to those of age-matched healthy volunteers, and the decreased GSH levels in the motor cortex and corticospinal tract were inversely correlated with disease duration or time since diagnosis [154,155]. Because the aggregation and fibrillation of α-syn seems to be promoted by GSH depletion as described in Section 4.1, the detection of α-syn forms in the brain could be a biomarker for disease progression. The new method described in Section 2.3 for diagnosing α-synucleinopathies has emerged and shows tremendous promise for advancing the clinical field. In particular, the detection of seeding properties for α-syn could be a useful tool for differential diagnosis of MSA, PD and other α-synucleinopathies, possibly for evaluating disease progress and even predicting the areas of the brain likely to be affected. Considering that the genes essential for GSH biosynthesis and α-syn formation are regulated by several miRNAs, and miRNA dysregulation is linked to NDs, the detection of abnormal miRNA expressions could also be a powerful tool for early diagnosis of NDs [20,156]. As described in Section 5.2, manipulation of miRNA expression before GSH decline and/or α-syn aggregation could provide prophylactic therapy beyond the symptom-limited therapeutic agents for NDs.
Circulating miRNAs could be useful markers for the detection of MSA at a very early stage. In addition, it may be possible to modify miRNAs before GSH decline and α-syn fibrillation, which seem to occur at early stages of disease, such that disease onset might even be blocked. It is known that miRNAs regulate the expression of genes related to α-syn formation and GSH synthesis. Recent advances in proton magnetic resonance spectroscopy (1H-MRS) technology have made it possible to detect GSH decline at an early stage of NDs. In addition, an α-syn seeding assay with biopsy samples of patients’ CSF, skin and other peripheral tissue may offer differential diagnosis for early-stage MSA.
7. Conclusions
Since there are far fewer cases of MSA than other NDs, and because the clinical diagnosis of MSA has proven difficult, the number of MSA studies remains small. However, accumulating evidence has gradually uncovered the genes involved and clarified the mechanism of MSA pathogenesis. As in other NDs, the pathology appears to involve a complex combination of various factors. Further investigation into the dysregulation of oxidative stress-related genes via genetic mutation or dysregulated miRNAs would provide a powerful knowledge base for the potential development of therapeutic agents for MSA. Although many dysregulated miRNAs have been identified in patients with MSA, it is still unclear whether their abnormal expression is a cause, a consequence, or a compensatory mechanism. Regardless, miRNAs could be a powerful tool as biomarkers for the differential diagnosis of MSA. Further investigations will be needed to elucidate the association between MSA and dysfunction of various miRNA regulatory mechanisms and ultimately to develop novel therapeutic agents to address these issues.
Author Contributions
Conceptualization, C.K. and K.A.; writing, C.K.; database searching, C.K. and N.K.; supervision, K.A. All authors have read and agreed to the published version of the manuscript.
Funding
This research was supported by the Takeda Science Foundation.
Data Availability Statement
Not applicable.
Conflicts of Interest
The authors declare no conflict of interest.
References
- Fanciulli, A.; Wenning, G.K. Multiple-system atrophy. N. Engl. J. Med. 2015, 372, 249–263. [Google Scholar] [CrossRef] [PubMed]
- Palma, J.A.; Norcliffe-Kaufmann, L.; Kaufmann, H. Diagnosis of multiple system atrophy. Auton. Neurosci. Basic Clin. 2018, 211, 15–25. [Google Scholar] [CrossRef] [Green Version]
- Schweighauser, M.; Shi, Y.; Tarutani, A.; Kametani, F.; Murzin, A.G.; Ghetti, B.; Matsubara, T.; Tomita, T.; Ando, T.; Hasegawa, K.; et al. Structures of α-synuclein filaments from multiple system atrophy. Nature 2020, 585, 464–469. [Google Scholar] [CrossRef] [PubMed]
- Jellinger, K.A. Multiple System Atrophy: An Oligodendroglioneural Synucleinopathy1. J. Alzheimer’s Dis. JAD 2018, 62, 1141–1179. [Google Scholar] [CrossRef] [PubMed] [Green Version]
- Kaji, S.; Maki, T.; Ishimoto, T.; Yamakado, H.; Takahashi, R. Insights into the pathogenesis of multiple system atrophy: Focus on glial cytoplasmic inclusions. Transl. Neurodegener. 2020, 9, 7. [Google Scholar] [CrossRef] [Green Version]
- Mészáros, L.; Hoffmann, A.; Wihan, J.; Winkler, J. Current Symptomatic and Disease-Modifying Treatments in Multiple System Atrophy. Int. J. Mol. Sci. 2020, 21, 2775. [Google Scholar] [CrossRef] [Green Version]
- Marmion, D.J.; Peelaerts, W.; Kordower, J.H. A historical review of multiple system atrophy with a critical appraisal of cellular and animal models. J. Neural Transm. 2021, 128, 1507–1527. [Google Scholar] [CrossRef] [PubMed]
- Watanabe, H.; Saito, Y.; Terao, S.; Ando, T.; Kachi, T.; Mukai, E.; Aiba, I.; Abe, Y.; Tamakoshi, A.; Doyu, M.; et al. Progression and prognosis in multiple system atrophy: An analysis of 230 Japanese patients. Brain A J. Neurol. 2002, 125, 1070–1083. [Google Scholar] [CrossRef]
- Multiple-System Atrophy Research Collaboration. Mutations in COQ2 in Familial and Sporadic Multiple-System Atrophy. N. Engl. J. Med. 2013, 369, 233–244. [Google Scholar] [CrossRef]
- Ogaki, K.; Fujioka, S.; Heckman, M.G.; Rayaprolu, S.; Soto-Ortolaza, A.I.; Labbé, C.; Walton, R.L.; Lorenzo-Betancor, O.; Wang, X.; Asmann, Y.; et al. Analysis of COQ2 gene in multiple system atrophy. Mol. Neurodegener. 2014, 9, 44. [Google Scholar] [CrossRef]
- Quinzii, C.M.; Hirano, M.; DiMauro, S. Mutant COQ2 in multiple-system atrophy. N. Engl. J. Med. 2014, 371, 81–82. [Google Scholar] [CrossRef] [PubMed] [Green Version]
- Lin, C.H.; Tan, E.K.; Yang, C.C.; Yi, Z.; Wu, R.M. COQ2 gene variants associate with cerebellar subtype of multiple system atrophy in Chinese. Mov. Disord. Off. J. Mov. Disord. Soc. 2015, 30, 436–437. [Google Scholar] [CrossRef] [PubMed]
- Zhao, Q.; Yang, X.; Tian, S.; An, R.; Zheng, J.; Xu, Y. Association of the COQ2 V393A variant with risk of multiple system atrophy in East Asians: A case-control study and meta-analysis of the literature. Neurol. Sci. Off. J. Ital. Neurol. Soc. Ital. Soc. Clin. Neurophysiol. 2016, 37, 423–430. [Google Scholar] [CrossRef] [PubMed]
- Pasanen, P.; Myllykangas, L.; Siitonen, M.; Raunio, A.; Kaakkola, S.; Lyytinen, J.; Tienari, P.J.; Pöyhönen, M.; Paetau, A. Novel α-synuclein mutation A53E associated with atypical multiple system atrophy and Parkinson’s disease-type pathology. Neurobiol. Aging 2014, 35, e2181–e2185. [Google Scholar] [CrossRef]
- Danka Mohammed, C.P.; Park, J.S.; Nam, H.G.; Kim, K. MicroRNAs in brain aging. Mech. Ageing Dev. 2017, 168, 3–9. [Google Scholar] [CrossRef] [PubMed]
- Kinoshita, C.; Aoyama, K.; Nakaki, T. microRNA as a new agent for regulating neuronal glutathione synthesis and metabolism. AIMS Mol. Sci. 2015, 2, 124–143. [Google Scholar] [CrossRef]
- Kinoshita, C.; Kubota, N.; Aoyama, K. Interplay of RNA-Binding Proteins and microRNAs in Neurodegenerative Diseases. Int. J. Mol. Sci. 2021, 22, 5292. [Google Scholar] [CrossRef]
- Ubhi, K.; Rockenstein, E.; Kragh, C.; Inglis, C.; Spencer, B.; Michael, S.; Mante, M.; Adame, A.; Galasko, D.; Masliah, E. Widespread microRNA dysregulation in multiple system atrophy—Disease-related alteration in miR-96. Eur. J. Neurosci. 2014, 39, 1026–1041. [Google Scholar] [CrossRef] [Green Version]
- Singh, A.; Kukreti, R.; Saso, L.; Kukreti, S. Oxidative Stress: A Key Modulator in Neurodegenerative Diseases. Molecules 2019, 24, 1583. [Google Scholar] [CrossRef] [Green Version]
- Shukla, D.; Mandal, P.K.; Mishra, R.; Punjabi, K.; Dwivedi, D.; Tripathi, M.; Badhautia, V. Hippocampal Glutathione Depletion and pH Increment in Alzheimer’s Disease: An in vivo MRS Study. J. Alzheimer’s Dis. JAD 2021, 84, 1139–1152. [Google Scholar] [CrossRef]
- Mandal, P.K.; Dwivedi, D.; Shukla, D.; Samkaria, A.; Roy, R.G.; Arora, Y.; Jindal, K. Interplay Between Hippocampal Glutathione Depletion and pH Increment in Alzheimer’s Disease. J. Alzheimer’s Dis. JAD 2022, 88, 1–6. [Google Scholar] [CrossRef] [PubMed]
- Chiang, G.C.; Mao, X.; Kang, G.; Chang, E.; Pandya, S.; Vallabhajosula, S.; Isaacson, R.; Ravdin, L.D.; Shungu, D.C. Relationships among Cortical Glutathione Levels, Brain Amyloidosis, and Memory in Healthy Older Adults Investigated In Vivo with (1)H-MRS and Pittsburgh Compound-B PET. AJNR Am. J. Neuroradiol. 2017, 38, 1130–1137. [Google Scholar] [CrossRef] [PubMed] [Green Version]
- Jenner, P. Presymptomatic detection of Parkinson’s disease. Journal of neural transmission. Supplementum 1993, 40, 23–36. [Google Scholar]
- Pearce, R.K.B.; Owen, A.; Daniel, S.; Jenner, P.; Marsden, C.D. Alterations in the distribution of glutathione in the substantia nigra in Parkinson’s disease. J. Neural Transm. 1997, 104, 661–677. [Google Scholar] [CrossRef]
- Andronesi, O.C.; Nicholson, K.; Jafari-Khouzani, K.; Bogner, W.; Wang, J.; Chan, J.; Macklin, E.A.; Levine-Weinberg, M.; Breen, C.; Schwarzschild, M.A.; et al. Imaging Neurochemistry and Brain Structure Tracks Clinical Decline and Mechanisms of ALS in Patients. Front. Neurol. 2020, 11, 590573. [Google Scholar] [CrossRef]
- Chen, J.J.; Thiyagarajah, M.; Song, J.; Chen, C.; Herrmann, N.; Gallagher, D.; Rapoport, M.J.; Black, S.E.; Ramirez, J.; Andreazza, A.C.; et al. Altered central and blood glutathione in Alzheimer’s disease and mild cognitive impairment: A meta-analysis. Alzheimer’s Res. Ther. 2022, 14, 23. [Google Scholar] [CrossRef]
- Sofic, E.; Lange, K.W.; Jellinger, K.; Riederer, P. Reduced and oxidized glutathione in the substantia nigra of patients with Parkinson’s disease. Neurosci. Lett. 1992, 142, 128–130. [Google Scholar] [CrossRef]
- Fanciulli, A.; Stankovic, I.; Krismer, F.; Seppi, K.; Levin, J.; Wenning, G.K. Multiple system atrophy. Int. Rev. Neurobiol. 2019, 149, 137–192. [Google Scholar] [CrossRef]
- Graham, J.G.; Oppenheimer, D.R. Orthostatic hypotension and nicotine sensitivity in a case of multiple system atrophy. J. Neurol. Neurosurg. Psychiatry 1969, 32, 28–34. [Google Scholar] [CrossRef] [Green Version]
- Yoshida, M. Multiple system atrophy: Alpha-synuclein and neuronal degeneration. Neuropathol. Off. J. Jpn. Soc. Neuropathol. 2007, 27, 484–493. [Google Scholar] [CrossRef]
- Gilman, S.; Low, P.A.; Quinn, N.; Albanese, A.; Ben-Shlomo, Y.; Fowler, C.J.; Kaufmann, H.; Klockgether, T.; Lang, A.E.; Lantos, P.L.; et al. Consensus statement on the diagnosis of multiple system atrophy. J. Neurol. Sci. 1999, 163, 94–98. [Google Scholar] [CrossRef]
- Gilman, S.; Wenning, G.K.; Low, P.A.; Brooks, D.J.; Mathias, C.J.; Trojanowski, J.Q.; Wood, N.W.; Colosimo, C.; Dürr, A.; Fowler, C.J.; et al. Second consensus statement on the diagnosis of multiple system atrophy. Neurology 2008, 71, 670–676. [Google Scholar] [CrossRef]
- Woerman, A.L.; Watts, J.C.; Aoyagi, A.; Giles, K.; Middleton, L.T.; Prusiner, S.B. α-Synuclein: Multiple System Atrophy Prions. Cold Spring Harb. Perspect. Med. 2018, 8, a024588. [Google Scholar] [CrossRef]
- Lashuel, H.A.; Overk, C.R.; Oueslati, A.; Masliah, E. The many faces of α-synuclein: From structure and toxicity to therapeutic target. Nature reviews. Neuroscience 2013, 14, 38–48. [Google Scholar] [CrossRef] [Green Version]
- Pukaß, K.; Richter-Landsberg, C. Oxidative Stress Promotes Uptake, Accumulation, and Oligomerization of Extracellular α-Synuclein in Oligodendrocytes. J. Mol. Neurosci. 2014, 52, 339–352. [Google Scholar] [CrossRef]
- Jaganjac, M.; Milkovic, L.; Zarkovic, N.; Zarkovic, K. Oxidative stress and regeneration. Free. Radic. Biol. Med. 2022, 181, 154–165. [Google Scholar] [CrossRef] [PubMed]
- Johnson, J.; Mercado-Ayon, E.; Mercado-Ayon, Y.; Dong, Y.N.; Halawani, S.; Ngaba, L.; Lynch, D.R. Mitochondrial dysfunction in the development and progression of neurodegenerative diseases. Arch. Biochem. Biophys. 2021, 702, 108698. [Google Scholar] [CrossRef]
- Priesnitz, C.; Becker, T. Pathways to balance mitochondrial translation and protein import. Genes Dev. 2018, 32, 1285–1296. [Google Scholar] [CrossRef] [PubMed] [Green Version]
- Monzio Compagnoni, G.; Di Fonzo, A. Understanding the pathogenesis of multiple system atrophy: State of the art and future perspectives. Acta Neuropathol. Commun. 2019, 7, 113. [Google Scholar] [CrossRef] [PubMed] [Green Version]
- Stankovic, I.; Fanciulli, A.; Sidoroff, V.; Wenning, G.K. A Review on the Clinical Diagnosis of Multiple System Atrophy. Cerebellum 2022, 1–15. [Google Scholar] [CrossRef] [PubMed]
- Koga, S.; Aoki, N.; Uitti, R.J.; van Gerpen, J.A.; Cheshire, W.P.; Josephs, K.A.; Wszolek, Z.K.; Langston, J.W.; Dickson, D.W. When DLB, PD, and PSP masquerade as MSA. Neurology 2015, 85, 404. [Google Scholar] [CrossRef] [PubMed]
- Grossauer, A.; Sidoroff, V.; Heim, B.; Seppi, K. Symptomatic Care in Multiple System Atrophy: State of the Art. Cerebellum 2022, 1–14. [Google Scholar] [CrossRef] [PubMed]
- Fahn, S.; Oakes, D.; Shoulson, I.; Kieburtz, K.; Rudolph, A.; Lang, A.; Olanow, C.W.; Tanner, C.; Marek, K.; Parkinson Study Group. Levodopa and the Progression of Parkinson’s Disease. N. Engl. J. Med. 2004, 351, 2498–2508. [Google Scholar] [CrossRef] [PubMed]
- Koga, S.; Sekiya, H.; Kondru, N.; Ross, O.A.; Dickson, D.W. Neuropathology and molecular diagnosis of Synucleinopathies. Mol. Neurodegener. 2021, 16, 83. [Google Scholar] [CrossRef] [PubMed]
- Malfertheiner, K.; Stefanova, N.; Heras-Garvin, A. The Concept of α-Synuclein Strains and How Different Conformations May Explain Distinct Neurodegenerative Disorders. Front. Neurol. 2021, 12, 737195. [Google Scholar] [CrossRef]
- Martinez-Valbuena, I.; Visanji, N.P.; Kim, A.; Lau, H.H.C.; So, R.W.L.; Alshimemeri, S.; Gao, A.; Seidman, M.A.; Luquin, M.R.; Watts, J.C.; et al. Alpha-synuclein seeding shows a wide heterogeneity in multiple system atrophy. Transl. Neurodegener. 2022, 11, 7. [Google Scholar] [CrossRef] [PubMed]
- Yamasaki, T.R.; Holmes, B.B.; Furman, J.L.; Dhavale, D.D.; Su, B.W.; Song, E.S.; Cairns, N.J.; Kotzbauer, P.T.; Diamond, M.I. Parkinson’s disease and multiple system atrophy have distinct α-synuclein seed characteristics. J. Biol. Chem. 2019, 294, 1045–1058. [Google Scholar] [CrossRef] [PubMed] [Green Version]
- Jellinger, K.A. Heterogeneity of Multiple System Atrophy: An Update. Biomedicines 2022, 10, 599. [Google Scholar] [CrossRef] [PubMed]
- Strohäker, T.; Jung, B.C.; Liou, S.-H.; Fernandez, C.O.; Riedel, D.; Becker, S.; Halliday, G.M.; Bennati, M.; Kim, W.S.; Lee, S.-J.; et al. Structural heterogeneity of α-synuclein fibrils amplified from patient brain extracts. Nat. Commun. 2019, 10, 5535. [Google Scholar] [CrossRef] [Green Version]
- Koga, S. The Nomenclature and Classification of Sporadic Spinocerebellar Degeneration. Brain Nerve = Shinkei Kenkyu No Shinpo 2016, 68, 1453–1457. [Google Scholar] [CrossRef]
- Hirayama, K.; Takayanagi, T.; Nakamura, R.; Yanagisawa, N.; Hattori, T.; Kita, K.; Yanagimoto, S.; Fujita, M.; Nagaoka, M.; Satomura, Y.; et al. Spinocerebellar degenerations in Japan: A nationwide epidemiological and clinical study. Acta Neurol. Scand. Suppl. 1994, 153, 1–22. [Google Scholar] [CrossRef] [PubMed]
- Li, M.; Ma, Q.; Zhao, X.; Wang, C.; Wu, H.; Li, J.; Yang, W. Dilemma of multiple system atrophy and spinocerebellar ataxias. J. Neurol. 2018, 265, 2764–2772. [Google Scholar] [CrossRef] [PubMed]
- Kiely, A.P.; Asi, Y.T.; Kara, E.; Limousin, P.; Ling, H.; Lewis, P.; Proukakis, C.; Quinn, N.; Lees, A.J.; Hardy, J.; et al. α-Synucleinopathy associated with G51D SNCA mutation: A link between Parkinson’s disease and multiple system atrophy? Acta Neuropathol. 2013, 125, 753–769. [Google Scholar] [CrossRef] [PubMed] [Green Version]
- Sun, Z.; Ohta, Y.; Yamashita, T.; Sato, K.; Takemoto, M.; Hishikawa, N.; Abe, K. New susceptible variant of COQ2 gene in Japanese patients with sporadic multiple system atrophy. Neurology. Genetics 2016, 2, e54. [Google Scholar] [CrossRef] [Green Version]
- Quinzii, C.; Naini, A.; Salviati, L.; Trevisson, E.; Navas, P.; Dimauro, S.; Hirano, M. A mutation in para-hydroxybenzoate-polyprenyl transferase (COQ2) causes primary coenzyme Q10 deficiency. Am. J. Hum. Genet. 2006, 78, 345–349. [Google Scholar] [CrossRef] [Green Version]
- Rauchová, H. Coenzyme Q10 effects in neurological diseases. Physiol. Res. 2021, 70, S683–S714. [Google Scholar] [CrossRef]
- Barca, E.; Kleiner, G.; Tang, G.; Ziosi, M.; Tadesse, S.; Masliah, E.; Louis, E.D.; Faust, P.; Kang, U.J.; Torres, J.; et al. Decreased Coenzyme Q10 Levels in Multiple System Atrophy Cerebellum. J. Neuropathol. Exp. Neurol. 2016, 75, 663–672. [Google Scholar] [CrossRef] [Green Version]
- Hsiao, J.T.; Purushothuman, S.; Jensen, P.H.; Halliday, G.M.; Kim, W.S. Reductions in COQ2 Expression Relate to Reduced ATP Levels in Multiple System Atrophy Brain. Front. Neurosci. 2019, 13, 1187. [Google Scholar] [CrossRef]
- Chen, Y.P.; Zhao, B.; Cao, B.; Song, W.; Guo, X.; Wei, Q.Q.; Yang, Y.; Yuan, L.X.; Shang, H.F. Mutation scanning of the COQ2 gene in ethnic Chinese patients with multiple-system atrophy. Neurobiol. Aging 2015, 36, 1222.e7–1222.e11. [Google Scholar] [CrossRef]
- Procopio, R.; Gagliardi, M.; Brighina, L.; Nicoletti, G.; Morelli, M.; Ferrarese, C.; Annesi, G.; Quattrone, A. Genetic mutation analysis of the COQ2 gene in Italian patients with multiple system atrophy. Gene 2019, 716, 144037. [Google Scholar] [CrossRef]
- Mikasa, M.; Kanai, K.; Li, Y.; Yoshino, H.; Mogushi, K.; Hayashida, A.; Ikeda, A.; Kawajiri, S.; Okuma, Y.; Kashihara, K.; et al. COQ2 variants in Parkinson’s disease and multiple system atrophy. J. Neural Transm. 2018, 125, 937–944. [Google Scholar] [CrossRef] [PubMed]
- Schottlaender, L.V.; Holton, J.L.; Houlden, H. Multiple system atrophy and repeat expansions in C9orf72. JAMA Neurol. 2014, 71, 1190–1191. [Google Scholar] [CrossRef] [PubMed]
- Riboldi, G.M.; Palma, J.A.; Cortes, E.; Iida, M.A.; Sikder, T.; Henderson, B.; Raj, T.; Walker, R.H.; Crary, J.F.; Kaufmann, H.; et al. Early-onset pathologically proven multiple system atrophy with LRRK2 G2019S mutation. Mov. Disord. Off. J. Mov. Disord. Soc. 2019, 34, 1080–1082. [Google Scholar] [CrossRef] [PubMed]
- Wernick, A.I.; Walton, R.L.; Koga, S.; Soto-Beasley, A.I.; Heckman, M.G.; Gan-Or, Z.; Ren, Y.; Rademakers, R.; Uitti, R.J.; Wszolek, Z.K.; et al. GBA variation and susceptibility to multiple system atrophy. Park. Relat. Disord. 2020, 77, 64–69. [Google Scholar] [CrossRef]
- Nicoletti, G.; Gagliardi, M.; Procopio, R.; Iannello, G.; Morelli, M.; Annesi, G.; Quattrone, A. A new CHCHD2 mutation identified in a southern italy patient with multiple system atrophy. Park. Relat. Disord. 2018, 47, 91–93. [Google Scholar] [CrossRef]
- Wernick, A.I.; Walton, R.L.; Soto-Beasley, A.I.; Koga, S.; Heckman, M.G.; Valentino, R.R.; Milanowski, L.M.; Hoffman-Zacharska, D.; Koziorowski, D.; Hassan, A.; et al. Frequency of spinocerebellar ataxia mutations in patients with multiple system atrophy. Clin. Auton. Res. Off. J. Clin. Auton. Res. Soc. 2021, 31, 117–125. [Google Scholar] [CrossRef]
- Vilariño-Güell, C.; Soto-Ortolaza, A.I.; Rajput, A.; Mash, D.C.; Papapetropoulos, S.; Pahwa, R.; Lyons, K.E.; Uitti, R.J.; Wszolek, Z.K.; Dickson, D.W.; et al. MAPT H1 haplotype is a risk factor for essential tremor and multiple system atrophy. Neurology 2011, 76, 670–672. [Google Scholar] [CrossRef] [Green Version]
- Piñero, J.; Saüch, J.; Sanz, F.; Furlong, L.I. The DisGeNET cytoscape app: Exploring and visualizing disease genomics data. Comput. Struct. Biotechnol. J. 2021, 19, 2960–2967. [Google Scholar] [CrossRef]
- Porto, K.J.; Hirano, M.; Mitsui, J.; Chikada, A.; Matsukawa, T.; Ishiura, H.; Toda, T.; Kusunoki, S.; Tsuji, S. COQ2 V393A confers high risk susceptibility for multiple system atrophy in East Asian population. J. Neurol. Sci. 2021, 429, 117623. [Google Scholar] [CrossRef]
- Rink, C.; Khanna, S. Significance of brain tissue oxygenation and the arachidonic acid cascade in stroke. Antioxid. Redox Signal. 2011, 14, 1889–1903. [Google Scholar] [CrossRef] [Green Version]
- Bazinet, R.P.; Layé, S. Polyunsaturated fatty acids and their metabolites in brain function and disease. Nat. Rev. Neurosci. 2014, 15, 771–785. [Google Scholar] [CrossRef]
- Aoyama, K. Glutathione in the Brain. Int. J. Mol. Sci. 2021, 22, 5010. [Google Scholar] [CrossRef]
- Shukla, G.S.; Hussain, T.; Srivastava, R.S.; Chandra, S.V. Glutathione peroxidase and catalase in liver, kidney, testis and brain regions of rats following cadmium exposure and subsequent withdrawal. Ind. Health 1989, 27, 59–69. [Google Scholar] [CrossRef] [Green Version]
- Szymonik-Lesiuk, S.; Czechowska, G.; Stryjecka-Zimmer, M.; SŁomka, M.; MĄldro, A.; CeliŃski, K.; Wielosz, M. Catalase, superoxide dismutase, and glutathione peroxidase activities in various rat tissues after carbon tetrachloride intoxication. J. Hepato-Biliary-Pancreat. Surg. 2003, 10, 309–315. [Google Scholar] [CrossRef]
- Dringen, R.; Hirrlinger, J. Glutathione Pathways in the Brain. Biol. Chem. 2003, 384, 505–516. [Google Scholar] [CrossRef] [PubMed]
- Couto, N.; Wood, J.; Barber, J. The role of glutathione reductase and related enzymes on cellular redox homoeostasis network. Free. Radic. Biol. Med. 2016, 95, 27–42. [Google Scholar] [CrossRef] [PubMed]
- Fitzmaurice, P.S.; Ang, L.; Guttman, M.; Rajput, A.H.; Furukawa, Y.; Kish, S.J. Nigral glutathione deficiency is not specific for idiopathic Parkinson’s disease. Mov. Disord. 2003, 18, 969–976. [Google Scholar] [CrossRef] [PubMed]
- Jenner, P.; Dexter, D.T.; Sian, J.; Schapira, A.H.V.; Marsden, C.D. Oxidative stress as a cause of nigral cell death in Parkinson’s disease and incidental lewy body disease. Ann. Neurol. 1992, 32, S82–S87. [Google Scholar] [CrossRef]
- Sian, J.; Dexter, D.T.; Lees, A.J.; Daniel, S.; Agid, Y.; Javoy-Agid, F.; Jenner, P.; Marsden, C.D. Alterations in glutathione levels in Parkinson’s disease and other neurodegenerative disorders affecting basal ganglia. Ann. Neurol. 1994, 36, 348–355. [Google Scholar] [CrossRef]
- Paik, S.R.; Lee, D.; Cho, H.-J.; Lee, E.-N.; Chang, C.-S. Oxidized glutathione stimulated the amyloid formation of α-synuclein. FEBS Lett. 2003, 537, 63–67. [Google Scholar] [CrossRef] [Green Version]
- Xu, B.; Wu, S.-W.; Lu, C.-W.; Deng, Y.; Liu, W.; Wei, Y.-G.; Yang, T.-Y.; Xu, Z.-F. Oxidative stress involvement in manganese-induced alpha-synuclein oligomerization in organotypic brain slice cultures. Toxicology 2013, 305, 71–78. [Google Scholar] [CrossRef]
- Tanaka, K.-I.; Sonoda, K.; Asanuma, M. Effect of Alteration of Glutathione Content on Cell Viability in α-Synuclein-Transfected SH-SY5Y Cells. Adv. Park. Dis. 2017, 6, 93. [Google Scholar] [CrossRef] [Green Version]
- Clark, J.; Clore, E.L.; Zheng, K.; Adame, A.; Masliah, E.; Simon, D.K. Oral N-acetyl-cysteine attenuates loss of dopaminergic terminals in alpha-synuclein overexpressing mice. PLoS ONE 2010, 5, e12333. [Google Scholar] [CrossRef] [Green Version]
- Flohé, L. Glutathione peroxidase. Basic Life Sci. 1988, 49, 663–668. [Google Scholar] [CrossRef]
- Kish, S.J.; Morito, C.L.; Hornykiewicz, O. Brain glutathione peroxidase in neurodegenerative disorders. Neurochem. Pathol. 1986, 4, 23–28. [Google Scholar] [CrossRef]
- Koo, H.J.; Yang, J.E.; Park, J.H.; Lee, D.; Paik, S.R. α-Synuclein-mediated defense against oxidative stress via modulation of glutathione peroxidase. Biochim. Et Biophys. Acta 2013, 1834, 972–976. [Google Scholar] [CrossRef]
- Hayes, J.D.; Flanagan, J.U.; Jowsey, I.R. Glutathione transferases. Annu. Rev. Pharmacol. Toxicol. 2005, 45, 51–88. [Google Scholar] [CrossRef]
- Probst-Cousin, S.; Bergmann, M.; Kuchelmeister, K.; Schröder, R.; Schmid, K.W. Ubiquitin-positive inclusions in different types of multiple system atrophy: Distribution and specificity. Pathol. Res. Pract. 1996, 192, 453–461. [Google Scholar] [CrossRef] [PubMed]
- Aoyama, K.; Nakaki, T. Impaired glutathione synthesis in neurodegeneration. Int. J. Mol. Sci. 2013, 14, 21021–21044. [Google Scholar] [CrossRef] [PubMed] [Green Version]
- Janáky, R.; Varga, V.; Hermann, A.; Saransaari, P.; Oja, S.S. Mechanisms of L-cysteine neurotoxicity. Neurochem. Res. 2000, 25, 1397–1405. [Google Scholar] [CrossRef] [PubMed]
- Paul, B.D.; Sbodio, J.I.; Snyder, S.H. Cysteine Metabolism in Neuronal Redox Homeostasis. Trends Pharmacol. Sci. 2018, 39, 513–524. [Google Scholar] [CrossRef]
- Hughes, C.E.; Coody, T.K.; Jeong, M.Y.; Berg, J.A.; Winge, D.R.; Hughes, A.L. Cysteine Toxicity Drives Age-Related Mitochondrial Decline by Altering Iron Homeostasis. Cell 2020, 180, 296–310.e218. [Google Scholar] [CrossRef]
- Richman, P.G.; Meister, A. Regulation of gamma-glutamyl-cysteine synthetase by nonallosteric feedback inhibition by glutathione. J. Biol. Chem. 1975, 250, 1422–1426. [Google Scholar] [CrossRef]
- Lu, S.C. Regulation of glutathione synthesis. Mol. Asp. Med. 2009, 30, 42–59. [Google Scholar] [CrossRef] [PubMed] [Green Version]
- Ferguson, G.; Bridge, W. Glutamate cysteine ligase and the age-related decline in cellular glutathione: The therapeutic potential of γ-glutamylcysteine. Arch. Biochem. Biophys. 2016, 593, 12–23. [Google Scholar] [CrossRef]
- Njålsson, R. Glutathione synthetase deficiency. Cell. Mol. Life Sci. CMLS 2005, 62, 1938–1945. [Google Scholar] [CrossRef] [PubMed]
- Aoyama, K.; Nakaki, T. Glutathione in Cellular Redox Homeostasis: Association with the Excitatory Amino Acid Carrier 1 (EAAC1). Molecules 2015, 20, 8742–8758. [Google Scholar] [CrossRef] [PubMed] [Green Version]
- Divito, C.B.; Underhill, S.M. Excitatory amino acid transporters: Roles in glutamatergic neurotransmission. Neurochem. Int. 2014, 73, 172–180. [Google Scholar] [CrossRef] [PubMed] [Green Version]
- Bianchi, M.G.; Bardelli, D.; Chiu, M.; Bussolati, O. Changes in the expression of the glutamate transporter EAAT3/EAAC1 in health and disease. Cell. Mol. Life Sci. 2014, 71, 2001–2015. [Google Scholar] [CrossRef] [PubMed]
- Aoyama, K.; Suh, S.W.; Hamby, A.M.; Liu, J.; Chan, W.Y.; Chen, Y.; Swanson, R.A. Neuronal glutathione deficiency and age-dependent neurodegeneration in the EAAC1 deficient mouse. Nat. Neurosci. 2006, 9, 119–126. [Google Scholar] [CrossRef] [PubMed]
- Kanai, Y.; Hediger, M.A. The glutamate and neutral amino acid transporter family: Physiological and pharmacological implications. Eur. J. Pharmacol. 2003, 479, 237–247. [Google Scholar] [CrossRef]
- Watts, S.D.; Torres-Salazar, D.; Divito, C.B.; Amara, S.G. Cysteine Transport through Excitatory Amino Acid Transporter 3 (EAAT3). PLoS ONE 2014, 9, e109245. [Google Scholar] [CrossRef] [PubMed] [Green Version]
- Sedláčková, L.; Laššuthová, P.; Štěrbová, K.; Vlčková, M.; Kudr, M.; Buksakowska, I.; Staněk, D.; Seeman, P. Severe neurodevelopmental disorder with intractable seizures due to a novel SLC1A4 homozygous variant. Eur. J. Med. Genet. 2021, 64, 104263. [Google Scholar] [CrossRef]
- Abdelrahman, H.A.; Al-Shamsi, A.; John, A.; Ali, B.R.; Al-Gazali, L. A Novel SLC1A4 Mutation (p.Y191*) Causes Spastic Tetraplegia, Thin Corpus Callosum, and Progressive Microcephaly (SPATCCM) With Seizure Disorder. Child Neurol. Open 2019, 6, 2329048x19880647. [Google Scholar] [CrossRef] [PubMed]
- Pironti, E.; Salpietro, V.; Cucinotta, F.; Granata, F.; Mormina, E.; Efthymiou, S.; Scuderi, C.; Gagliano, A.; Houlden, H.; Di Rosa, G. A novel SLC1A4 homozygous mutation causing congenital microcephaly, epileptic encephalopathy and spastic tetraparesis: A video-EEG and tractography—Case study. J. Neurogenet. 2018, 32, 316–321. [Google Scholar] [CrossRef]
- Heimer, G.; Marek-Yagel, D.; Eyal, E.; Barel, O.; Oz Levi, D.; Hoffmann, C.; Ruzzo, E.K.; Ganelin-Cohen, E.; Lancet, D.; Pras, E.; et al. SLC1A4 mutations cause a novel disorder of intellectual disability, progressive microcephaly, spasticity and thin corpus callosum. Clin. Genet. 2015, 88, 327–335. [Google Scholar] [CrossRef]
- Deng, X.; Sagata, N.; Takeuchi, N.; Tanaka, M.; Ninomiya, H.; Iwata, N.; Ozaki, N.; Shibata, H.; Fukumaki, Y. Association study of polymorphisms in the neutral amino acid transporter genes SLC1A4, SLC1A5 and the glycine transporter genes SLC6A5, SLC6A9 with schizophrenia. BMC Psychiatry 2008, 8, 58. [Google Scholar] [CrossRef] [PubMed] [Green Version]
- Damseh, N.; Simonin, A.; Jalas, C.; Picoraro, J.A.; Shaag, A.; Cho, M.T.; Yaacov, B.; Neidich, J.; Al-Ashhab, M.; Juusola, J.; et al. Mutations in SLC1A4, encoding the brain serine transporter, are associated with developmental delay, microcephaly and hypomyelination. J. Med. Genet. 2015, 52, 541–547. [Google Scholar] [CrossRef] [PubMed]
- Soma, H.; Yabe, I.; Takei, A.; Fujiki, N.; Yanagihara, T.; Sasaki, H. Associations between multiple system atrophy and polymorphisms of SLC1A4, SQSTM1, and EIF4EBP1 genes. Mov. Disord. Off. J. Mov. Disord. Soc. 2008, 23, 1161–1167. [Google Scholar] [CrossRef]
- Kinoshita, C.; Aoyama, K. The Role of Non-Coding RNAs in the Neuroprotective Effects of Glutathione. Int. J. Mol. Sci. 2021, 22, 4245. [Google Scholar] [CrossRef]
- Pérez-Soriano, A.; Bravo, P.; Soto, M.; Infante, J.; Fernández, M.; Valldeoriola, F.; Muñoz, E.; Compta, Y.; Tolosa, E.; Garrido, A.; et al. MicroRNA Deregulation in Blood Serum Identifies Multiple System Atrophy Altered Pathways. Mov. Disord. Off. J. Mov. Disord. Soc. 2020, 35, 1873–1879. [Google Scholar] [CrossRef] [PubMed]
- Kume, K.; Iwama, H.; Deguchi, K.; Ikeda, K.; Takata, T.; Kokudo, Y.; Kamada, M.; Fujikawa, K.; Hirose, K.; Masugata, H.; et al. Serum microRNA expression profiling in patients with multiple system atrophy. Mol. Med. Rep. 2018, 17, 852–860. [Google Scholar] [CrossRef]
- Uwatoko, H.; Hama, Y.; Iwata, I.T.; Shirai, S.; Matsushima, M.; Yabe, I.; Utsumi, J.; Sasaki, H. Identification of plasma microRNA expression changes in multiple system atrophy and Parkinson’s disease. Mol. Brain 2019, 12, 49. [Google Scholar] [CrossRef] [Green Version]
- Kim, T.; Valera, E.; Desplats, P. Alterations in Striatal microRNA-mRNA Networks Contribute to Neuroinflammation in Multiple System Atrophy. Mol. Neurobiol. 2019, 56, 7003–7021. [Google Scholar] [CrossRef]
- Wakabayashi, K.; Mori, F.; Kakita, A.; Takahashi, H.; Tanaka, S.; Utsumi, J.; Sasaki, H. MicroRNA expression profiles of multiple system atrophy from formalin-fixed paraffin-embedded samples. Neurosci. Lett. 2016, 635, 117–122. [Google Scholar] [CrossRef] [PubMed]
- Lee, S.-T.; Chu, K.; Jung, K.-H.; Ban, J.-J.; Im, W.-S.; Jo, H.-Y.; Park, J.-H.; Lim, J.-Y.; Shin, J.-W.; Moon, J.; et al. Altered Expression of miR-202 in Cerebellum of Multiple-System Atrophy. Mol. Neurobiol. 2015, 51, 180–186. [Google Scholar] [CrossRef] [PubMed]
- Vallelunga, A.; Ragusa, M.; Di Mauro, S.; Iannitti, T.; Pilleri, M.; Biundo, R.; Weis, L.; Di Pietro, C.; De Iuliis, A.; Nicoletti, A.; et al. Identification of circulating microRNAs for the differential diagnosis of Parkinson’s disease and Multiple System Atrophy. Front. Cell. Neurosci. 2014, 8, 156. [Google Scholar] [CrossRef] [Green Version]
- Starhof, C.; Hejl, A.M.; Heegaard, N.H.H.; Carlsen, A.L.; Burton, M.; Lilje, B.; Winge, K. The biomarker potential of cell-free microRNA from cerebrospinal fluid in Parkinsonian Syndromes. Mov. Disord. Off. J. Mov. Disord. Soc. 2019, 34, 246–254. [Google Scholar] [CrossRef]
- Seok, H.; Ham, J.; Jang, E.S.; Chi, S.W. MicroRNA Target Recognition: Insights from Transcriptome-Wide Non-Canonical Interactions. Mol. Cells 2016, 39, 375–381. [Google Scholar] [CrossRef] [Green Version]
- Krol, J.; Loedige, I.; Filipowicz, W. The widespread regulation of microRNA biogenesis, function and decay. Nat. Rev. Genet. 2010, 11, 597–610. [Google Scholar] [CrossRef]
- Alarcón, C.R.; Lee, H.; Goodarzi, H.; Halberg, N.; Tavazoie, S.F. N6-methyladenosine marks primary microRNAs for processing. Nature 2015, 519, 482–485. [Google Scholar] [CrossRef] [PubMed]
- Michlewski, G.; Cáceres, J.F. Post-transcriptional control of miRNA biogenesis. RNA 2019, 25, 1–16. [Google Scholar] [CrossRef] [PubMed] [Green Version]
- Iwakawa, H.O.; Tomari, Y. Life of RISC: Formation, action, and degradation of RNA-induced silencing complex. Mol. Cell 2022, 82, 30–43. [Google Scholar] [CrossRef]
- Stavast, C.J.; Erkeland, S.J. The Non-Canonical Aspects of MicroRNAs: Many Roads to Gene Regulation. Cells 2019, 8, 1465. [Google Scholar] [CrossRef] [PubMed] [Green Version]
- Kinoshita, C.; Aoyama, K.; Matsumura, N.; Kikuchi-Utsumi, K.; Watabe, M.; Nakaki, T. Rhythmic oscillations of the microRNA miR-96-5p play a neuroprotective role by indirectly regulating glutathione levels. Nat. Commun. 2014, 5, 3823. [Google Scholar] [CrossRef] [PubMed] [Green Version]
- Kinoshita, C.; Kikuchi-Utsumi, K.; Aoyama, K.; Suzuki, R.; Okamoto, Y.; Matsumura, N.; Omata, D.; Maruyama, K.; Nakaki, T. Inhibition of miR-96-5p in the mouse brain increases glutathione levels by altering NOVA1 expression. Commun. Biol. 2021, 4, 182. [Google Scholar] [CrossRef] [PubMed]
- Vallelunga, A.; Iannitti, T.; Capece, S.; Somma, G.; Russillo, M.C.; Foubert-Samier, A.; Laurens, B.; Sibon, I.; Meissner, W.G.; Barone, P.; et al. Serum miR-96-5P and miR-339-5P Are Potential Biomarkers for Multiple System Atrophy and Parkinson’s Disease. Front. Aging Neurosci. 2021, 13, 632891. [Google Scholar] [CrossRef] [PubMed]
- Valera, E.; Spencer, B.; Mott, J.; Trejo, M.; Adame, A.; Mante, M.; Rockenstein, E.; Troncoso, J.C.; Beach, T.G.; Masliah, E.; et al. MicroRNA-101 Modulates Autophagy and Oligodendroglial Alpha-Synuclein Accumulation in Multiple System Atrophy. Front. Mol. Neurosci. 2017, 10, 329. [Google Scholar] [CrossRef] [PubMed]
- Vidal-Martinez, G.; Segura-Ulate, I.; Yang, B.; Diaz-Pacheco, V.; Barragan, J.A.; De-Leon Esquivel, J.; Chaparro, S.A.; Vargas-Medrano, J.; Perez, R.G. FTY720-Mitoxy reduces synucleinopathy and neuroinflammation, restores behavior and mitochondria function, and increases GDNF expression in Multiple System Atrophy mouse models. Exp. Neurol. 2020, 325, 113120. [Google Scholar] [CrossRef]
- Koepsell, H. General Overview of Organic Cation Transporters in Brain. In Organic Cation Transporters in the Central Nervous System; Daws, L.C., Ed.; Springer International Publishing: Cham, Switzerland, 2021; pp. 1–39. [Google Scholar]
- Baumgart, B.R.; Gray, K.L.; Woicke, J.; Bunch, R.T.; Sanderson, T.P.; Van Vleet, T.R. MicroRNA as biomarkers of mitochondrial toxicity. Toxicol. Appl. Pharmacol. 2016, 312, 26–33. [Google Scholar] [CrossRef]
- Chang, L.; Xia, J. MicroRNA Regulatory Network Analysis Using miRNet 2.0. In Transcription Factor Regulatory Networks; Song, Q., Tao, Z., Eds.; Springer US: New York, NY, USA, 2022; pp. 185–204. [Google Scholar]
- Huang, Z.; Shi, J.; Gao, Y.; Cui, C.; Zhang, S.; Li, J.; Zhou, Y.; Cui, Q. HMDD v3.0: A database for experimentally supported human microRNA-disease associations. Nucleic Acids Res. 2019, 47, D1013–D1017. [Google Scholar] [CrossRef] [PubMed]
- Liu, L.; Liu, L.; Lu, Y.; Zhang, T.; Zhao, W. Serum aberrant expression of miR-24-3p and its diagnostic value in Alzheimer’s disease. Biomark. Med. 2021, 15, 1499–1507. [Google Scholar] [CrossRef] [PubMed]
- Chen, Y.; Wang, X. miRDB: An online database for prediction of functional microRNA targets. Nucleic acids research 2019, 48, D127–D131. [Google Scholar] [CrossRef] [PubMed] [Green Version]
- Yousefi, M.; Peymani, M.; Ghaedi, K.; Irani, S.; Etemadifar, M. Significant modulations of linc001128 and linc0938 with miR-24-3p and miR-30c-5p in Parkinson disease. Sci. Rep. 2022, 12, 2569. [Google Scholar] [CrossRef]
- Di, G.; Yang, X.; Cheng, F.; Liu, H.; Xu, M. CEBPA-AS1 Knockdown Alleviates Oxygen-Glucose Deprivation/Reperfusion-Induced Neuron Cell Damage by the MicroRNA 24-3p/BOK Axis. Mol. Cell. Biol. 2021, 41, e0006521. [Google Scholar] [CrossRef]
- Matoušková, P.; Hanousková, B.; Skálová, L. MicroRNAs as Potential Regulators of Glutathione Peroxidases Expression and Their Role in Obesity and Related Pathologies. Int. J. Mol. Sci. 2018, 19, 1199. [Google Scholar] [CrossRef] [Green Version]
- Chis, A.R.; Moatar, A.I.; Dijmarescu, C.; Rosca, C.; Vorovenci, R.J.; Krabbendam, I.; Dolga, A.; Bejinar, C.; Marian, C.; Sirbu, I.O.; et al. Plasma hsa-mir-19b is a potential LevoDopa therapy marker. J. Cell. Mol. Med. 2021, 25, 8715–8724. [Google Scholar] [CrossRef]
- Cao, X.Y.; Lu, J.M.; Zhao, Z.Q.; Li, M.C.; Lu, T.; An, X.S.; Xue, L.J. MicroRNA biomarkers of Parkinson’s disease in serum exosome-like microvesicles. Neurosci. Lett. 2017, 644, 94–99. [Google Scholar] [CrossRef]
- Soto, M.; Iranzo, A.; Lahoz, S.; Fernández, M.; Serradell, M.; Gaig, C.; Melón, P.; Martí, M.J.; Santamaría, J.; Camps, J.; et al. Serum MicroRNAs Predict Isolated Rapid Eye Movement Sleep Behavior Disorder and Lewy Body Diseases. Mov. Disord. Off. J. Mov. Disord. Soc. 2022, 37, 2086–2098. [Google Scholar] [CrossRef]
- Joilin, G.; Gray, E.; Thompson, A.G.; Bobeva, Y.; Talbot, K.; Weishaupt, J.; Ludolph, A.; Malaspina, A.; Leigh, P.N.; Newbury, S.F.; et al. Identification of a potential non-coding RNA biomarker signature for amyotrophic lateral sclerosis. Brain Commun. 2020, 2, fcaa053. [Google Scholar] [CrossRef]
- Arakawa, Y.; Itoh, S.; Fukazawa, Y.; Ishiguchi, H.; Kohmoto, J.; Hironishi, M.; Ito, H.; Kihira, T. Association between oxidative stress and microRNA expression pattern of ALS patients in the high-incidence area of the Kii Peninsula. Brain Res. 2020, 1746, 147035. [Google Scholar] [CrossRef] [PubMed]
- Zhou, Y.; Wei, W.; Shen, J.; Lu, L.; Lu, T.; Wang, H.; Xue, X. Alisol A 24-acetate protects oxygen-glucose deprivation-induced brain microvascular endothelial cells against apoptosis through miR-92a-3p inhibition by targeting the B-cell lymphoma-2 gene. Pharm. Biol. 2021, 59, 513–524. [Google Scholar] [CrossRef] [PubMed]
- Eisele, Y.S.; Monteiro, C.; Fearns, C.; Encalada, S.E.; Wiseman, R.L.; Powers, E.T.; Kelly, J.W. Targeting protein aggregation for the treatment of degenerative diseases. Nat. Rev. Drug Discov. 2015, 14, 759–780. [Google Scholar] [CrossRef] [PubMed] [Green Version]
- Kametani, F.; Hasegawa, M. Reconsideration of Amyloid Hypothesis and Tau Hypothesis in Alzheimer’s Disease. Front. Neurosci. 2018, 12, 25. [Google Scholar] [CrossRef] [PubMed] [Green Version]
- Grosso Jasutkar, H.; Oh, S.E.; Mouradian, M.M. Therapeutics in the Pipeline Targeting α-Synuclein for Parkinson’s Disease. Pharmacol. Rev. 2022, 74, 207–237. [Google Scholar] [CrossRef]
- Ballatori, N.; Krance, S.M.; Notenboom, S.; Shi, S.; Tieu, K.; Hammond, C.L. Glutathione dysregulation and the etiology and progression of human diseases. Biol. Chem. 2009, 390, 191–214. [Google Scholar] [CrossRef] [Green Version]
- Bottino, F.; Lucignani, M.; Napolitano, A.; Dellepiane, F.; Visconti, E.; Rossi Espagnet, M.C.; Pasquini, L. In Vivo Brain GSH: MRS Methods and Clinical Applications. Antioxidants 2021, 10, 1407. [Google Scholar] [CrossRef]
- Mandal, P.K.; Saharan, S.; Tripathi, M.; Murari, G. Brain Glutathione Levels—A Novel Biomarker for Mild Cognitive Impairment and Alzheimer’s Disease. Biol. Psychiatry 2015, 78, 702–710. [Google Scholar] [CrossRef]
- Duffy, S.L.; Lagopoulos, J.; Hickie, I.B.; Diamond, K.; Graeber, M.B.; Lewis, S.J.; Naismith, S.L. Glutathione relates to neuropsychological functioning in mild cognitive impairment. Alzheimer’s Dement. J. Alzheimer’s Assoc. 2014, 10, 67–75. [Google Scholar] [CrossRef]
- Saharan, S.; Mandal, P.K. The emerging role of glutathione in Alzheimer’s disease. J. Alzheimer’s Dis. JAD 2014, 40, 519–529. [Google Scholar] [CrossRef]
- Weiduschat, N.; Mao, X.; Hupf, J.; Armstrong, N.; Kang, G.; Lange, D.J.; Mitsumoto, H.; Shungu, D.C. Motor cortex glutathione deficit in ALS measured in vivo with the J-editing technique. Neurosci. Lett. 2014, 570, 102–107. [Google Scholar] [CrossRef] [PubMed]
- Cheong, I.; Marjańska, M.; Deelchand, D.K.; Eberly, L.E.; Walk, D.; Öz, G. Ultra-High Field Proton MR Spectroscopy in Early-Stage Amyotrophic Lateral Sclerosis. Neurochem. Res. 2017, 42, 1833–1844. [Google Scholar] [CrossRef] [PubMed]
- Kinoshita, C.; Aoyama, K.; Nakaki, T. Neuroprotection afforded by circadian regulation of intracellular glutathione levels: A key role for miRNAs. Free. Radic. Biol. Med. 2018, 119, 17–33. [Google Scholar] [CrossRef] [PubMed]
- Recasens, A.; Perier, C.; Sue, C.M. Role of microRNAs in the Regulation of α-Synuclein Expression: A Systematic Review. Front. Mol. Neurosci. 2016, 9, 128. [Google Scholar] [CrossRef] [PubMed]
Figure 1.
Clinical and pathological features of MSA.

Figure 2.
Association between the state of α-synuclein and conversion of GSH and GSSG.

Figure 3.
Biosynthesis of intracellular glutathione in neurons, microglia and oligodendrocytes. (a) Glutathione (GSH) is comprised of three amino acids: cysteine (Cys), glutamate (Glu) and glycine (Gly), of which Cys is rate-limiting, with its uptake mainly mediated by EAAC1. ASCT1 also contributes to Cys uptake, but its ability might be more limited. Transported Cys is conjugated with Glu catalyzed by glutamate-cysteine ligase (GCL) and then couples with Gly to form GSH. (b) EAAC1 and ASCT1 are members of the SLC1A family, comprised of excitatory amino acid transporter (EAAT) and neutral amino acid transporter (ASCT) subtypes.

Figure 4.
Canonical and non-canonical pathways of microRNA biogenesis.

Figure 5.
Strategies for early diagnosis and treatment of MSA.

Table 2.
List of miRNAs that are upregulated or downregulated in patients with MSA reported in two or more studies.
Table 2.
List of miRNAs that are upregulated or downregulated in patients with MSA reported in two or more studies.
| miRNA | Number of Reports | Detection Area | Features | |||||||
|---|---|---|---|---|---|---|---|---|---|---|
| Serum [112,113,118] | Plasma [114,119] | CSF [119] | Cerebellum [116,117] | Pons [116] | Striatum [115] | Frontal Cortex [18] | Related NDs [133,134] | Regulatory Function [135] | ||
| hsa-miR-24-3p | 6 | ↑↑↑ | ↓ | n.d. | n.d. | n.d. | ↑ | ↑ | AD, PD, HD | regulation of neuronal differentiation |
| hsa-miR-19b-3p | 4 | ↑ | ↓ | ↑ | n.d. | n.d. | n.d. | ↑ | AD, PD | regulation of neural proliferation |
| hsa-miR-25-3p | 4 | ↑↑ | n.d. | n.d. | n.d. | n.d. | ↑ | ↑ | AD, PD | aggravating Aβ -induced neuron injury |
| hsa-miR-92a-3p | 4 | ↑ | n.d. | ↓ | n.d. | n.d. | ↑ | ↑ | AD, ALS | aggravating oxidative stress |
| hsa-let-7b-5p | 3 | ↑↑ | n.d. | n.d. | n.d. | n.d. | ↑ | n.d. | AD, PD, ALS | regulation of neuronal apoptosis |
| hsa-miR-15b-5p | 3 | ↑ | ↓ | n.d. | n.d. | n.d. | n.d. | ↑ | AD, ALS | protection against neuronal damage |
| hsa-miR-16-5p | 3 | ↑ | n.d. | n.d. | n.d. | n.d. | n.d. | ↑ | AD, PD, ALS | associated with Aβ deposition |
| hsa-miR-17-5p | 3 | ↑↑ | n.d. | n.d. | n.d. | n.d. | n.d. | ↑ | AD, PD | protection against neurotoxicity |
| hsa-miR-23a-3p | 3 | ↑ | n.d. | n.d. | n.d. | ↑ | n.d. | ↑ | ALS, HD | associated with neuronal apoptosis |
| hsa-miR-93-5p | 3 | ↑ | n.d. | n.d. | n.d. | n.d. | ↑ | ↑ | AD, ALS | inhibition of microglial activation and inflammatory reaction |
| hsa-miR-99a-5p | 3 | ↑ | n.d. | ↓ | n.d. | n.d. | n.d. | ↑ | AD, PD | localized at post-synaptic densities in forebrain |
| hsa-miR-106a-5p | 3 | ↑↑ | n.d. | ↓ | n.d. | n.d. | n.d. | n.d. | PD | regulation of neurogenesis |
| hsa-mIR-124-3p | 3 | n.d. | n.d. | n.d. | n.d. | ↓ | ↓ | ↑ | AD, ALS | regulation of neuronal development |
| hsa-miR-129-5p | 3 | n.d. | n.d. | n.d. | ↓↓ | ↓ | n.d. | n.d. | AD, PD, ALS | regulation of apoptosis and neuroinflammation |
| hsa-miR-186-5p | 3 | ↑ | n.d. | n.d. | n.d. | n.d. | ↑ | ↑ | AD, ALS | suppression of BACE1, enzyme for Aβ generation |
| hsa-miR-484 | 3 | ↑ | n.d. | n.d. | ↓↓ | n.d. | n.d. | n.d. | no data | regulation of neuronal apoptosis |
| hsa-let-7a-5p | 2 | ↑ | n.d. | n.d. | n.d. | n.d. | n.d. | ↑ | AD, PD, ALS | differentiation of neural stem cells |
| hsa-let-7c-5p | 2 | ↑ | n.d. | n.d. | n.d. | n.d. | n.d. | ↑ | PD | regulation of neural stem cell differentiation |
| hsa-let-7d-5p | 2 | ↑ | n.d. | n.d. | n.d. | n.d. | n.d. | ↑ | AD, PD, ALS | regulation of neural cell fate and neurogenesis |
| hsa-let-7i-5p | 2 | ↑ | n.d. | n.d. | n.d. | n.d. | n.d. | ↑ | AD, PD, ALS | protection against brain damage |
| hsa-miR-20a-5p | 2 | ↑ | n.d. | n.d. | n.d. | n.d. | n.d. | ↑ | AD | protection against neurotoxicity |
| hsa-miR-21-5p | 2 | n.d. | n.d. | n.d. | n.d. | ↑ | n.d. | ↑ | AD, PD | protection against neuronal damage |
| hsa-miR-27a-3p | 2 | ↑ | n.d. | n.d. | n.d. | n.d. | n.d. | ↑ | AD | regulator of tight junction at brain endothelium |
| hsa-miR-30b-5p | 2 | n.d. | ↑ | n.d. | n.d. | ↑ | n.d. | n.d. | AD, PD, ALS | protection against neurotoxicity |
| hsa-miR-30d-5p | 2 | ↑ | n.d. | n.d. | n.d. | n.d. | n.d. | ↑ | AD, PD | regulation of neuronal autophagy and apoptosis |
| hsa-miR-96-5p | 2 | ↑ | n.d. | n.d. | n.d. | n.d. | n.d. | ↑ | PD, ALS | regulation of neuronal glutathione level |
| hsa-miR-100-5p | 2 | n.d. | n.d. | ↓ | n.d. | n.d. | ↑ | n.d. | AD | leading microglial accumulation |
| hsa-miR-103a-3p | 2 | ↑↑ | n.d. | n.d. | n.d. | n.d. | n.d. | n.d. | AD, PD, ALS | promotion neural outgrowth |
| hsa-miR-107 | 2 | ↑↑ | n.d. | n.d. | n.d. | n.d. | n.d. | n.d. | AD | prevention of Aβ -induced neurotoxicity |
| hsa-miR-127-3p | 2 | n.d. | n.d. | n.d. | ↓ | ↓ | n.d. | n.d. | AD | regulation of neuronal autophagy |
| hsa-miR-129-2-3p | 2 | n.d. | n.d. | n.d. | ↓ | ↓ | n.d. | n.d. | no data | targeting GABAA receptor to protect epilepsy |
| hsa-miR-130a-3p | 2 | ↑ | n.d. | n.d. | n.d. | n.d. | n.d. | ↑ | PD, ALS | promotion of the neuronal differentiation |
| hsa-miR-132-3p | 2 | n.d. | n.d. | n.d. | ↓↓ | n.d. | n.d. | n.d. | AD, PD, ALS, HD | regulation of neuronal differentiation, maturation and functioning |
| hsa-miR-138-5p | 2 | n.d. | n.d. | n.d. | ↓ | ↓ | n.d. | n.d. | AD | control of hippocampal interneuron function |
| hsa-miR-142-5p | 2 | n.d. | n.d. | n.d. | ↑ | n.d. | n.d. | ↑ | AD, PD | improvement of neural differentiation |
| hsa-miR-155-5p | 2 | n.d. | n.d. | n.d. | n.d. | n.d. | ↑ | ↑ | AD, ALS | pro-inflammatory mediator of the central nervous system |
| hsa-miR-181a-5p | 2 | ↑ | n.d. | n.d. | n.d. | n.d. | ↑ | n.d. | AD, PD | promotion of neuronal degeneration |
| hsa-mIR-185-5p | 2 | ↑ | n.d. | n.d. | n.d. | n.d. | ↑ | n.d. | AD | inhibition of neuronal autophagy and apoptosis |
| hsa-miR-191-5p | 2 | ↑ | n.d. | n.d. | n.d. | n.d. | n.d. | ↑ | AD | alleviation of microglial cell injury |
| hsa-miR-219a-2-3p | 2 | n.d. | n.d. | n.d. | ↓ | n.d. | ↑ | n.d. | no data | unknown |
| hsa-miR-339-5p | 2 | ↓↓ | n.d. | n.d. | n.d. | n.d. | n.d. | n.d. | AD | negative regulation of BACE1 activity |
| hsa-miR-371b-3p | 2 | n.d. | ↑ | n.d. | n.d. | ↓ | n.d. | n.d. | no data | unknown |
| hsa-miR-380-3p | 2 | ↓ | n.d. | n.d. | ↓ | n.d. | n.d. | n.d. | AD | enhancement of neurotoxicity |
| hsa-miR-425-5p | 2 | ↑ | n.d. | n.d. | n.d. | n.d. | n.d. | ↑ | AD, ALS | promotion of neuronal necroptosis |
| hsa-miR-486-5p | 2 | ↑ | n.d. | n.d. | ↓ | n.d. | n.d. | n.d. | ALS | targeting NeuroD6, scavenger gene of ROS |
| hsa-mIR-539-5p | 2 | n.d. | n.d. | n.d. | ↓ | n.d. | ↓ | n.d. | no data | inhibition of inflammatory response of neuron |
| hsa-miR-1233-3p | 2 | n.d. | n.d. | n.d. | ↓ | ↓ | n.d. | n.d. | no data | unknown |
| hsa-miR-1290 | 2 | n.d. | n.d. | n.d. | ↑ | ↑ | n.d. | n.d. | no data | regulation of neuronal differentiation |
| hsa-miR-3663-5p | 2 | n.d. | n.d. | n.d. | ↓ | ↓ | n.d. | n.d. | no data | unknown |
| hsa-miR-4428 | 2 | n.d. | n.d. | n.d. | ↑ | ↑ | n.d. | n.d. | no data | unknown |
| hsa-miR-4440 | 2 | n.d. | n.d. | n.d. | ↓ | ↓ | n.d. | n.d. | no data | unknown |
| hsa-miR-4726-3p | 2 | n.d. | ↓ | n.d. | n.d. | ↓ | n.d. | n.d. | no data | unknown |
| hsa-miR-4739 | 2 | n.d. | n.d. | n.d. | ↓ | ↓ | n.d. | n.d. | no data | unknown |
Upward (red highlight) and downward arrows (blue highlight) indicate increased and decreased levels, respectively. The number of arrows represents the number of reports showing miRNA array data for serum, plasma, cerebrospinal fluid (CSF), cerebellum, pons, striatum, or frontal cortex. Abbreviations: Aβ; β-Amyloid, BACE1; β-site Amyloid precursor protein cleaving enzyme 1, GABA; γ-amino butyric acid, AD; Alzheimer’s disease, PD; Parkinson’s disease, ALS; Amyotrophic lateral sclerosis, HD; Huntington’s disease, n.d.; not detected.
Publisher’s Note: MDPI stays neutral with regard to jurisdictional claims in published maps and institutional affiliations. |
© 2022 by the authors. Licensee MDPI, Basel, Switzerland. This article is an open access article distributed under the terms and conditions of the Creative Commons Attribution (CC BY) license (https://creativecommons.org/licenses/by/4.0/).
Share and Cite
MDPI and ACS Style
Kinoshita, C.; Kubota, N.; Aoyama, K. Glutathione Depletion and MicroRNA Dysregulation in Multiple System Atrophy: A Review. Int. J. Mol. Sci. 2022, 23, 15076. https://doi.org/10.3390/ijms232315076
AMA Style
Kinoshita C, Kubota N, Aoyama K. Glutathione Depletion and MicroRNA Dysregulation in Multiple System Atrophy: A Review. International Journal of Molecular Sciences. 2022; 23(23):15076. https://doi.org/10.3390/ijms232315076
Chicago/Turabian StyleKinoshita, Chisato, Noriko Kubota, and Koji Aoyama. 2022. "Glutathione Depletion and MicroRNA Dysregulation in Multiple System Atrophy: A Review" International Journal of Molecular Sciences 23, no. 23: 15076. https://doi.org/10.3390/ijms232315076
Note that from the first issue of 2016, this journal uses article numbers instead of page numbers. See further details here.