Article

The Evidence for Effective Inhibition of INa Produced by Mirogabalin ((1R,5S,6S)-6-(aminomethyl)-3-ethyl-bicyclo [3.2.0] hept-3-ene-6-acetic acid), a Known Blocker of CaV Channels

1
Department of Medical Research, Ditmanson Medical Foundation Chia-Yi Christian Hospital, Chiayi City 60002, Taiwan
2
Department of Ophthalmology, Ditmanson Medical Foundation Chia-Yi Christian Hospital, Chiayi City 60002, Taiwan
3
Department of Physiology, National Cheng Kung University Medical College, Tainan City 70101, Taiwan
4
Institute of Basic Medical Sciences, National Cheng Kung University Medical College, Tainan City 70101, Taiwan
*
Author to whom correspondence should be addressed.
These authors contributed equally to this work.
Int. J. Mol. Sci. 2022, 23(7), 3845; https://doi.org/10.3390/ijms23073845
Submission received: 16 February 2022 / Revised: 28 March 2022 / Accepted: 29 March 2022 / Published: 31 March 2022

Abstract

:
Mirogabalin (MGB, Tarlige®), an inhibitor of the α2δ-1 subunit of voltage-gated Ca2+ (CaV) channels, is used as a way to alleviate peripheral neuropathic pain and diabetic neuropathy. However, to what extent MGB modifies the magnitude, gating, and/or hysteresis of various types of plasmalemmal ionic currents remains largely unexplored. In pituitary tumor (GH3) cells, we found that MGB was effective at suppressing the peak (transient, INa(T)) and sustained (late, INa(L)) components of the voltage-gated Na+ current (INa) in a concentration-dependent manner, with an effective IC50 of 19.5 and 7.3 μM, respectively, while the KD value calculated on the basis of minimum reaction scheme was 8.2 μM. The recovery of INa(T) inactivation slowed in the presence of MGB, although the overall current–voltage relation of INa(T) was unaltered; however, there was a leftward shift in the inactivation curve of the current. The magnitude of the window (INa(W)) or resurgent INa (INa(R)) evoked by the respective ascending or descending ramp pulse (Vramp) was reduced during cell exposure to MGB. MGB-induced attenuation in INa(W) or INa(R) was reversed by the further addition of tefluthrin, a pyrethroid insecticide known to stimulate INa. MGB also effectively lessened the strength of voltage-dependent hysteresis of persistent INa in response to the isosceles triangular Vramp. The cumulative inhibition of INa(T), evoked by pulse train stimulation, was enhanced in its presence. Taken together, in addition to the inhibition of CaV channels, the NaV channel attenuation produced by MGB might have an impact in its analgesic effects occurring in vivo.

1. Introduction

Mirogabalin (MGB, DS-5565, Tarlige®, (1R,5S,6S)-6-(aminomethyl)-3-ethyl-bicyclo [3.2.0]hept-3-ene-6-acetic acid), an orally administered gabapentinoid, is a novel, preferentially selective ligand for the α2δ-1 subunit of voltage-gated Ca2+ (CaV) channels, and has been used in trials for investigations in the treatment of post-herpetic neuralgia, pain associated with fibromyalgia, and diabetic peripheral neuropathic pain [1,2,3,4,5,6,7,8,9,10,11,12,13,14,15,16]. Owing to the considerable research effort, this compound is being investigated for the treatment of peripheral neuropathic pain and fibromyalgia and has demonstrated promising results in patients with diabetic peripheral neuropathy [2,3,4,5,6,9,11,14,15]. Moreover, it has recently been shown to be effective in alleviating anxiety, and in improving cognitive impairments in rats injected repeatedly and intramuscularly with acidic saline [12,13,17]. Based mostly on the potent and long-lasting analgesic effects of MGB, the α2δ-1 subunit of CaV1- and CaV2-type voltage-gated Ca2+ (CaV) channels is considered to play a role in the occurrence of neuropathic pain [3,4,5,7,14,18,19,20]. However, to the best of our knowledge, it is not yet clear whether the presence of MGB has any effects on other types of membrane ionic currents.
The voltage-gated Na+ (NaV) channels are recognized to play a pivotal role in the generation and propagation of action potentials in excitable membranes. The NaV channel protein contains four homologous domains (D1–D4), each with six transmembrane segments (S1–S6). When rapid depolarization is established, NaV channels readily go through rapid transitions from the closed (resting) state to the open state and then swiftly to the inactivated state. Genetic defects (i.e., gain-of-function) in NaV channel inactivation that led to small, sustained Na+ currents (INa) (i.e., late Na+ current [INa(L)]) following the occurrence of action potential firing are recognized to have devastating consequences, including neuropathic pain [21,22,23,24].
Nine pore-forming α-subunits (NaV1.1–1.9) are distributed among excitable mammalian tissues, including central and peripheral nervous systems, and endocrine or heart tissue [25]. The NaV1.7 and NaV1.8 subtypes have emerged as key molecules involved in peripheral pain processing and in the development of an increased pain sensitivity associated with inflammation and tissue injury [26,27,28,29,30]. Several activators or inhibitors have been increasingly reported to preferentially modify the late component of the voltage-gated Na+ current (i.e., INa(L)) [24,31,32,33,34,35,36,37]. However, to date, the issue of whether or how MGB could perturb the magnitude, kinetic gating, or hysteresis of membrane ionic currents (e.g., INa) is poorly characterized.
Therefore, in this study, we intended to determine the possible underlying mechanism of MGB actions on the perturbation on different ionic currents (e.g., INa) residing in excitable cells (e.g., pituitary GH3 lactotrophs). The present investigations obtained in this study highlight the evidence showing that MGB can differentially inhibit the transient (INa(T)) and late (INa(L)) components of INa in a concentration-dependent manner in these cells. In addition to the inhibition of CaV channels, MGB-mediated interference within the activity of the NaV channels will converge to act use-dependently on the magnitude, gating, and hysteresis of INa in different types of excitable cells.

2. Results

2.1. Inhibitory Effect of MGB on Voltage-Gated Na+ Current (INa) Measured from Pituitary GH3 Cells

For the first stage of measurements, we kept cells bathed in Ca2+-free Tyrode’s solution, which contained 10 mM tetraethylammonium chloride (TEA) and 0.5 mM CdCl2, and the electrode used was filled up with a Cs+-containing solution. TEA and CdCl2 were used to block most of the K+ and Ca2+ currents, respectively. In this set of whole-cell current recordings, the tested cell was held at −80 mV, a hyperpolarizing pulse of −100 mV was then applied for 30 ms to precede the depolarizing command voltage from −100 to −10 mV, and such a depolarizing step was then imposed to evoke INa. Under this experimental protocol, we were able to detect the emergence of an inward current (i.e., inward flux of cations) which displayed the rapidly activating and inactivating time course (Figure 1A). In response to a brief rectangular pulse, this type of transient inward current was sensitive to inhibition or stimulation by tetrodotoxin (TTX, 1 μM) or tefluthrin (Tef, 10 μM), respectively; it has hence been identified as a TTX-sensitive voltage-gated Na+ current (INa) [24,32,34,35,36,38]. It is of note that one minute after cells were exposed to MGB, the amplitude of peak INa (or transient INa, [INa(T)]) progressively decreased in combination with a concomitant increase in the inactivation time course of the current. For example, the addition of MGB (10 μM) markedly decreased INa(T) from 729 ± 33 to 442 ± 23 pA (n = 9, p < 0.05). Additionally, the time constant in the slow component of the current inactivation (τinact(S)) was concurrently shortened to 2.2 ± 0.2 ms (n = 9, p < 0.05) from a control of 3.9 ±0.3 ms (n = 9). However, no obvious difference in the fast component of the current inactivation was demonstrated in the presence of MGB. After the washout of the compound, current amplitude returned to 719 ± 29 pA (n = 7, p < 0.05). Moreover, with cell exposure to ranolazine (10 μM), the peak amplitude of INa decreased from 732 ± 33 to 321 ± 18 pA (n = 7, p < 0.05).
The relationship between the MGB concentration and the peak (INa(T)) or late (INa(L)) component of INa evoked in response to abrupt membrane depolarizing was further analyzed and tested. In this stage of the experiments, each cell was rapidly stepped from −100 to −10 mV and the INa(T) or INa(L) measured at different MGB concentrations was collected and then compared. As Figure 1A,B show, the cumulative addition of MGB in the range of 0.3 to 100 μM results in a concentration-dependent reduction in the amplitude of INa(T) and INa(L). According to a modified Hill equation described in Section 4, the IC50 values for the MGB-mediated inhibition of INa(T) and INa(L) were computed to be 19.5 and 7.3 μM, respectively. The data, therefore, reflect that MGB exerts a depressant action on the depolarization activated INa that is concentration-dependently seen in GH3 cells, and that the late component of INa (INa(L)) decreased to a greater extent than the peak component of the current (INa(T)) in its presence.

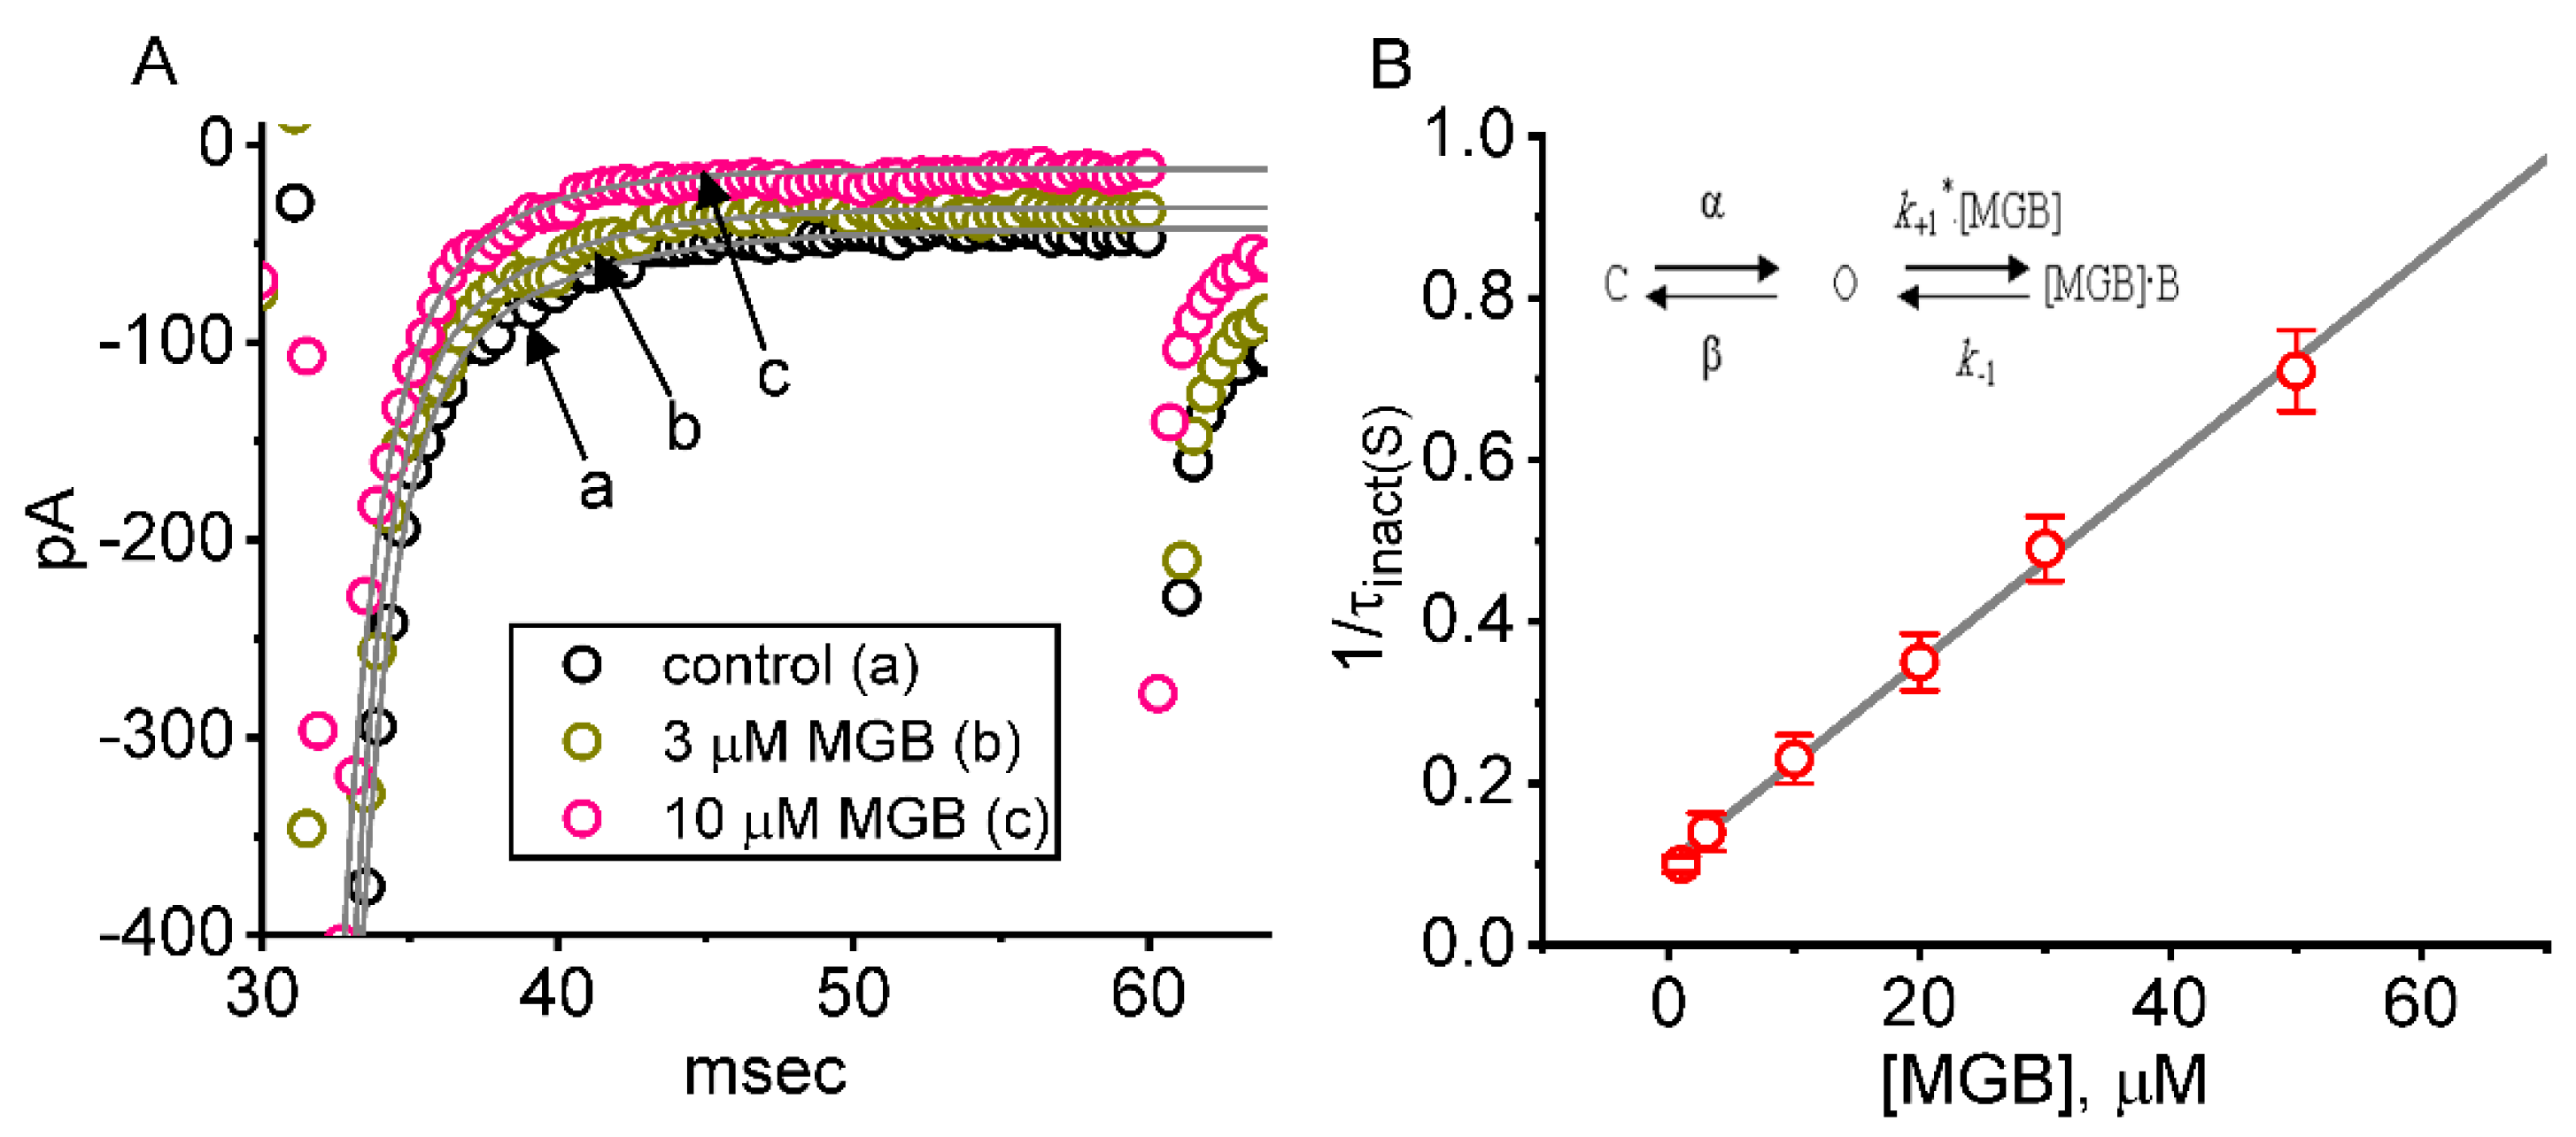
2.2. Kinetic Evaluation of Time-Dependent Block by MGB on INa(T) in GH3 Cells

It was found that increasing the concentration of MGB not only lessened the amplitude of INa(T), but also led to an appreciable raise in the magnitude of current inactivation elicited by rapid membrane depolarization (Figure 2A). We quantitatively measured the inactivation time course of INa(T) at various MGB concentrations. From the first-order binding scheme described in the Supplementary Information, the relationship of 1/τinact(S) versus the MGB concentration became linear (Figure 2B). The forward (on) and backward (off) rate constants were estimated to be 0.124 ms−1μM−1 and 0.102 ms−1, respectively. Consequently, the apparent dissociation constant (i.e., KD = k−1/k+1 *) for the binding of MGB to the voltage-gated Na+ (NaV) channel seen in GH3 cells was estimated to yield 8.2 μM. It is of note that the calculated KD value has a similarity to the effective IC50 needed for MGB to suppress the amplitude of INa(L), although it tends to be measurably smaller than that needed for its reduction in INa(T) amplitude.

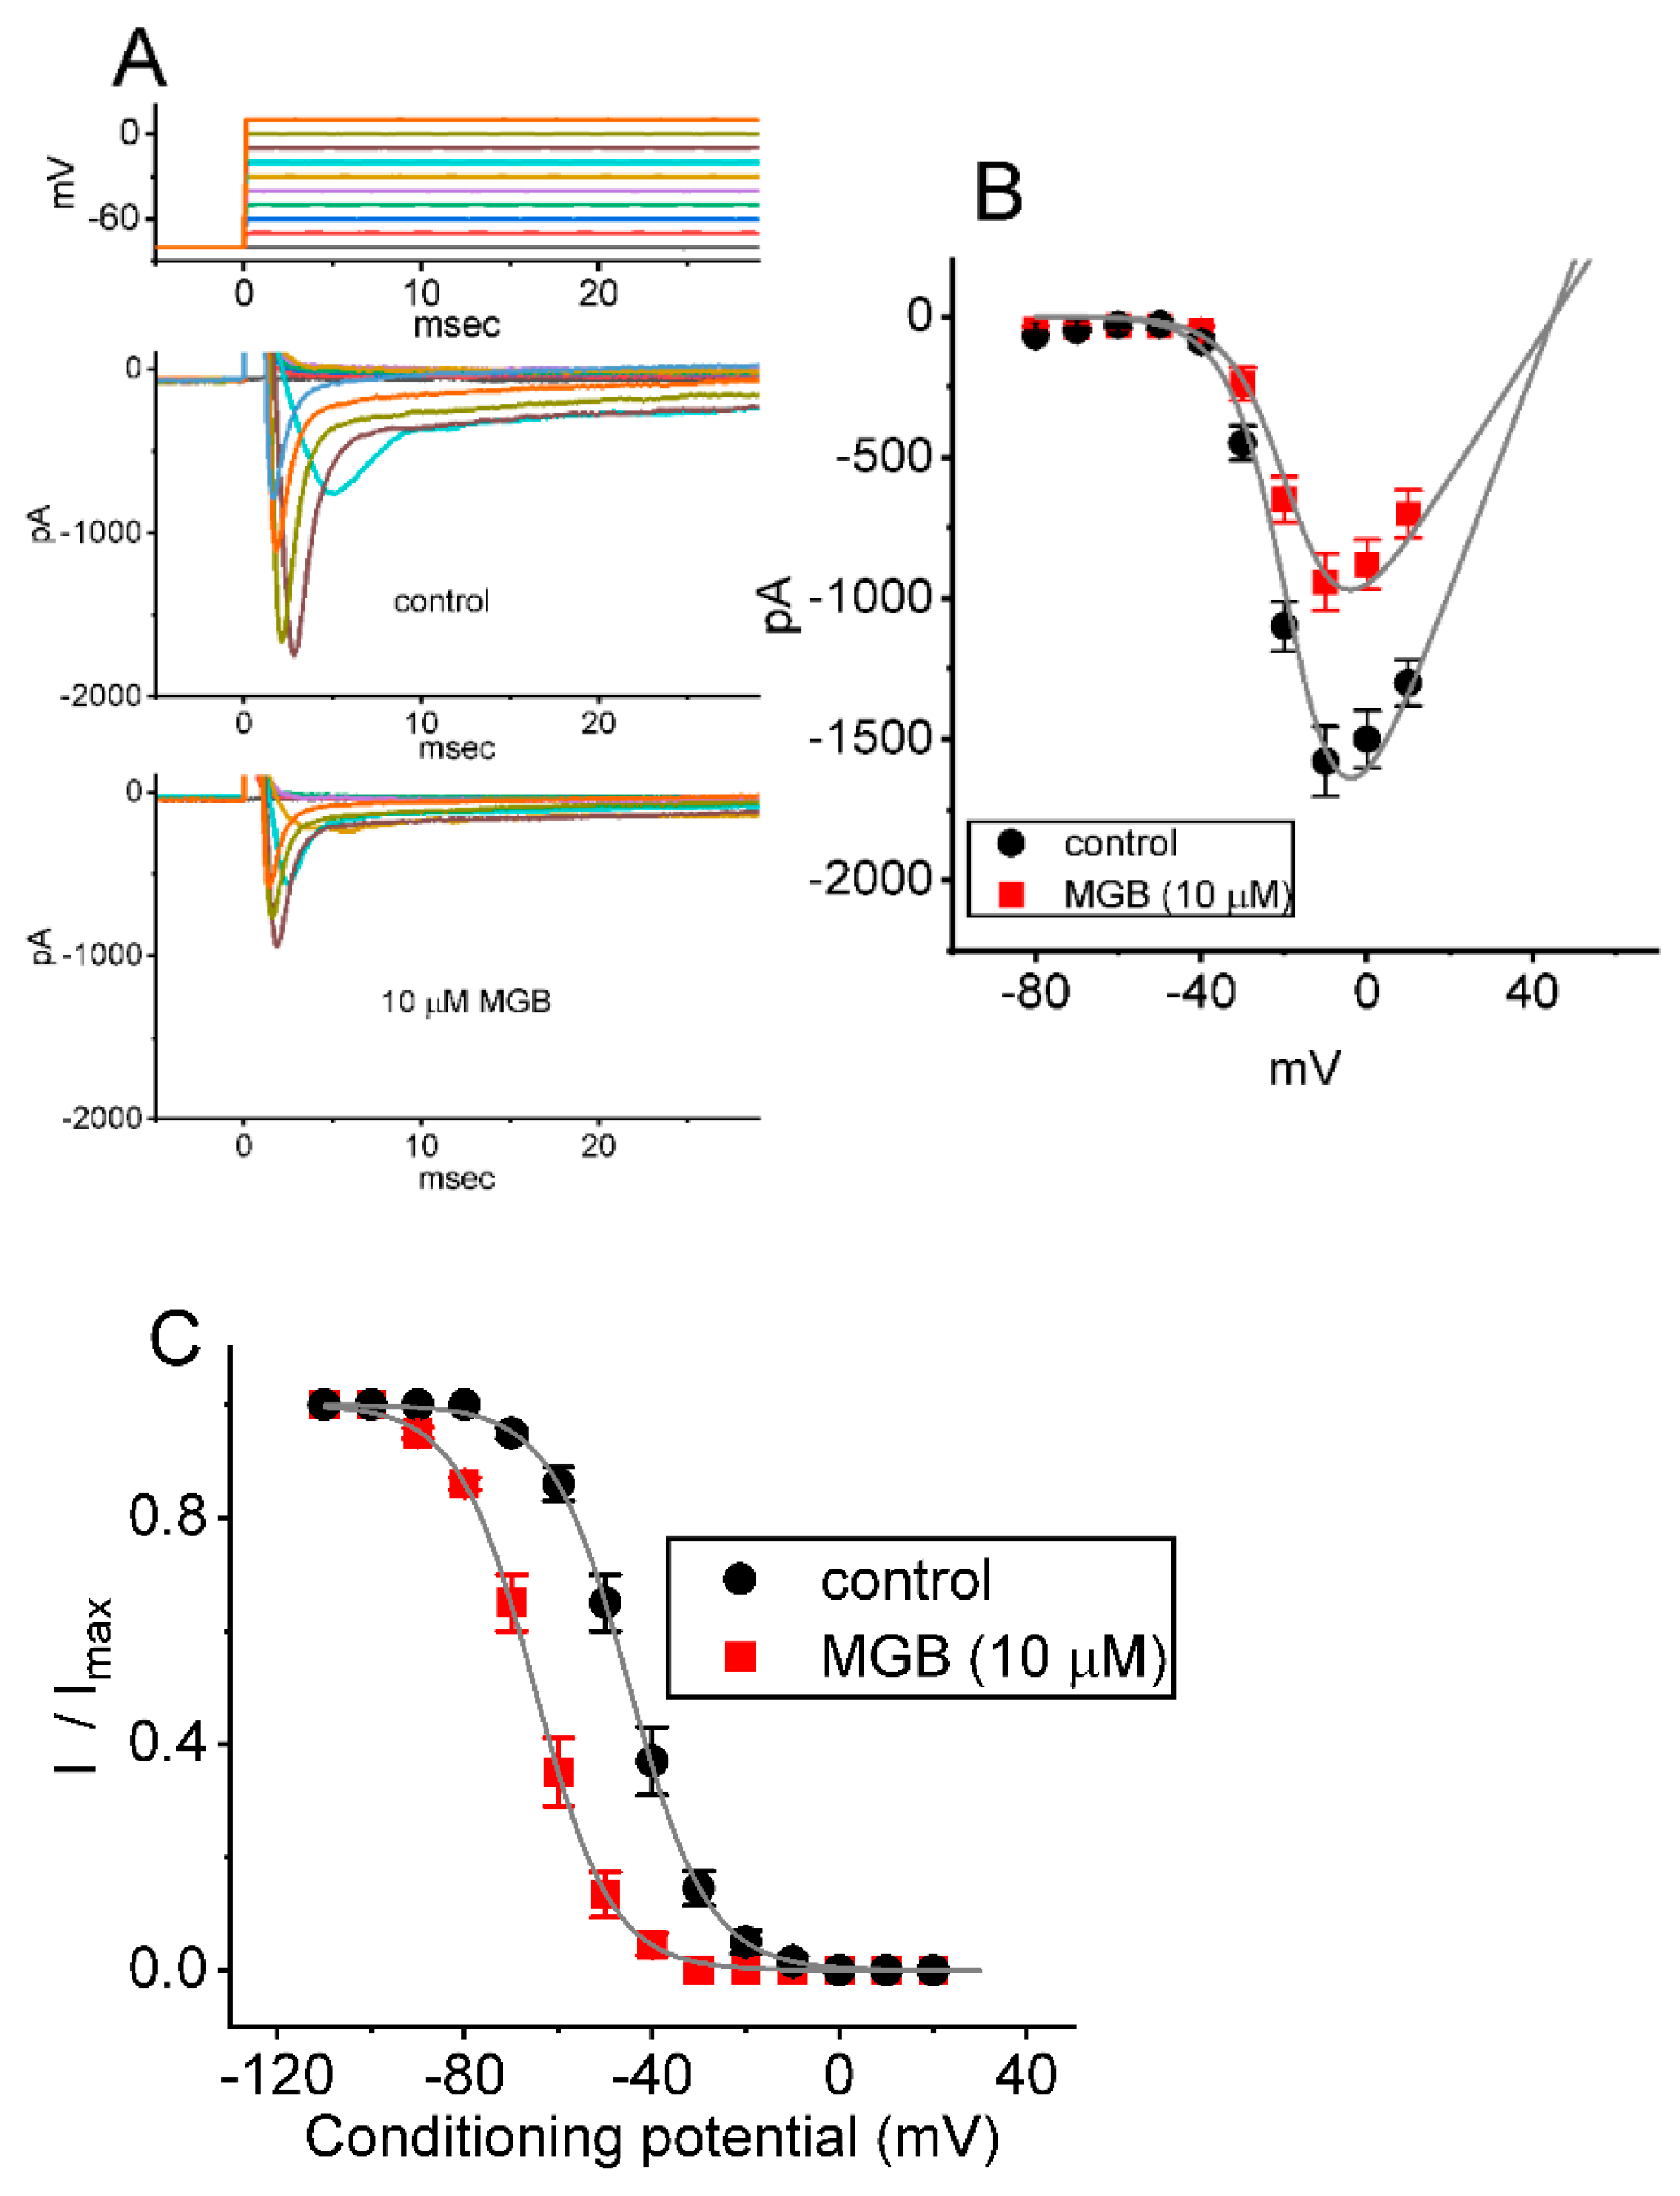
2.3. Mean Current-Voltage (I-V) Relationship of INa(T) Caused by MGB

In the next series of experiments, the INa evoked in response to a series of voltage pulses was examined to test whether the presence of MGB exerts any modifications on INa(T). In these experiments, when the whole-cell configuration was securely established, the tested cell was held at −80 mV, and voltage pulses ranging between −80 and +10 mV in 10-mV steps were applied for a duration of 30 ms. As depicted in Figure 3A,B, cell exposure to MGB at a concentration of 10 μM led to a progressive reduction in INa(T) amplitude, which was concomitantly accompanied by a shortening in the slow component of the inactivation time course of the current (i.e., a decrease in τinact(S) value). The mean I-V relationships of INa(T) acquired in the control period (i.e., in the absence of MGB) and during cell exposure to 10 μM MGB are illustrated in Figure 3B. For example, when the depolarizing command voltage with a range of −80 to −10 mV was applied to the tested cell, the presence of 10 μM MGB evidently lessened the amplitude of INa(T) to 765 ± 88 pA (n = 7, p < 0.05) from a control value of 1749 ± 123 pA (n = 7). After the compound was removed, current amplitude returned to 1728 ± 118 pA (n = 7). Furthermore, the reversal potential of peak INa differed between the absence and presence of MGB. The I-V curves obtained in the control period (i.e., when MGB was not present) and during exposure to 10 μM MGB were fitted with a Boltzmann function as described in Section 4. In the control test, G = 39.1 ± 1.2 nS, Vh = −16.5 ± 1.9 mV, and k = 7.1 ± 0.9 (n = 7), while in the presence of 10 μM MGB, G = 22.9 ± 1.1 nS, Vh = −16.7 ± 1.8 mV, and k = 7.2 ± 0.9 (n = 7). These observations indicate that the existence of MGB exerts a depressant action on INa(T) intrinsically in GH3 cells, and that the overall I-V relationship of INa(T) is unaltered in its presence, although this drug tends to be selective for sustained over peak INa evoked in response to depolarizing command voltages.
In the two-step voltage protocol, the steady-state inactivation curve of INa(T), with or without the application of MGB, was constructed and is hence shown in Figure 3C. In control, V1/2 = −44.8 ± 1.9 mV, and q = 2.9 ± 0.3 e (n = 7), while in the presence of 10 μM MGB, V1/2 = −65.1 ± 2.1 mV, and q = 3.0 ± 0.3 e (n = 7). Therefore, there was a leftward shift along the voltage axis in the inactivation curve of the current by around 10 mV with no change in the gating charge of the curve.

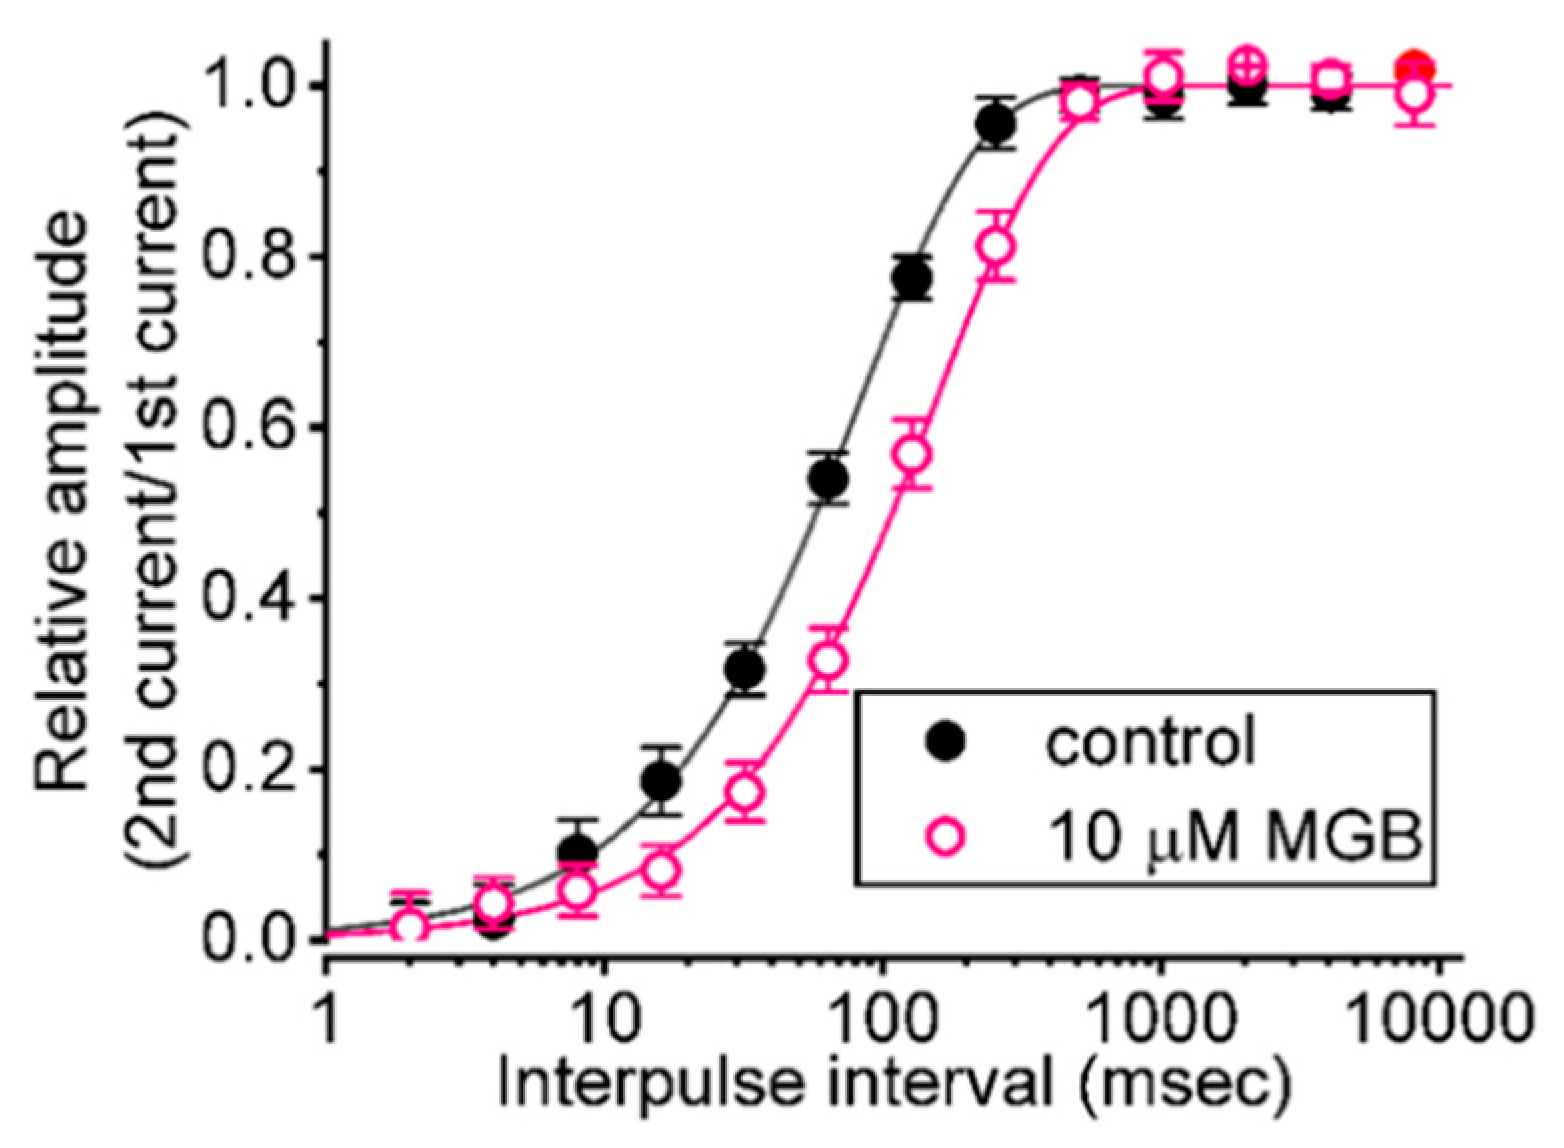
2.4. Effect of MGB on the Recovery from INa(T) Inactivation Evoked during Varying Interpulse Intervals

Next, we examined whether the presence of MGB produces any adjustment on the recovery of INa(T) from inactivation, by responding to a two-step voltage protocol in which the interpulse interval increases with a geometric progression (common ratio = 2). In this protocol, a 30 ms step from −80 to −10 mV (prepulse) was firstly applied to the tested cell, and then another 30 ms step to −10 mV (test pulse) was used to inactivate most of the current by varying the duration of the interval between a prepulse and a test pulse. The recovery from current inactivation at the holding potential of −80 mV was then examined at different times with a geometric progression, as presented semi-logarithmically in Figure 4. In the control period (i.e., in the absence of MGB), the peak amplitude of INa(T) nearly completely recovered from inactivation when the interpulse duration reached approximately 1 s. The time constants of recovery from current inactivation acquired in the absence and presence of 10 μM MGB were least squares fitted by a single-exponential function with the values of 83.2 ± 2.1 and 156.1 ± 5.9 ms (n = 7, p < 0.05), respectively. The experimental observations indicate that there was a conceivable prolongation in the recovery from inactivation of INa(T) as the cells were exposed to MGB.

2.5. Effect of MGB on the Window Component of INa (INa(W)) Measured from GH3 Cells

The presence of instantaneous INa(W) evoked by the ascending (or upsloping) ramp voltage (Vramp) was revealed earlier in a variety of excitable cells [37,38,39,40,41]. Next, we explored whether the MGB presence in GH3 cells could modify the magnitude of INa(W) activated in response to the rapid ascending Vramp. In order to conduct these experiments, the tested cell was voltage-clamped at −80 mV, and we then applied an ascending Vramp from −110 to +50 mV for a duration of 50 ms to evoke INa(W) [37]. As disclosed in Figure 5A,B, within one minute of exposing cells to MGB (10 or 30 μM), the amplitude of INa(W) achieved by the 50-ms upsloping Vramp decreased strikingly. For example, the presence of 10 μM MGB strikingly reduced the area of INa(W) measured at the voltage between −40 and +40 mV from 21.2 ± 3.0 to 13.3 ± 2.5 mV·nA (n = 7, p < 0.05). After the drug was removed, current amplitude returned to 20.7 ± 3.1 mV·nA (n = 7). The summary bar graph presented in Figure 5B shows that the addition of MGB is effective in decreasing the INa(W) area, and that the subsequent addition of 10 μM tefluthrin (Tef), an insecticide known to be an activator of INa [32,42], overcomes the MGB-mediated reduction in the Vramp-induced INa(W) areas. Moreover, the presence of tetrodotoxin (TTX, 1 μM) effectively suppresses the INa(W) area, while that of nimodipine, an inhibitor of L-type Ca2+ currents, fails to have any effect on it. Tefluthrin was not shown to be an activator of CaV channels. The results noted here mean that MGB-mediated suppression of the INa(W) area is not mediated through its inhibitory effect on CaV channels.

2.6. Suppressive Effect of MGB on Resurgent INa (INa(R)) Seen in GH3 Cells

The INa(R) was identified earlier in GH3 cells [32,33], and the magnitude of the current is strongly linked to high-frequency firing observed in Purkinje neurons [43]. In parallel with earlier observations in neurons or endocrine cells [33,44], this type of current is unique in that it is not detectable until the membrane potential is repolarized below 0 mV. In addition to being activated by depolarizing voltage steps rather than by repolarizing voltage steps, INa(R) was observed to activate and decay more slowly than INa(T). The INa(R) is thought to help produce rapid depolarization immediately after an action potential; hence, it is suited either for cells that fire spontaneously at a higher firing rate, or to offer noise modulation in bursting neurons [43,44,45,46]. For these reasons, we additionally investigated whether MGB could exercise any perturbations on such instantaneous current evoked by the descending Vramp. As the whole-cell configuration was securely established, the 30 ms depolarizing step from −100 to +30 mV followed by a descending (or repolarizing) Vramp to −80 mV was imposed on the examined cell for a duration of 60 ms. As depicted in Figure 6A,B, the INa(R) amplitude activated by such voltage-clamp protocol evidently reduced during GH3 cell exposure to MGB. For example, the presence of MGB at a concentration of 3 or 10 μM MGB led to a decrease of INa(R) at −20 mV from 298 ± 34 pA to 156 ± 28 pA (n = 7, p < 0.05) or 102 ± 15 pA (n = 7, p < 0.05), respectively. The further addition of Tef (10 μM), still in the presence of 10 μM MGB, restored the INa(R) amplitude at the same level to 254 ± 32 pA (n = 7, p < 0.05). However, neither further application of nimodipine (1 μM), nor CdCl2 (0.5 mM), exerted any effects on MGB-inhibited INa(R) in the GH3 cells (155 ± 27 pA [in the presence of 3 μM MGB plus nimodipine], 156 ± 29 pA [in the presence of 3 μM MGB plus CdCl2], versus 156 ± 28 pA [in the presence 3 μM MGB alone]; n = 7, p < 0.05). It follows, therefore, that the addition of MGB is capable of suppressing INa(R) in these cells.

2.7. Effect of MGB on the Hysteretic Behavior of Persistent Na+ Current (INa(P)) Triggered by Isosceles Triangular Ramp Voltage (Vramp)

Earlier investigations revealed the capability of the Vhys strength in INa(P) to affect electrical behaviors in many types of excitable cells [32,35,36,47,48]. Therefore, we attempted to determine whether and how the presence of MGB could modify the INa(P) strength activated in response to a long-lasting upright isosceles triangular Vramp. In this series of experiments, during the control period or cell exposure to MGB, we voltage-clamped the examined cell at −80 mV, and an upsloping (ascending) limb from −100 to +50 mV, followed by a downsloping (descending) limb back to −100 mV (i.e., upright isosceles triangular Vramp) was applied to it for a duration of 8 s (Figure 7A). As demonstrated earlier [35], under these experimental conditions, the voltage-dependent hysteresis (Vhys) of INa(P) in response to this triangular Vramp was observed as a striking figure-of-eight (i.e., ∞-shaped) hysteresis in the instantaneous I-V relationship of INa(P) (Figure 7A). In other words, there are two distinct loops; that is, the INa(P) amplitude at a high- (i.e., in a counterclockwise direction) threshold loop and at a low- (i.e., in a clockwise direction) threshold loop, activated by the upsloping and downsloping limbs of the upright isosceles triangular Vramp. Of notable interest, as shown in Figure 7B,C, during cell exposure to 3 or 10 μM MGB, the strength of current responding to both rising (i.e., high threshold amplitude) and falling (i.e., low threshold amplitude) limbs of isosceles triangular Vramp progressively reduced. For example, on the upright isosceles triangular Vramp, the amplitude activated by the ascending ramp at the level of −10 mV in the presence of 3 or 10 μM MGB decreased, respectively, to 89 ± 10 pA (n = 7, p < 0.05) or 58 ± 8 pA (n = 7, p < 0.05) from a control value of 112 ± 12 pA (n = 7). Likewise, cell exposure to 3 or 10 μM MGB resulted in a measurable decrease in the INa(P) amplitude evoked by the descending ramp at −80 mV to 165 ± 27 pA (n = 7, p < 0.05) or 129 ± 19 pA (n = 7, p < 0.05), respectively, from a control value of 232 ± 32 pA (n = 7). As such, the findings from this data enabled us to propose an emergence of Vhys behavior for INa(P) activation in response to the upright isosceles triangular Vramp in GH3 cells, and that the hysteretic strength of the current was measurably reduced by increasing MGB concentration.

2.8. MGB-Induced Increase in Cumulative Inhibition of INa(T) Inactivation

INa(T) inactivation was shown to accumulate prior to being activated during repetitive short pulses in previous studies [49,50]. Therefore, additional measurements were taken to study whether the presence of MGB could adjust the inactivation process of the current elicited in a train of depolarizing stimuli. The examined cell was voltage-clamped at −80 mV, and the stimulus protocol, consisting of repetitive depolarization to −10 mV (20 ms in each pulse with a rate of 40 Hz for 1 s), was imposed on it. In keeping with recent observations [50], as depicted in Figure 8A–C, in the control period (i.e., in the absence of MGB), the INa(T) inactivation seen in GH3 cells was evoked by a 1 s repetitive depolarization from −80 to −10 mV with an inactivation time constant of 54.3 ± 4.9 ms (n = 7), i.e., showing a sudden current decay with a single-exponential process. It is of interest that during exposure to MGB, at a concentration of either 3 or 10 μM MGB, the exponential time course of INa evoked by the same train of depolarizing pulses shortened to 29.2 ± 3.1 ms (n = 7, p < 0.05) or 12.2 ± 2.5 ms (n = 7, p < 0.05), respectively, in addition to a reduction in INa(T) amplitude. As cells were continually exposed to 10 μM MGB, the subsequent addition of Tef (10 μM) reversed the MGB-mediated decrease of current decay with a time constant of 31.2 ± 3.5 ms (n = 7, p < 0.05). Overall, the results indicate that, apart from the decrease in current magnitude, during cell exposure to MGB the decrease in the decaying of INa(T) elicited by a 1 s train of depolarizing pulses (i.e., accumulative inactivation of the current) can be enhanced in these cells.

3. Discussion

The promising findings from this study are that: (a) the existence of MGB depresses INa in a concentration, time-, state-, use-, and hysteresis-dependent manner as identified in GH3 cells; (b) this drug resulted in the differential inhibition of INa(T) and INa(L) activated by short step depolarization with the IC50 value of 19.5 and 7.3 μM, respectively; (c) the KD value of the MGB-induced increase in current inactivation, estimated according to the first-order binding scheme, was 8.2 μM; (d) MGB did not modify the overall I-V relationship of INa(T) but the recovery of INa(T) inactivation was prolonged in its presence, while the drug effectively suppressed INa(W) and INa(R) evoked by ascending or descending Vramp, respectively; (e) the MGB addition depressed the high- or low-threshold amplitude of INa(P) elicited by the isosceles triangular Vramp at either the upsloping or downsloping limb, respectively; and (f) the cumulative inhibition of INa evoked in response to a train of depolarizing pulses was enhanced in the presence of MGB. Collectively, the present observations show that MGB-mediated changes in the magnitude, gating properties, use-dependence, and hysteretic behavior of INa would potentially modify the functional activities of excitable cells (e.g., GH3 cells), presuming that similar in vivo findings are observed.
Perhaps more notable than the issue concerning the magnitude of the MGB-induced reduction in INa, is the observation of the non-linear Vhys of INa(P) in the control period (i.e., in the absence of MGB) and during cell exposure to MGB, by use of the upright isosceles triangular Vramp, created through digital-to-analog conversion [47]. During cell exposure to MGB, the peak INa(P) activated by the ascending (upsloping) limb of the triangular Vramp decreased, particularly at the level of −10 mV, while the INa(P) amplitude at the descending (downsloping) limb reduced at the level of −80 mV. In this scenario, the instantaneous figure-of-eight (i.e., infinity-shaped: ∞) residing in the Vhys loop that is activated in response to such triangular Vramp appeared indicating that, as the time goes by during activation, there is a counterclockwise direction in the high-threshold loop (i.e., the relationship of current amplitude as a function of membrane potential), followed by a clockwise direction in the low-threshold loop. In other words, there appears to be two types of Vhys loop, that is, a high-threshold loop with a peak at −10 mV (i.e., activating at a voltage range near the maximal INa(T) evoked by brief step depolarization), and a low-threshold loop with a peak at −80 mV (i.e., activating at a voltage near the resting potential). The addition of MGB was able to reduce the Vhys strength of INa(P). Therefore, findings from these observations reveal that the triangular Vramp-induced INa(P) undergoes striking Vhys change in the voltage dependence, and that such Vhys loops are subjected to attenuation by adding MGB. On the other hand, it needs to be noted that the Vhys behavior presented here could be strongly linked to the magnitude of sodium background currents as reported previously [21,48]. Further research should be conducted to understand if MGB-mediated changes in Vhys behavior are tightly linked to conformational changes in the voltage sensors of the channel [47].
In this study, the decline of INa(T) during a 40 Hz train of depolarizing pulses (i.e., 20 ms pulses applied from −80 to −10 mV at a rate of 40 Hz for a duration of 1 s) becomes pronounced in the presence of MGB, reflecting that there is use-dependence of INa(T) during repetitive depolarization as recently demonstrated [50], and that cell exposure to MGB would result in a loss-of-function change caused by the altered, quicker inactivation of the current. Therefore, the MGB-mediated decrease of INa(T) is strongly linked to substantial use-dependent facilitation in INa(T) during pulse train stimulation.
An earlier report shows that L-type Ca2+ channel activation can up-regulate the mRNAs for two different NaV channels α subunits (NaV1.2 and NaV1.3) in GH3 cells [51]. It is thus postulated that an MGB-induced block of INa seen in GH3 cells could be due, in part, to its inhibitory effect on voltage-gated Ca2+ currents that are functionally expressed in excitable cells, including GH3 cells [52]. However, under our experimental conditions, the voltage-activated inward currents shown herein were either sensitive to stimulation by Tef or subjected to inhibition by TTX and ranolazine. Tef and ranolazine have been reported to be activators or inhibitors of INa, respectively [24,32]. In the continued presence of MGB, further addition of Tef could reverse its suppression of INa(W) or INa(R). It has been previously demonstrated that INa(W) and INa(R) are responsible for the electrical firing of excitable cells [38,40,43]. Moreover, neither the presence of nimodipine nor CdCl2 effectively suppressed such inward currents in GH3 cells. Therefore, it is conceivable that the INa (INa(L), INa(W), INa(R) and INa(P)) in GH3 cells is susceptible to being inhibited by MGB, and that its block on INa(L) is actually larger than its block on INa(T). Moreover, the reduction in INa(L) caused by a blocker such as ranolazine can lead to a diminution in Ca2+ overload by increasing the driving force for Ca2+ extrusion through the Na+-Ca2+ exchanging process that is functioning in reverse mode (i.e., in a mechanism that operates to extrude Ca2+, in exchange for the influx of Na+) [53,54]. The mRNA transcripts for the α-subunits of NaV1.1, NaV1.2, and NaV1.6 were demonstrated to be present in GH3 cells [55]. However, it remains to be determined to what extent MGB can modify INa (e.g., NaV1.7 and NaV1.8) in dorsal root ganglion neurons, even though such an action could be important for explaining its analgesic potential.
It needs to be emphasized that ranolazine, an inhibitor of INa(L), has been demonstrated to be of benefit for peripheral or diabetic neuropathy [56,57,58,59]. This drug has also been revealed to have modifications on changes in peripheral nerve excitability [24,57,58,60,61,62]. As a corollary, it is tempting to anticipate that MGB-mediated alleviation of painful sensation could be partly, if not entirely, attributable to the inhibitory action on different types of INa. While the detailed ionic mechanism of its inhibitory action on the NaV channel is not entirely clear, the MGB molecule may have the propensity to exert a higher effect on the open/inactivated state than on the resting (closed) state residing in the channel, thereby de-stabilizing the open conformation.
Earlier pharmacokinetic studies show that a peak plasma concentration of MGB reached 1000 ng/mL (4.8 μM) one hour after oral administration of 75 mg [63,64]. The effects of MGB on membrane excitability could be likewise dependent on various factors, such as the MGB concentration used, various firing patterns of action potentials [40,43,45], the level of pre-existing resting potential, and in any combinations. It has been noted that some isoforms of the NaV channel α-subunit were engaged in inflammatory pain states, and they were functionally expressed by somatosensory primary afferent neurons, but not by skeletal or cardiovascular muscle [24,65]. We hitherto demonstrated that the MGB action on excitable membranes is not solely explained by its aberrant use as a blocker on α2δ subunit of CaV channels [1,2]. The activity of NaV channels in excitable cells may noticeably confer the susceptibility to perturbations by MGB or its structurally similar compounds.

4. Materials and Methods

4.1. Chemicals, Drugs and Solutions Used in This Work

Mirogabalin (MGB, Tarlige®, DS-5565, (1R,5S,6S)-6-(aminomethyl)-3-ethyl-bicyclo [3.2.0] hept-3-ene-6-acetic acid, C12H19NO2, CAS No.: 1138245-13-2, purity: ≥98%), was from Cayman Chemical (Genechain Industrial, Kaohsiung, Taiwan), while nimodipine, ranolazine, tefluthrin (Tef), tetraethylammonium chloride (TEA), and tetrodotoxin (TTX) were from Sigma (Merck, Taipei, Taiwan). Unless specified otherwise, cell culture media (e.g., Ham’s F-12 medium), horse serum, fetal calf serum, L-glutamine, and trypsin/EDTA were supplied by HyCloneTM (Merck, Kenilworth, NJ, USA). All other chemicals, such as CdCl2, CsCl, CsOH, HEPES, and aspartic acid were of the best available quality, mostly at analytical grades.
The ionic composition of extracellular solution (i.e., HEPES-buffered normal Tyrode’s solution) was as follows (in mM): NaCl 136.5, KCl 5.4, CaCl2 1.8, MgCl2 0.53, glucose 5.5, and HEPES 5.5 (pH 7.4 adjusted with NaOH). To record K+ currents, the electrode was filled up the internal solution containing (in mM): K-aspartate 130, KCl 20, KH2PO4 1, MgCl2 1, EGTA 0.1, Na2ATP 3, Na2GTP 0.1, and HEPES 5 (pH 7.2 adjusted with KOH). To measure Na+ currents, we replaced K+ ions inside the pipette solution with equimolar Cs+ ions, and the pH was titrated to 7.2 by adding CsOH. All solutions were prepared using deionized water which was produced by a Milli-Q water purification system (Merck, Kenilworth, NJ, USA).

4.2. Cell Culture

GH3, a clonal cell line derived from a rat prolactin-secreting pituitary tumor, was acquired from the Bioresources Collection and Research Center (Hsinchu, Taiwan), and the detailed methodology was described earlier [66]. Briefly, cells were maintained in Ham’s F-12 medium (HyCloneTM, Logan, UT, USA) with 15% (v/v) heat-inactivated horse serum, 2.5% (v/v) fetal calf serum, and 2 mM L-glutamine (HyCloneTM, Logan, UT, USA) in a humidified atmosphere of CO2/air (1:19). The culture medium was changed every 2 to 3 days, and cells were passaged when they reached confluence. Cell viability was evaluated using WST-1 assay (Roche Diagnostics, Taipei, Taiwan). To promote differentiation, cells were transferred to a serum-free, Ca2+-free medium. Under these experimental conditions, cells remained 80 to 90% viable for at least 2 weeks. The measurements were conducted 5 or 6 days after cells were grown to 60–80% confluence.

4.3. Electrophysiological Measurements

Before the experiments, we gently dispersed cells with a 1% trypsin/EDTA solution, and an aliquot of cell suspension was directly placed in a recording chamber attached to the fixed-stage of a DM-IL inverted microscope (Leica; Highrise Instrument, Taichung, Taiwan). Cells were immersed at room temperature (20–25 °C) in normal Tyrode’s solution containing 1.8 mM CaCl2. The electrodes that we used were fabricated from Kimax-51 capillaries (Merck, Taipei, Taiwan) using a PP-83 vertical puller (Narishige; Taiwan Instrument, Tainan, Taiwan), and their tips were thereafter fire-polished with an MF-83 microforge (Narishige; Taiwan Instrument, Tainan, Taiwan). As the electrodes were filled with the different internal solutions described above, their resistance was measured to range between 3 and 5 MΩ, for the purpose of avoiding excessive damage to the cell. Patch-clamp recordings were carried out in whole-cell configuration using either an RK-400 (Bio-Logic, Claix, France) or an Axopatch-200B amplifier (Molecular Devices; Bestgen Biotech, New Taipei City, Taiwan), as described elsewhere [31,37,52,67]. Whole-cell recording was achieved by rupturing the patch of membrane isolated with GΩ sealing by the patch pipet, which brings the cell interior into contact with the pipet interior.

4.4. Data Recordings and Analyses

The signals were simultaneously monitored with a digital oscilloscope (Gould, Chandler, AZ, USA) and a liquid crystal display projector (ViewSonic, Walnut, CA, USA). The data were stored online in a Sony VAIO CS series laptop computer (VGN-CS110E; Tainan, Taiwan), equipped with 1440A digitizer (Molecular Devices). During the measurements with analog-to-digital and digital-to-analog conversion, the latter device was controlled by pCLAMP 10.6 software (Molecular Devices) run on Microsoft Windows 7 (Redmond, WA, USA). The laptop computer used was put on the top of an adjustable Cookskin stand (Ningbo, Zhejiang, China) for convenient manipulation during the experiments. To ensure digitalization, in some sets of measurements, we collected current signals by PowerLab 2/26 acquisition system (ADInstruments; Kuo Yang, Taipei, Taiwan).
To better evaluate the concentration–response curve of MGB-mediated inhibition on the peak (transient, INa(T)) and sustained (late, INa(L)) components of INa, INa were evoked by 30 ms depolarizing pulse to −10 mV from a holding potential of −100 mV, and current amplitudes taken with or without the application of different MGB concentrations (0.3–100 μM) were measured at the start (INa(T)) and end pulse (INa(L)) of the depolarizing pulse. The concentration required to inhibit 50% of current amplitude was determined according to the three-parameter logistic model (i.e., a modified form of sigmoidal Hill equation) by use of goodness-of-fit assessments:
R e l a t i v e   a m p l i t u d e = [ M G B ] n H × ( 1 a ) [ M G B ] n H + I C 50 n H + a
where, nH = the Hill coefficient (i.e., the number bound per side); IC50 = the concentration required for a 50% inhibition); and [MGB] = the MGB concentration. Maximal inhibition (i.e., 1 − a) was approximated in this equation.
The I-V relationship of INa(T) with or without addition of MGB was constructed and thereafter fitted with a Boltzmann function given by:
I I m a x = G 1 + e x p [ ( V V h ) / k ] × ( V E r e v )
where V is the membrane potential in mV, Erev the reversal potential of INa (fixed at +45 mV), G the Na+ conductance in nS, and I the current in pA, while k and Vh are the gating parameters.
To evaluate the steady-state inactivation of INa(T) with or without the existence of MGB, a two-step voltage protocol was created and delivered to the tested cells. A 30 ms conditioning pulse to various membrane potentials preceded the test pulse (30 ms in duration) to −10 mV from a holding potential of −80 mV. The relationship between the normalized amplitude of INa(T) and the conditioning potentials was appropriately fitted with another Boltzmann function of the following form:
I I m a x = 1 1 = e x p [ ( V V 1 2 ) q F / R T ]
where Imax is the maximal amplitude of INa(T), V1/2 the voltage at which half-maximal inhibition occurs, q the apparent gating charge of the inactivation curve, F Faraday’s constant, R the universal gas constant, and T the absolute temperature.
The kinetic evaluation of the MGB-mediated effect on INa(T) inactivation is provided in the Supplementary Information.

4.5. Curve-Fitting Procedures and Statistical Analyses

Linear or nonlinear curve fitting to experimental data sets in this study was undertaken with the interactive least squares procedure by using different maneuvers, such as Microsoft Excel®-embedded “Solver” (Microsoft, Redmond, WA, USA) and OriginPro® 2021 program (OriginLab; Scientific Formosa, Kaohsiung, Taiwan). The averaged results are presented as the mean ± standard error of the mean (SEM) with the sizes of observations (n) indicating the cell numbers from which samples were taken. The paired or unpaired Student’s t-tests between the two groups were applied. When the differences among different groups were encountered, we performed either analysis of variance (ANOVA)-1 or ANOVA-2 with or without repeated measures followed by post-hoc Fisher’s least significant difference test. Statistical analyses were made using the SPSS 20 package (IBM; Tainan, Taiwan). Statistical significance (indicated with * in the figures) was determined at a p value of < 0.05.

Supplementary Materials

The following supporting information can be downloaded at: https://www.mdpi.com/article/10.3390/ijms23073845/s1.

Author Contributions

Conceptualization, S.-N.W., C.-L.W., C.-W.C., H.-Y.C. and T.-H.C.; methodology, S.-N.W.; software, S.-N.W.; validation, C.-L.W., C.-W.C., H.-Y.C., T.-H.C. and S.-N.W.; formal analysis, S.-N.W.; investigation, H.-Y.C., T.-H.C. and S.-N.W.; resources, S.-N.W.; data curation, S.-N.W.; writing—original draft preparation, S.-N.W.; writing—review and editing, C.-L.W., C.-W.C., H.-Y.C., T.-H.C. and S.-N.W.; visualization, H.-Y.C., T.-H.C. and S.-N.W.; supervision, C.-L.W., C.-W.C. and S.-N.W.; project administration, C.-L.W., C.-W.C. and S.-N.W.; funding acquisition, C.-L.W., C.-W.C. and S.-N.W. All authors have read and agreed to the published version of the manuscript.

Funding

This work was supported in part by the Ministry of Science and Technology (MOST-110-2320-B-006-028), Taiwan; Ditmanson Medical Foundation Chia-Yi Christian Hospital.

Institutional Review Board Statement

Not applicable.

Informed Consent Statement

Not applicable.

Data Availability Statement

The original data is available upon reasonable request to the corresponding author.

Acknowledgments

The authors are grateful to Zi-Han Gao for her zealous assistance with earlier experiments.

Conflicts of Interest

The authors have no conflicts of interest to disclose. The content and writing of this paper are solely the responsibility of the authors.

Abbreviations

CaV channelvoltage-gated Ca2+ channel
I-Vcurrent versus voltage
IC50concentration required for 50% inhibition
INavoltage-gated Na+ current
INa(L)late Na+ current
INa(P)persistent Na+ current
INa(R)resurgent Na+ current
INa(T)transient Na+ current
INa(W)window Na+ current
KDdissociation constant
MGBmirogabalin (Tarlige®, 1R,5S,6S)-6-(aminomethyl)-3-ethyl-bicyclo [3.2.0] hept-3-ene-6-acetic acid)
NaV channelvoltage-gated Na+ channel
SEMstandard error of the mean
TEAtetraethylammonium chloride
Teftefluthrin
TTXtetrodotoxin
Vhysvoltage-dependent hysteresis
Vrampramp voltage

References

  1. Calandre, E.P.; Rico-Villademoros, F.; Slim, M. Alpha2delta ligands, gabapentin, pregabalin and mirogabalin: A review of their clinical pharmacology and therapeutic use. Expert Rev. Neurother. 2016, 16, 1263–1277. [Google Scholar] [CrossRef] [PubMed]
  2. Hutmacher, M.M.; Frame, B.; Miller, R.; Truitt, K.; Merante, D. Exposure-response modeling of average daily pain score, and dizziness and somnolence, for mirogabalin (DS-5565) in patients with diabetic peripheral neuropathic pain. J. Clin. Pharm. 2016, 56, 67–77. [Google Scholar] [CrossRef] [PubMed]
  3. Domon, Y.; Kitano, Y.; Makino, M. Analgesic effects of the novel α2δ ligand mirogabalin in a rat model of spinal cord injury. Pharmazie 2018, 73, 659–661. [Google Scholar] [PubMed]
  4. Domon, Y.; Arakawa, N.; Inoue, T.; Matsuda, F.; Takahashi, M.; Yamamura, N.; Kai, K.; Kitano, Y. Binding characteristics and analgesic effects of mirogabalin, a novel ligand for the α2δ subunit of voltage-gated calcium channels. J. Pharm. Exp. 2018, 365, 573–582. [Google Scholar] [CrossRef] [Green Version]
  5. Javed, S.; Alam, U.; Malik, R.A. Mirogabalin and emerging therapies for diabetic neuropathy. J. Pain Res. 2018, 11, 1559–1566. [Google Scholar] [CrossRef] [Green Version]
  6. Deeks, E.D. Mirogabalin: First global approval. Drugs 2019, 79, 463–468. [Google Scholar] [CrossRef]
  7. Kitano, Y.; Wakimoto, S.; Tamura, S.; Kubota, K.; Domon, Y.; Arakawa, N.; Saito, M.; Sava, B.; Buisson, B. Effects of mirogabalin, a novel ligand for the α₂δ subunit of voltage-gated calcium channels, on N-type calcium channel currents of rat dorsal root ganglion culture neurons. Pharmazie 2019, 74, 147–149. [Google Scholar]
  8. Saeki, K.; Yasuda, S.I.; Kato, M.; Kano, M.; Domon, Y.; Arakawa, N.; Kitano, Y. Analgesic effects of mirogabalin, a novel ligand for α2δ subunit of voltage-gated calcium channels, in experimental animal models of fibromyalgia. Naunyn Schmiedebergs Arch. Pharm. 2019, 392, 723–728. [Google Scholar] [CrossRef]
  9. Baba, M.; Matsui, N.; Kuroha, M.; Wasaki, Y.; Ohwada, S. Long-term safety and efficacy of mirogabalin in Asian patients with diabetic peripheral neuropathic pain. J. Diabetes Investig. 2020, 11, 693–698. [Google Scholar] [CrossRef]
  10. Burgess, J.; Javed, S.; Frank, B.; Malik, R.A.; Alam, U. Mirogabalin besylate in the treatment of neuropathic pain. Drugs Today 2020, 56, 135–149. [Google Scholar] [CrossRef]
  11. Kato, J.; Matsui, N.; Kakehi, Y.; Murayama, E.; Ohwada, S. Long-term safety and efficacy of mirogabalin in Asian patients with postherpetic neuralgia: Results from an open-label extension of a multicenter randomized, double-blind, placebo-controlled trial. Medicine 2020, 99, e21976. [Google Scholar] [CrossRef] [PubMed]
  12. Murasawa, H.; Kobayashi, H.; Saeki, K.; Kitano, Y. Anxiolytic effects of the novel α2δ ligand mirogabalin in a rat model of chronic constriction injury, an experimental model of neuropathic pain. Psychopharmacology 2020, 237, 189–197. [Google Scholar] [CrossRef] [PubMed]
  13. Murasawa, H.; Kobayashi, H.; Yasuda, S.I.; Saeki, K.; Domon, Y.; Arakawa, N.; Kubota, K.; Kitano, Y. Anxiolytic-like effects of mirogabalin, a novel ligand for α2δ ligand of voltage-gated calcium channels, in rats repeatedly injected with acidic saline intramuscularly, as an experimental model of fibromyalgia. Pharm. Rep. 2020, 72, 571–579. [Google Scholar] [CrossRef]
  14. Tetsunaga, T.; Tetsunaga, T.; Nishida, K.; Misawa, H.; Takigawa, T.; Yamane, K.; Tsuji, H.; Takei, Y.; Ozaki, T. Short-term outcomes of mirogabalin in patients with peripheral neuropathic pain: A retrospective study. J. Orthop. Surg. Res. 2020, 15, 191. [Google Scholar] [CrossRef] [PubMed]
  15. Ye, X.; Gray, E.; Wang, Y.F.; Wang, S.J. Cost-effectiveness of mirogabalin for the treatment of post-herpetic neuralgia in Taiwan. J. Med. Econ. 2020, 23, 529–536. [Google Scholar] [CrossRef]
  16. Oyama, M.; Watanabe, S.; Iwai, T.; Tanabe, M. Mirogabalin activates the descending noradrenergic system by binding to the α2δ-1 subunit of voltage-gated Ca2+ channels to generate analgesic effects. J. Pharmacol. Sci. 2021, 146, 33–39. [Google Scholar] [CrossRef]
  17. Murasawa, H.; Pawlak, A.; Kobayashi, H.; Saeki, K.; Yasuda, S.I.; Kitano, Y. Mirogabalin, a novel ligand for α2δ subunit of voltage-gated calcium channels, improves cognitive impairments in repeated intramuscular acidic saline injection model rats, an experimental model of fibromyalgia. Biomed. Pharm. 2021, 139, 111647. [Google Scholar] [CrossRef]
  18. Bauer, C.S.; Nieto-Rostro, M.; Rahman, W.; Tran-Van-Minh, A.; Ferron, L.; Douglas, L.; Kadurin, I.; Sri Ranjan, Y.; Fernandez-Alacid, L.; Millar, N.S.; et al. The increased trafficking of the calcium channel subunit alpha2delta-1 to presynaptic terminals in neuropathic pain is inhibited by the alpha2delta ligand pregabalin. J. Neurosci. 2009, 29, 4076–4088. [Google Scholar] [CrossRef] [Green Version]
  19. Alexander, S.P.; Catterall, W.A.; Kelly, E.; Marrion, N.; Peters, J.A.; Benson, H.E.; Faccenda, E.; Pawson, A.J.; Sharman, J.L.; Southan, C.; et al. The Concise guide to PHARMACOLOGY 2015/16: Voltage-gated ion channels. Br. J. Pharm. 2015, 172, 5904–5941. [Google Scholar] [CrossRef] [Green Version]
  20. Zajączkowska, R.; Mika, J.; Leppert, W.; Kocot-Kępska, M.; Malec-Milewska, M.; Wordliczek, J. Mirogabalin-A novel selective ligand for the α2δ calcium channel subunit. Pharmaceuticals 2021, 14, 112. [Google Scholar] [CrossRef]
  21. Simasko, S.M. A background sodium conductance is necessary for spontaneous depolarizations in rat pituitary cell line GH3. Am. J. Physiol. 1994, 266, C709–C719. [Google Scholar] [CrossRef] [PubMed]
  22. England, S.; Rawson, D. Isoform-selective voltage-gated Na+ channel modulators as next-generation analgesics. Future Med. Chem. 2010, 2, 775–790. [Google Scholar] [CrossRef] [PubMed]
  23. Jukič, M.; Kikelj, D.; Anderluh, M. Isoform selective voltage-gated sodium channel modulators and the therapy of pain. Curr. Med. Chem. 2014, 21, 164–186. [Google Scholar] [CrossRef] [PubMed]
  24. Wu, S.N.; So, E.C.; Liao, Y.K.; Huang, Y.M. Reversal by ranolazine of doxorubicin-induced prolongation in the inactivation of late sodium current in rat dorsal root ganglion neurons. Pain Med. 2015, 16, 1032–1034. [Google Scholar] [CrossRef] [Green Version]
  25. Catterall, W.A.; Goldin, A.L.; Waxman, S.G. International Union of Pharmacology. XLVII. Nomenclature and structure-function relationships of voltage-gated sodium channels. Pharmacol. Rev. 2005, 57, 397–409. [Google Scholar] [CrossRef]
  26. Cummins, T.R.; Sheets, L.; Waxman, S.G. The roles of sodium channels in nociception: Implications for mechanisms of pain. Pain 2007, 131, 243–257. [Google Scholar] [CrossRef] [Green Version]
  27. Lampert, A.; O’Reilly, A.O.; Reeh, P.; Leffler, A. Sodium channelopathies and pain. Pflugers Arch. 2010, 460, 249–263. [Google Scholar] [CrossRef]
  28. Bannister, K.; Kucharczyk, M.; Dickenson, A.H. Hopes for the future of pain control. Pain Ther. 2017, 6, 117–128. [Google Scholar] [CrossRef] [Green Version]
  29. Coates, M.D.; Vrana, K.E.; Ruiz-Velasco, V. The influence of voltage-gated sodium channels on human gastrointestinal nociception. Neurogastroenterol. Motil. 2019, 31, e13460. [Google Scholar] [CrossRef]
  30. Rühlmann, A.H.; Körner, J.; Hausmann, R.; Bebrivenski, N.; Neuhof, C.; Detro-Dassen, S.; Hautvast, P.; Benasolo, C.A.; Meents, J.; Machtens, J.-P.; et al. Uncoupling sodium channel dimers restores the phenotype of a pain-linked Nav 1.7 channel mutation. Br. J. Pharmacol. 2020, 177, 4481–4496. [Google Scholar] [CrossRef]
  31. Lo, Y.C.; Tseng, Y.T.; Liu, C.M.; Wu, B.N.; Wu, S.N. Actions of KMUP-1, a xanthine and piperazine derivative, on voltage-gated Na+ and Ca2+ -activated K+ currents in GH3 pituitary tumour cells. Br. J. Pharmacol. 2015, 172, 5110–5122. [Google Scholar] [CrossRef] [PubMed]
  32. So, E.C.; Wu, S.N.; Lo, Y.C.; Su, K. Differential regulation of tefluthrin and telmisartan on the gating charges of INa activation and inactivation as well as on resurgent and persistent INa in a pituitary cell line (GH3). Toxicol. Lett. 2018, 285, 104–112. [Google Scholar] [CrossRef] [PubMed]
  33. Kuo, C.; Kao, Z.H.; Lee, S.W.; Wu, S.N. Effects of sesamin, the major furofuran lignan of sesame oil, on the amplitude and gating of voltage-gated Na+ and K+ currents. Molecules 2020, 25, 3062. [Google Scholar] [CrossRef] [PubMed]
  34. Lai, M.C.; Wu, S.N.; Huang, C.W. The specific effects of OD-1, a peptide activator, on voltage-gated sodium current and seizure susceptibility. Int. J. Mol. Sci. 2020, 21, 8254. [Google Scholar] [CrossRef]
  35. Chang, W.T.; Wu, S.N. Characterization of direct perturbations on voltage-gated sodium current by esaxerenone, a nonsteroidal mineralocorticoid receptor blocker. Biomedicines 2021, 9, 549. [Google Scholar] [CrossRef]
  36. Chang, W.T.; Wu, S.N. Effectiveness of columbianadin, a bioactive coumarin derivative, in perturbing transient and persistent INa. Int. J. Mol. Sci. 2021, 22, 621. [Google Scholar] [CrossRef]
  37. Chuang, T.H.; Cho, H.Y.; Wu, S.N. The evidence for sparsentan-mediated inhibition of INa and IK(erg): Possibly unlinked to its antagonism of angiotensin II or endothelin type A receptor. Biomedicines 2021, 10, 86. [Google Scholar] [CrossRef]
  38. Wu, S.N.; Chen, B.S.; Hsu, T.I.; Peng, H.; Wu, Y.H.; Lo, Y.C. Analytical studies of rapidly inactivating and noninactivating sodium currents in differentiated NG108-15 neuronal cells. J. Theor. Biol. 2009, 259, 828–836. [Google Scholar] [CrossRef]
  39. Morris, C.E.; Boucher, A.; Joós, B. Left-shifted nav channels in injured bilayer: Primary targets for neuroprotective nav antagonists? Front. Pharmacol. 2012, 3, 19. [Google Scholar] [CrossRef] [Green Version]
  40. Frenz, C.T.; Hansen, A.; Dupuis, N.D.; Shultz, N.; Levinson, S.R.; Finger, T.E.; Dionne, V.E. NaV1.5 sodium channel window currents contribute to spontaneous firing in olfactory sensory neurons. J. Neurophysiol. 2014, 112, 1091–1104. [Google Scholar] [CrossRef] [Green Version]
  41. Wu, S.N.; Lo, Y.C.; Shen, A.Y.; Chen, B.S. Contribution of non-inactivating Na+ current induced by oxidizing agents to the firing behavior of neuronal action potentials: Experimental and theoretical studies from NG108-15 neuronal cells. Chin. J. Physiol. 2011, 54, 19–29. [Google Scholar] [CrossRef] [PubMed] [Green Version]
  42. Tan, J.; Soderlund, D.M. Actions of tefluthrin on rat Na(v)1.7 voltage-gated sodium channels expressed in Xenopus Oocytes. Pestic. Biochem. Physiol. 2011, 101, 21–26. [Google Scholar] [CrossRef] [PubMed] [Green Version]
  43. Khaliq, Z.M.; Gouwens, N.W.; Raman, I.M. The contribution of resurgent sodium current to high-frequency firing in Purkinje neurons: An experimental and modeling study. J. Neurosci. 2003, 23, 4899–4912. [Google Scholar] [CrossRef] [PubMed]
  44. Lewis, A.H.; Raman, I.M. Resurgent current of voltage-gated Na+ channels. J. Physiol. 2014, 592, 4825–4838. [Google Scholar] [CrossRef] [PubMed]
  45. Venugopal, S.; Seki, S.; Terman, D.H.; Pantazis, A.; Olcese, R.; Wiedau-Pazos, M.; Chandler, S.H. Resurgent Na+ current offers noise modulation in bursting neurons. PLoS Comput. Biol. 2019, 15, e1007154. [Google Scholar] [CrossRef]
  46. Quattrocolo, G.; Dunville, K.; Nigro, M.J. Resurgent sodium current in neurons of the cerebral cortex. Front. Cell Neurosci. 2021, 15, 760610. [Google Scholar] [CrossRef]
  47. Villalba-Galea, C.A.; Chiem, A.T. Hysteretic behavior in voltage-gated channels. Front. Pharmacol. 2020, 11, 579596. [Google Scholar] [CrossRef]
  48. Guérineau, N.C.; Monteil, A.; Lory, P. Sodium background currents in endocrine/neuroendocrine cells: Towards unraveling channel identity and contribution in hormone secretion. Front. Neuroendocrinol. 2021, 63, 100947. [Google Scholar] [CrossRef]
  49. Taddese, A.; Bean, B.P. Subthreshold sodium current from rapidly inactivating sodium channels drives spontaneous firing of tuberomammillary neurons. Neuron 2002, 33, 587–600. [Google Scholar] [CrossRef] [Green Version]
  50. Navarro, M.A.; Salari, A.; Lin, J.L.; Cowan, L.M.; Penington, N.J.; Milescu, M.; Milescu, L.S. Sodium channels implement a molecular leaky integrator that detects action potentials and regulates neuronal firing. Elife 2020, 9, e54940. [Google Scholar] [CrossRef] [PubMed]
  51. Vega, A.V.; Espinosa, J.L.; López-Domínguez, A.M.; López-Santiago, L.F.; Navarrete, A.; Cota, G. L-type calcium channel activation up-regulates the mRNAs for two different sodium channel alpha subunits (Nav1.2 and Nav1.3) in rat pituitary GH3 cells. Brain Res. Mol. Brain Res. 2003, 116, 115–125. [Google Scholar] [CrossRef]
  52. Lo, Y.K.; Wu, S.N.; Lee, C.T.; Li, H.F.; Chiang, H.T. Characterization of action potential waveform-evoked L-type calcium currents in pituitary GH3 cells. Pflugers Arch. 2001, 442, 547–557. [Google Scholar] [CrossRef] [PubMed]
  53. Soliman, D.; Wang, L.; Hamming, K.S.; Yang, W.; Fatehi, M.; Carter, C.C.; Clanachan, A.S.; Light, P.E. Late sodium current inhibition alone with ranolazine is sufficient to reduce ischemia- and cardiac glycoside-induced calcium overload and contractile dysfunction mediated by reverse-mode sodium/calcium exchange. J. Pharmacol. Exp. Ther. 2012, 343, 325–332. [Google Scholar] [CrossRef] [PubMed]
  54. Shenoda, B. The role of Na+/Ca2+ exchanger subtypes in neuronal ischemic injury. Transl. Stroke Res. 2015, 6, 181–190. [Google Scholar] [CrossRef] [PubMed]
  55. Stojilkovic, S.S.; Tabak, J.; Bertram, R. Ion channels and signaling in the pituitary gland. Endocr. Rev. 2010, 31, 845–915. [Google Scholar] [CrossRef] [Green Version]
  56. Gould, H.J., 3rd; Garrett, C.; Donahue, R.R.; Paul, D.; Diamond, I.; Taylor, B.K. Ranolazine attenuates behavioral signs of neuropathic pain. Behav. Pharmacol. 2009, 20, 755–758. [Google Scholar] [CrossRef] [Green Version]
  57. Gould, H.J., 3rd; Soignier, R.D.; Cho, S.R.; Hernandez, C.; Diamond, I.; Taylor, B.K.; Paul, D. Ranolazine attenuates mechanical allodynia associated with demyelination injury. Pain Med. 2014, 15, 1771–1780. [Google Scholar] [CrossRef] [Green Version]
  58. Gould, H.J., 3rd; Diamond, I. Ranolazine: A potential treatment for refractory neuropathic pain. J. Neurol. Sci. 2016, 369, 310–311. [Google Scholar] [CrossRef]
  59. Elkholy, S.E.; Elaidy, S.M.; El-Sherbeeny, N.A.; Toraih, E.A.; El-Gawly, H.W. Neuroprotective effects of ranolazine versus pioglitazone in experimental diabetic neuropathy: Targeting Nav1.7 channels and PPAR-γ. Life Sci. 2020, 250, 117557. [Google Scholar] [CrossRef]
  60. Casey, G.P.; Roberts, J.S.; Paul, D.; Diamond, I.; Gould, H.J., 3rd. Ranolazine attenuation of CFA-induced mechanical hyperalgesia. Pain Med. 2010, 11, 119–126. [Google Scholar] [CrossRef] [Green Version]
  61. Nodera, H.; Rutkove, S.B. Changes of the peripheral nerve excitability in vivo induced by the persistent Na+ current blocker ranolazine. Neurosci. Lett. 2012, 518, 36–40. [Google Scholar] [CrossRef] [PubMed]
  62. Gould, H.J., 3rd. Response to letter to the editor: Reversal by ranolazine of doxorubicin-induced prolongation in the inactivation of late sodium current in rat dorsal root ganglion neurons. Pain Med 2015, 16, 1035. [Google Scholar] [CrossRef] [PubMed]
  63. Brown, K.; Mendell, J.; Ohwada, S.; Hsu, C.; He, L.; Warren, V.; Dishy, V.; Zahir, H. Tolerability, pharmacokinetics, and pharmacodynamics of mirogabalin in healthy subjects: Results from phase 1 studies. Pharmacol. Res. Perspect. 2018, 6, e00418. [Google Scholar] [CrossRef] [PubMed]
  64. Jansen, M.; Warrington, S.; Dishy, V.; Ohwada, S.; Johnson, L.; Brown, K.; Ishizuka, H. A randomized, placebo-controlled, double-blind study of the safety, tolerability, pharmacokinetics, and pharmacodynamics of single and repeated doses of mirogabalin in healthy Asian volunteers. Clin. Pharmacol. Drug Dev. 2018, 7, 661–669. [Google Scholar] [CrossRef] [Green Version]
  65. Amir, R.; Argoff, C.E.; Bennett, G.J.; Cummins, T.R.; Durieux, M.E.; Gerner, P.; Gold, M.S.; Porreca, F.; Strichartz, G.R. The role of sodium channels in chronic inflammatory and neuropathic pain. J. Pain 2006, 7, S1–S29. [Google Scholar] [CrossRef]
  66. Wu, S.N.; Peng, H.; Chen, B.S.; Wang, Y.J.; Wu, P.Y.; Lin, M.W. Potent activation of large-conductance Ca2+-activated K+ channels by the diphenylurea 1,3-bis-[2-hydroxy-5-(trifluoromethyl)phenyl]urea (NS1643) in pituitary tumor (GH3) cells. Mol. Pharmacol. 2008, 74, 1696–1704. [Google Scholar] [CrossRef] [Green Version]
  67. Chang, W.T.; Liu, P.Y.; Gao, Z.H.; Lee, S.W.; Lee, W.K.; Wu, S.N. Evidence for the effectiveness of remdesivir (GS-5734), a nucleoside-analog antiviral drug in the inhibition of IK(M) or IK(DR) and in the stimulation of IMEP. Front. Pharmacol. 2020, 11, 1091. [Google Scholar] [CrossRef]
Figure 1. Effect of mirogabalin (MGB) on voltage-gated Na+ current (INa) identified in pituitary GH3 cells. In this series of experiments, we bathed cells in Ca2+-free Tyrode’s solution, which contained 10 mM tetraethylammonium chloride (TEA) and 0.5 mM CdCl2, and the electrode that was used was filled up with a solution containing Cs+. (A) Representative current traces acquired in the control period (a) (i.e., absence of MGB) and during the exposure to 3 μM MGB (b) or 10 μM MGB (c). The voltage clamp protocol that we applied is illustrated in the upper part. The graphs shown in the right side of (A) indicate the expanded records from the left side (dashed boxes). (B) Concentration–response curve of MGB-induced block of peak (transient) INa (INa(T)) or sustained (late) INa (INa(L)) occurring in GH3 cells. The continuous line drawn represents the goodness-of-fit to the modified Hill equation, as described in Section 4. The IC50 values for the MGB-induced inhibition of INa(T) and INa(L) were optimally estimated to be 19.5 and 7.3 μM, respectively. Each point represents the mean ± SEM (n = 8–10).
Ijms 23 03845 g001
Figure 2. Kinetic assessment of MGB-induced block of INa. (A) Inactivation time courses of INa evoked by the depolarizing step from −100 to −10 mV for a duration of 30 ms. Each current trajectory in the absence (a), and the presence of 3 μM MGB (b), or 10 μM MGB (c) was well fitted with a least squares criterion by two-exponential decay, i.e., the sum of two exponentials (indicated by the gray smooth line). The values of the fast or slow component (i.e., τinact(S)) in the inactivation time constants of INa(T) obtained in the control period and during exposure to 3 and 10 μM MGB were 1.11, 0.098, and 0.091 ms (fast component), or 4.96, 4.13, and 3.31 ms (slow component), respectively. (B) Relationship of the MGB concentration as a function of the slow component in the inactivation rate constant (1/τinact(S)) (mean ± SEM; n = 7 for each point). Of note, the value of 1/τinact(S) is linearly proportionally to the MBG concentration. Based on the heuristic minimal binding scheme (shown in the Supplementary Information), the value of k+1 * and k−1 were estimated to be 0.0124 ms−1μM−1 and 0.102 ms−1, respectively; therefore, the KD value (k−1/k+1*, i.e., dissociation constant) turned out to be 8.2 μM, a value which shares a similarity with the IC50 value required for its inhibitory effect on INa(L), but smaller than that on INa(T) amplitude.
Ijms 23 03845 g002
Figure 3. Mean current-voltage (I-V) relationship of INa(T) in GH3 cells. The preparations made during this series of experiments are the same as those described in Figure 1 and Figure 2. The examined cell was maintained at −80 mV and a series of depolarizing command voltages ranging from −80 to +10 mV in 10 mV steps were applied to it. (A) Representative current traces taken in the control period (upper) and during cell exposure to 10 μM MGB. The uppermost part shows the voltage protocol applied. (B) Mean I-V relationship of INa(T) in the absence (filled black circles) and presence (filled red squares) of 10 μM MGB (mean ± SEM; n = 7 for each point). Current amplitude was measured at the beginning of each depolarizing pulse. Of these, the overall I-V relationship of INa(T) (or peak INa) seen in GH3 cells was unaltered in the presence of MGB. (C) Quasi-steady-state inactivation curve of INa(T) in the control (filled black circles) and during exposure to 10 μM MGB (filled red squares) (mean ± SEM; n = 7 for each point). The Boltzmann equations for the I-V relation and inactivation curve of INa(T) least squares fitted to generate the smooth lines are described in Materials and Methods.
Ijms 23 03845 g003
Figure 4. Effect of MGB on the recovery of INa(T) inactivation evoked by varying interpulse intervals with a geometric progression. In these recording experiments, we kept cells bathed in Ca2+-free Tyrode’s solution, while the recording pipette was backfilled with K+-enriched solution. The examined GH3 cells were depolarized from −80 to −10 mV for a duration of 30 ms, and subsequently different interpulse durations with a geometric progression (indicated in the upper part) were delivered to them. The time course of recovery from INa(T) inactivation taken in the absence of (filled black circles) and presence (open pink circles) of 10 μM MGB is illustrated. The relative amplitude of peak INa was measured as a ratio of the second peak amplitude divided by the first peak amplitude peak. The recovery time course (indicated by the smooth line) in the absence of and presence of 10 μM MGB displays an exponential rise as a function of the interpulse interval, with a time constant of 83.2 and 156 ms, respectively. Of note, the x-axis is illustrated with a logarithmic scale. Each point is the mean ± SEM (n = 7).
Ijms 23 03845 g004
Figure 5. Effect of MGB on window INa (INa(W)) elicited by short ascending ramp voltage (Vramp). The experiments were conducted with the tested cell voltage-clamped at −80 mV, and the Vramp with a range from −110 to +50 mV was applied for a duration of 50 ms. (A) Representative current traces were acquired in the control period (a, black) and during cell exposure to 10 μM MGB (b, pink) or 30 μM MGB (c, green). The voltage protocol used is illustrated in the upper part, and the downward deflection indicates the occurrence of inward current. (B) Summary bar graph showing the effect of MGB, nimodipine (Nimo), tetrodotoxin (TTX), and MGB plus tefluthrin (Tef) on the area of INa(W) (mean ± SEM; n = 8). Each area was measured at the voltages ranging between −40 and +40 mV during the upsloping Vramp. * This result is significantly different from control (p < 0.05) and + significantly different from MGB (30 μM) alone group (p < 0.05).
Ijms 23 03845 g005
Figure 6. Effect of MGB on resurgent INa (INa(R)) evoked by the descending Vramp. The tested cell was held at −100 mV and the 30 ms depolarizing pulse at +30 mV was applied. Following the step depolarization, the downsloping Vramp from +30 to −80 mV was delivered to the cell for a duration of 60 ms. (A) Representative I-V relationships of INa(R) evoked by the descending Vramp in the absence (a, black) and presence (b, pink) of 10 μM MGB. The upper part signifies the voltage protocol used, and the x-axis at the lower part is indicated from +40 to −80 mV. (B) Summary bar graph showing effects of MGB and MGB plus tefluthrin (Tef) on INa(R) (mean ± SEM; n = 7 for each bar). Current amplitude was measured at the level of −20 mV during the descending Vramp. * This result is significantly different from control (p < 0.05) and ** significantly different from the MGB (10 μM) alone group (p < 0.05).
Ijms 23 03845 g006
Figure 7. Effect of MGB on persistent INa (INa(P)) activated in response to upright isosceles triangular Vramp, which was utilized to mimic the depolarizing or repolarizing slopes of bursting patterns in electrically excitable cells. (A) Representative current traces activated by isosceles triangular Vramp for a duration of 8 s, or with a ramp speed of ± 75 mV/s (indicated in the uppermost part). The black color in the upper and lower part of (A) indicates the current trace activated by the ascending limb of the Vramp, while the red color shows trace activated by the Vramp’s descending limb. The uppermost part depicts the voltage protocol applied. The purple curved arrow indicates the direction of the current over which time goes during the activation of the triangular ramp pulse. Of note, there is a voltage-dependent hysteresis Vhys (i.e., figure of eight configuration) of INa(P) evoked by the isosceles triangular Vramp with or without the MGB (10 μM) addition. In (B,C), summary bar graphs, respectively, show inhibitory effects of MGB (3 or 10 μM) on the amplitude of INa(P) activated by the upsloping (at −10 mV) and downsloping (at −80 mV) limb of the triangular Vramp (mean ± SEM; n = 7 for each bar). * This result is significantly different from controls (p < 0.05).
Ijms 23 03845 g007
Figure 8. Effect of MGB on INa(T) activated by a train of depolarizing pulses in GH3 cells. The train was designed to consist of 40 20 ms pulses (stepped to −10 mV) separated by 5 ms intervals at −80 mV for a duration of 1 s. (A) Representative current traces taken in the control period (a, absence of MGB) and during cell exposure to 10 μM MGB. The voltage-clamp protocol is illustrated in the uppermost part. To provide a single INa trace, the right side of (A) denotes the expanded records from the dashed box of the left side. (B) The relationship of peak INa (INa(T)) versus the pulse train duration in the absence (filled black circles) and presence (open pink circles) of 10 μM MGB (mean ± SEM; n = 7 for each point). The continuous smooth lines over which the data points are overlaid are well-fitted by a single exponential. Of note, the presence of MGB can quicken the time course of INa(T) inactivation in response to a train of depolarizing pulses. (C) Summary bar graph showing the effect of MGB and MGB plus tefluthrin (Tef) on the time constant of current decay in response to a train of depolarizing command voltage from −80 to −10 mV (mean ± SEM; n = 7 for each bar). Current amplitude was measured at the beginning of each depolarizing pulse. Of note, the presence of MGB produces a significant shortening in the time constant in the decline of peak INa activated by a train of pulses. * Significantly different from control (p < 0.05) and ** significantly different from MGB (10 μM) alone group (p < 0.05).
Ijms 23 03845 g008aIjms 23 03845 g008b
Publisher’s Note: MDPI stays neutral with regard to jurisdictional claims in published maps and institutional affiliations.

