
Roles of Matrix Metalloproteinases and Their Natural Inhibitors in Metabolism: Insights into Health and Disease
 , ,
, ,  and
and
Abstract
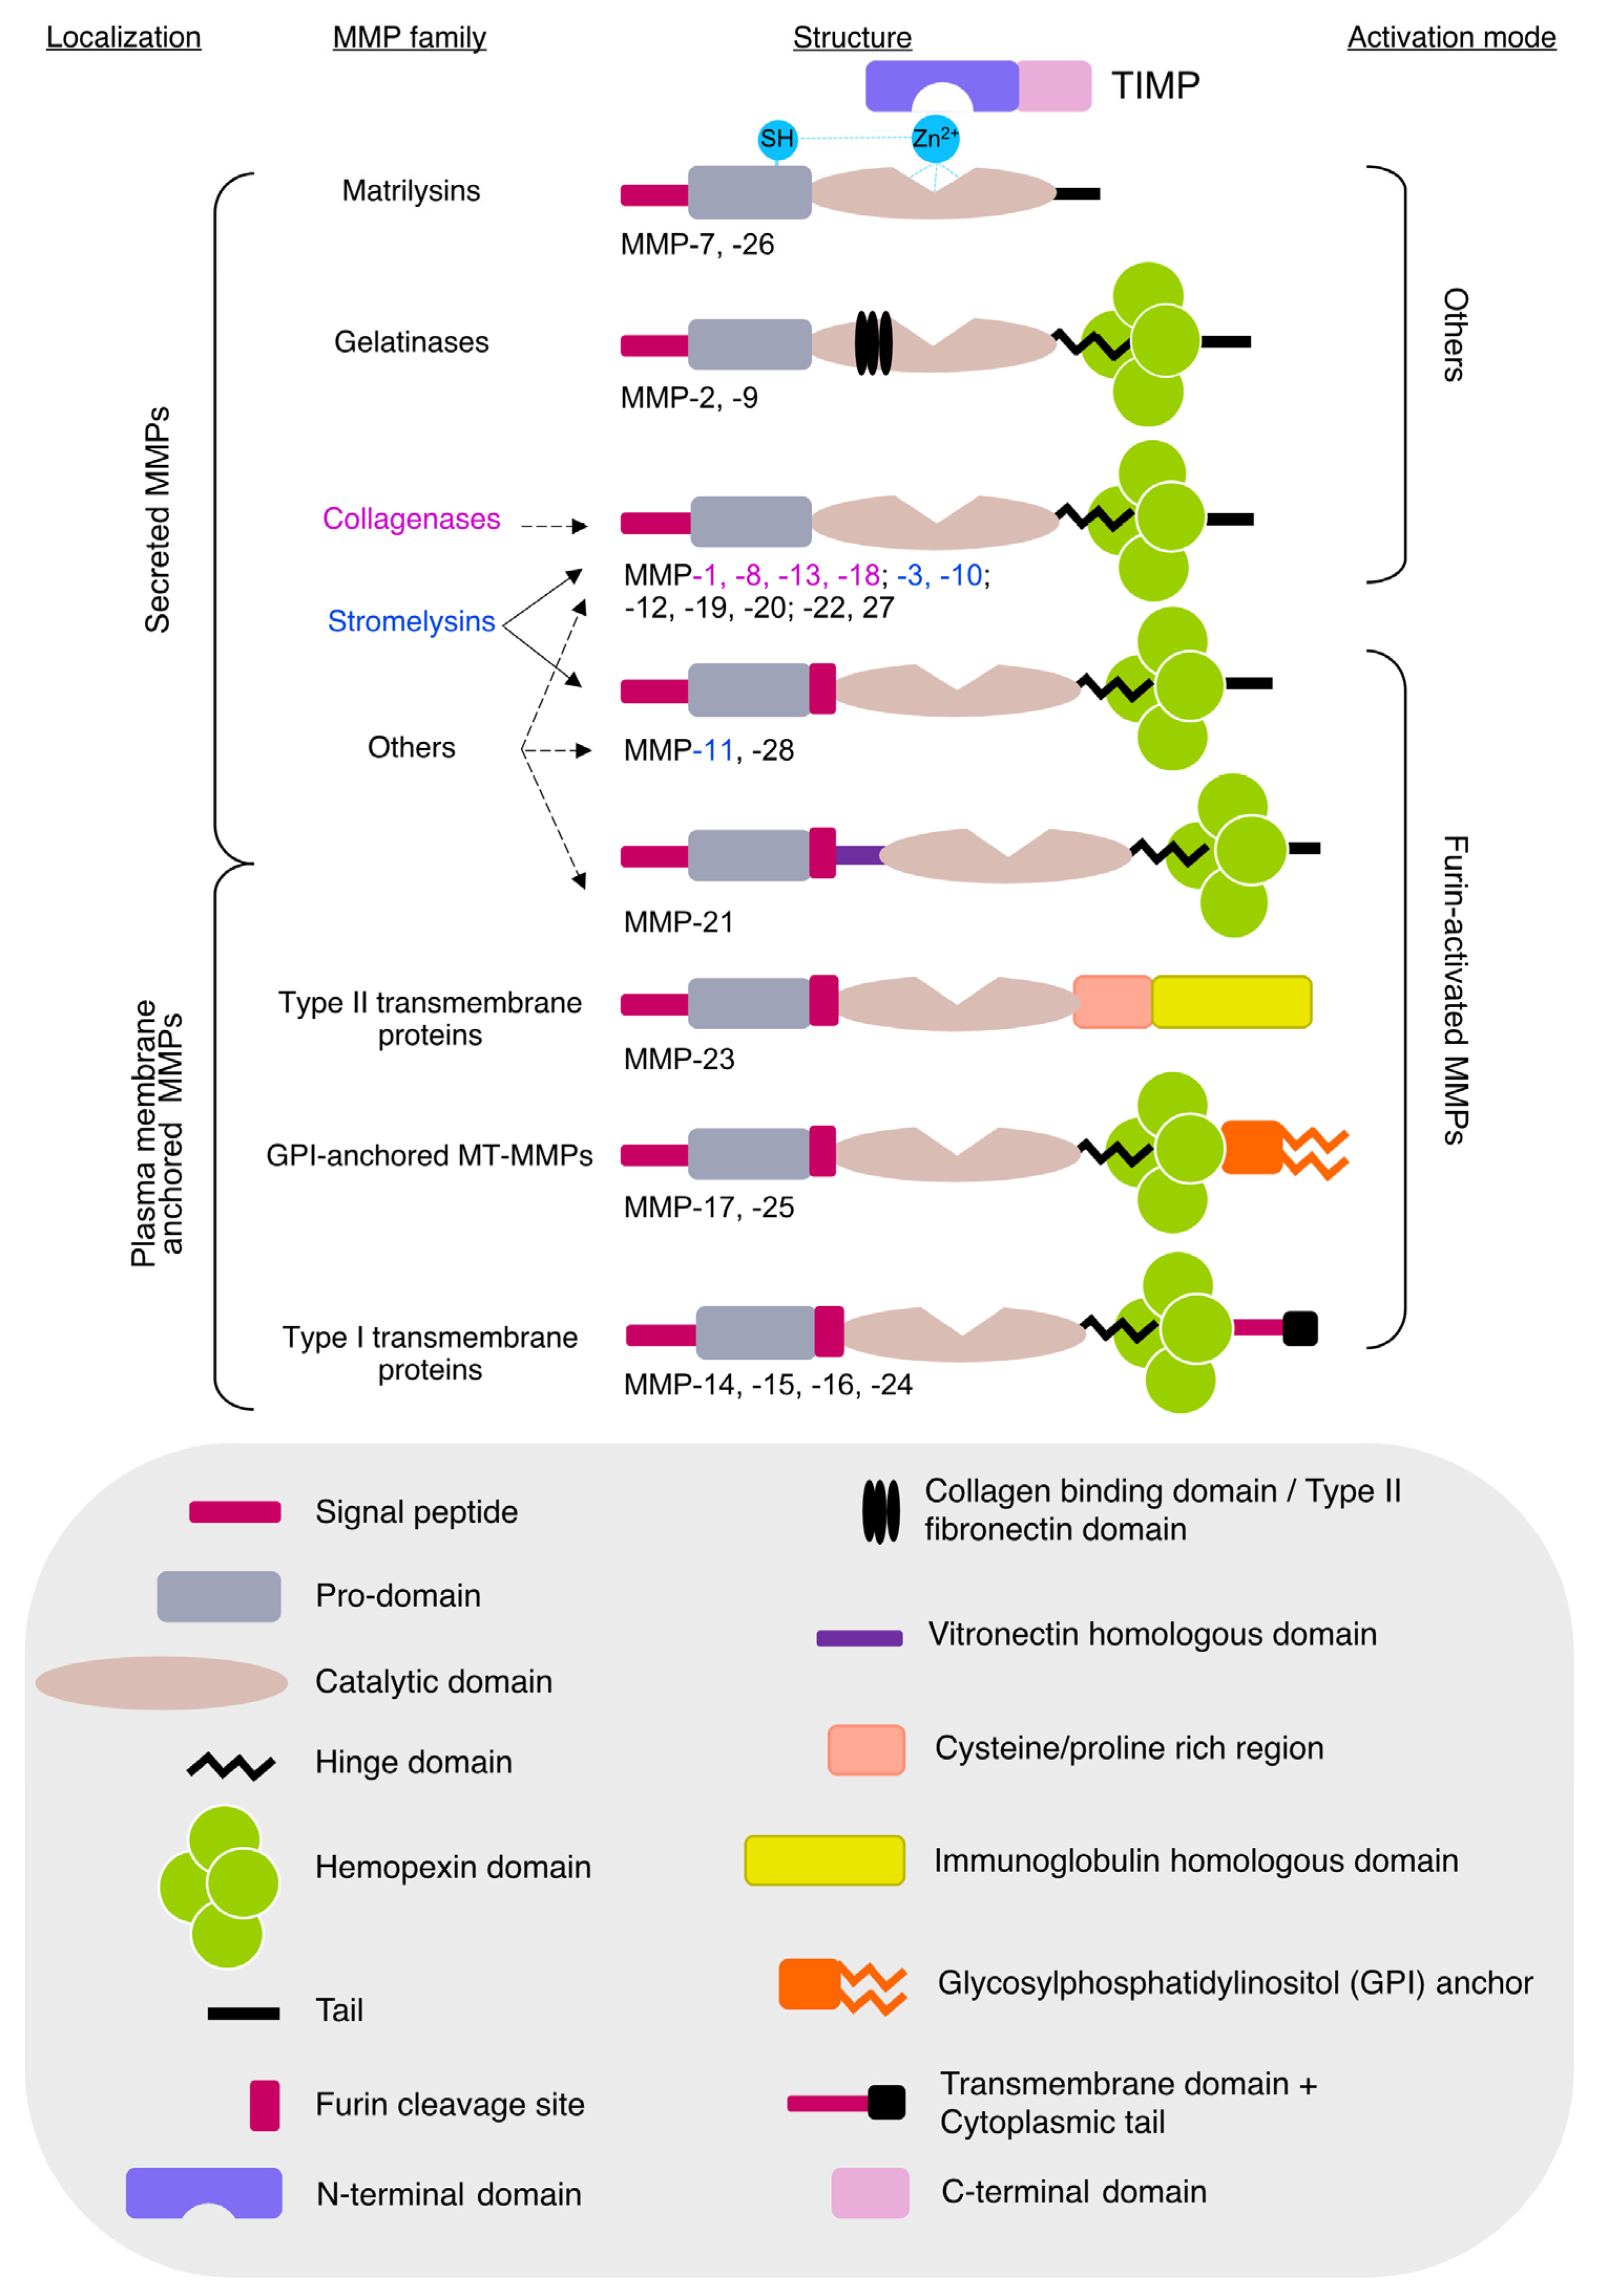
:1. Introduction
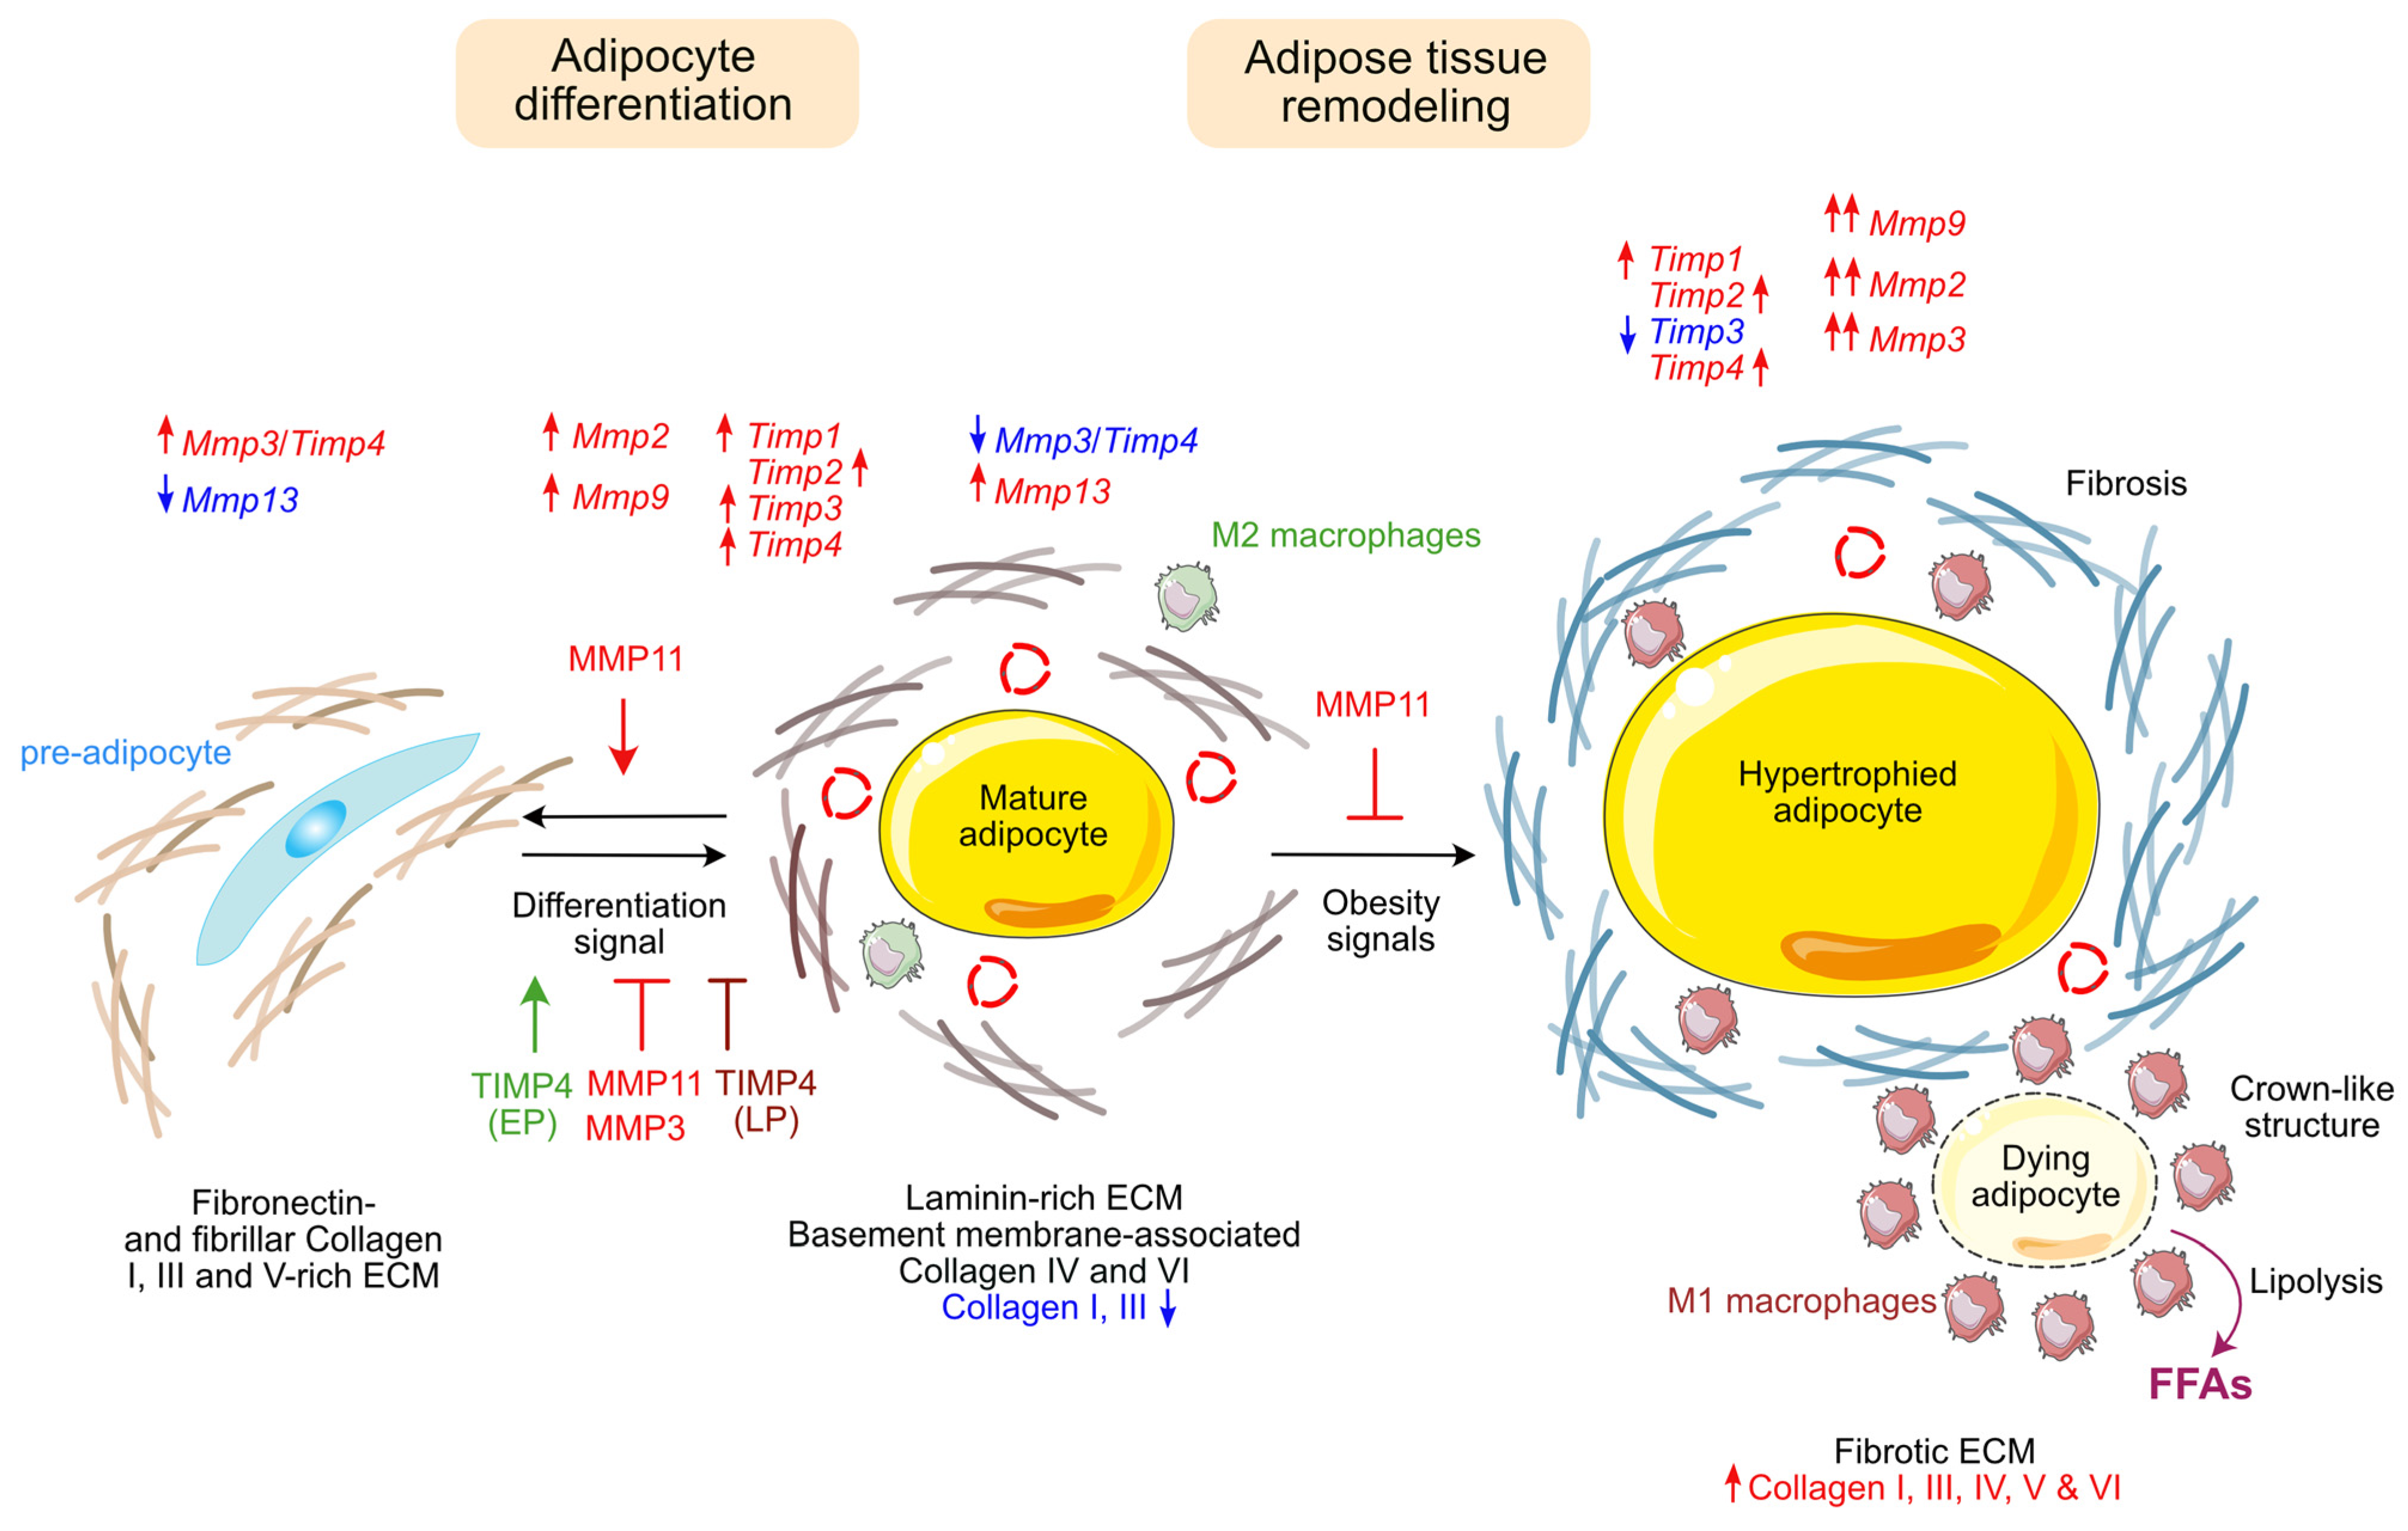
2. Adipose Tissue Functions and Pathologies
2.1. Gelatinases
2.1.1. MMP2
MMP2 Association with Obesity in Humans
MMP2 and Adipocyte Differentiation
MMP2 and Hypothalamic Leptin Signaling
MMP2 and Type 2 Diabetes (T2D)
2.1.2. MMP9
MMP9 and Insulin Resistance
MMP9 and “Metaflammation”
2.2. Stromelysins
2.2.1. MMP3
MMP3 and Adipocyte Differentiation
Pro-Inflammatory Effect of MMP3
2.2.2. MMP10
2.2.3. MMP11
MMP11 Protects against Obesity-Associated Metabolic Dysfunction
MMP11 and Metabolic Reprogramming in Cancer
Role of MMP11 in TNFα-Induced Insulin Resistance
Expression of MMP11 during Adipocytic Differentiation
2.3. Collagenases
2.3.1. MMP1
MMP1 Polymorphism and Metabolic Diseases
MMP1 Secretion during In Vitro Adipocytes’ Differentiation
MMP1 Decrease and Collagen I Accumulation in Murine Obese Adipose Tissue
2.3.2. MMP8
2.3.3. MMP13
2.4. Elastase
2.5. Matrilysins
2.5.1. MMP7
2.5.2. MMP26
2.6. MMP19
2.7. Membrane-Type MMPs
2.7.1. MMP14 (MT1-MMP)
MMP14 Allows Adipose Tissue Expansion during Development
MMP14 Is Upregulated during HFD
2.7.2. MMP15 (MT2-MMP)
2.8. Tissue Inhibitors of MMP (TIMPs)
2.8.1. TIMP1
TIMP1 Association with Metabolic Syndrome
TIMP1 Role in Adipocyte Differentiation
TIMP1 and Hypothalamic Leptin Signaling
2.8.2. TIMP2
TIMP2 Association with Obesity and Metabolic Syndrome
TIMP2 and Hypothalamic Leptin Signaling
2.8.3. TIMP3
2.8.4. TIMP4
TIMP4 Expression during In Vitro Adipocyte Differentiation
In Vivo Expression of TIMP4 Is Gender- and Fat Depot-Dependent
- Differential expression of TIMP4 depending on fat depot site
- 2.
- Differential expression of TIMP4 depending on sex
- 3.
- Influence of HFD
TIMP4−/− and TIMP4 Overexpressing Mouse Model Phenotypes
Future Perspectives for Studying TIMP4/MMP3 Role in Metabolism
2.9. Conclusion on the Role of MMPs and TIMPs on Adipose Tissue Homeostasis and Related Diseases
3. MMPs and TIMPs in Atherosclerosis and Diabetes Vascular Complications
3.1. Atherosclerosis
3.1.1. MMP8
3.1.2. MMP2 and MMP9
3.1.3. TIMPs
3.2. Diabetic Nephropathy
3.3. Diabetic Retinopathy
3.4. Diabetic Cardiomyopathy
4. Muscle Metabolism, Differentiation, and Regeneration
4.1. MMP2 and MMP9
4.2. MMP10
4.3. MMP13
4.4. MMP14
4.5. TIMP2
5. MMPs and TIMPs in Fatty Liver Disease
5.1. MMP2 and MMP9 and Their Inhibitors
5.2. MMP11
5.3. TIMP3
5.4. TIMP4
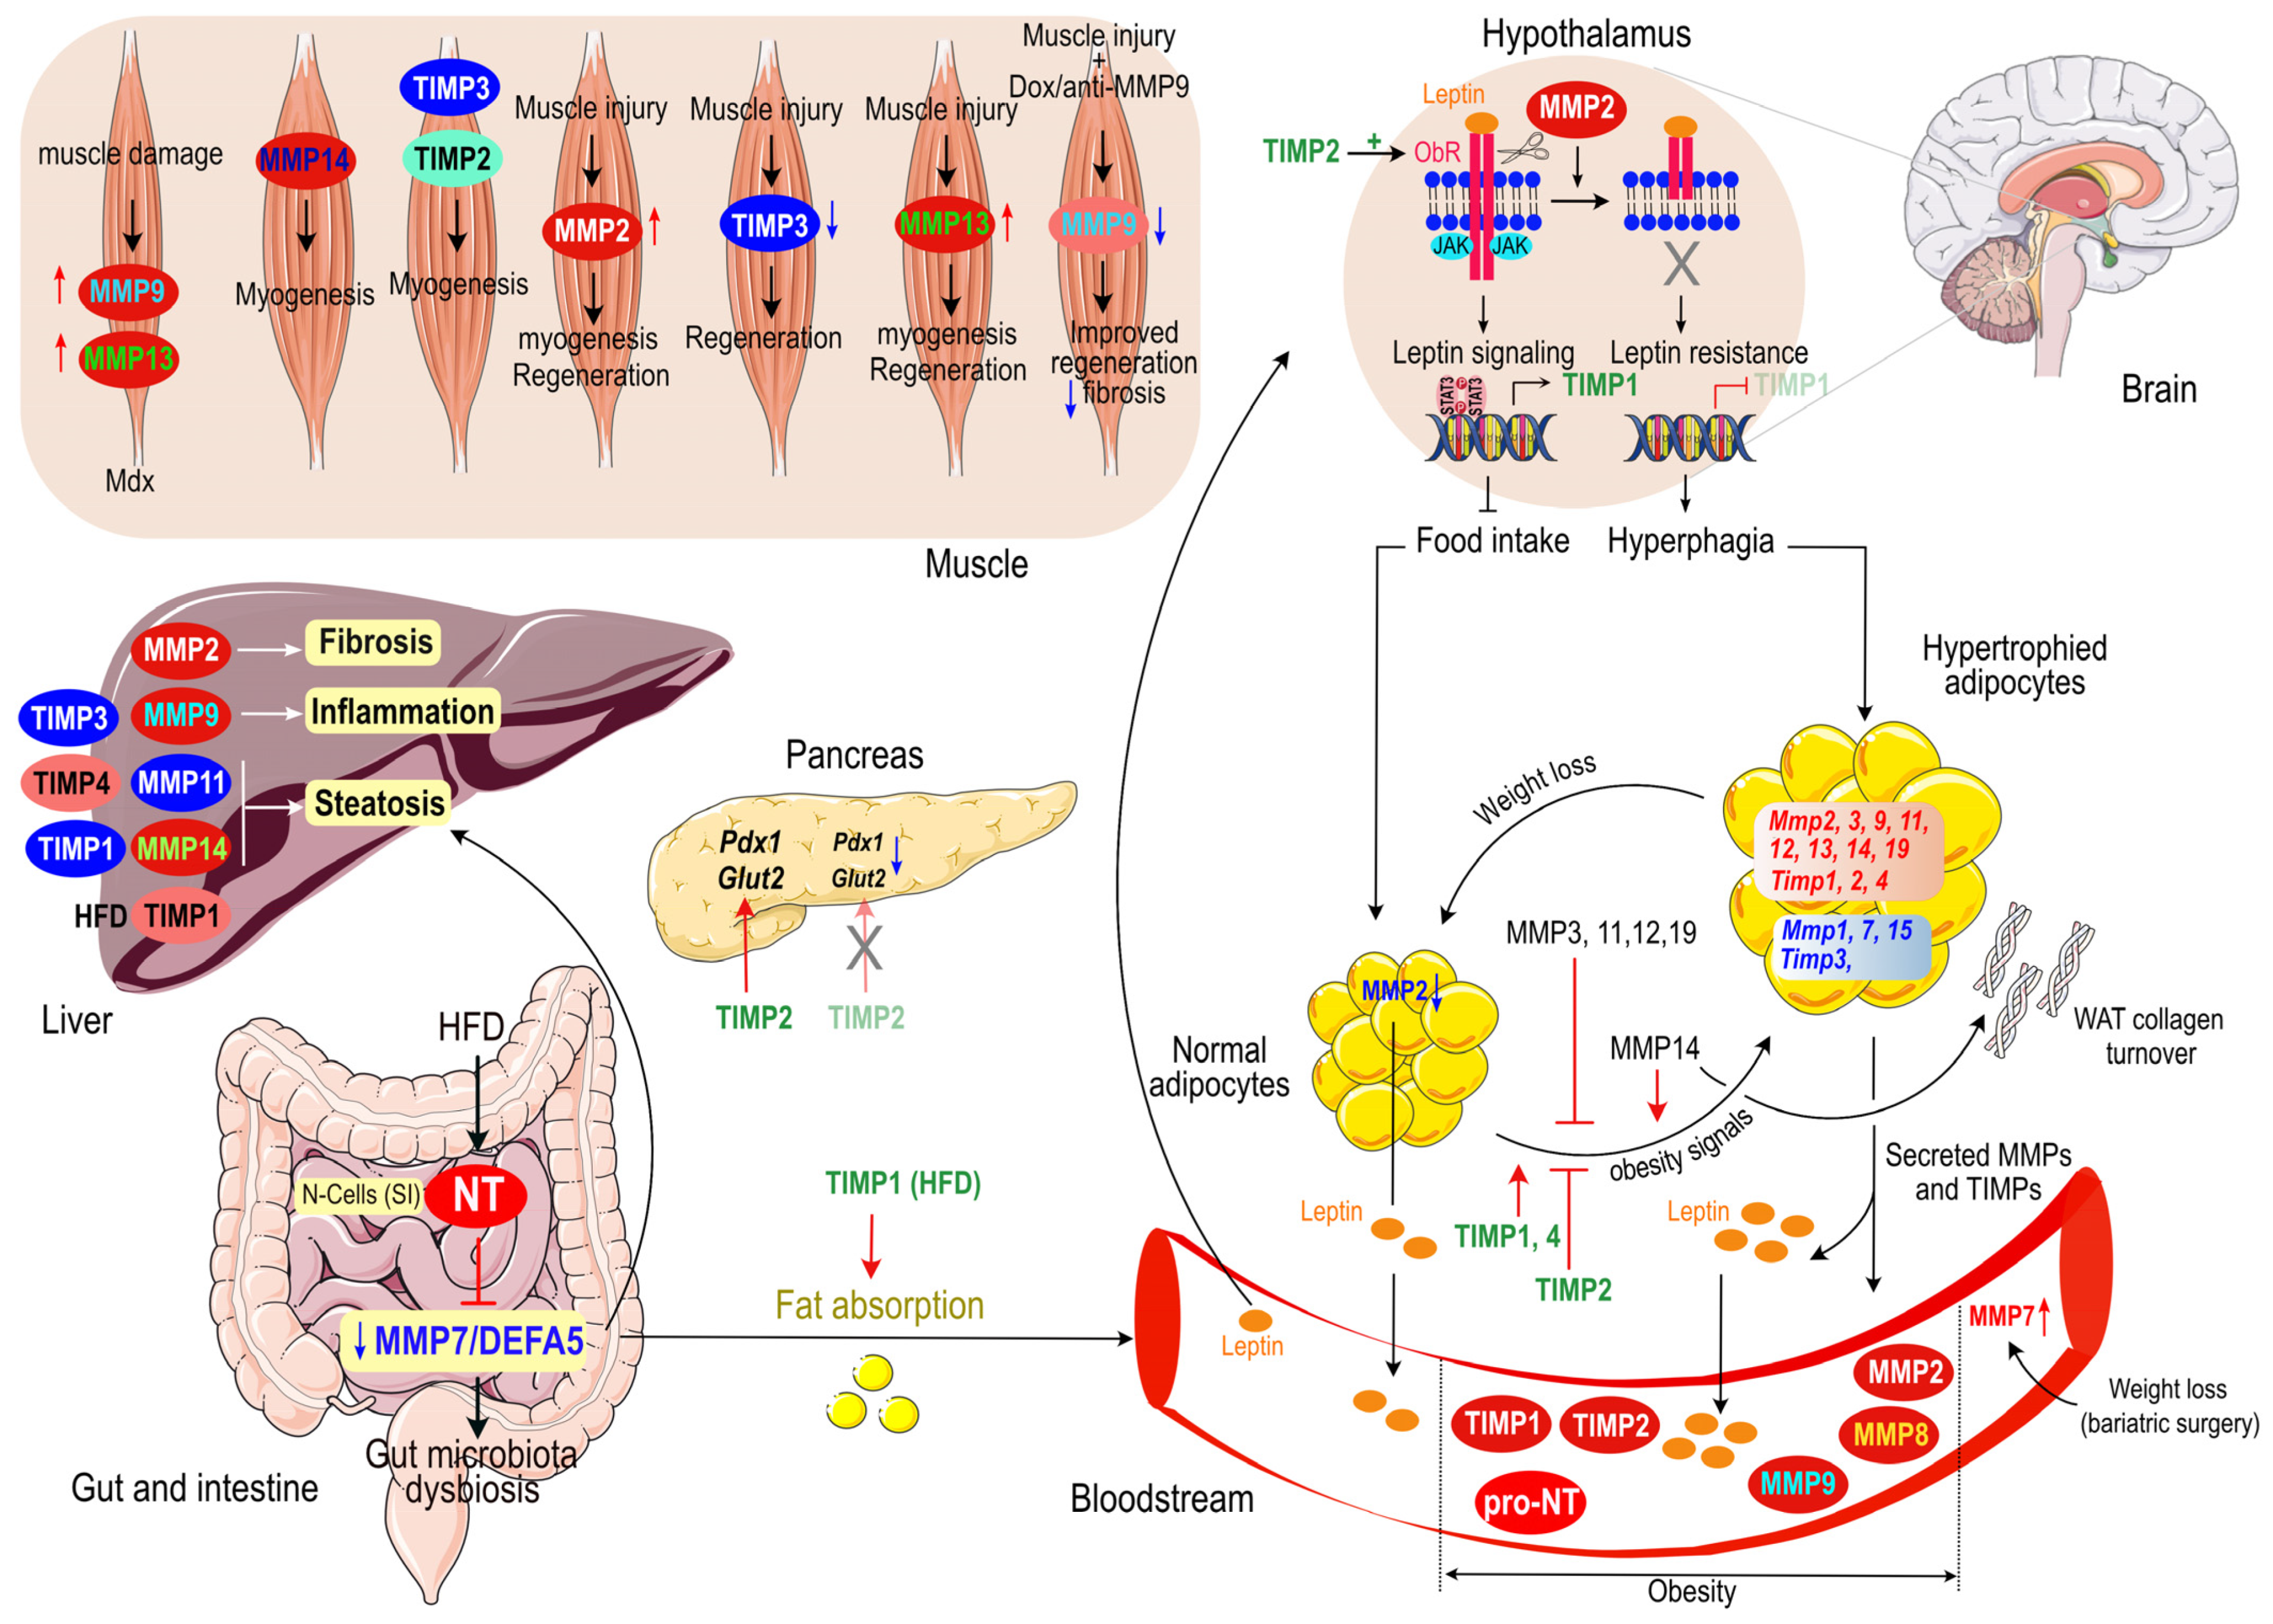
6. Concluding Remarks
7. Highlights and Perspectives
- Role of MMPs/TIMPs in adipogenesis via ECM remodeling. It is well established that MMPs and TIMPs are key factors, both positive and negative, of adipogenesis, through their ability to remodel ECM, which allows adipocytes differentiation and hypertrophy.
- ECM-independent roles of MMPs. Beyond their direct action on the ECM, some MMPs can influence the endocrine pathway, for instance MMP2 inducing leptin resistance by cleaving the leptin receptor.
- Targeting MMP/TIMP for obesity/diabetes. The development of inhibitors targeting a number of MMPs or their inhibitors when their overexpression is causally implicated in obesity or its complications may prove efficient in the fight against these diseases. Alternatively, targeting some MMPs or their inhibitors to increase their action when there are deficient may also prove efficient when necessary.
- Use of MMPs/TIMPs as biomarkers of metabolic diseases. Several clinical studies suggest that MMP/TIMP may serve as biomarkers of metabolic diseases and their complications, such as diabetic decompensation, diabetic nephropathy or fatty liver disease.
- Targeting MMP/TIMP for myopathies. Some MMPs and their inhibitors are involved in myogenesis and/or repair following injury or disease. Therefore, a better comprehension of the molecular mechanisms and signaling pathways implicated in these processes may help advance our quest for a therapy against muscle dysfunction in metabolic diseases and in ageing.
8. Search Strategy and Selection Criteria
Author Contributions
Funding
Conflicts of Interest
Abbreviations
References
- Vu, T.H.; Werb, Z. Matrix Metalloproteinases: Effectors of Development and Normal Physiology. Genes Dev. 2000, 14, 2123–2133. [Google Scholar] [CrossRef] [Green Version]
- Page-McCaw, A.; Ewald, A.J.; Werb, Z. Matrix Metalloproteinases and the Regulation of Tissue Remodelling. Nat. Rev. Mol. Cell Biol. 2007, 8, 221–233. [Google Scholar] [CrossRef] [PubMed]
- Bonnans, C.; Chou, J.; Werb, Z. Remodelling the Extracellular Matrix in Development and Disease. Nat. Rev. Mol. Cell Biol. 2014, 15, 786–801. [Google Scholar] [CrossRef] [PubMed]
- Cabral-Pacheco, G.A.; Garza-Veloz, I.; Castruita-De la Rosa, C.; Ramirez-Acuña, J.M.; Perez-Romero, B.A.; Guerrero-Rodriguez, J.F.; Martinez-Avila, N.; Martinez-Fierro, M.L. The Roles of Matrix Metalloproteinases and Their Inhibitors in Human Diseases. Int. J. Mol. Sci. 2020, 21, 9739. [Google Scholar] [CrossRef] [PubMed]
- Arpino, V.; Brock, M.; Gill, S.E. The Role of TIMPs in Regulation of Extracellular Matrix Proteolysis. Matrix Biol. J. Int. Soc. Matrix Biol. 2015, 44–46, 247–254. [Google Scholar] [CrossRef]
- Cui, N.; Hu, M.; Khalil, R.A. Biochemical and Biological Attributes of Matrix Metalloproteinases. Prog. Mol. Biol. Transl. Sci. 2017, 147, 1–73. [Google Scholar] [CrossRef] [Green Version]
- Kessenbrock, K.; Plaks, V.; Werb, Z. Matrix Metalloproteinases: Regulators of the Tumor Microenvironment. Cell 2010, 141, 52–67. [Google Scholar] [CrossRef] [Green Version]
- Chun, T.-H. Peri-Adipocyte ECM Remodeling in Obesity and Adipose Tissue Fibrosis. Adipocyte 2012, 1, 89–95. [Google Scholar] [CrossRef] [PubMed] [Green Version]
- Mor-Yossef Moldovan, L.; Lustig, M.; Naftaly, A.; Mardamshina, M.; Geiger, T.; Gefen, A.; Benayahu, D. Cell Shape Alteration during Adipogenesis Is Associated with Coordinated Matrix Cues. J. Cell. Physiol. 2019, 234, 3850–3863. [Google Scholar] [CrossRef]
- Jääskeläinen, I.; Petäistö, T.; Mirzarazi Dahagi, E.; Mahmoodi, M.; Pihlajaniemi, T.; Kaartinen, M.T.; Heljasvaara, R. Collagens Regulating Adipose Tissue Formation and Functions. Biomedicines 2023, 11, 1412. [Google Scholar] [CrossRef]
- Pellegrinelli, V.; Carobbio, S.; Vidal-Puig, A. Adipose Tissue Plasticity: How Fat Depots Respond Differently to Pathophysiological Cues. Diabetologia 2016, 59, 1075–1088. [Google Scholar] [CrossRef] [PubMed] [Green Version]
- Tchoukalova, Y.D.; Votruba, S.B.; Tchkonia, T.; Giorgadze, N.; Kirkland, J.L.; Jensen, M.D. Regional Differences in Cellular Mechanisms of Adipose Tissue Gain with Overfeeding. Proc. Natl. Acad. Sci. USA 2010, 107, 18226–18231. [Google Scholar] [CrossRef] [Green Version]
- Sillat, T.; Saat, R.; Pöllänen, R.; Hukkanen, M.; Takagi, M.; Konttinen, Y.T. Basement Membrane Collagen Type IV Expression by Human Mesenchymal Stem Cells during Adipogenic Differentiation. J. Cell. Mol. Med. 2012, 16, 1485–1495. [Google Scholar] [CrossRef] [PubMed]
- Després, J.-P.; Lemieux, I. Abdominal Obesity and Metabolic Syndrome. Nature 2006, 444, 881–887. [Google Scholar] [CrossRef] [PubMed]
- Pope, B.D.; Warren, C.R.; Parker, K.K.; Cowan, C.A. Microenvironmental Control of Adipocyte Fate and Function. Trends Cell Biol. 2016, 26, 745–755. [Google Scholar] [CrossRef]
- De Almeida, L.G.N.; Thode, H.; Eslambolchi, Y.; Chopra, S.; Young, D.; Gill, S.; Devel, L.; Dufour, A. Matrix Metalloproteinases: From Molecular Mechanisms to Physiology, Pathophysiology, and Pharmacology. Pharmacol. Rev. 2022, 74, 714–770. [Google Scholar] [CrossRef] [PubMed]
- Patterson, M.L.; Atkinson, S.J.; Knäuper, V.; Murphy, G. Specific Collagenolysis by Gelatinase A, MMP-2, Is Determined by the Hemopexin Domain and Not the Fibronectin-like Domain. FEBS Lett. 2001, 503, 158–162. [Google Scholar] [CrossRef]
- Gioia, M.; Monaco, S.; Van Den Steen, P.E.; Sbardella, D.; Grasso, G.; Marini, S.; Overall, C.M.; Opdenakker, G.; Coletta, M. The collagen binding domain of gelatinase A modulates degradation of collagen IV by gelatinase B. J. Mol. Biol. 2009, 386, 419–434. [Google Scholar] [CrossRef] [PubMed] [Green Version]
- Jackson, H.W.; Defamie, V.; Waterhouse, P.; Khokha, R. TIMPs: Versatile Extracellular Regulators in Cancer. Nat. Rev. Cancer 2017, 17, 38–53. [Google Scholar] [CrossRef]
- Derosa, G.; Ferrari, I.; D’Angelo, A.; Tinelli, C.; Salvadeo, S.A.T.; Ciccarelli, L.; Piccinni, M.N.; Gravina, A.; Ramondetti, F.; Maffioli, P.; et al. Matrix Metalloproteinase-2 and -9 Levels in Obese Patients. Endothel. J. Endothel. Cell Res. 2008, 15, 219–224. [Google Scholar] [CrossRef]
- Han, D.H.; Kim, S.K.; Kang, S.; Choe, B.-K.; Kim, K.S.; Chung, J.-H. Matrix Metallopeptidase 2 Gene Polymorphism Is Associated with Obesity in Korean Population. Korean J. Physiol. Pharmacol. 2008, 12, 125–129. [Google Scholar] [CrossRef] [PubMed] [Green Version]
- Bouwman, F.G.; Boer, J.M.A.; Imholz, S.; Wang, P.; Verschuren, W.M.M.; Dollé, M.E.T.; Mariman, E.C.M. Gender-Specific Genetic Associations of Polymorphisms in ACE, AKR1C2, FTO and MMP2 with Weight Gain over a 10-Year Period. Genes Nutr. 2014, 9, 434. [Google Scholar] [CrossRef] [PubMed] [Green Version]
- Wingrove, C.S.; Garr, E.; Godsland, I.F.; Stevenson, J.C. 17beta-Oestradiol Enhances Release of Matrix Metalloproteinase-2 from Human Vascular Smooth Muscle Cells. Biochim. Biophys. Acta 1998, 1406, 169–174. [Google Scholar] [CrossRef] [PubMed] [Green Version]
- Marin-Castaño, M.E.; Elliot, S.J.; Potier, M.; Karl, M.; Striker, L.J.; Striker, G.E.; Csaky, K.G.; Cousins, S.W. Regulation of Estrogen Receptors and MMP-2 Expression by Estrogens in Human Retinal Pigment Epithelium. Investig. Ophthalmol. Vis. Sci. 2003, 44, 50–59. [Google Scholar] [CrossRef] [PubMed] [Green Version]
- Bouloumié, A.; Sengenès, C.; Portolan, G.; Galitzky, J.; Lafontan, M. Adipocyte Produces Matrix Metalloproteinases 2 and 9: Involvement in Adipose Differentiation. Diabetes 2001, 50, 2080–2086. [Google Scholar] [CrossRef] [PubMed] [Green Version]
- Van Hul, M.; Lijnen, H.R. A Functional Role of Gelatinase A in the Development of Nutritionally Induced Obesity in Mice. J. Thromb. Haemost. 2008, 6, 1198–1206. [Google Scholar] [CrossRef] [PubMed]
- Itoh, T.; Ikeda, T.; Gomi, H.; Nakao, S.; Suzuki, T.; Itohara, S. Unaltered Secretion of β-Amyloid Precursor Protein in Gelatinase A (Matrix Metalloproteinase 2)-Deficient Mice. J. Biol. Chem. 1997, 272, 22389–22392. [Google Scholar] [CrossRef] [Green Version]
- Bauters, D.; Scroyen, I.; Van Hul, M.; Lijnen, H.R. Gelatinase A (MMP-2) Promotes Murine Adipogenesis. Biochim Biophys Acta 2015, 1850, 1449–1456. [Google Scholar] [CrossRef]
- Mazor, R.; Friedmann-Morvinski, D.; Alsaigh, T.; Kleifeld, O.; Kistler, E.B.; Rousso-Noori, L.; Huang, C.; Li, J.B.; Verma, I.M.; Schmid-Schönbein, G.W. Cleavage of the Leptin Receptor by Matrix Metalloproteinase–2 Promotes Leptin Resistance and Obesity in Mice. Sci. Transl. Med. 2018, 10, eaah6324. [Google Scholar] [CrossRef] [Green Version]
- Croissandeau, G.; Chrétien, M.; Mbikay, M. Involvement of Matrix Metalloproteinases in the Adipose Conversion of 3T3-L1 Preadipocytes. Biochem. J. 2002, 364, 739–746. [Google Scholar] [CrossRef]
- Chavey, C.; Mari, B.; Monthouel, M.-N.; Bonnafous, S.; Anglard, P.; Obberghen, E.V.; Tartare-Deckert, S. Matrix Metalloproteinases Are Differentially Expressed in Adipose Tissue during Obesity and Modulate Adipocyte Differentiation. J. Biol. Chem. 2003, 278, 11888–11896. [Google Scholar] [CrossRef] [PubMed] [Green Version]
- Smas, C.M.; Sul, H.S. Pref-1, a Protein Containing EGF-like Repeats, Inhibits Adipocyte Differentiation. Cell 1993, 73, 725–734. [Google Scholar] [CrossRef]
- Friedman, J. The Long Road to Leptin. J. Clin. Investig. 2016, 126, 4727–4734. [Google Scholar] [CrossRef] [Green Version]
- Izquierdo, A.G.; Crujeiras, A.B.; Casanueva, F.F.; Carreira, M.C. Leptin, Obesity, and Leptin Resistance: Where Are We 25 Years Later? Nutrients 2019, 11, 2704. [Google Scholar] [CrossRef] [PubMed] [Green Version]
- Van Hul, M.; Lijnen, H.R. Matrix Metalloproteinase Inhibition Impairs Murine Adipose Tissue Development Independently of Leptin. Endocr. J. 2011, 58, 101–107. [Google Scholar] [CrossRef] [PubMed] [Green Version]
- Derosa, G.; D’Angelo, A.; Tinelli, C.; Devangelio, E.; Consoli, A.; Miccoli, R.; Penno, G.; Del Prato, S.; Paniga, S.; Cicero, A.F. Evaluation of Metalloproteinase 2 and 9 Levels and Their Inhibitors in Diabetic and Healthy Subjects. Diabetes Metab. 2007, 33, 129–134. [Google Scholar] [CrossRef] [PubMed]
- Dubois, S.G.; Tchoukalova, Y.D.; Heilbronn, L.K.; Albu, J.B.; Kelley, D.E.; Smith, S.R.; Fang, X.; Ravussin, E. Potential Role of Increased Matrix Metalloproteinase-2 (MMP2) Transcription in Impaired Adipogenesis in Type 2 Diabetes Mellitus. Biochem. Biophys. Res. Commun. 2008, 367, 725–728. [Google Scholar] [CrossRef] [Green Version]
- Poteryaeva, O.N.; Russkikh, G.S.; Zubova, A.V.; Gevorgyan, M.M.; Usynin, I.F. Changes in Activity of Matrix Metalloproteinases and Serum Concentrations of Proinsulin and C-Peptide Depending on the Compensation Stage of Type 2 Diabetes Mellitus. Bull. Exp. Biol. Med. 2018, 164, 730–733. [Google Scholar] [CrossRef]
- Yabluchanskiy, A.; Ma, Y.; Iyer, R.P.; Hall, M.E.; Lindsey, M.L. Matrix Metalloproteinase-9: Many Shades of Function in Cardiovascular Disease. Physiology 2013, 28, 391–403. [Google Scholar] [CrossRef] [Green Version]
- Van Hul, M.; Piccard, H.; Lijnen, H.R. Gelatinase B (MMP-9) Deficiency Does Not Affect Murine Adipose Tissue Development. Thromb. Haemost. 2010, 104, 165–171. [Google Scholar] [CrossRef] [Green Version]
- Tinahones, F.J.; Coín-Aragüez, L.; Mayas, M.D.; Garcia-Fuentes, E.; Hurtado-del-Pozo, C.; Vendrell, J.; Cardona, F.; Calvo, R.-M.; Obregon, M.-J.; El Bekay, R. Obesity-Associated Insulin Resistance Is Correlated to Adipose Tissue Vascular Endothelial Growth Factors and Metalloproteinase Levels. BMC Physiol. 2012, 12, 4. [Google Scholar] [CrossRef] [PubMed] [Green Version]
- Unal, R.; Yao-Borengasser, A.; Varma, V.; Rasouli, N.; Labbate, C.; Kern, P.A.; Ranganathan, G. Matrix Metalloproteinase-9 Is Increased in Obese Subjects and Decreases in Response to Pioglitazone. J. Clin. Endocrinol. Metab. 2010, 95, 2993–3001. [Google Scholar] [CrossRef] [PubMed] [Green Version]
- Yu, A.P.; Tam, B.T.; Yau, W.Y.; Chan, K.S.; Yu, S.S.; Chung, T.L.; Siu, P.M. Association of Endothelin-1 and Matrix Metallopeptidase-9 with Metabolic Syndrome in Middle-Aged and Older Adults. Diabetol. Metab. Syndr. 2015, 7, 111. [Google Scholar] [CrossRef] [PubMed] [Green Version]
- Hopps, E.; Lo Presti, R.; Montana, M.; Noto, D.; Averna, M.R.; Caimi, G. Gelatinases and Their Tissue Inhibitors in a Group of Subjects with Metabolic Syndrome. J. Investig. Med. 2013, 61, 978–983. [Google Scholar] [CrossRef]
- Roberts, C.K.; Won, D.; Pruthi, S.; Kurtovic, S.; Sindhu, R.K.; Vaziri, N.D.; Barnard, R.J. Effect of a Short-Term Diet and Exercise Intervention on Oxidative Stress, Inflammation, MMP-9, and Monocyte Chemotactic Activity in Men with Metabolic Syndrome Factors. J. Appl. Physiol. 2006, 100, 1657–1665. [Google Scholar] [CrossRef] [PubMed] [Green Version]
- Lee, Y.J.; Heo, Y.-S.; Park, H.S.; Lee, S.H.; Lee, S.K.; Jang, Y.J. Serum SPARC and Matrix Metalloproteinase-2 and Metalloproteinase-9 Concentrations after Bariatric Surgery in Obese Adults. Obes. Surg. 2014, 24, 604–610. [Google Scholar] [CrossRef] [PubMed]
- Miksztowicz, V.; Morales, C.; Zago, V.; Friedman, S.; Schreier, L.; Berg, G. Effect of Insulin-Resistance on Circulating and Adipose Tissue MMP-2 and MMP-9 Activity in Rats Fed a Sucrose-Rich Diet. Nutr. Metab. Cardiovasc. Dis. 2014, 24, 294–300. [Google Scholar] [CrossRef]
- Ribeiro, R.T.; Lautt, W.W.; Legare, D.J.; Macedo, M.P. Insulin Resistance Induced by Sucrose Feeding in Rats Is Due to an Impairment of the Hepatic Parasympathetic Nerves. Diabetologia 2005, 48, 976–983. [Google Scholar] [CrossRef]
- Al-Rashed, F.; Kochumon, S.; Usmani, S.; Sindhu, S.; Ahmad, R. Pam3CSK4 Induces MMP-9 Expression in Human Monocytic THP-1 Cells. Cell. Physiol. Biochem. 2017, 41, 1993–2003. [Google Scholar] [CrossRef]
- Dali-Youcef, N.; Mecili, M.; Ricci, R.; Andres, E. Metabolic Inflammation: Connecting Obesity and Insulin Resistance. Ann. Med. 2013, 45, 242–253. [Google Scholar] [CrossRef]
- Dali-Youcef, N.; Ricci, R. Signalling Networks Governing Metabolic Inflammation. Handb. Exp. Pharmacol. 2016, 233, 195–220. [Google Scholar] [CrossRef] [PubMed]
- Matulewicz, N.; Stefanowicz, M.; Nikolajuk, A.; Karczewska-Kupczewska, M. Markers of Adipogenesis, but Not Inflammation, in Adipose Tissue Are Independently Related to Insulin Sensitivity. J. Clin. Endocrinol. Metab. 2017, 102, 3040–3049. [Google Scholar] [CrossRef] [Green Version]
- Muir, L.A.; Kiridena, S.; Griffin, C.; DelProposto, J.B.; Geletka, L.; Martinez-Santibañez, G.; Zamarron, B.F.; Lucas, H.; Singer, K.; O’ Rourke, R.W.; et al. Frontline Science: Rapid Adipose Tissue Expansion Triggers Unique Proliferation and Lipid Accumulation Profiles in Adipose Tissue Macrophages. J. Leukoc. Biol. 2018, 103, 615–628. [Google Scholar] [CrossRef] [PubMed]
- Wan, J.; Zhang, G.; Li, X.; Qiu, X.; Ouyang, J.; Dai, J.; Min, S. Matrix Metalloproteinase 3: A Promoting and Destabilizing Factor in the Pathogenesis of Disease and Cell Differentiation. Front. Physiol. 2021, 12, 663978. [Google Scholar] [CrossRef]
- Piskór, B.M.; Przylipiak, A.; Dąbrowska, E.; Niczyporuk, M.; Ławicki, S. Matrilysins and Stromelysins in Pathogenesis and Diagnostics of Cancers. Cancer Manag. Res. 2020, 12, 10949–10964. [Google Scholar] [CrossRef] [PubMed]
- Maquoi, E.; Munaut, C.; Colige, A.; Collen, D.; Lijnen, H.R. Modulation of Adipose Tissue Expression of Murine Matrix Metalloproteinases and Their Tissue Inhibitors with Obesity. Diabetes 2002, 51, 1093–1101. [Google Scholar] [CrossRef] [PubMed] [Green Version]
- Maquoi, E.; Demeulemeester, D.; Vörös, G.; Collen, D.; Lijnen, H.R. Enhanced Nutritionally Induced Adipose Tissue Development in Mice with Stromelysin-1 Gene Inactivation. Thromb. Haemost. 2003, 89, 696–704. [Google Scholar] [CrossRef]
- Wu, Y.; Lee, M.-J.; Ido, Y.; Fried, S.K. High-Fat Diet-Induced Obesity Regulates MMP3 to Modulate Depot- and Sex-Dependent Adipose Expansion in C57BL/6J Mice. Am. J. Physiol. Endocrinol. Metab. 2017, 312, E58–E71. [Google Scholar] [CrossRef]
- Alexander, C.M.; Selvarajan, S.; Mudgett, J.; Werb, Z. Stromelysin-1 Regulates Adipogenesis during Mammary Gland Involution. J. Cell Biol. 2001, 152, 693–703. [Google Scholar] [CrossRef] [Green Version]
- Luna-Vital, D.; Luzardo-Ocampo, I.; Cuellar-Nuñez, M.L.; Loarca-Piña, G.; Gonzalez de Mejia, E. Maize Extract Rich in Ferulic Acid and Anthocyanins Prevents High-Fat-Induced Obesity in Mice by Modulating SIRT1, AMPK and IL-6 Associated Metabolic and Inflammatory Pathways. J. Nutr. Biochem. 2020, 79, 108343. [Google Scholar] [CrossRef]
- Boumiza, S.; Bchir, S.; Ben Nasr, H.; Abbassi, A.; Jacob, M.-P.; Norel, X.; Tabka, Z.; Chahed, K. Role of MMP-1 (-519A/G, -1607 1G/2G), MMP-3 (Lys45Glu), MMP-7 (-181A/G), and MMP-12 (-82A/G) Variants and Plasma MMP Levels on Obesity-Related Phenotypes and Microvascular Reactivity in a Tunisian Population. Dis. Markers 2017, 2017, 6198526. [Google Scholar] [CrossRef] [Green Version]
- Unoki, H.; Bujo, H.; Shibasaki, M.; Saito, Y. Increased Matrix Metalloproteinase-3 MRNA Expression in Visceral Fat in Mice Implanted with Cultured Preadipocytes. Biochem. Biophys. Res. Commun. 2006, 350, 392–398. [Google Scholar] [CrossRef]
- Murakami, K.; Bujo, H.; Unoki, H.; Saito, Y. High Fat Intake Induces a Population of Adipocytes to Co-Express TLR2 and TNFα in Mice with Insulin Resistance. Biochem. Biophys. Res. Commun. 2007, 354, 727–734. [Google Scholar] [CrossRef]
- Kawamura, T.; Murakami, K.; Bujo, H.; Unoki, H.; Jiang, M.; Nakayama, T.; Saito, Y. Matrix Metalloproteinase-3 Enhances the Free Fatty Acids-Induced VEGF Expression in Adipocytes through Toll-like Receptor 2. Exp. Biol. Med. 2008, 233, 1213–1221. [Google Scholar] [CrossRef] [PubMed]
- Unoki, H.; Bujo, H.; Jiang, M.; Kawamura, T.; Murakami, K.; Saito, Y. Macrophages Regulate Tumor Necrosis Factor-α Expression in Adipocytes through the Secretion of Matrix Metalloproteinase-3. Int. J. Obes. 2008, 32, 902–911. [Google Scholar] [CrossRef] [PubMed] [Green Version]
- Hotamisligil, G.S. Inflammation, Metaflammation and Immunometabolic Disorders. Nature 2017, 542, 177–185. [Google Scholar] [CrossRef] [PubMed]
- Schlage, P.; Kockmann, T.; Sabino, F.; Kizhakkedathu, J.N.; Auf dem Keller, U. Matrix Metalloproteinase 10 Degradomics in Keratinocytes and Epidermal Tissue Identifies Bioactive Substrates With Pleiotropic Functions. Mol. Cell. Proteom. 2015, 14, 3234–3246. [Google Scholar] [CrossRef] [PubMed] [Green Version]
- Lijnen, H.R.; Van Hoef, B.; Rodriguez, J.A.; Paramo, J.A. Stromelysin-2 (MMP-10) Deficiency Does Not Affect Adipose Tissue Formation in a Mouse Model of Nutritionally Induced Obesity. Biochem. Biophys. Res. Commun. 2009, 389, 378–381. [Google Scholar] [CrossRef]
- O’Hara, A.; Lim, F.L.; Mazzatti, D.J.; Trayhurn, P. Microarray Analysis Identifies Matrix Metalloproteinases (MMPs) as Key Genes Whose Expression Is up-Regulated in Human Adipocytes by Macrophage-Conditioned Medium. Pflug. Arch. 2009, 458, 1103–1114. [Google Scholar] [CrossRef]
- Rouyer, N.; Wolf, C.; Chenard, M.P.; Rio, M.C.; Chambon, P.; Bellocq, J.P.; Basset, P. Stromelysin-3 Gene Expression in Human Cancer: An Overview. Invasion Metastasis 1994, 14, 269–275. [Google Scholar]
- Basset, P.; Wolf, C.; Chambon, P. Expression of the Stromelysin-3 Gene in Fibroblastic Cells of Invasive Carcinomas of the Breast and Other Human Tissues: A Review. Breast Cancer Res. Treat. 1993, 24, 185–193. [Google Scholar] [CrossRef]
- Zhang, X.; Huang, S.; Guo, J.; Zhou, L.; You, L.; Zhang, T.; Zhao, Y. Insights into the Distinct Roles of MMP-11 in Tumor Biology and Future Therapeutics (Review). Int. J. Oncol. 2016, 48, 1783–1793. [Google Scholar] [CrossRef] [Green Version]
- Basset, P.; Bellocq, J.P.; Wolf, C.; Stoll, I.; Hutin, P.; Limacher, J.M.; Podhajcer, O.L.; Chenard, M.P.; Rio, M.C.; Chambon, P. A Novel Metalloproteinase Gene Specifically Expressed in Stromal Cells of Breast Carcinomas. Nature 1990, 348, 699–704. [Google Scholar] [CrossRef] [PubMed]
- Lijnen, H.R.; Van, H.B.; Frederix, L.; Rio, M.C.; Collen, D. Adipocyte Hypertrophy in Stromelysin-3 Deficient Mice with Nutritionally Induced Obesity. Thromb. Haemost. 2002, 87, 530–535. [Google Scholar]
- Andarawewa, K.L.; Motrescu, E.R.; Chenard, M.P.; Gansmuller, A.; Stoll, I.; Tomasetto, C.; Rio, M.C. Stromelysin-3 Is a Potent Negative Regulator of Adipogenesis Participating to Cancer Cell-Adipocyte Interaction/Crosstalk at the Tumor Invasive Front. Cancer Res. 2005, 65, 10862–10871. [Google Scholar] [CrossRef] [PubMed] [Green Version]
- Dali-Youcef, N.; Hnia, K.; Blaise, S.; Messaddeq, N.; Blanc, S.; Postic, C.; Valet, P.; Tomasetto, C.; Rio, M.-C. Matrix Metalloproteinase 11 Protects from Diabesity and Promotes Metabolic Switch. Sci. Rep. 2016, 6, 25140. [Google Scholar] [CrossRef] [PubMed] [Green Version]
- Manes, S.; Mira, E.; Barbacid, M.M.; Cipres, A.; Fernandez-Resa, P.; Buesa, J.M.; Merida, I.; Aracil, M.; Marquez, G.; Martinez, A.C. Identification of Insulin-like Growth Factor-Binding Protein-1 as a Potential Physiological Substrate for Human Stromelysin-3. J. Biol. Chem. 1997, 272, 25706–25712. [Google Scholar] [CrossRef] [Green Version]
- Tan, B.; Jaulin, A.; Bund, C.; Outilaft, H.; Wendling, C.; Chenard, M.-P.; Alpy, F.; Cicek, A.E.; Namer, I.J.; Tomasetto, C.; et al. Matrix Metalloproteinase-11 Promotes Early Mouse Mammary Gland Tumor Growth through Metabolic Reprogramming and Increased IGF1/AKT/FoxO1 Signaling Pathway, Enhanced ER Stress and Alteration in Mitochondrial UPR. Cancers 2020, 12, 2357. [Google Scholar] [CrossRef]
- Su, C.; Wang, W.; Wang, C. IGF-1-Induced MMP-11 Expression Promotes the Proliferation and Invasion of Gastric Cancer Cells through the JAK1/STAT3 Signaling Pathway. Oncol. Lett. 2018, 15, 7000–7006. [Google Scholar] [CrossRef] [PubMed]
- Arcidiacono, B.; Chiefari, E.; Laria, A.E.; Messineo, S.; Bilotta, F.L.; Britti, D.; Foti, D.P.; Foryst-Ludwig, A.; Kintscher, U.; Brunetti, A. Expression of Matrix Metalloproteinase-11 Is Increased under Conditions of Insulin Resistance. World J. Diabetes 2017, 8, 422–428. [Google Scholar] [CrossRef]
- Rockstroh, D.; Löffler, D.; Kiess, W.; Landgraf, K.; Körner, A. Regulation of Human Adipogenesis by MiR125b-5p. Adipocyte 2016, 5, 283–297. [Google Scholar] [CrossRef] [Green Version]
- Manka, S.W.; Carafoli, F.; Visse, R.; Bihan, D.; Raynal, N.; Farndale, R.W.; Murphy, G.; Enghild, J.J.; Hohenester, E.; Nagase, H. Structural Insights into Triple-Helical Collagen Cleavage by Matrix Metalloproteinase 1. Proc. Natl. Acad. Sci. USA 2012, 109, 12461–12466. [Google Scholar] [CrossRef] [PubMed] [Green Version]
- Van Doren, S.R. Matrix Metalloproteinase Interactions with Collagen and Elastin. Matrix Biol. 2015, 44–46, 224–231. [Google Scholar] [CrossRef]
- Pardo, A.; Selman, M. MMP-1: The Elder of the Family. Int. J. Biochem. Cell Biol. 2005, 37, 283–288. [Google Scholar] [CrossRef] [PubMed]
- Nho, Y.-K.; Ha, E.; Yu, K.-I.; Chung, J.-H.; Wook, N.-C.; Chung, I.-S.; Lee, M.-Y.; Shin, D.-H. Matrix Metalloproteinase-1 Promoter Is Associated with Body Mass Index in Korean Population with Aged Greater or Equal to 50 Years. Clin. Chim. Acta 2008, 396, 14–17. [Google Scholar] [CrossRef] [PubMed]
- Huang, H.-L.; Wu, S.; Hsu, L.-A.; Teng, M.-S.; Lin, J.-F.; Sun, Y.-C.; Ko, Y.-L. Genetic Variants Associated with Circulating MMP1 Levels near Matrix Metalloproteinase Genes on Chromosome 11q21-22 in Taiwanese: Interaction with Obesity. BMC Med. Genet. 2013, 14, 30. [Google Scholar] [CrossRef] [PubMed] [Green Version]
- Wu, Y.; Duan, H.; Tian, X.; Xu, C.; Wang, W.; Jiang, W.; Pang, Z.; Zhang, D.; Tan, Q. Genetics of Obesity Traits: A Bivariate Genome-Wide Association Analysis. Front. Genet. 2018, 9, 179. [Google Scholar] [CrossRef] [Green Version]
- Drzewoski, J.; Sliwińska, A.; Przybyłowska, K.; Sliwiński, T.; Kasznicki, J.; Zurawska-Klis, M.; Kosmalski, M.; Majsterek, I. Gene Polymorphisms and Antigen Levels of Matrix Metalloproteinase-1 in Type 2 Diabetes Mellitus Coexisting with Coronary Heart Disease. Kardiol. Pol. 2008, 66, 1042–1048. [Google Scholar]
- Ma, Y.Z.; Jiang, Q.Y.; Kong, D.Q. Association between Matrix Metallopeptidase 1 and Type 2 Diabetes Mellitus Coexisting with Coronary Heart Disease in a Han Chinese Population. Genet. Mol. Res. 2016, 15, 2–7. [Google Scholar] [CrossRef]
- Lin, Y.; Li, J.; Wu, D.; Wang, F.; Fang, Z.; Shen, G. Identification of Hub Genes in Type 2 Diabetes Mellitus Using Bioinformatics Analysis. Diabetes Metab. Syndr. Obes. Targets Ther. 2020, 13, 1793–1801. [Google Scholar] [CrossRef]
- Gao, D.; Bing, C. Macrophage-Induced Expression and Release of Matrix Metalloproteinase 1 and 3 by Human Preadipocytes Is Mediated by IL-1β via Activation of MAPK Signaling. J. Cell. Physiol. 2011, 226, 2869–2880. [Google Scholar] [CrossRef] [PubMed]
- Iwata, T.; Kuwajima, M.; Sukeno, A.; Ishimaru, N.; Hayashi, Y.; Wabitsch, M.; Mizusawa, N.; Itakura, M.; Yoshimoto, K. YKL-40 Secreted from Adipose Tissue Inhibits Degradation of Type I Collagen. Biochem. Biophys. Res. Commun. 2009, 388, 511–516. [Google Scholar] [CrossRef]
- Traurig, M.T.; Permana, P.A.; Nair, S.; Kobes, S.; Bogardus, C.; Baier, L.J. Differential Expression of Matrix Metalloproteinase 3 (MMP3) in Preadipocytes/Stromal Vascular Cells from Nonobese Nondiabetic versus Obese Nondiabetic Pima Indians. Diabetes 2006, 55, 3160–3165. [Google Scholar] [CrossRef] [PubMed] [Green Version]
- Song, B.; Zhang, H.; Zhang, S. Toll-like Receptor 2 Mediates Deposition of Collagen I in Adipose Tissue of High Fat Diet-induced Obese Mice. Mol. Med. Rep. 2018, 17, 5958–5963. [Google Scholar] [CrossRef] [Green Version]
- Keophiphath, M.; Achard, V.; Henegar, C.; Rouault, C.; Clément, K.; Lacasa, D. Macrophage-Secreted Factors Promote a Profibrotic Phenotype in Human Preadipocytes. Mol. Endocrinol. 2009, 23, 11–24. [Google Scholar] [CrossRef] [PubMed] [Green Version]
- Huber, J.; Löffler, M.; Bilban, M.; Reimers, M.; Kadl, A.; Todoric, J.; Zeyda, M.; Geyeregger, R.; Schreiner, M.; Weichhart, T.; et al. Prevention of High-Fat Diet-Induced Adipose Tissue Remodeling in Obese Diabetic Mice by n-3 Polyunsaturated Fatty Acids. Int. J. Obes. 2007, 31, 1004–1013. [Google Scholar] [CrossRef] [PubMed] [Green Version]
- Van Lint, P.; Libert, C. Matrix Metalloproteinase-8: Cleavage Can Be Decisive. Cytokine Growth Factor Rev. 2006, 17, 217–223. [Google Scholar] [CrossRef]
- Khokha, R.; Murthy, A.; Weiss, A. Metalloproteinases and Their Natural Inhibitors in Inflammation and Immunity. Nat. Rev. Immunol. 2013, 13, 649–665. [Google Scholar] [CrossRef]
- Lauhio, A.; Färkkilä, E.; Pietiläinen, K.H.; Åström, P.; Winkelmann, A.; Tervahartiala, T.; Pirilä, E.; Rissanen, A.; Kaprio, J.; Sorsa, T.A.; et al. Association of MMP-8 with Obesity, Smoking and Insulin Resistance. Eur. J. Clin. Investig. 2016, 46, 757–765. [Google Scholar] [CrossRef]
- Gonçalves, F.M.; Jacob-Ferreira, A.L.B.; Gomes, V.A.; Casella-Filho, A.; Chagas, A.C.P.; Marcaccini, A.M.; Gerlach, R.F.; Tanus-Santos, J.E. Increased Circulating Levels of Matrix Metalloproteinase (MMP)-8, MMP-9, and pro-Inflammatory Markers in Patients with Metabolic Syndrome. Clin. Chim. Acta 2009, 403, 173–177. [Google Scholar] [CrossRef]
- Zayani, Y.; El Golli, N.; Zidi, W.; Guizani, I.; Boussairi, S.; Aloui, S.; Ayadi, I.; Ftouhi, B.; Feki, M.; Ben Romdhane, N.; et al. Inflammations Mediators and Circulating Levels of Matrix Metalloproteinases: Biomarkers of Diabetes in Tunisians Metabolic Syndrome Patients. Cytokine 2016, 86, 47–52. [Google Scholar] [CrossRef]
- Liberale, L.; Bonaventura, A.; Carbone, F.; Bertolotto, M.; Contini, P.; Scopinaro, N.; Camerini, G.B.; Papadia, F.S.; Cordera, R.; Camici, G.G.; et al. Early Reduction of Matrix Metalloproteinase-8 Serum Levels Is Associated with Leptin Drop and Predicts Diabetes Remission after Bariatric Surgery. Int. J. Cardiol. 2017, 245, 257–262. [Google Scholar] [CrossRef]
- Kuehl, M.N.; Rodriguez, H.; Burkhardt, B.R.; Alman, A.C. Tumor Necrosis Factor-α, Matrix-Metalloproteinases 8 and 9 Levels in the Saliva Are Associated with Increased Hemoglobin A1c in Type 1 Diabetes Subjects. PLoS ONE 2015, 10, e0125320. [Google Scholar] [CrossRef] [PubMed]
- Akcalı, A.; Gümüş, P.; Özçaka, Ö.; Öztürk-Ceyhan, B.; Tervahartiala, T.; Husu, H.; Heikkinen, A.M.; Sorsa, T.; Buduneli, N. Proteolytic Mediators in Gestational Diabetes Mellitus and Gingivitis. J. Periodontol. 2017, 88, 289–297. [Google Scholar] [CrossRef]
- Huhtala, M.S.; Tertti, K.; Juhila, J.; Sorsa, T.; Rönnemaa, T. Metformin and Insulin Treatment of Gestational Diabetes: Effects on Inflammatory Markers and IGF-Binding Protein-1–Secondary Analysis of a Randomized Controlled Trial. BMC Pregnancy Childbirth 2020, 20, 401. [Google Scholar] [CrossRef] [PubMed]
- Kim, S.M.; Romero, R.; Park, J.W.; Oh, K.J.; Jun, J.K.; Yoon, B.H. The Relationship between the Intensity of Intra-Amniotic Inflammation and the Presence and Severity of Acute Histologic Chorioamnionitis in Preterm Gestations. J. Matern. Neonatal Med. 2015, 28, 1500–1509. [Google Scholar] [CrossRef] [PubMed] [Green Version]
- Ashford, K.; Chavan, N.R.; Wiggins, A.T.; Sayre, M.M.; McCubbin, A.; Critchfield, A.S.; O’Brien, J. Comparison of Serum and Cervical Cytokine Levels throughout Pregnancy between Preterm and Term Births. Am. J. Perinatol. Rep. 2018, 8, e113–e120. [Google Scholar] [CrossRef] [Green Version]
- Solomonov, I.; Zehorai, E.; Talmi-Frank, D.; Wolf, S.G.; Shainskaya, A.; Zhuravlev, A.; Kartvelishvily, E.; Visse, R.; Levin, Y.; Kampf, N.; et al. Distinct Biological Events Generated by ECM Proteolysis by Two Homologous Collagenases. Proc. Natl. Acad. Sci. USA 2016, 113, 10884–10889. [Google Scholar] [CrossRef] [Green Version]
- Berg, G.; Barchuk, M.; Miksztowicz, V. Behavior of Metalloproteinases in Adipose Tissue, Liver and Arterial Wall: An Update of Extracellular Matrix Remodeling. Cells 2019, 8, 158. [Google Scholar] [CrossRef] [Green Version]
- Shih, C.L.; Ajuwon, K.M. Inhibition of MMP-13 Prevents Diet-Induced Obesity in Mice and Suppresses Adipogenesis in 3T3-L1 Preadipocytes. Mol. Biol. Rep. 2015, 42, 1225–1232. [Google Scholar] [CrossRef]
- Werb, Z.; Gordon, S. Elastase Secretion by Stimulated Macrophages. Characterization and Regulation. J. Exp. Med. 1975, 142, 361–377. [Google Scholar] [CrossRef]
- Belaaouaj, A.; Shipley, J.M.; Kobayashi, D.K.; Zimonjic, D.B.; Popescu, N.; Silverman, G.A.; Shapiro, S.D. Human Macrophage Metalloelastase. Genomic Organization, Chromosomal Location, Gene Linkage, and Tissue-Specific Expression. J. Biol. Chem. 1995, 270, 14568–14575. [Google Scholar] [CrossRef] [PubMed] [Green Version]
- Bauters, D.; Van Hul, M.; Lijnen, H.R. Macrophage Elastase (MMP-12) in Expanding Murine Adipose Tissue. Biochim. Biophys. Acta 2013, 1830, 2954–2959. [Google Scholar] [CrossRef]
- Rőszer, T. Understanding the Mysterious M2 Macrophage through Activation Markers and Effector Mechanisms. Mediat. Inflamm. 2015, 2015, e816460. [Google Scholar] [CrossRef] [Green Version]
- Lee, S.J.; Evers, S.; Roeder, D.; Parlow, A.F.; Risteli, J.; Risteli, L.; Lee, Y.C.; Feizi, T.; Langen, H.; Nussenzweig, M.C. Mannose Receptor-Mediated Regulation of Serum Glycoprotein Homeostasis. Science 2002, 295, 1898–1901. [Google Scholar] [CrossRef]
- Lee, J.-T.; Pamir, N.; Liu, N.-C.; Kirk, E.A.; Averill, M.M.; Becker, L.; Larson, I.; Hagman, D.K.; Foster-Schubert, K.E.; van Yserloo, B.; et al. Macrophage Metalloelastase (MMP12) Regulates Adipose Tissue Expansion, Insulin Sensitivity, and Expression of Inducible Nitric Oxide Synthase. Endocrinology 2014, 155, 3409–3420. [Google Scholar] [CrossRef] [Green Version]
- Li, Z.; Gurung, M.; Rodrigues, R.R.; Padiadpu, J.; Newman, N.K.; Manes, N.P.; Pederson, J.W.; Greer, R.L.; Vasquez-Perez, S.; You, H.; et al. Microbiota and Adipocyte Mitochondrial Damage in Type 2 Diabetes Are Linked by Mmp12+ Macrophages. J. Exp. Med. 2022, 219, e20220017. [Google Scholar] [CrossRef] [PubMed]
- Wilson, C.L.; Matrisian, L.M. Matrilysin: An Epithelial Matrix Metalloproteinase with Potentially Novel Functions. Int. J. Biochem. Cell Biol. 1996, 28, 123–136. [Google Scholar] [CrossRef] [PubMed]
- Gaide Chevronnay, H.P.; Selvais, C.; Emonard, H.; Galant, C.; Marbaix, E.; Henriet, P. Regulation of Matrix Metalloproteinases Activity Studied in Human Endometrium as a Paradigm of Cyclic Tissue Breakdown and Regeneration. Biochim. Biophys. Acta BBA Proteins Proteomics 2012, 1824, 146–156. [Google Scholar] [CrossRef]
- Grzechocińska, B.; Dąbrowski, F.A.; Sierdzinski, J.; Cyganek, A.; Wielgoś, M. The Association between Serum Metalloproteinase Concentration, Obesity, and Hormone Levels in Reproductive-Aged Women. Endokrynol. Pol. 2019, 70, 49–56. [Google Scholar] [CrossRef] [Green Version]
- Lawler, H.M.; Underkofler, C.M.; Kern, P.A.; Erickson, C.; Bredbeck, B.; Rasouli, N. Adipose Tissue Hypoxia, Inflammation, and Fibrosis in Obese Insulin-Sensitive and Obese Insulin-Resistant Subjects. J. Clin. Endocrinol. Metab. 2016, 101, 1422–1428. [Google Scholar] [CrossRef] [PubMed] [Green Version]
- Ress, C.; Tschoner, A.; Ciardi, C.; Laimer, M.W.; Engl, J.W.; Sturm, W.; Weiss, H.; Tilg, H.; Ebenbichler, C.F.; Patsch, J.R.; et al. Influence of Significant Weight Loss on Serum Matrix Metalloproteinase (MMP)-7 Levels. Eur. Cytokine Netw. 2010, 21, 65–70. [Google Scholar] [CrossRef] [PubMed]
- Barber, D.L.; Cacace, A.M.; Raucci, D.T.; Ganz, M.B. Fatty Acids Stereospecifically Stimulate Neurotensin Release and Increase [Ca2+]i in Enteric Endocrine Cells. Am. J. Physiol. 1991, 261, G497–G503. [Google Scholar] [CrossRef] [PubMed]
- Miyashita, T.; Hashimoto, T.; Gomez, G.; Courtney, M.; Townsend, J.; George, H.; Greeley, J.; Thompson, J.C. Neurotensin Secretion in Response to Intraduodenal and Intraileal Administration of Fat in Dogs. Neurosignals 1992, 1, 275–281. [Google Scholar] [CrossRef]
- Drewe, J.; Mihailovic, S.; D’Amato, M.; Beglinger, C. Regulation of Fat-Stimulated Neurotensin Secretion in Healthy Subjects. J. Clin. Endocrinol. Metab. 2008, 93, 1964–1970. [Google Scholar] [CrossRef]
- Li, J.; Li, X.; Song, J.; Yan, B.; Rock, S.A.; Jia, J.; Liu, J.; Wang, C.; Weiss, T.; Weiss, H.L.; et al. Absence of Neurotensin Attenuates Intestinal Dysbiosis and Inflammation by Maintaining Mmp7/α-Defensin Axis in Diet-Induced Obese Mice. FASEB J. 2020, 34, 8596–8610. [Google Scholar] [CrossRef]
- Li, J.; Song, J.; Zaytseva, Y.Y.; Liu, Y.; Rychahou, P.; Jiang, K.; Starr, M.E.; Kim, J.T.; Harris, J.W.; Yiannikouris, F.B.; et al. An Obligatory Role for Neurotensin in High-Fat-Diet-Induced Obesity. Nature 2016, 533, 411–415. [Google Scholar] [CrossRef] [Green Version]
- De Vito, F.; Cassano, V.; Mancuso, E.; Succurro, E.; Hribal, M.L.; Sciacqua, A.; Andreozzi, F.; Sesti, G.; Fiorentino, T.V. Higher Circulating Levels of Proneurotensin Are Associated with Increased Risk of Incident NAFLD. J. Intern. Med. 2023. [Google Scholar] [CrossRef]
- Sentinelli, F.; Barchetta, I.; Cimini, F.A.; Dule, S.; Bailetti, D.; Cossu, E.; Barbonetti, A.; Totaro, M.; Melander, O.; Cavallo, M.G.; et al. Neurotensin Gene Rs2234762 C>G Variant Associates with Reduced Circulating Pro-NT Levels and Predicts Lower Insulin Resistance in Overweight/Obese Children. Int. J. Mol. Sci. 2023, 24, 6460. [Google Scholar] [CrossRef]
- Lin, B.-Z.; Pilch, P.F.; Kandror, K.V. Sortilin Is a Major Protein Component of Glut4-Containing Vesicles. J. Biol. Chem. 1997, 272, 24145–24147. [Google Scholar] [CrossRef] [Green Version]
- Morris, N.J.; Ross, S.A.; Lane, W.S.; Moestrup, S.K.; Petersen, C.M.; Keller, S.R.; Lienhard, G.E. Sortilin Is the Major 110-KDa Protein in GLUT4 Vesicles from Adipocytes. J. Biol. Chem. 1998, 273, 3582–3587. [Google Scholar] [CrossRef] [PubMed] [Green Version]
- De Coignac, A.B.; Elson, G.; Delneste, Y.; Magistrelli, G.; Jeannin, P.; Aubry, J.P.; Berthier, O.; Schmitt, D.; Bonnefoy, J.Y.; Gauchat, J.F. Cloning of MMP-26. A Novel Matrilysin-like Proteinase. Eur. J. Biochem. 2000, 267, 3323–3329. [Google Scholar] [CrossRef] [PubMed]
- Isaka, K.; Nishi, H.; Nakai, H.; Nakada, T.; Li, Y.F.; Ebihara, Y.; Takayama, M. Matrix Metalloproteinase-26 Is Expressed in Human Endometrium but Not in Endometrial Carcinoma. Cancer 2003, 97, 79–89. [Google Scholar] [CrossRef] [PubMed]
- Piskór, B.M.; Przylipiak, A.; Dąbrowska, E.; Sidorkiewicz, I.; Niczyporuk, M.; Szmitkowski, M.; Ławicki, S. Plasma Concentrations of Matrilysins MMP-7 and MMP-26 as Diagnostic Biomarkers in Breast Cancer. J. Clin. Med. 2021, 10, 1436. [Google Scholar] [CrossRef]
- Cheng, T.; Li, F.; Wei, R.; Lv, M.-Q.; Zhou, Y.; Dai, Y.; Yuan, Y.; Jiang, G.-Y.; Ma, D.; Gao, Q.-L. MMP26: A Potential Biomarker for Prostate Cancer. Curr. Med. Sci. 2017, 37, 891–894. [Google Scholar] [CrossRef]
- Cauchi, S.; Proença, C.; Choquet, H.; Gaget, S.; De Graeve, F.; Marre, M.; Balkau, B.; Tichet, J.; Meyre, D.; Vaxillaire, M.; et al. Analysis of Novel Risk Loci for Type 2 Diabetes in a General French Population: The D.E.S.I.R. Study. J. Mol. Med. 2008, 86, 341–348. [Google Scholar] [CrossRef]
- Sladek, R.; Rocheleau, G.; Rung, J.; Dina, C.; Shen, L.; Serre, D.; Boutin, P.; Vincent, D.; Belisle, A.; Hadjadj, S.; et al. A Genome-Wide Association Study Identifies Novel Risk Loci for Type 2 Diabetes. Nature 2007, 445, 881–885. [Google Scholar] [CrossRef]
- Pendás, A.M.; Knäuper, V.; Puente, X.S.; Llano, E.; Mattei, M.G.; Apte, S.; Murphy, G.; López-Otín, C. Identification and Characterization of a Novel Human Matrix Metalloproteinase with Unique Structural Characteristics, Chromosomal Location, and Tissue Distribution. J. Biol. Chem. 1997, 272, 4281–4286. [Google Scholar] [CrossRef] [Green Version]
- Pendás, A.M.; Folgueras, A.R.; Llano, E.; Caterina, J.; Frerard, F.; Rodríguez, F.; Astudillo, A.; Noël, A.; Birkedal-Hansen, H.; López-Otín, C. Diet-Induced Obesity and Reduced Skin Cancer Susceptibility in Matrix Metalloproteinase 19-Deficient Mice. Mol. Cell. Biol. 2004, 24, 5304–5313. [Google Scholar] [CrossRef] [Green Version]
- Itoh, Y. Membrane-Type Matrix Metalloproteinases: Their Functions and Regulations. Matrix Biol. 2015, 44–46, 207–223. [Google Scholar] [CrossRef]
- Turunen, S.P.; Tatti-Bugaeva, O.; Lehti, K. Membrane-Type Matrix Metalloproteases as Diverse Effectors of Cancer Progression. Biochim. Biophys. Acta BBA-Mol. Cell Res. 2017, 1864, 1974–1988. [Google Scholar] [CrossRef] [PubMed]
- Buache, E.; Thai, R.; Wendling, C.; Alpy, F.; Page, A.; Chenard, M.-P.; Dive, V.; Ruff, M.; Dejaegere, A.; Tomasetto, C.; et al. Functional Relationship between Matrix Metalloproteinase-11 and Matrix Metalloproteinase-14. Cancer Med. 2014, 3, 1197–1210. [Google Scholar] [CrossRef] [PubMed]
- Sternlicht, M.D.; Werb, Z. How Matrix Metalloproteinases Regulate Cell Behavior. Annu. Rev. Cell Dev. Biol. 2001, 17, 463–516. [Google Scholar] [CrossRef] [PubMed] [Green Version]
- Deryugina, E.I.; Ratnikov, B.; Monosov, E.; Postnova, T.I.; DiScipio, R.; Smith, J.W.; Strongin, A.Y. MT1-MMP Initiates Activation of pro-MMP-2 and Integrin Avβ3 Promotes Maturation of MMP-2 in Breast Carcinoma Cells. Exp. Cell Res. 2001, 263, 209–223. [Google Scholar] [CrossRef] [PubMed]
- Mori, H.; Bhat, R.; Bruni-Cardoso, A.; Chen, E.I.; Jorgens, D.M.; Coutinho, K.; Louie, K.; Bowen, B.B.; Inman, J.L.; Tecca, V.; et al. New Insight into the Role of MMP14 in Metabolic Balance. PeerJ 2016, 4, e2142. [Google Scholar] [CrossRef] [Green Version]
- Chun, T.-H.; Inoue, M.; Morisaki, H.; Yamanaka, I.; Miyamoto, Y.; Okamura, T.; Sato-Kusubata, K.; Weiss, S.J. Genetic Link between Obesity and MMP14-Dependent Adipogenic Collagen Turnover. Diabetes 2010, 59, 2484–2494. [Google Scholar] [CrossRef] [Green Version]
- Li, X.; Zhao, Y.; Chen, C.; Yang, L.; Lee, H.-H.; Wang, Z.; Zhang, N.; Kolonin, M.G.; An, Z.; Ge, X.; et al. Critical Role of Matrix Metalloproteinase 14 in Adipose Tissue Remodeling during Obesity. Mol. Cell. Biol. 2020, 40, e00564-19. [Google Scholar] [CrossRef]
- Koehler, M.R.; Sauer, C.G.; Reismann, N.; Steinlein, C.; Weber, B.H.; Will, H.; Schmid, M. Localization of the Human Membrane-Type 2 Matrix Metalloproteinase Gene (MMP15) to 16q12.1 near DNA Elements That Are Part of Centromeric and Non-Centromeric Heterochromatin of 11 Human Chromosomes. Chromosome Res. 1998, 6, 199–203. [Google Scholar] [CrossRef]
- Zhang, J.; Sarkar, S.; Yong, V.W. The Chemokine Stromal Cell Derived Factor-1 (CXCL12) Promotes Glioma Invasiveness through MT2-Matrix Metalloproteinase. Carcinogenesis 2005, 26, 2069–2077. [Google Scholar] [CrossRef] [Green Version]
- Abraham, R.; Schäfer, J.; Rothe, M.; Bange, J.; Knyazev, P.; Ullrich, A. Identification of MMP-15 as an Anti-Apoptotic Factor in Cancer Cells. J. Biol. Chem. 2005, 280, 34123–34132. [Google Scholar] [CrossRef] [Green Version]
- Do, M.-S.; Jeong, H.-S.; Choi, B.-H.; Hunter, L.; Langley, S.; Pazmany, L.; Trayhurn, P. Inflammatory Gene Expression Patterns Revealed by DNA Microarray Analysis in TNF-α-Treated SGBS Human Adipocytes. Yonsei Med. J. 2006, 47, 729–736. [Google Scholar] [CrossRef] [Green Version]
- Strong, A.L.; Semon, J.A.; Strong, T.A.; Santoke, T.T.; Zhang, S.; McFerrin, H.E.; Gimble, J.M.; Bunnell, B.A. Obesity-Associated Dysregulation of Calpastatin and MMP-15 in Adipose-Derived Stromal Cells Results in Their Enhanced Invasion. STEM CELLS 2012, 30, 2774–2783. [Google Scholar] [CrossRef] [PubMed]
- Jotzu, C.; Alt, E.; Welte, G.; Li, J.; Hennessy, B.T.; Devarajan, E.; Krishnappa, S.; Pinilla, S.; Droll, L.; Song, Y.-H. Adipose Tissue Derived Stem Cells Differentiate into Carcinoma-Associated Fibroblast-like Cells under the Influence of Tumor Derived Factors. Cell. Oncol. 2011, 34, 55–67. [Google Scholar] [CrossRef] [PubMed]
- Zimmerlin, L.; Donnenberg, A.D.; Rubin, J.P.; Basse, P.; Landreneau, R.J.; Donnenberg, V.S. Regenerative Therapy and Cancer: In Vitro and in Vivo Studies of the Interaction between Adipose-Derived Stem Cells and Breast Cancer Cells from Clinical Isolates. Tissue Eng. Part A 2011, 17, 93–106. [Google Scholar] [CrossRef] [Green Version]
- Brew, K.; Nagase, H. The Tissue Inhibitors of Metalloproteinases (TIMPs): An Ancient Family with Structural and Functional Diversity. Biochim. Biophys. Acta BBA Mol. Cell Res. 2010, 1803, 55–71. [Google Scholar] [CrossRef] [PubMed] [Green Version]
- Meissburger, B.; Stachorski, L.; Roder, E.; Rudofsky, G.; Wolfrum, C. Tissue Inhibitor of Matrix Metalloproteinase 1 (TIMP1) Controls Adipogenesis in Obesity in Mice and in Humans. Diabetologia 2011, 54, 1468–1479. [Google Scholar] [CrossRef] [Green Version]
- Lijnen, H.R.; Demeulemeester, D.; Van Hoef, B.; Collen, D.; Maquoi, E. Deficiency of Tissue Inhibitor of Matrix Metalloproteinase-1 (TIMP-1) Impairs Nutritionally Induced Obesity in Mice. Thromb. Haemost. 2003, 89, 249–255. [Google Scholar]
- Fjære, E.; Andersen, C.; Myrmel, L.S.; Petersen, R.K.; Hansen, J.B.; Tastesen, H.S.; Mandrup-Poulsen, T.; Brünner, N.; Kristiansen, K.; Madsen, L.; et al. Tissue Inhibitor Of Matrix Metalloproteinase-1 Is Required for High-Fat Diet-Induced Glucose Intolerance and Hepatic Steatosis in Mice. PLoS ONE 2015, 10, e0132910. [Google Scholar] [CrossRef]
- Gerin, I.; Louis, G.W.; Zhang, X.; Prestwich, T.C.; Kumar, T.R.; Myers, M.G.; Macdougald, O.A.; Nothnick, W.B. Hyperphagia and Obesity in Female Mice Lacking Tissue Inhibitor of Metalloproteinase-1. Endocrinology 2009, 150, 1697–1704. [Google Scholar] [CrossRef]
- Björnholm, M.; Münzberg, H.; Leshan, R.L.; Villanueva, E.C.; Bates, S.H.; Louis, G.W.; Jones, J.C.; Ishida-Takahashi, R.; Bjørbaek, C.; Myers, M.G. Mice Lacking Inhibitory Leptin Receptor Signals Are Lean with Normal Endocrine Function. J. Clin. Investig. 2007, 117, 1354–1360. [Google Scholar] [CrossRef]
- Stricker-Krongrad, A.; Richy, S.; Beck, B. Orexins/Hypocretins in the Ob/Ob Mouse: Hypothalamic Gene Expression, Peptide Content and Metabolic Effects. Regul. Pept. 2002, 104, 11–20. [Google Scholar] [CrossRef] [PubMed]
- Cai, X.J.; Lister, C.A.; Buckingham, R.E.; Pickavance, L.; Wilding, J.; Arch, J.R.; Wilson, S.; Williams, G. Down-Regulation of Orexin Gene Expression by Severe Obesity in the Rats: Studies in Zucker Fatty and Zucker Diabetic Fatty Rats and Effects of Rosiglitazone. Mol. Brain Res. 2000, 77, 131–137. [Google Scholar] [CrossRef]
- Beck, B.; Richy, S.; Dimitrov, T.; Stricker-Krongrad, A. Opposite Regulation of Hypothalamic Orexin and Neuropeptide Y Receptors and Peptide Expressions in Obese Zucker Rats. Biochem. Biophys. Res. Commun. 2001, 286, 518–523. [Google Scholar] [CrossRef] [PubMed]
- Pinto, S.; Roseberry, A.G.; Liu, H.; Diano, S.; Shanabrough, M.; Cai, X.; Friedman, J.M.; Horvath, T.L. Rapid Rewiring of Arcuate Nucleus Feeding Circuits by Leptin. Science 2004, 304, 110–115. [Google Scholar] [CrossRef] [PubMed]
- Chaillan, F.A.; Rivera, S.; Marchetti, E.; Jourquin, J.; Werb, Z.; Soloway, P.D.; Khrestchatisky, M.; Roman, F.S. Involvement of Tissue Inhibition of Metalloproteinases-1 in Learning and Memory in Mice. Behav. Brain Res. 2006, 173, 191–198. [Google Scholar] [CrossRef] [Green Version]
- Jourquin, J.; Tremblay, E.; Bernard, A.; Charton, G.; Chaillan, F.A.; Marchetti, E.; Roman, F.S.; Soloway, P.D.; Dive, V.; Yiotakis, A.; et al. Tissue Inhibitor of Metalloproteinases-1 (TIMP-1) Modulates Neuronal Death, Axonal Plasticity, and Learning and Memory. Eur. J. Neurosci. 2005, 22, 2569–2578. [Google Scholar] [CrossRef]
- Jaworski, D.M.; Soloway, P.; Caterina, J.; Falls, W.A. Tissue Inhibitor of Metalloproteinase-2(TIMP-2)-Deficient Mice Display Motor Deficits. J. Neurobiol. 2006, 66, 82–94. [Google Scholar] [CrossRef]
- Lluri, G.; Langlois, G.D.; McClellan, B.; Soloway, P.D.; Jaworski, D.M. Tissue Inhibitor of Metalloproteinase-2 (TIMP-2) Regulates Neuromuscular Junction Development via a β1 Integrin-Mediated Mechanism. J. Neurobiol. 2006, 66, 1365–1377. [Google Scholar] [CrossRef] [Green Version]
- Lluri, G.; Langlois, G.D.; Soloway, P.D.; Jaworski, D.M. Tissue Inhibitor of Metalloproteinase-2 (TIMP-2) Regulates Myogenesis and β1 Integrin Expression in Vitro. Exp. Cell Res. 2008, 314, 11–24. [Google Scholar] [CrossRef] [Green Version]
- Jaworski, D.M.; Sideleva, O.; Stradecki, H.M.; Langlois, G.D.; Habibovic, A.; Satish, B.; Tharp, W.G.; Lausier, J.; LaRock, K.; Jetton, T.L.; et al. Sexually Dimorphic Diet-Induced Insulin Resistance in Obese Tissue Inhibitor of Metalloproteinase-2 (TIMP-2)-Deficient Mice. Endocrinology 2011, 152, 1300–1313. [Google Scholar] [CrossRef] [Green Version]
- Stradecki, H.M.; Jaworski, D.M. Hyperphagia and Leptin Resistance in Tissue Inhibitor of Metalloproteinase-2 Deficient Mice. J. Neuroendocr. 2011, 23, 269–281. [Google Scholar] [CrossRef] [PubMed] [Green Version]
- Dube, M.G.; Kalra, S.P.; Kalra, P.S. Low Abundance of NPY in the Hypothalamus Can Produce Hyperphagia and Obesity. Peptides 2007, 28, 475–479. [Google Scholar] [CrossRef] [Green Version]
- Gallou-Kabani, C.; Junien, C. Nutritional Epigenomics of Metabolic Syndrome: New Perspective against the Epidemic. Diabetes 2005, 54, 1899–1906. [Google Scholar] [CrossRef] [Green Version]
- Federici, M.; Hribal, M.L.; Menghini, R.; Kanno, H.; Marchetti, V.; Porzio, O.; Sunnarborg, S.W.; Rizza, S.; Serino, M.; Cunsolo, V.; et al. Timp3 Deficiency in Insulin Receptor-Haploinsufficient Mice Promotes Diabetes and Vascular Inflammation via Increased TNF-α. J. Clin. Investig. 2005, 115, 3494–3505. [Google Scholar] [CrossRef] [Green Version]
- Menghini, R.; Menini, S.; Amoruso, R.; Fiorentino, L.; Casagrande, V.; Marzano, V.; Tornei, F.; Bertucci, P.; Iacobini, C.; Serino, M.; et al. Tissue Inhibitor of Metalloproteinase 3 Deficiency Causes Hepatic Steatosis and Adipose Tissue Inflammation in Mice. Gastroenterology 2009, 136, 663–672.e4. [Google Scholar] [CrossRef] [PubMed]
- Menghini, R.; Casagrande, V.; Menini, S.; Marino, A.; Marzano, V.; Hribal, M.L.; Gentileschi, P.; Lauro, D.; Schillaci, O.; Pugliese, G.; et al. TIMP3 Overexpression in Macrophages Protects from Insulin Resistance, Adipose Inflammation, and Nonalcoholic Fatty Liver Disease in Mice. Diabetes 2012, 61, 454–462. [Google Scholar] [CrossRef] [Green Version]
- Casagrande, V.; Menghini, R.; Menini, S.; Marino, A.; Marchetti, V.; Cavalera, M.; Fabrizi, M.; Hribal, M.L.; Pugliese, G.; Gentileschi, P.; et al. Overexpression of Tissue Inhibitor of Metalloproteinase 3 in Macrophages Reduces Atherosclerosis in Low-Density Lipoprotein Receptor Knockout Mice. Arter. Thromb. Vasc. Biol. 2012, 32, 74–81. [Google Scholar] [CrossRef] [PubMed] [Green Version]
- Mejia-Cristobal, L.M.; Reus, E.; Lizarraga, F.; Espinosa, M.; Ceballos-Cancino, G.; López, T.V.; Garay, S.; Maldonado, V.; Melendez-Zajgla, J. Tissue Inhibitor of Metalloproteases-4 (TIMP-4) Modulates Adipocyte Differentiation in Vitro. Exp. Cell Res. 2015, 335, 207–215. [Google Scholar] [CrossRef]
- Chae, G.-N.; Kwak, S.-J. NF-κB Is Involved in the TNF-α Induced Inhibition of the Differentiation of 3T3-L1 Cells by Reducing PPARgamma Expression. Exp. Mol. Med. 2003, 35, 431–437. [Google Scholar] [CrossRef] [Green Version]
- Strissel, K.J.; Stancheva, Z.; Miyoshi, H.; Perfield, J.W.; DeFuria, J.; Jick, Z.; Greenberg, A.S.; Obin, M.S. Adipocyte Death, Adipose Tissue Remodeling, and Obesity Complications. Diabetes 2007, 56, 2910–2918. [Google Scholar] [CrossRef] [Green Version]
- Wang, Q.A.; Tao, C.; Gupta, R.K.; Scherer, P.E. Tracking Adipogenesis during White Adipose Tissue Development, Expansion and Regeneration. Nat. Med. 2013, 19, 1338–1344. [Google Scholar] [CrossRef] [PubMed]
- Lemonnier, D. Effect of Age, Sex, and Site on the Cellularity of the Adipose Tissue in Mice and Rats Rendered Obese by a High-Fat Diet. J. Clin. Investig. 1972, 51, 2907–2915. [Google Scholar] [CrossRef] [Green Version]
- Faust, I.M.; Johnson, P.R.; Stern, J.S.; Hirsch, J. Diet-Induced Adipocyte Number Increase in Adult Rats: A New Model of Obesity. Am. J. Physiol. Endocrinol. Metab. 1978, 235, E279. [Google Scholar] [CrossRef] [PubMed] [Green Version]
- Sakamuri, S.S.V.P.; Watts, R.; Takawale, A.; Wang, X.; Hernandez-Anzaldo, S.; Bahitham, W.; Fernandez-Patron, C.; Lehner, R.; Kassiri, Z. Absence of Tissue Inhibitor of Metalloproteinase-4 (TIMP4) Ameliorates High Fat Diet-Induced Obesity in Mice Due to Defective Lipid Absorption. Sci. Rep. 2017, 7, 6210. [Google Scholar] [CrossRef]
- Pendergast, D.R.; Leddy, J.J.; Venkatraman, J.T. A Perspective on Fat Intake in Athletes. J. Am. Coll. Nutr. 2000, 19, 345–350. [Google Scholar] [CrossRef] [PubMed]
- Mendham, A.E.; Micklesfield, L.K.; Karpe, F.; Kengne, A.P.; Chikowore, T.; Kufe, C.N.; Masemola, M.; Crowther, N.J.; Norris, S.A.; Olsson, T.; et al. Targeted Proteomics Identifies Potential Biomarkers of Dysglycaemia, Beta Cell Function and Insulin Sensitivity in Black African Men and Women. Diabetologia 2023, 66, 174–189. [Google Scholar] [CrossRef] [PubMed]
- Garofolo, M.; Gualdani, E.; Giannarelli, R.; Aragona, M.; Campi, F.; Lucchesi, D.; Daniele, G.; Miccoli, R.; Francesconi, P.; Del Prato, S.; et al. Microvascular Complications Burden (Nephropathy, Retinopathy and Peripheral Polyneuropathy) Affects Risk of Major Vascular Events and All-Cause Mortality in Type 1 Diabetes: A 10-Year Follow-up Study. Cardiovasc. Diabetol. 2019, 18, 159. [Google Scholar] [CrossRef] [PubMed] [Green Version]
- Brownrigg, J.R.W.; Hughes, C.O.; Burleigh, D.; Karthikesalingam, A.; Patterson, B.O.; Holt, P.J.; Thompson, M.M.; de Lusignan, S.; Ray, K.K.; Hinchliffe, R.J. Microvascular Disease and Risk of Cardiovascular Events among Individuals with Type 2 Diabetes: A Population-Level Cohort Study. Lancet Diabetes Endocrinol. 2016, 4, 588–597. [Google Scholar] [CrossRef]
- Rask-Madsen, C.; King, G.L. Vascular Complications of Diabetes: Mechanisms of Injury and Protective Factors. Cell Metab. 2013, 17, 20–33. [Google Scholar] [CrossRef] [Green Version]
- Laxton, R.C.; Hu, Y.; Duchene, J.; Zhang, F.; Zhang, Z.; Leung, K.-Y.; Xiao, Q.; Scotland, R.S.; Hodgkinson, C.P.; Smith, K.; et al. A Role of Matrix Metalloproteinase-8 in Atherosclerosis. Circ. Res. 2009, 105, 921–929. [Google Scholar] [CrossRef]
- Herman, M.P.; Sukhova, G.K.; Libby, P.; Gerdes, N.; Tang, N.; Horton, D.B.; Kilbride, M.; Breitbart, R.E.; Chun, M.; Schönbeck, U. Expression of Neutrophil Collagenase (Matrix Metalloproteinase-8) in Human Atheroma: A Novel Collagenolytic Pathway Suggested by Transcriptional Profiling. Circulation 2001, 104, 1899–1904. [Google Scholar] [CrossRef] [PubMed] [Green Version]
- Turu, M.M.; Krupinski, J.; Catena, E.; Rosell, A.; Montaner, J.; Rubio, F.; Alvarez-Sabin, J.; Cairols, M.; Badimon, L. Intraplaque MMP-8 Levels Are Increased in Asymptomatic Patients with Carotid Plaque Progression on Ultrasound. Atherosclerosis 2006, 187, 161–169. [Google Scholar] [CrossRef] [PubMed]
- Kato, R.; Momiyama, Y.; Ohmori, R.; Taniguchi, H.; Nakamura, H.; Ohsuzu, F. Plasma Matrix Metalloproteinase-8 Concentrations Are Associated with the Presence and Severity of Coronary Artery Disease. Circ. J. 2005, 69, 1035–1040. [Google Scholar] [CrossRef] [PubMed] [Green Version]
- Tuomainen, A.M.; Nyyssönen, K.; Laukkanen, J.A.; Tervahartiala, T.; Tuomainen, T.-P.; Salonen, J.T.; Sorsa, T.; Pussinen, P.J. Serum Matrix Metalloproteinase-8 Concentrations Are Associated With Cardiovascular Outcome in Men. Arter. Thromb. Vasc. Biol. 2007, 27, 2722–2728. [Google Scholar] [CrossRef] [PubMed]
- Morla, S.; Desai, U.R. Discovery of Sulfated Small Molecule Inhibitors of Matrix Metalloproteinase-8. Biomolecules 2020, 10, E1166. [Google Scholar] [CrossRef]
- Salminen, A.; Åström, P.; Metso, J.; Soliymani, R.; Salo, T.; Jauhiainen, M.; Pussinen, P.J.; Sorsa, T. Matrix Metalloproteinase 8 Degrades Apolipoprotein A-I and Reduces Its Cholesterol Efflux Capacity. FASEB J. 2015, 29, 1435–1445. [Google Scholar] [CrossRef] [Green Version]
- Golub, L.M.; Lee, H.M.; Ryan, M.E.; Giannobile, W.V.; Payne, J.; Sorsa, T. Tetracyclines Inhibit Connective Tissue Breakdown by Multiple Non-Antimicrobial Mechanisms. Adv. Dent. Res. 1998, 12, 12–26. [Google Scholar] [CrossRef]
- Signorelli, S.S.; Malaponte, G.; Libra, M.; Di Pino, L.; Celotta, G.; Bevelacqua, V.; Petrina, M.; Nicotra, G.S.; Indelicato, M.; Navolanic, P.M.; et al. Plasma Levels and Zymographic Activities of Matrix Metalloproteinases 2 and 9 in Type II Diabetics with Peripheral Arterial Disease. Vasc. Med. 2005, 10, 1–6. [Google Scholar] [CrossRef] [Green Version]
- Stettler, C.; Allemann, S.; Jüni, P.; Cull, C.A.; Holman, R.R.; Egger, M.; Krähenbühl, S.; Diem, P. Glycemic Control and Macrovascular Disease in Types 1 and 2 Diabetes Mellitus: Meta-Analysis of Randomized Trials. Am. Heart J. 2006, 152, 27–38. [Google Scholar] [CrossRef]
- Kadoglou, N.P.; Daskalopoulou, S.S.; Perrea, D.; Liapis, C.D. Matrix Metalloproteinases and Diabetic Vascular Complications. Angiology 2005, 56, 173–189. [Google Scholar] [CrossRef]
- Giagtzidis, I.; Karkos, C.; Pitoulias, G.; Papazoglou, K. Matrix Metalloproteinases and Peripheral Arterial Disease. Int. Angiol. 2015, 34, 195–201. [Google Scholar]
- Ferroni, P.; Basili, S.; Martini, F.; Cardarello, C.M.; Ceci, F.; Di Franco, M.; Bertazzoni, G.; Gazzaniga, P.P.; Alessandri, C. Serum Metalloproteinase 9 Levels in Patients with Coronary Artery Disease: A Novel Marker of Inflammation. J. Investig. Med. 2003, 51, 295–300. [Google Scholar] [CrossRef]
- Rouis, M.; Adamy, C.; Duverger, N.; Lesnik, P.; Horellou, P.; Moreau, M.; Emmanuel, F.; Caillaud, J.M.; Laplaud, P.M.; Dachet, C.; et al. Adenovirus-Mediated Overexpression of Tissue Inhibitor of Metalloproteinase-1 Reduces Atherosclerotic Lesions in Apolipoprotein E–Deficient Mice. Circulation 1999, 100, 533–540. [Google Scholar] [CrossRef] [PubMed]
- Johnson, J.L.; Baker, A.H.; Oka, K.; Chan, L.; Newby, A.C.; Jackson, C.L.; George, S.J. Suppression of Atherosclerotic Plaque Progression and Instability by Tissue Inhibitor of Metalloproteinase-2. Circulation 2006, 113, 2435–2444. [Google Scholar] [CrossRef] [PubMed] [Green Version]
- Newby, A.C. Dual Role of Matrix Metalloproteinases (Matrixins) in Intimal Thickening and Atherosclerotic Plaque Rupture. Physiol. Rev. 2005, 85, 1–31. [Google Scholar] [CrossRef] [PubMed] [Green Version]
- Xu, X.; Xiao, L.; Xiao, P.; Yang, S.; Chen, G.; Liu, F.; Kanwar, Y.S.; Sun, L. A Glimpse of Matrix Metalloproteinases in Diabetic Nephropathy. Curr. Med. Chem. 2014, 21, 3244–3260. [Google Scholar] [CrossRef] [PubMed] [Green Version]
- Rysz, J.; Banach, M.; Stolarek, R.A.; Pasnik, J.; Cialkowska-Rysz, A.; Koktysz, R.; Piechota, M.; Baj, Z. Serum Matrix Metalloproteinases MMP-2 and MMP-9 and Metalloproteinase Tissue Inhibitors TIMP-1 and TIMP-2 in Diabetic Nephropathy. J. Nephrol. 2007, 20, 444–452. [Google Scholar] [PubMed]
- Yang, H.; Chen, H.; Liu, F.; Ma, Q. Up-Regulation of Matrix Metalloproteinases-9 in the Kidneys of Diabetic Rats and the Association with Neutrophil Gelatinase-Associated Lipocalin. BMC Nephrol. 2021, 22, 211. [Google Scholar] [CrossRef]
- Jeong, S.-R.; Park, H.-Y.; Kim, Y.; Lee, K.-W. Methylglyoxal-Derived Advanced Glycation End Products Induce Matrix Metalloproteinases through Activation of ERK/JNK/NF-ΚB Pathway in Kidney Proximal Epithelial Cells. Food Sci. Biotechnol. 2020, 29, 675–682. [Google Scholar] [CrossRef]
- Singh, R.M.; Howarth, F.C.; Adeghate, E.; Bidasee, K.; Singh, J.; Waqar, T. Type 1 Diabetes Mellitus Induces Structural Changes and Molecular Remodelling in the Rat Kidney. Mol. Cell. Biochem. 2018, 449, 9–25. [Google Scholar] [CrossRef]
- Sapienza, C.; Lee, J.; Powell, J.; Erinle, O.; Yafai, F.; Reichert, J.; Siraj, E.S.; Madaio, M. DNA Methylation Profiling Identifies Epigenetic Differences between Diabetes Patients with ESRD and Diabetes Patients without Nephropathy. Epigenetics 2011, 6, 20–28. [Google Scholar] [CrossRef] [Green Version]
- Aldemir, O.; Turgut, F.; Gokce, C. The Association between Methylation Levels of Targeted Genes and Albuminuria in Patients with Early Diabetic Kidney Disease. Ren. Fail. 2017, 39, 597–601. [Google Scholar] [CrossRef] [Green Version]
- McKittrick, I.B.; Bogaert, Y.; Nadeau, K.; Snell-Bergeon, J.; Hull, A.; Jiang, T.; Wang, X.; Levi, M.; Moulton, K.S. Urinary Matrix Metalloproteinase Activities: Biomarkers for Plaque Angiogenesis and Nephropathy in Diabetes. Am. J. Physiol. Ren. Physiol. 2011, 301, F1326–F1333. [Google Scholar] [CrossRef] [PubMed] [Green Version]
- Albert, C.; Kube, J.; Albert, A.; Schanze, D.; Zenker, M.; Mertens, P.R. Cubilin Single Nucleotide Polymorphism Variants Are Associated with Macroangiopathy While a Matrix Metalloproteinase-9 Single Nucleotide Polymorphism Flip-Flop May Indicate Susceptibility of Diabetic Nephropathy in Type-2 Diabetic Patients. Nephron 2019, 141, 156–165. [Google Scholar] [CrossRef]
- Gantala, S.R.; Kondapalli, M.S.; Kummari, R.; Padala, C.; Tupurani, M.A.; Kupsal, K.; Galimudi, R.K.; Gundapaneni, K.K.; Puranam, K.; Shyamala, N.; et al. Collagenase-1 (-1607 1G/2G), Gelatinase-A (-1306 C/T), Stromelysin-1 (-1171 5A/6A) Functional Promoter Polymorphisms in Risk Prediction of Type 2 Diabetic Nephropathy. Gene 2018, 673, 22–31. [Google Scholar] [CrossRef] [PubMed]
- Llano, E.; Pendás, A.M.; Freije, J.P.; Nakano, A.; Knäuper, V.; Murphy, G.; López-Otin, C. Identification and Characterization of Human MT5-MMP, a New Membrane-Bound Activator of Progelatinase a Overexpressed in Brain Tumors. Cancer Res. 1999, 59, 2570–2576. [Google Scholar] [PubMed]
- Pei, D. Identification and Characterization of the Fifth Membrane-Type Matrix Metalloproteinase MT5-MMP. J. Biol. Chem. 1999, 274, 8925–8932. [Google Scholar] [CrossRef] [PubMed] [Green Version]
- Romanic, A.M.; Burns-Kurtis, C.L.; Ao, Z.; Arleth, A.J.; Ohlstein, E.H. Upregulated Expression of Human Membrane Type-5 Matrix Metalloproteinase in Kidneys from Diabetic Patients. Am. J. Physiol. Ren. Physiol. 2001, 281, F309–F317. [Google Scholar] [CrossRef] [Green Version]
- Omran, O.M. Effects of Thymoquinone on STZ-Induced Diabetic Nephropathy: An Immunohistochemical Study. Ultrastruct. Pathol. 2014, 38, 26–33. [Google Scholar] [CrossRef]
- Abu El-Asrar, A.M.; Alam, K.; Nawaz, M.I.; Mohammad, G.; Van den Eynde, K.; Siddiquei, M.M.; Mousa, A.; De Hertogh, G.; Opdenakker, G. Upregulation of Thrombin/Matrix Metalloproteinase-1/Protease-Activated Receptor-1 Chain in Proliferative Diabetic Retinopathy. Curr. Eye Res. 2016, 41, 1590–1600. [Google Scholar] [CrossRef] [Green Version]
- Mohammad, G.; Kowluru, R.A. Novel Role of Mitochondrial Matrix Metalloproteinase-2 in the Development of Diabetic Retinopathy. Investig. Ophthalmol. Vis. Sci. 2011, 52, 3832–3841. [Google Scholar] [CrossRef] [PubMed] [Green Version]
- Kowluru, R.A.; Mishra, M. Regulation of Matrix Metalloproteinase in the Pathogenesis of Diabetic Retinopathy. Prog. Mol. Biol. Transl. Sci. 2017, 148, 67–85. [Google Scholar] [CrossRef] [PubMed]
- Jobin, P.G.; Butler, G.S.; Overall, C.M. New Intracellular Activities of Matrix Metalloproteinases Shine in the Moonlight. Biochim. Biophys. Acta BBA-Mol. Cell Res. 2017, 1864, 2043–2055. [Google Scholar] [CrossRef]
- Van Linthout, S.; Seeland, U.; Riad, A.; Eckhardt, O.; Hohl, M.; Dhayat, N.; Richter, U.; Fischer, J.W.; Böhm, M.; Pauschinger, M.; et al. Reduced MMP-2 Activity Contributes to Cardiac Fibrosis in Experimental Diabetic Cardiomyopathy. Basic Res. Cardiol. 2008, 103, 319–327. [Google Scholar] [CrossRef] [PubMed]
- Illman, S.A.; Lohi, J.; Keski-Oja, J. Epilysin (MMP-28)—Structure, Expression and Potential Functions. Exp. Dermatol. 2008, 17, 897–907. [Google Scholar] [CrossRef] [PubMed]
- Boťanská, B.; Barteková, M.; Ferenczyová, K.; Fogarassyová, M.; Kindernay, L.; Barančík, M. Matrix Metalloproteinases and Their Role in Mechanisms Underlying Effects of Quercetin on Heart Function in Aged Zucker Diabetic Fatty Rats. Int. J. Mol. Sci. 2021, 22, 4457. [Google Scholar] [CrossRef]
- Michelin, A.C.; Justulin, L.A., Jr.; Delella, F.K.; Padovani, C.R.; Felisbino, S.L.; Dal-Pai-Silva, M. Differential MMP-2 and MMP-9 Activity and Collagen Distribution in Skeletal Muscle from Pacu (Piaractus mesopotamicus) During Juvenile and Adult Growth Phases. Anat. Rec. 2009, 292, 387–395. [Google Scholar] [CrossRef]
- Lei, H.; Leong, D.; Smith, L.R.; Barton, E.R. Matrix Metalloproteinase 13 Is a New Contributor to Skeletal Muscle Regeneration and Critical for Myoblast Migration. Am. J. Physiol. Cell Physiol. 2013, 305, C529–C538. [Google Scholar] [CrossRef] [Green Version]
- Snyman, C.; Niesler, C.U. MMP-14 in Skeletal Muscle Repair. J. Muscle Res. Cell Motil. 2015, 36, 215–225. [Google Scholar] [CrossRef]
- Kherif, S.; Lafuma, C.; Dehaupas, M.; Lachkar, S.; Fournier, J.G.; Verdière-Sahuqué, M.; Fardeau, M.; Alameddine, H.S. Expression of Matrix Metalloproteinases 2 and 9 in Regenerating Skeletal Muscle: A Study in Experimentally Injured and Mdx Muscles. Dev. Biol. 1999, 205, 158–170. [Google Scholar] [CrossRef] [Green Version]
- Bobadilla, M.; Sáinz, N.; Rodriguez, J.A.; Abizanda, G.; Orbe, J.; de Martino, A.; García Verdugo, J.M.; Páramo, J.A.; Prósper, F.; Pérez-Ruiz, A. MMP-10 Is Required for Efficient Muscle Regeneration in Mouse Models of Injury and Muscular Dystrophy. Stem Cells 2014, 32, 447–461. [Google Scholar] [CrossRef]
- Stickens, D.; Behonick, D.J.; Ortega, N.; Heyer, B.; Hartenstein, B.; Yu, Y.; Fosang, A.J.; Schorpp-Kistner, M.; Angel, P.; Werb, Z. Altered Endochondral Bone Development in Matrix Metalloproteinase 13-Deficient Mice. Development 2004, 131, 5883–5895. [Google Scholar] [CrossRef] [PubMed] [Green Version]
- Smith, L.R.; Kok, H.J.; Zhang, B.; Chung, D.; Spradlin, R.A.; Rakoczy, K.D.; Lei, H.; Boesze-Battaglia, K.; Barton, E.R. Matrix Metalloproteinase 13 from Satellite Cells Is Required for Efficient Muscle Growth and Regeneration. Cell. Physiol. Biochem. 2020, 54, 333–353. [Google Scholar] [CrossRef] [Green Version]
- Ohtake, Y.; Tojo, H.; Seiki, M. Multifunctional Roles of MT1-MMP in Myofiber Formation and Morphostatic Maintenance of Skeletal Muscle. J. Cell Sci. 2006, 119, 3822–3832. [Google Scholar] [CrossRef] [Green Version]
- Cohen, J.C.; Horton, J.D.; Hobbs, H.H. Human Fatty Liver Disease: Old Questions and New Insights. Science 2011, 332, 1519–1523. [Google Scholar] [CrossRef] [PubMed] [Green Version]
- Jonas, W.; Schürmann, A. Genetic and Epigenetic Factors Determining NAFLD Risk. Mol. Metab. 2021, 50, 101111. [Google Scholar] [CrossRef]
- Parlati, L.; Régnier, M.; Guillou, H.; Postic, C. New Targets for NAFLD. JHEP Rep. Innov. Hepatol. 2021, 3, 100346. [Google Scholar] [CrossRef] [PubMed]
- Dali-Youcef, N.; Vix, M.; Costantino, F.; El-Saghire, H.; Lhermitte, B.; Callari, C.; D’Agostino, J.; Perretta, S.; Paveliu, S.; Gualtierotti, M.; et al. Interleukin-32 Contributes to Human Nonalcoholic Fatty Liver Disease and Insulin Resistance. Hepatol. Commun. 2019, 3, 1205–1220. [Google Scholar] [CrossRef] [PubMed] [Green Version]
- Bianco, C.; Casirati, E.; Malvestiti, F.; Valenti, L. Genetic Predisposition Similarities between NASH and ASH: Identification of New Therapeutic Targets. JHEP Rep. 2021, 3, 100284. [Google Scholar] [CrossRef]
- Yilmaz, Y.; Eren, F. Serum Biomarkers of Fibrosis and Extracellular Matrix Remodeling in Patients with Nonalcoholic Fatty Liver Disease: Association with Liver Histology. Eur. J. Gastroenterol. Hepatol. 2019, 31, 43–46. [Google Scholar] [CrossRef]
- Benegiamo, G.; von Alvensleben, G.V.G.; Rodríguez-López, S.; Goeminne, L.J.E.; Bachmann, A.M.; Morel, J.-D.; Broeckx, E.; Ma, J.Y.; Carreira, V.; Youssef, S.A.; et al. The Genetic Background Shapes the Susceptibility to Mitochondrial Dysfunction and NASH Progression. J. Exp. Med. 2023, 220, e20221738. [Google Scholar] [CrossRef] [PubMed]
- Anstee, Q.M.; Lawitz, E.J.; Alkhouri, N.; Wong, V.W.-S.; Romero-Gomez, M.; Okanoue, T.; Trauner, M.; Kersey, K.; Li, G.; Han, L.; et al. Noninvasive Tests Accurately Identify Advanced Fibrosis Due to NASH: Baseline Data From the STELLAR Trials. Hepatology 2019, 70, 1521–1530. [Google Scholar] [CrossRef] [PubMed]
- Bril, F.; McPhaul, M.J.; Caulfield, M.P.; Castille, J.-M.; Poynard, T.; Soldevila-Pico, C.; Clark, V.C.; Firpi-Morell, R.J.; Lai, J.; Cusi, K. Performance of the SteatoTest, ActiTest, NashTest and FibroTest in a Multiethnic Cohort of Patients with Type 2 Diabetes Mellitus. J. Investig. Med. 2019, 67, 303–311. [Google Scholar] [CrossRef] [PubMed] [Green Version]
- Powell, E.E.; Wong, V.W.-S.; Rinella, M. Non-Alcoholic Fatty Liver Disease. Lancet 2021, 397, 2212–2224. [Google Scholar] [CrossRef]
- Munsterman, I.D.; Kendall, T.J.; Khelil, N.; Popa, M.; Lomme, R.; Drenth, J.P.H.; Tjwa, E.T.T.L. Extracellular Matrix Components Indicate Remodelling Activity in Different Fibrosis Stages of Human Non-Alcoholic Fatty Liver Disease. Histopathology 2018, 73, 612–621. [Google Scholar] [CrossRef] [Green Version]
- Ljumovic, D.; Diamantis, I.; Alegakis, A.K.; Kouroumalis, E.A. Differential Expression of Matrix Metalloproteinases in Viral and Non-Viral Chronic Liver Diseases. Clin. Chim. Acta 2004, 349, 203–211. [Google Scholar] [CrossRef]
- Toyoda, H.; Kumada, T.; Kiriyama, S.; Tanikawa, M.; Hisanaga, Y.; Kanamori, A.; Tada, T.; Murakami, Y. Higher Hepatic Gene Expression and Serum Levels of Matrix Metalloproteinase-2 Are Associated with Steatohepatitis in Non-Alcoholic Fatty Liver Diseases. Biomarkers 2013, 18, 82–87. [Google Scholar] [CrossRef]
- Ren, J.-J.; Huang, T.-J.; Zhang, Q.-Q.; Zhang, H.-Y.; Guo, X.-H.; Fan, H.-Q.; Li, R.-K.; Liu, L.-X. Insulin-like Growth Factor Binding Protein Related Protein 1 Knockdown Attenuates Hepatic Fibrosis via the Regulation of MMPs/TIMPs in Mice. Hepatobiliary Pancreat. Dis. Int. 2019, 18, 38–47. [Google Scholar] [CrossRef]
- Jiang, J.X.; Chen, X.; Fukada, H.; Serizawa, N.; Devaraj, S.; Török, N.J. Advanced Glycation Endproducts Induce Fibrogenic Activity in Nonalcoholic Steatohepatitis by Modulating TNF-α-Converting Enzyme Activity in Mice. Hepatology 2013, 58, 1339–1348. [Google Scholar] [CrossRef] [PubMed] [Green Version]
- Sampath, H.; Ntambi, J.M. The Role of Stearoyl-CoA Desaturase in Obesity, Insulin Resistance, and Inflammation. Ann. N. Y. Acad. Sci. 2011, 1243, 47–53. [Google Scholar] [CrossRef]
- Gutiérrez-Juárez, R.; Pocai, A.; Mulas, C.; Ono, H.; Bhanot, S.; Monia, B.P.; Rossetti, L. Critical Role of Stearoyl-CoA Desaturase–1 (SCD1) in the Onset of Diet-Induced Hepatic Insulin Resistance. J. Clin. Investig. 2006, 116, 1686–1695. [Google Scholar] [CrossRef] [PubMed]
- Lijnen, H.R. Reproducibility of Studies with Genetically Modified Mice. J. Thromb. Haemost. 2017, 15, 1883–1884. [Google Scholar] [CrossRef] [PubMed] [Green Version]


| Genotype | Phenotype | Ref. |
|---|---|---|
| Gelatinase family | ||
| MMP2−/− |
| [26] |
| MMP9−/− | No difference in body weight or fat tissue composition | [40] |
| Stromelysin family | ||
| MMP3−/− |
| [57] |
| MMP11−/− |
| [74,76] |
| MMP11Tg (overexpression) |
| [76,78] |
| Collagenase family | ||
| MMP8−/− |
| [196] |
| MMP12−/− MMP12 inhibitor |
| [113,116] [117] [117] |
| Others | ||
| MMP19−/− |
| [139] |
| Membrane-type matrix metalloproteinases family | ||
| MMP14−/− |
| [145] |
| MMP14+/− (haploinsufficiency) | Inability to gain weight when subjected to HFD (decrease of Collagen I turnover) | [146] |
| Tissue inhibitors of MMP (TIMPs) | ||
| TIMP1−/− | Tissue-specific antagonist action
| [157,158,159] |
| TIMP1Tg (overexpression) | Increased adipogenesis in post-lactation breast. | [59] |
| TIMP2−/− |
| [170,171] |
| Double heterozygote TIMP3+/−/Insr+/− | Overtly hyperinsulinemic and hyperglycemic, adipose tissue hypertrophy and inflammation, compared to single heterozygote mice. | [175] |
| Macrophage-specific TIMP3 overexpression | Protection from HFD-induced metaflammation, insulin resistance and NASH | [176] |
| TIMP4−/− |
| [184] |
Disclaimer/Publisher’s Note: The statements, opinions and data contained in all publications are solely those of the individual author(s) and contributor(s) and not of MDPI and/or the editor(s). MDPI and/or the editor(s) disclaim responsibility for any injury to people or property resulting from any ideas, methods, instructions or products referred to in the content. |
© 2023 by the authors. Licensee MDPI, Basel, Switzerland. This article is an open access article distributed under the terms and conditions of the Creative Commons Attribution (CC BY) license (https://creativecommons.org/licenses/by/4.0/).
Share and Cite
Molière, S.; Jaulin, A.; Tomasetto, C.-L.; Dali-Youcef, N. Roles of Matrix Metalloproteinases and Their Natural Inhibitors in Metabolism: Insights into Health and Disease. Int. J. Mol. Sci. 2023, 24, 10649. https://doi.org/10.3390/ijms241310649
Molière S, Jaulin A, Tomasetto C-L, Dali-Youcef N. Roles of Matrix Metalloproteinases and Their Natural Inhibitors in Metabolism: Insights into Health and Disease. International Journal of Molecular Sciences. 2023; 24(13):10649. https://doi.org/10.3390/ijms241310649
Chicago/Turabian StyleMolière, Sébastien, Amélie Jaulin, Catherine-Laure Tomasetto, and Nassim Dali-Youcef. 2023. "Roles of Matrix Metalloproteinases and Their Natural Inhibitors in Metabolism: Insights into Health and Disease" International Journal of Molecular Sciences 24, no. 13: 10649. https://doi.org/10.3390/ijms241310649