
Population Structure, Distribution, and Spatial Characteristics of Alsophila spinulosa in Chishui, China


1
Key Laboratory of Plant Resource Conservation and Germplasm Innovation in Mountainous Region (Ministry of Education), College of Life Sciences/Institute of Agro-Bioengineering, Guizhou University, Guiyang 550025, China
2
Research Center for Biodiversiey and Nature Conservation, College of Forestry, Guizhou University, Guiyang 550025, China
3
Guizhou Chishui Alsophila National Nature Reserve Administration Bureau, Chishui 564700, China
*
Author to whom correspondence should be addressed.
Diversity 2023, 15(12), 1200; https://doi.org/10.3390/d15121200
Submission received: 28 September 2023
/
Revised: 2 December 2023
/
Accepted: 4 December 2023
/
Published: 7 December 2023
(This article belongs to the Section Plant Diversity)
Abstract
:Endangered plants are essential components of most forest ecosystems and reflect the ecological integrity of forests. The study of the population structure and spatial pattern of Alsophila spinulosa is of great significance for its conservation. In the subtropical Chishui Tree fern valley in China, we studied the best structure of A. spinulosa to reflect the environmental change, the range of the most intense spatial aggregation change, and the spatial relationship with the community structure, and explored the survival characteristics of A. spinulosa. Our results showed that the variation in tree height structure was the most obvious response to the change in community type. The spatial aggregation degree of A. spinulosa had the most obvious change in the range of 1–5 m. There was an obvious spatial correlation between the dominant plants, the vertical structure of the community, and the distribution of A. spinulosa. These findings provided a reference for exploring the population structure, distribution pattern, and the influence of community types on A. spinulosa populations.
1. Introduction
Population structures and the spatial characteristics of plant populations reflect their growth and distribution across space and time, in addition to the ecological processes influencing forest communities and the coexistence of species within communities and other ecological relationships among populations [1,2]. Patterns of DBH (Diameter at Breast Height) structures, height structures, and canopy structures of plant populations can reflect the long-term competitive ability of populations and predict their future development potential [3]. Spatial distribution patterns and associations, in addition to other spatial characteristics of plant populations, are an important basis for understanding their biological characteristics, development, and co-existence with other species [4]. Specifically, the spatial distributions and relationships of populations are determined by plant biological characteristics, community types, and environmental factors. Thus, spatial characteristics reflect the use of environmental resources, thereby indicating the roles and status of populations within communities, complex relationships between species within communities, and the characteristics of population change and the directions of community development [5,6]. Point pattern analysis can help overcome the shortcomings of traditional spatial pattern analysis and provide more comprehensive spatial information, thereby accurately reflecting the spatial dynamics of populations and their relationships with environments [7].
The study of endangered plants is of great value for biodiversity conservation [8,9]. Alsophila spinulosa is a large tree fern whose population structure can reflect its growth pattern. The spatial distribution and spatial linkage characteristics can reflect the spread range of spores and the characteristics of growth restriction [10]. Therefore, by studying the population structure and spatial characteristics of A. spinulos, the relationship between A. spinulos and the environment can be reflected, which has high practical significance. Habitat destruction, intense anthropogenic disturbance, and the harsh reproductive conditions of A. spinulosa plants have led to dramatic declines in global A. spinulosa populations [11]. Abundant research has consequently been conducted to better protect A. spinulosa populations and save the species from extinction. For example, rapid propagation and breeding techniques for A. spinulosa plants have been explored since the 1990s [12]. Previous studies have shown that the Green Globular Bodies (GGB) pathway of A. spinulosa underpins their fast propagation system, improves propagation rates, and shortens propagation times, subsequently maintaining a factory nursery of A. spinulosa plants [13]. Furthermore, the survival of A. spinulosa plants in the tropical rainforests of the Hangluo Mountains of Hainan Province is affected by environmental conditions; mild disturbance may favor the growth of A. spinulosa [14]. Increasing the number of sapling seedlings is beneficial to the protection of A. spinulosa populations [15]. A previous review of the interspecific relationships of A. spinulosa plants revealed the important influence of biological factors on their growth and development [11]. An investigation of potentially suitable areas for A. spinulosa plant growth at different times also revealed that the geometric center of potentially relevant regions for A. spinulosa growth generally shifted toward the northeast during the last Ice Age through the end of this century, with climatic factors and vegetation types being essential parameters that influence the distribution of potentially suitable growth areas [16]. Studies on A. spinulosa have focused on broad research areas including population and community structure characteristics [17], spatial distributions [18], physiological structures, genetic features [19], pest and disease prevention and control [20], invasiveness [21], and genomic research [22].
In recent years, research on A. spinulosa has been carried out in many fields. However, there is still a relative lack of research on the basic survival characteristics in typical plant communities, the population structure status of A. spinulosa in different plant communities, and the spatial distribution pattern of A. spinulosa plants; the spatial relationships with the community structure are still not clear enough. The present study explored the survival status of A. spinulosa populations in typical plant communities, the range of the most obvious changes in the distribution pattern of the A. spinulosa population, and the spatial relationship between A. spinulosa population and community structure, to elucidate the characteristics of the growth and distribution of A. spinulosa population in typical growing plant communities, and to provide references to solve the problem of the effective management and conservation of A. spinulosa plants.
2. Materials and Methods
2.1. Study Area
The Chishui A. spinulosa National Nature Reserve is located near Jinsha Gou, Huzhi Town, in western Qianbei, Guizhou, China (105°59′54″–106°7′7″ E and 28°20′16″–28°29′44″ N). The reserve was established in 1984 to protect A. spinulosa and its habitat, later becoming a national nature reserve in 1992. In 1993, the reserve was designated as a Chinese Biosphere Reserve, containing a high abundance of A. spinulosa relative to the rest of the world. The area is characterized by high and steep mountains, deep valleys, rivers that are prone to high water during the rainy season, and a high degree of topographic shade. The climate of the area is a typical humid subtropical monsoon climate that is particularly prominent in the valley bottoms at low altitudes, with hydrothermal conditions favorable for A. spinulosa growth. The soils in this reserve are mostly acidic purple soils developed on chalky purple-red sandstones, with deep layers and relatively rich organic matter levels. The vegetation types of the area are diverse and biodiversity is high, with subtropical moist broad-leaved evergreen forests dominating the area, and additional warm coniferous, deciduous broad-leaved, mixed evergreen, deciduous broad-leaved, evergreen broad-leaved, bamboo, and evergreen broad-leaved scrub forests.
2.2. Sample Square Setting and Community Survey
The initial A. spinulosa community survey was conducted from March to June 2021. Based on the survey results, a 1.12 ha (140 m × 80 m) fixed monitoring sample plot was established in July 2021 in a typical A. spinulosa community within the Chishui A. spinulosa National Nature Reserve. Four distinct communities of A. spinulosa grew in the monitoring sample sites, namely, BFB (bamboo forest belt), MF (a mixed forest of bamboo and arbor), ET (ecological transitional zone of community), and EF (evergreen broad-leaved forest) (Table 1). All plant individuals with a DBH > 1 cm in the sample area were marked with projection coordinates using a real-time kinematic (RTK) measurement system (Beidou Haida TS7). Furthermore, the species name, DBH, tree height, height under the branches, and individual characteristics of the crown were recorded for each plant and tagged for long-term analysis.
2.3. Age Class Structure Classification
Populations were classified into eight age classes according to stem height (H), based on a previously described [23] method of classifying the age classes of A. spinulosa and the substantial growth of populations in the monitoring sites. Specifically, classes were established as age class I (0.01 m ≤ H ≤ 0.3 m), age class II (0.03 m ≤ H ≤ 0.6 m), age class III (0.6 m ≤ H ≤ 1.2 m), age class IV (1.2 m ≤ H ≤ 2.1 m), age class V (2.1 m ≤ H ≤ 3.0 m), age class VI (3.0 m ≤ H ≤ 3.9 m), age class VII (3.9 m ≤ H ≤ 4.8 m), and age class VIII (H > 4.8 m). Age classes I and II comprised young individuals; age classes III and IV comprised middle-aged individuals; age classes V, VI, and VII comprised adult individuals; and age class VIII comprised old individuals.
2.4. Point Pattern Analysis
The point pattern analysis method [24,25] is an essential technique for quantifying the spatial distributions of populations. Choosing the correct function and zero models is a critical step for solving problems with this method. The pairwise correlation function g(r), with a scaled non-cumulative effect, represents an improved function of Ripley’s K(r) function with a scaled cumulative impact. The function is more accurate in reflecting the spatial patterns of populations at large scales. In this study, the univariate pair-correlation function, g(r), was used to investigate the spatial distribution of A. spinulosa in Chishui. The Monte-Carlo test method was used to randomly perform 199 simulations to generate 99% confidence intervals to test the significance of deviation from the zero model. The upper envelope represents the upper confidence limit; the lower envelope represents the lower confidence limit. In the graph of the point pattern analysis presented in this paper, the gray area represents the range of confidence intervals, i.e., the area between the upper envelope and the lower envelope. The deviation degree of the actual value in the envelope range (confidence interval) has reliability. If the g(r) values were randomly distributed, they were within the envelope line but significantly deviated from a random distribution; if they were outside the envelope line and clustered above the envelope line, but uniformly distributed, they were below the envelope line. The pair auto-correlation function, g(r), was used to investigate the spatial relationships between intraspecific connections and relevant components of the communities. The community composition includes the dominant plants and the structure of the forest layer. Few older individuals were present in the population, and were thus included in the adult population for intraspecific association analysis. Monte Carlo simulations of the functions were again carried out with 199 loops. The envelope line’s g(r) value was used to indicate the lack of a significant relationship between the two species. If they were above the envelope line, a meaningful positive relationship was inferred between the species, while values below the envelope line reflected important negative relationships.
A complete spatial randomness (CSR) model is essentially a homogeneous Poisson process that does not consider the disturbance of external environmental conditions. Furthermore, a heterogeneous Poisson process (HP) is a null hypothesis model that considers the characteristics of spatial heterogeneity [26]. The two null hypothesis models, CSR and HP, were used here to compare the spatial distributions of populations. The spatial correlations of the populations were investigated using the CSR model; the spatial scale should be half the shortest side length, and thus, at the 0–40 m scale [27]. A model test was also conducted with an actual display effect scale.
2.5. Data Processing and Analysis
The age structure of populations was analyzed using descriptive statistics. Analysis of variance (ANOVA) tests were used to investigate the presence of significant differences in the tree height, DBH, and canopy areas of spinulose plants between various species zones. The spatial distribution of different population age classes and their spatial autocorrelation were analyzed with point pattern analysis. Based on the probability density analysis of all species in the communities, the community canopy was divided into the upper canopy (tree height H > 7.70 m) and the secondary canopy (tree height ≤ 7.70 m) within the monitoring site. Dominant plants in the improved monitoring sample plots were assigned importance values > 1.
The initial collation of data was conducted in Microsoft Excel 2016. Descriptive statistics, one-way ANOVA tests, and Tukey’s HSD analysis were conducted using the SPSS v.25.0 software program. Point pattern analysis and mapping were conducted using the R v.4.1.3 packages “spatstat” and “ggplot2”, in addition to other packages.
3. Results
3.1. Age Structure of A. spinulosa Populations
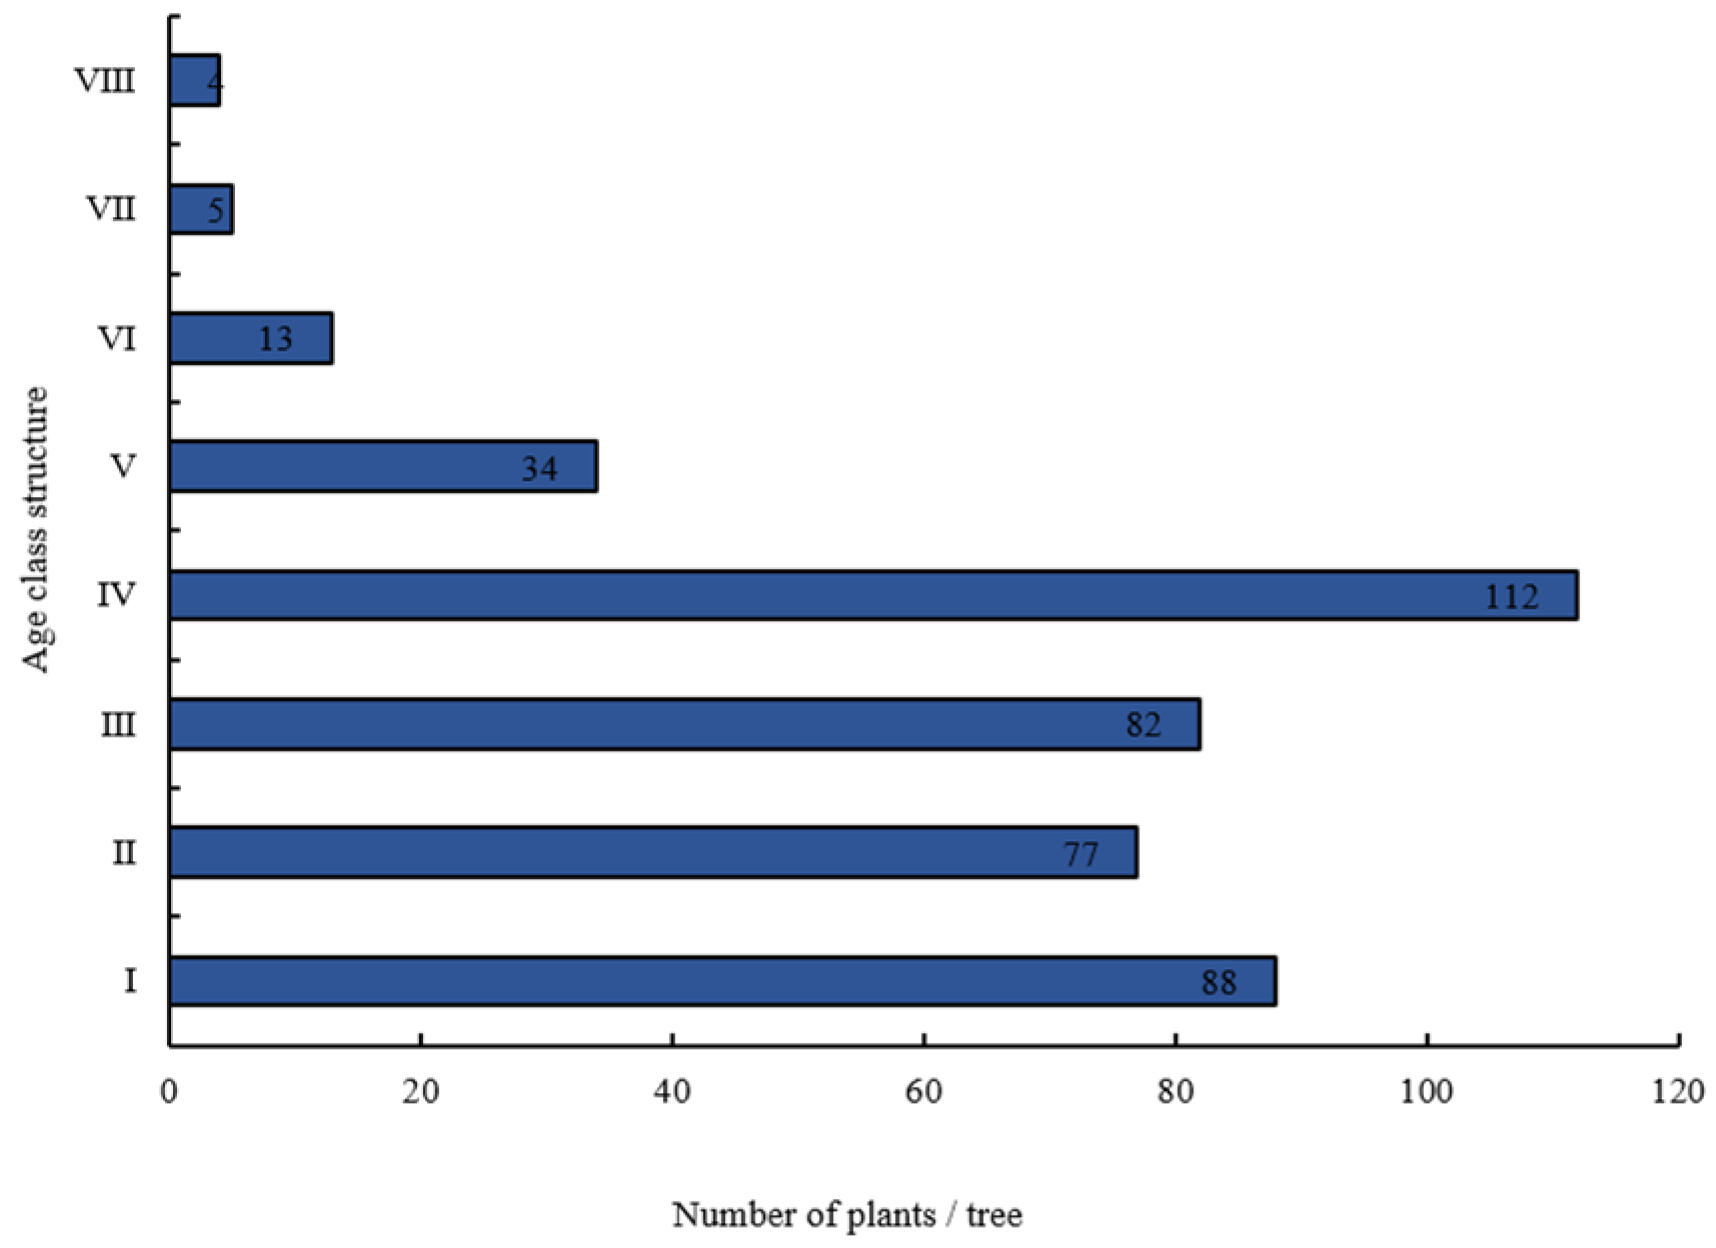
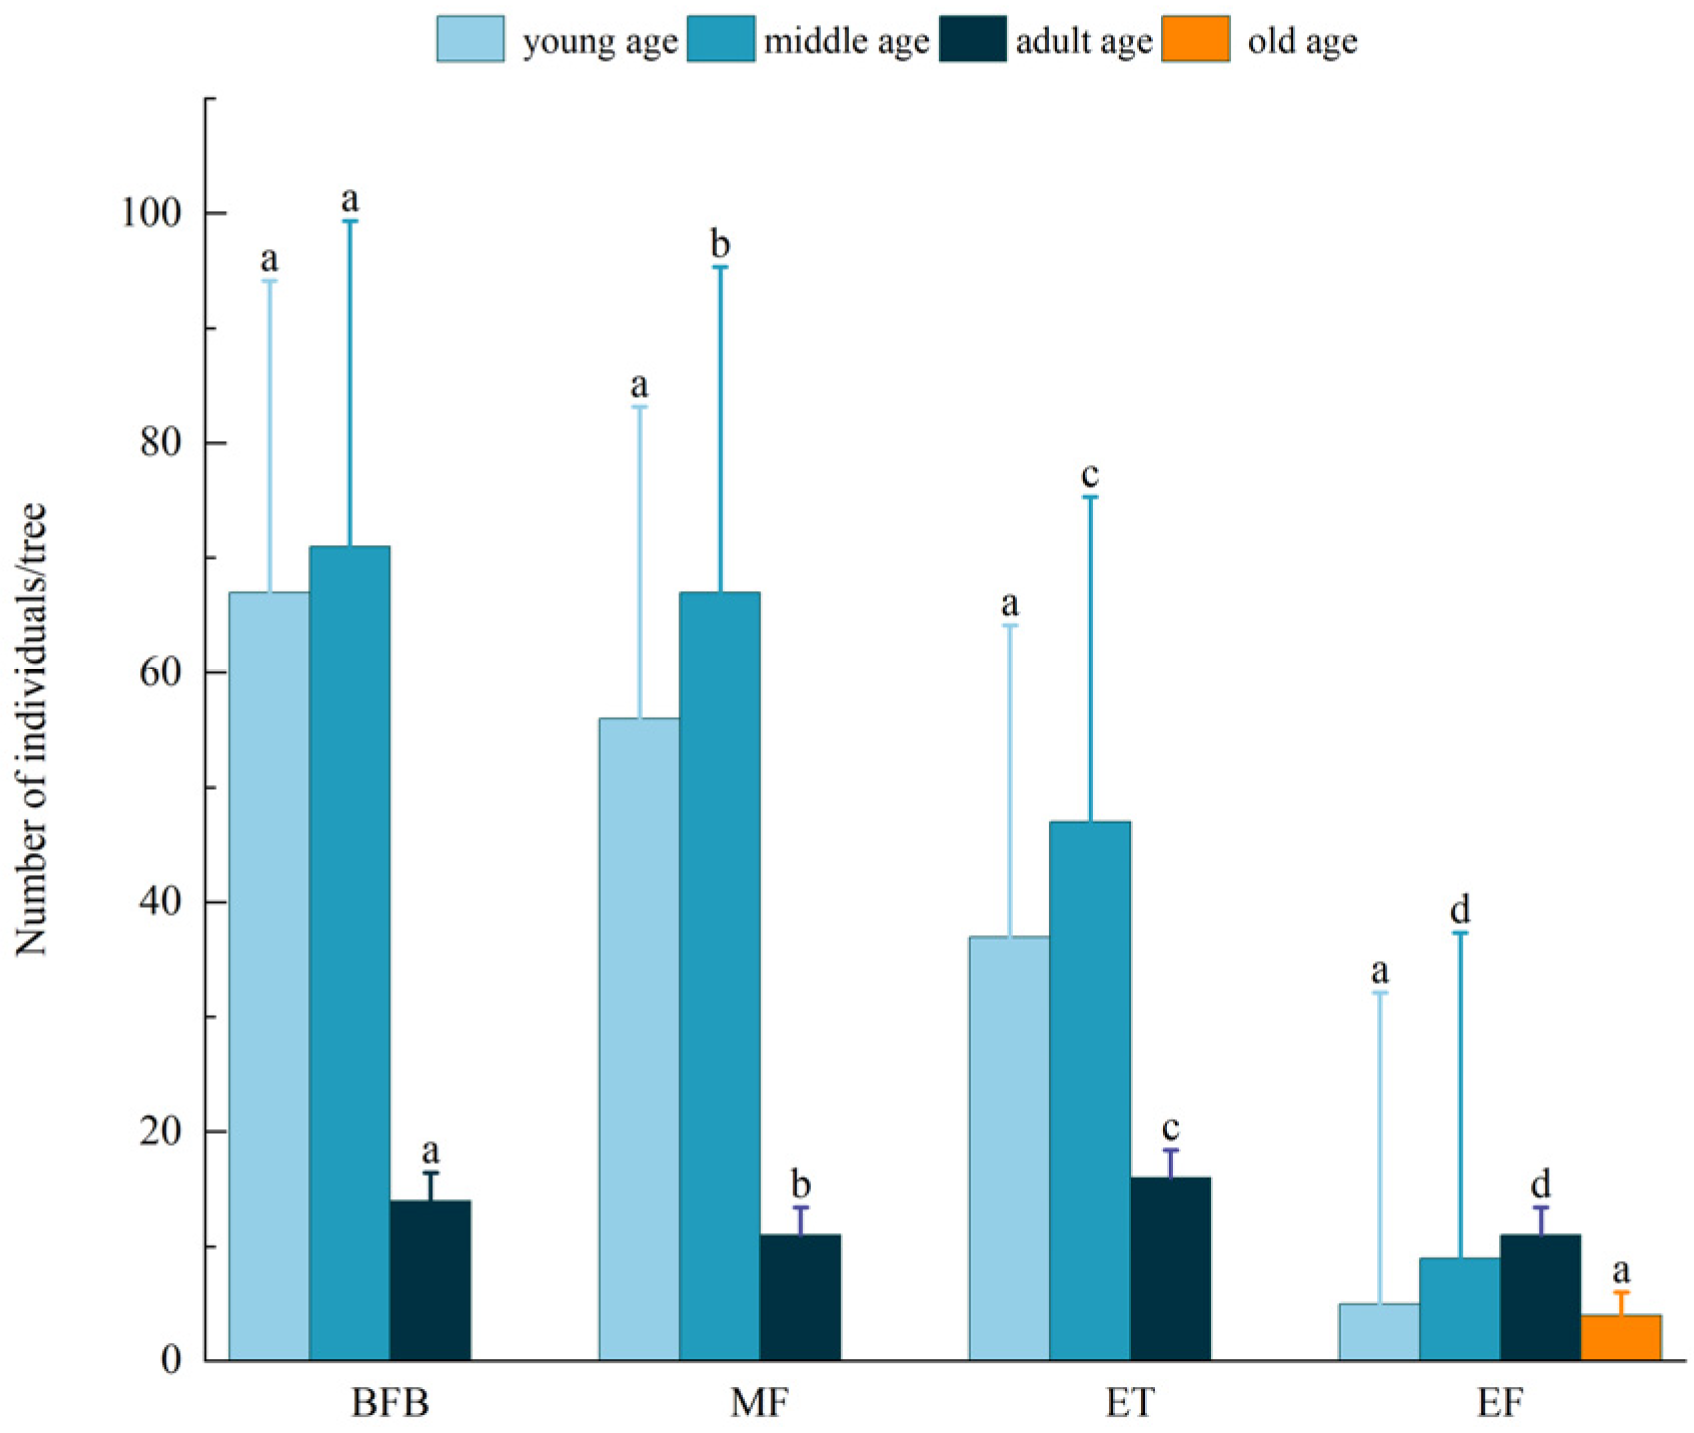
Alsophila spinulosa populations comprised a large base of young and middle-aged individuals, with the number of individuals gradually decreasing with age class (Figure 1). The number of middle-aged individuals was 46.75% of the total, whereas the number of older individuals was only 0.96% of the total. Considering different community types (Figure 2), A. spinulosa followed an abundance distribution of BFB > MF > ET > EF, while the numbers of A. spinulosa at different ages were significantly different (p < 0.05). Older individuals were only observed in the EF communities.
3.2. Structural Characteristics of A. spinulosa Populations under Different Transects
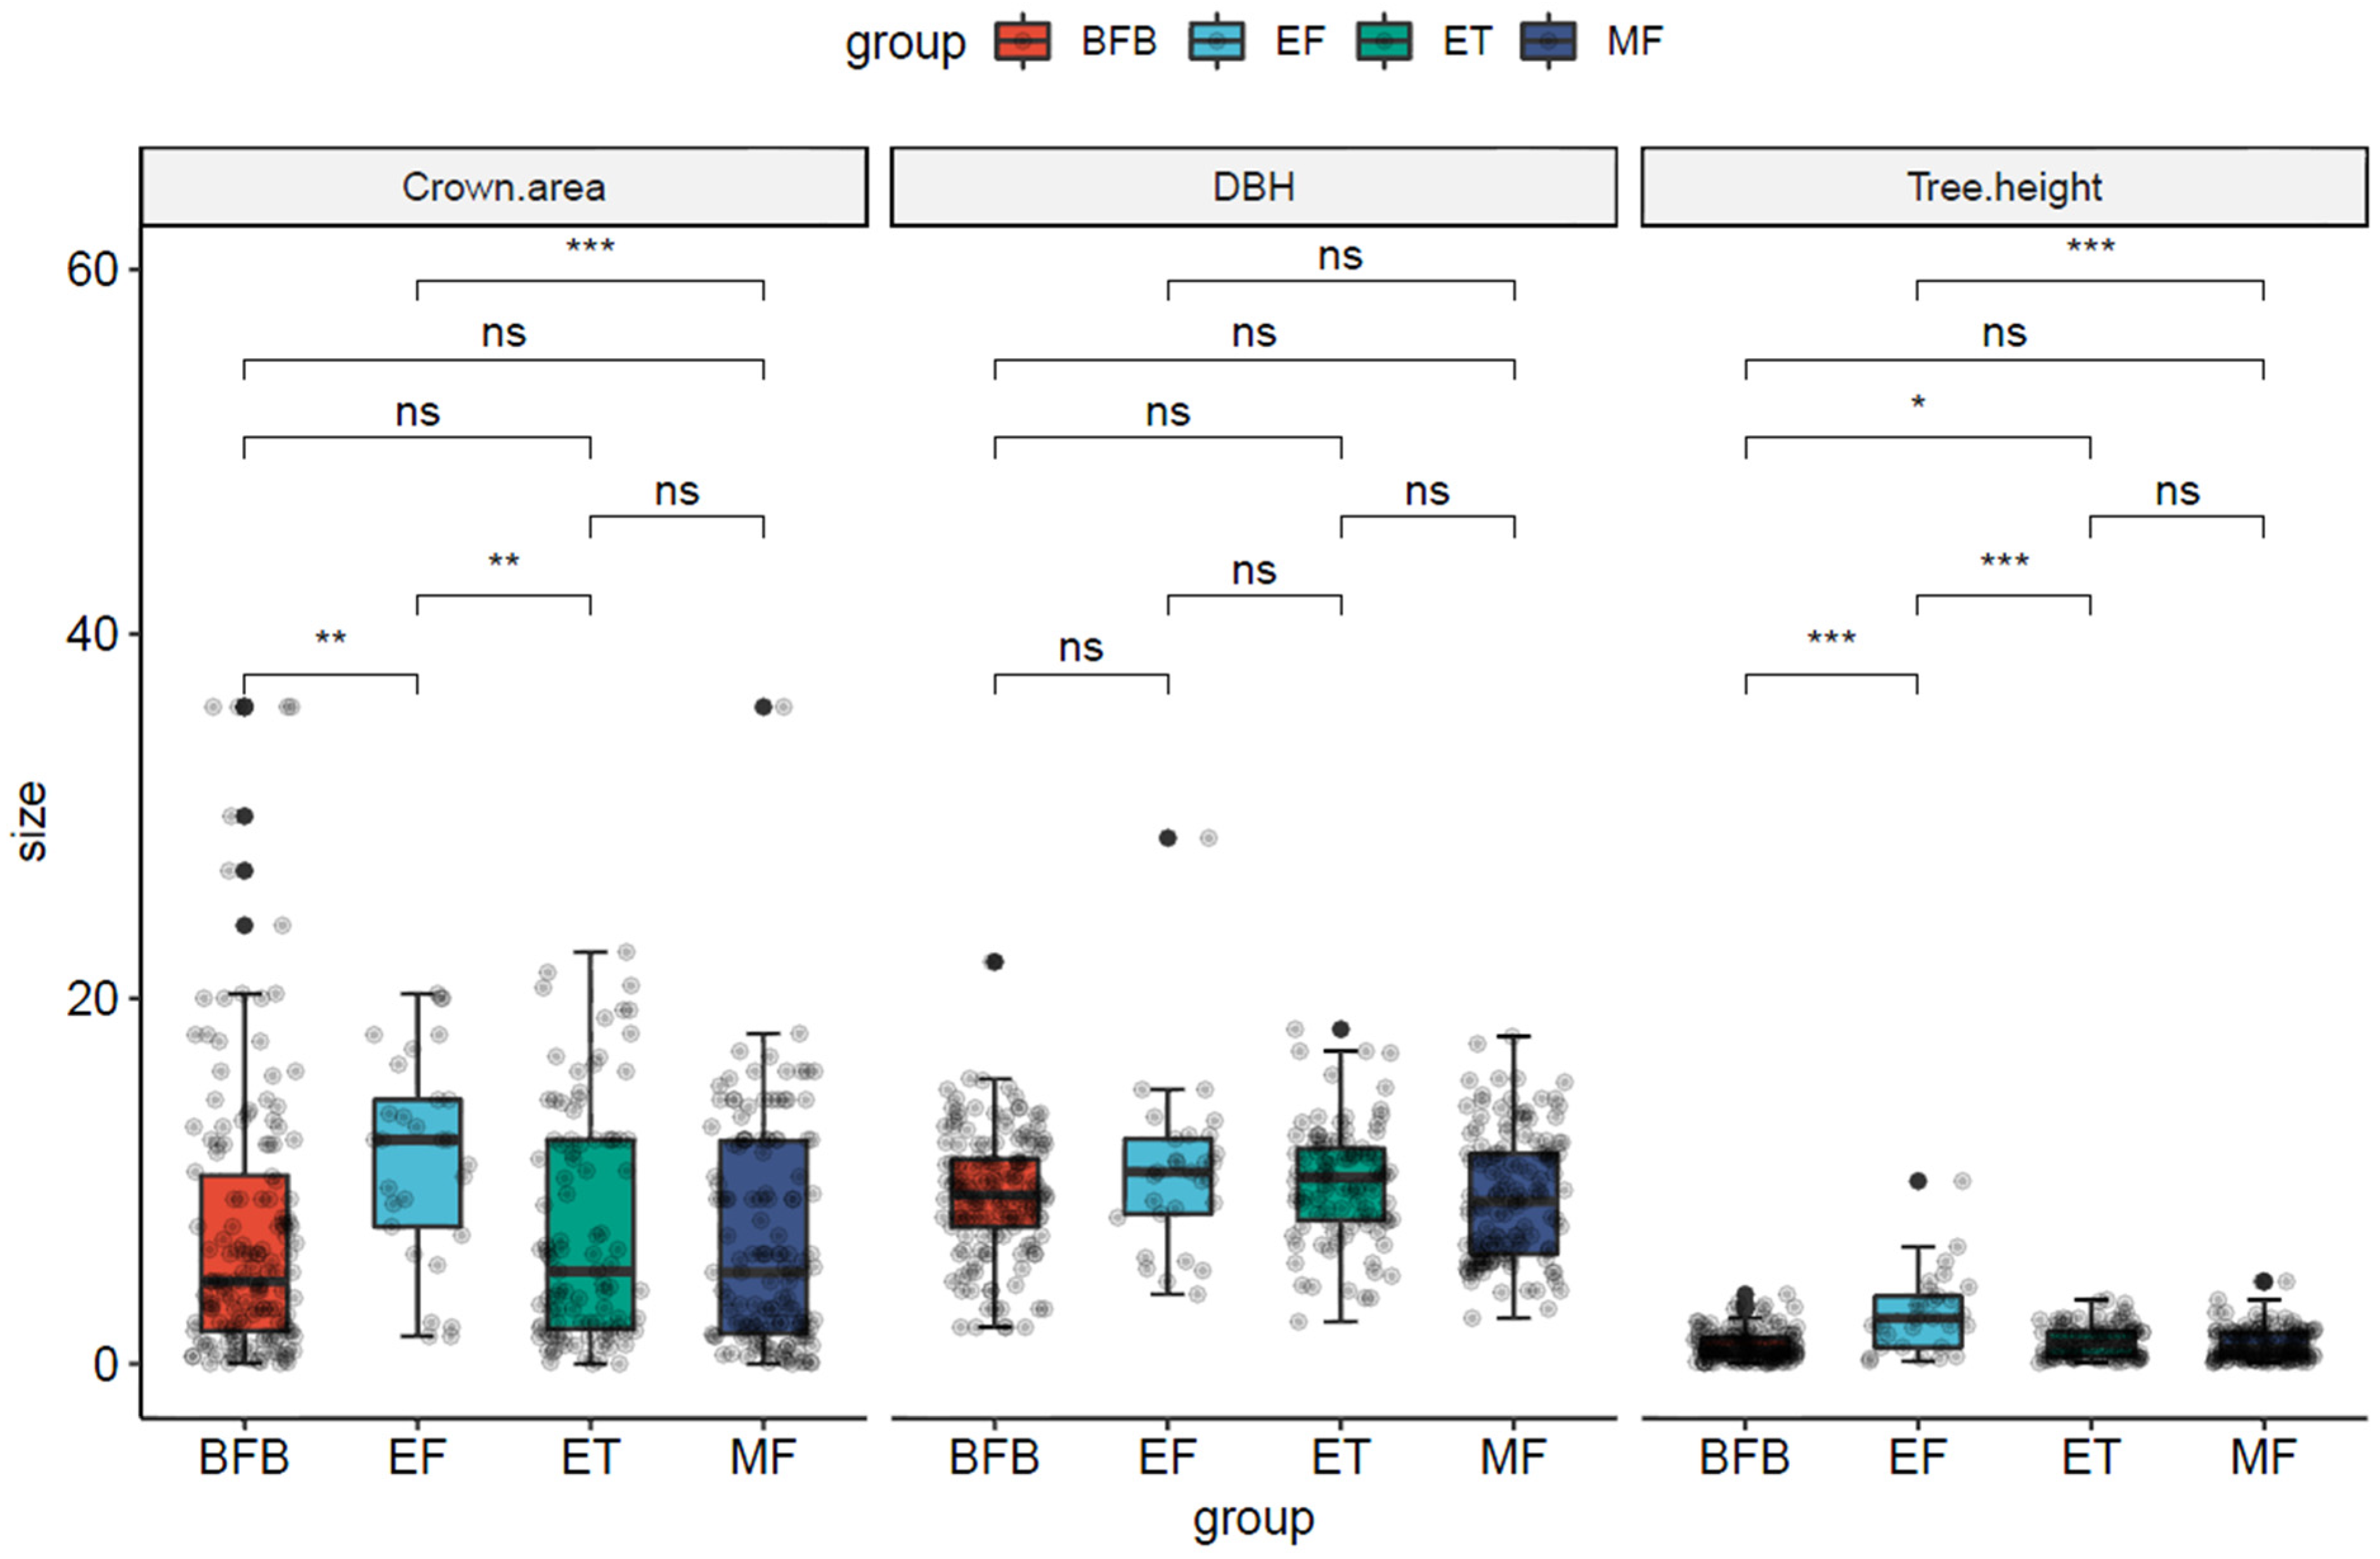
The crown width structure of A. spinulosa populations significantly differed between different transects(Figure 3), with the degree of variation following the trend of CVBFB (8.15) > CVMF (5.25) > CVET (4.33) > CVEF (2.80). The DBH structure did not significantly differ among transects, with the degree of variation being CVEF (2.09) > CVMF (1.32) > CVBFB (1.21) > CVET (0.97). The height structure significantly differed among transects, with the degree of variation being CVEF (1.69) > CVMF (0.76) > CVET (0.74) > CVBFB (0.61). A. spinulosa populations exhibited the highest density of 0.0825 plants/m2 in BFB and the lowest density of 0.0025 plants/m2 in the EF transect, reflecting a density reduction of 96.97%. Thus, community types influenced the structure of A. spinulosa populations.
3.3. Spatial Patterns of Different Age Classes of A. spinulosa Populations in Chishui and Their Intraspecific Associations
3.3.1. Spatial Distributions Based on the CSR and HP Null Models
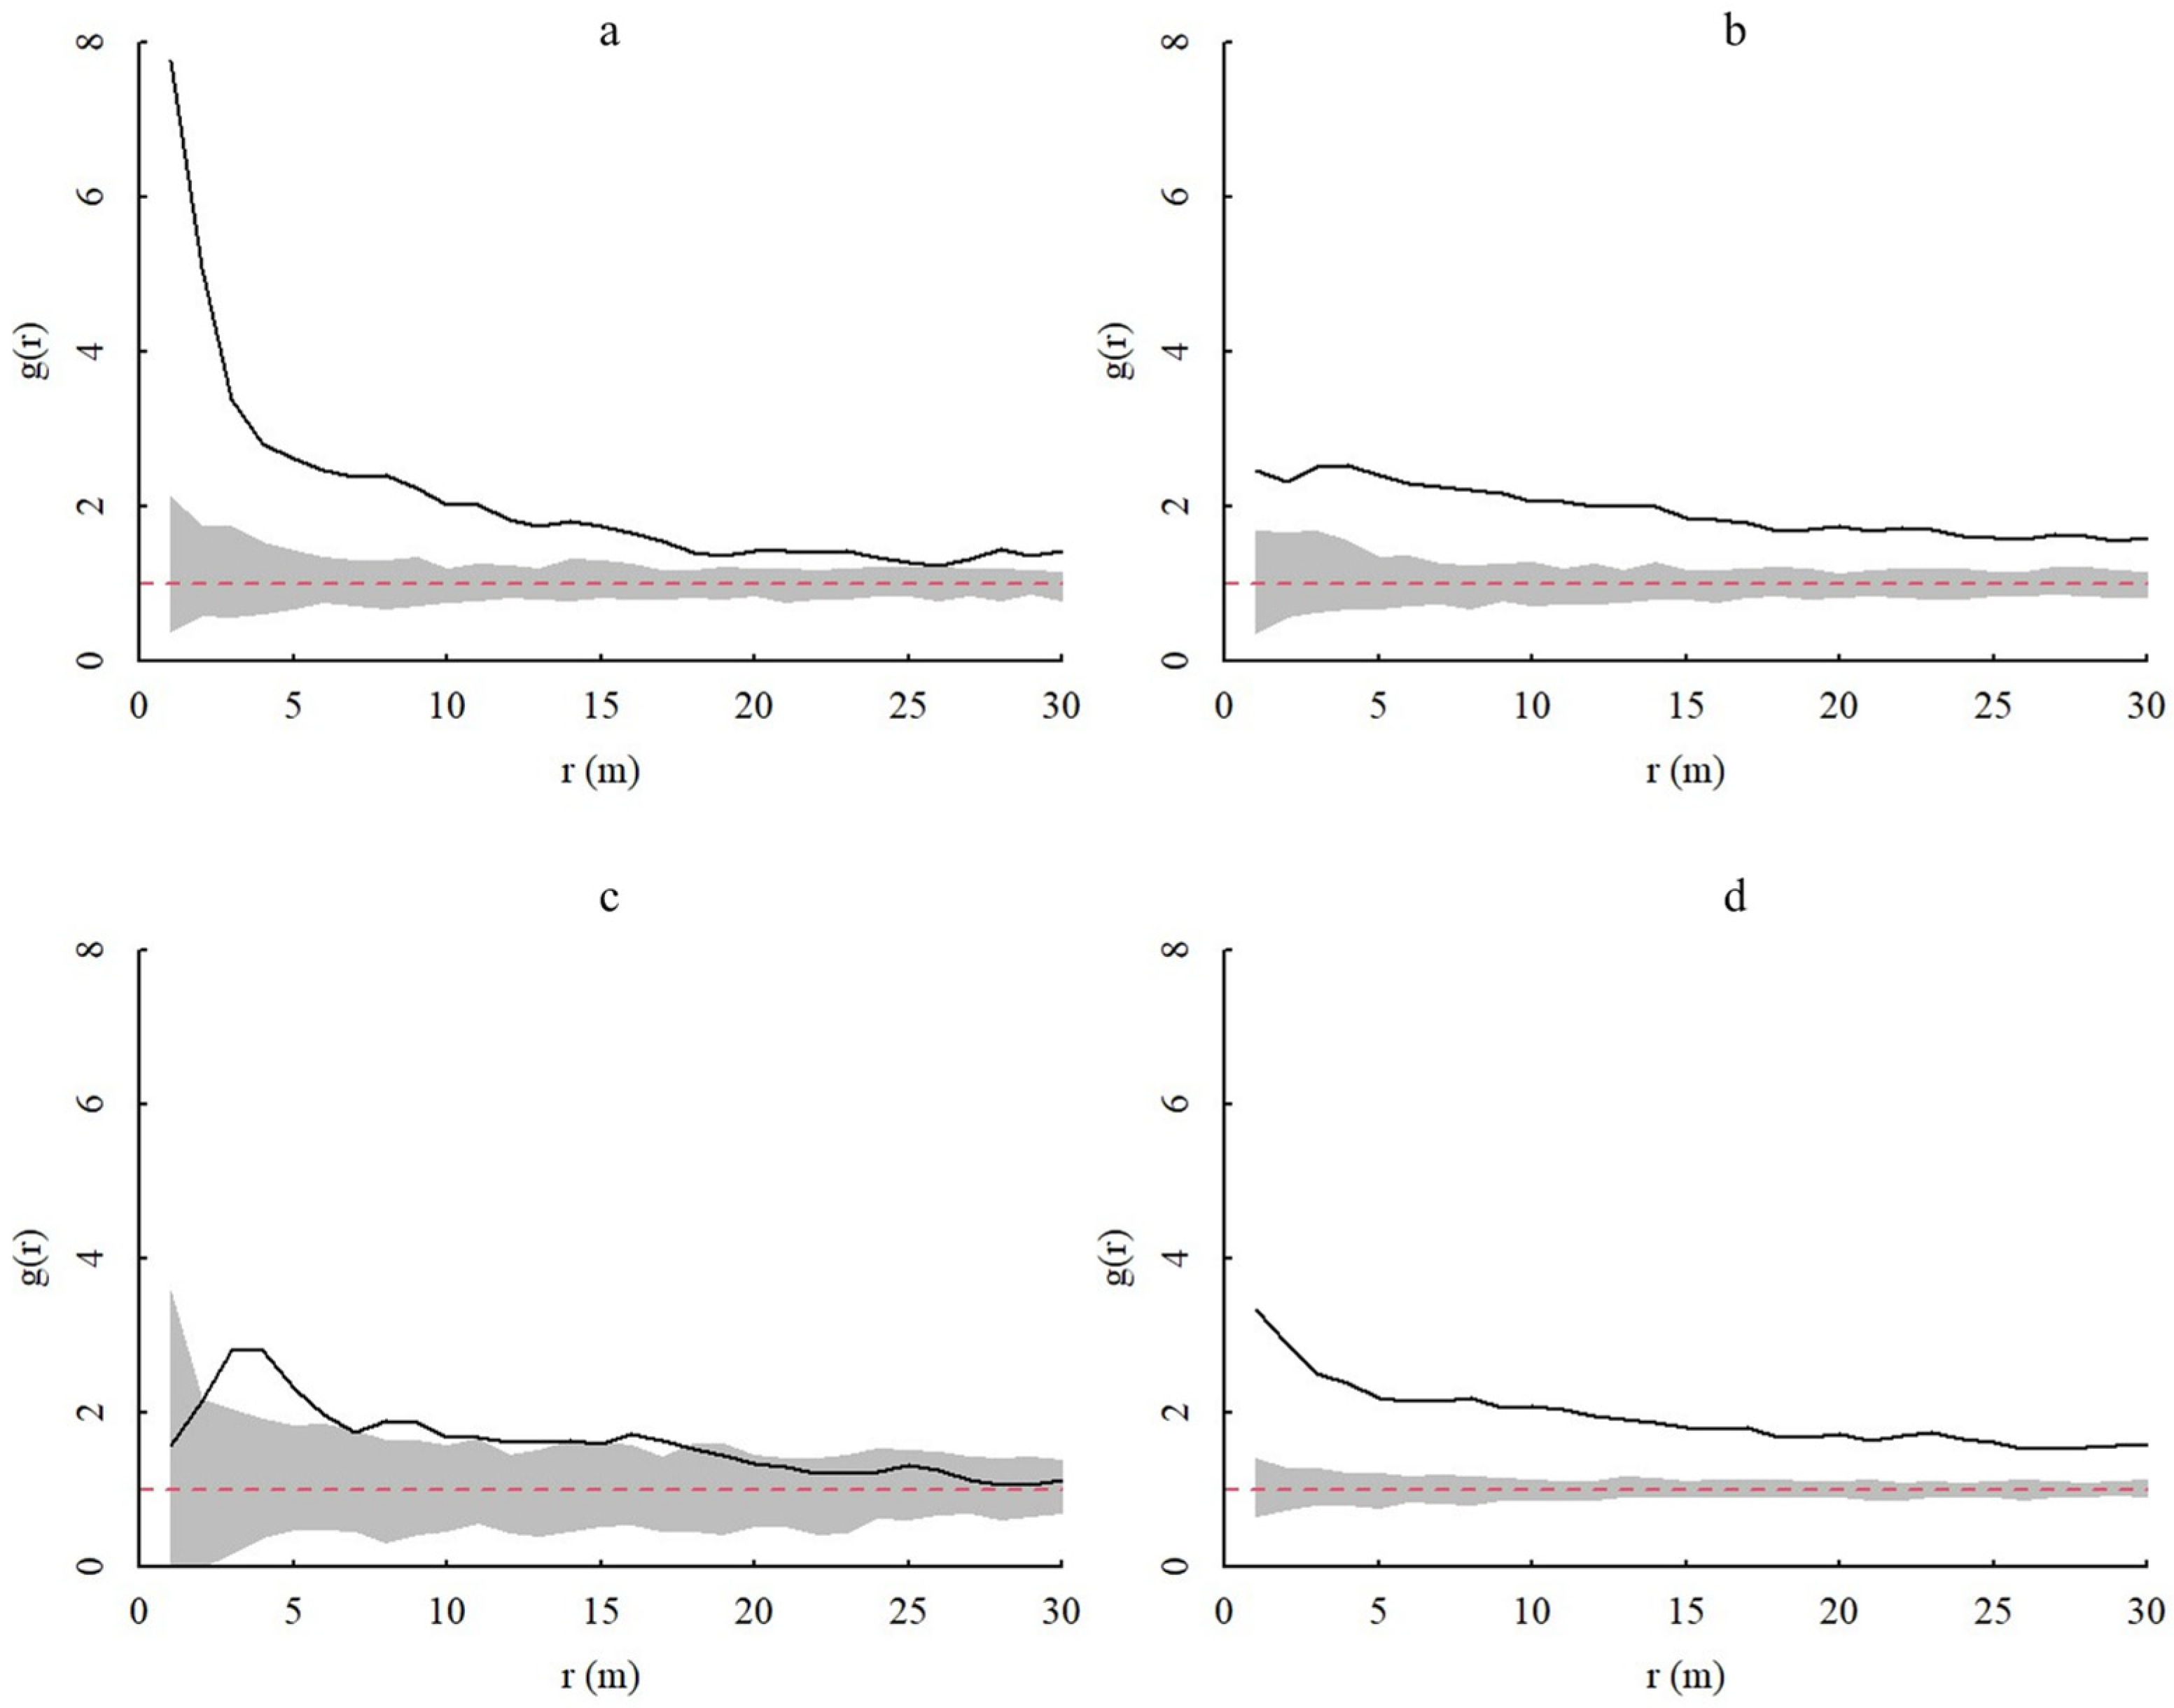
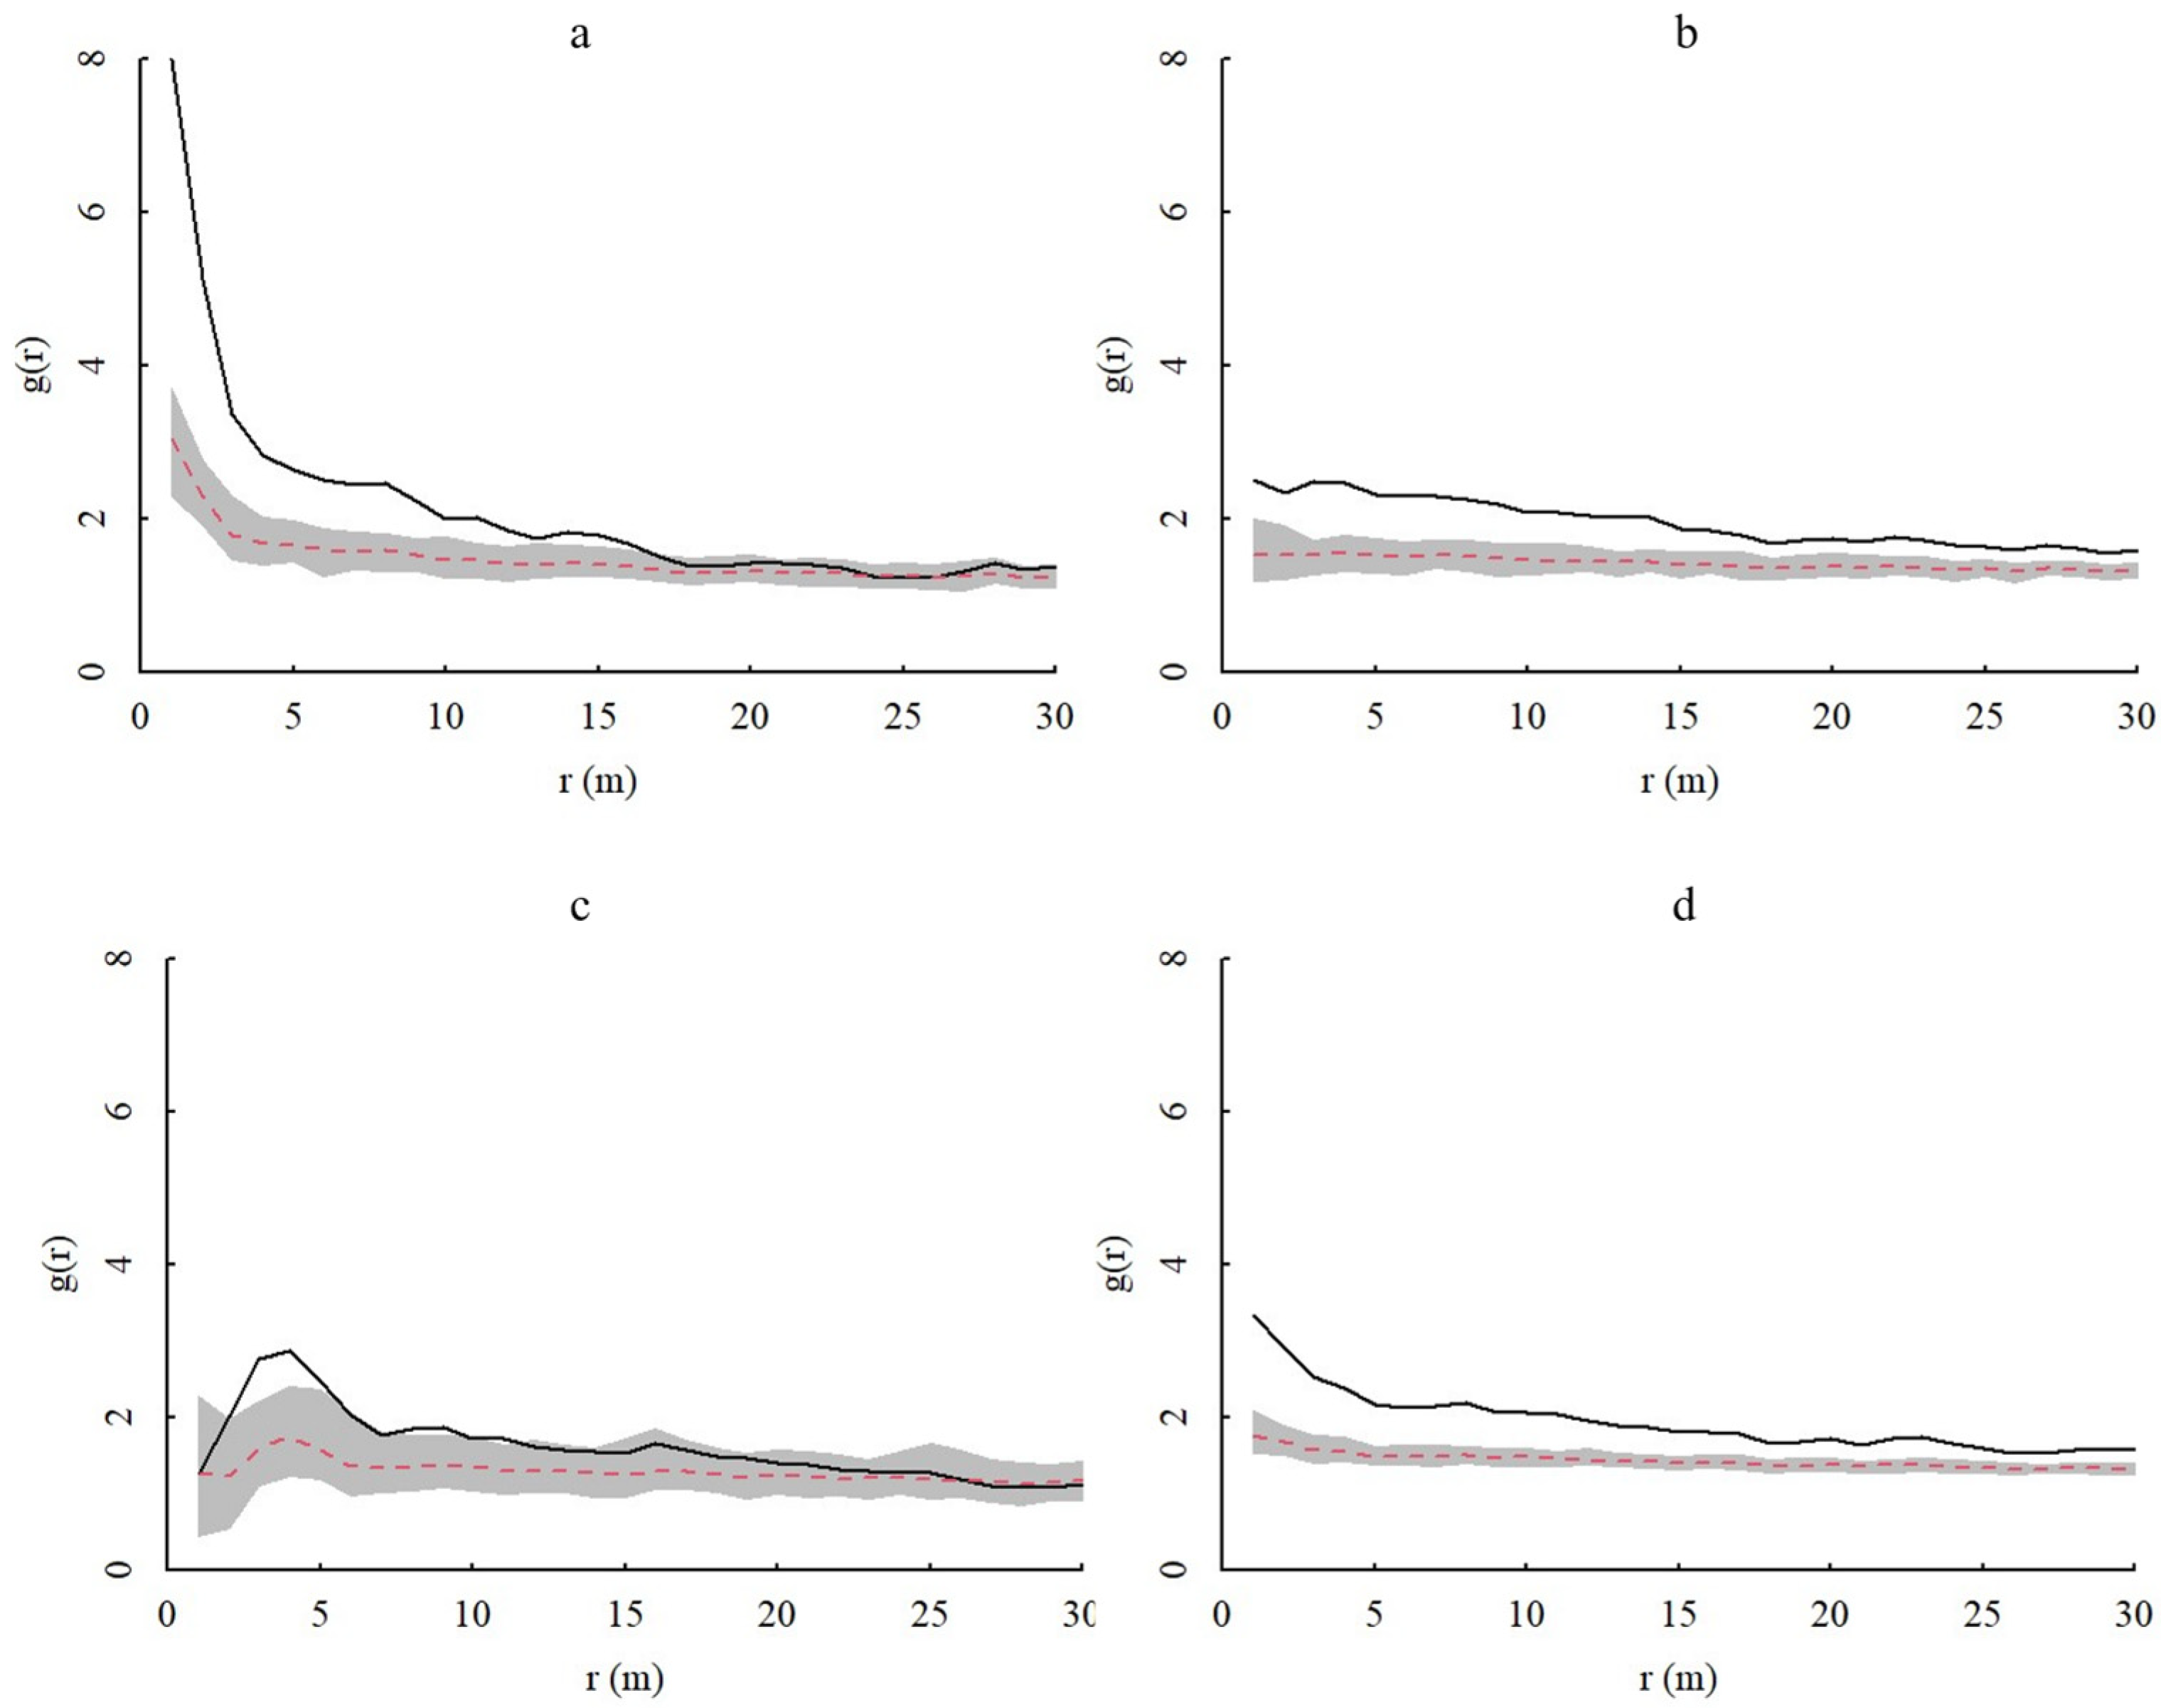
In homogeneous environments, the spatial distributions of juvenile, middle-aged, and adult A. spinulosa populations generally exhibited aggregated distributions, with the degree of aggregation decreasing with increasing scale and gradually becoming random distributions (Figure 4). Adult individuals tend to be more randomly distributed at 0–30 m, while the aggregation of juvenile individuals is most obviously affected at the 0–5 m scale. In heterogeneous environments, the spatial patterns of overall populations and age classes of A. spinulosa in Chishui tended to be more randomly distributed (Figure 5). Thus, heterogeneous environments noticeably influence the spatial distribution of A. spinulosa populations.
3.3.2. Spatial Correlation between Different Age Classes of A. spinulosa Populations
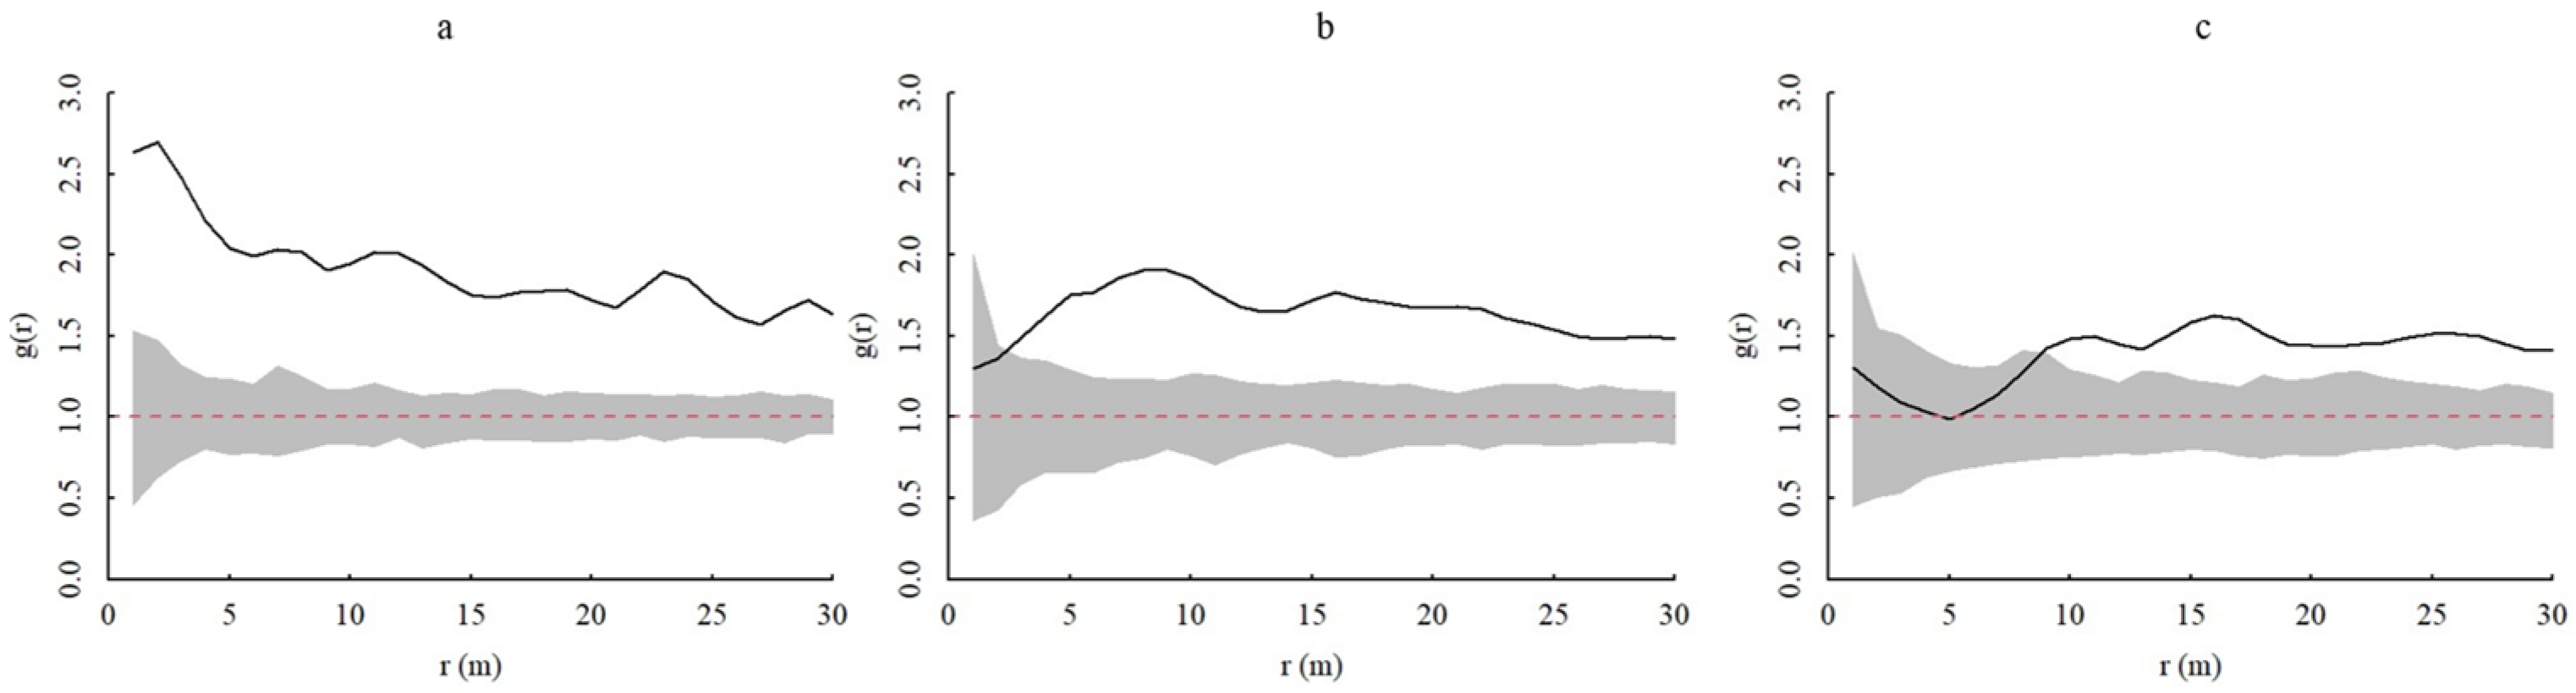
The juvenile and middle-aged individuals of A. spinulosa populations all show positive association at 0~30 m scale, and the association degree gradually decreases with increasing scale; juvenile and adult individuals show no association at 0~8 m scale but show positive association at 8~30 m scale, and the association degree is highest at 16 m scale and then stabilizes; middle-aged and adult individuals show no association at 0~3 m scale and show positive association at 4~30 m scale (Figure 6).
3.4. Spatial Association of Different Forest Layer Plants with A. spinulosa Populations
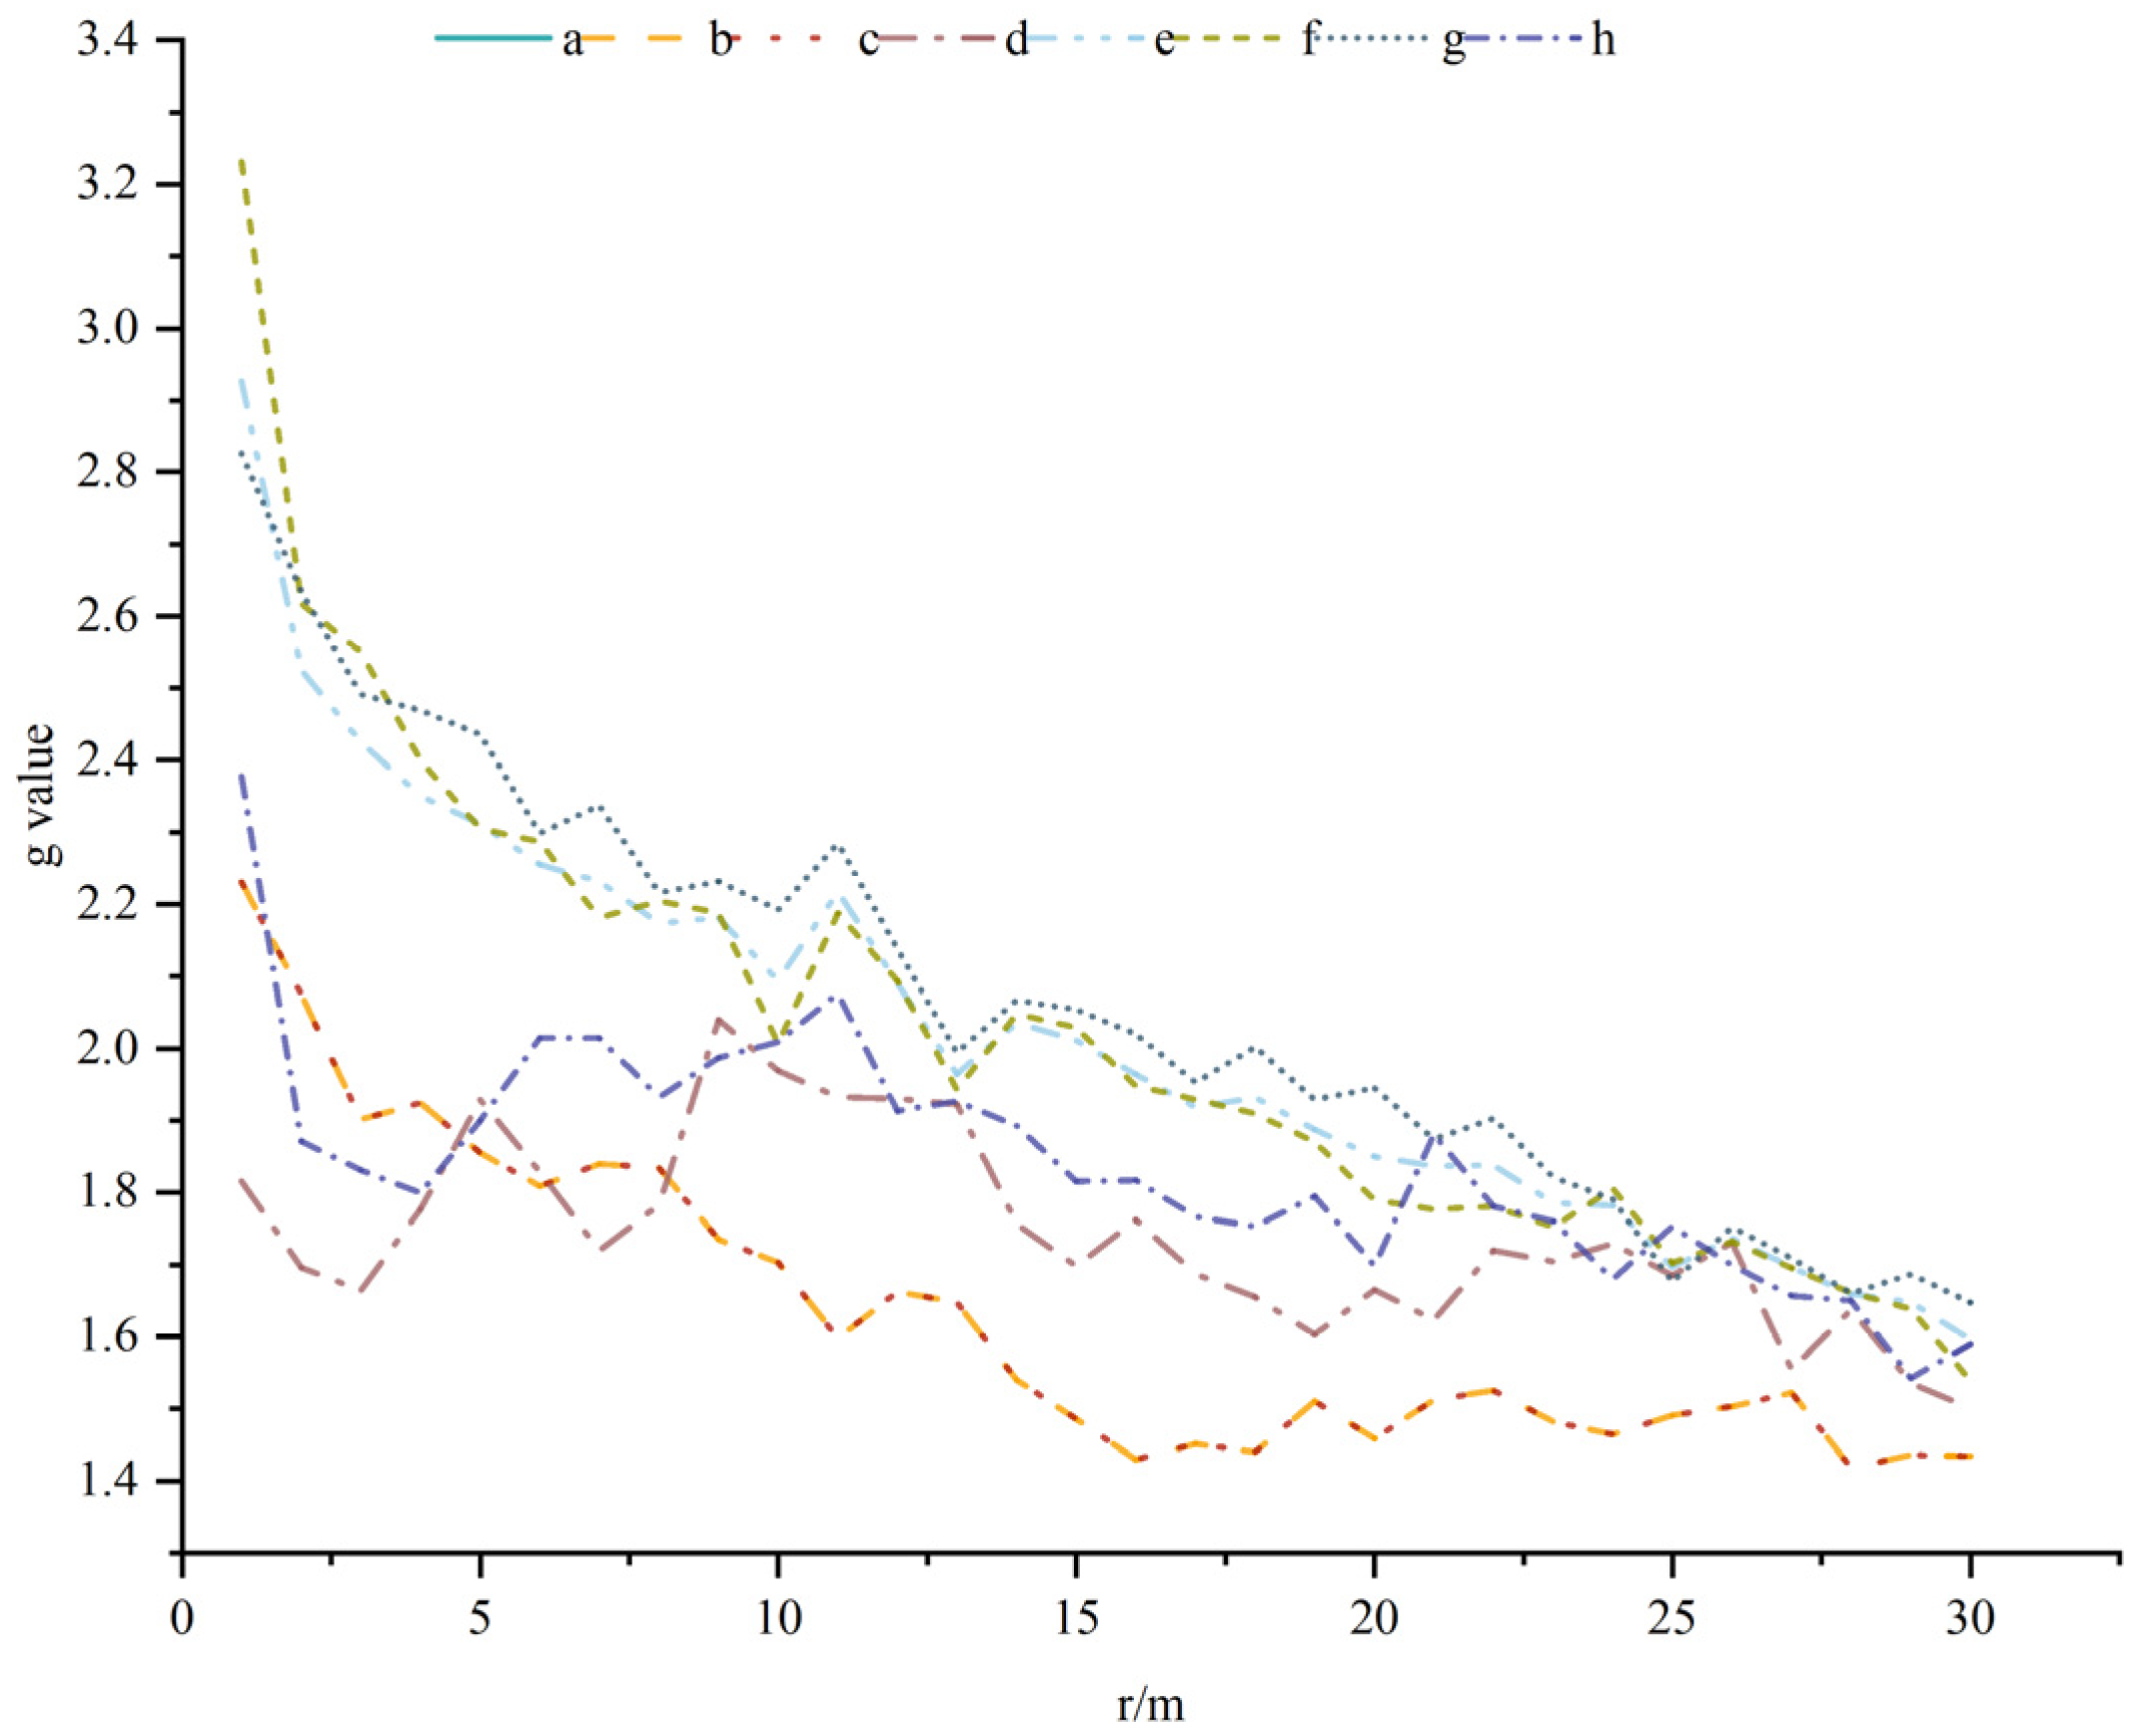
Different forest layer plants exhibited positive relationships with overall A. spinulosa populations and other age groups (Figure 7). Specifically, the canopy substratum exhibited a more positive relationship with young and middle-aged spinifexes at 1–4 m and with adult spinifexes above the 9 m scale. The upper layer of the forest canopy exhibited a more positive relationship with juvenile A. spinulosa individuals at all investigated scales, but most clearly at the 1–8 m scale. Overall, the positive relationships between the upper layer of the forest canopy and A. spinulosa populations were higher than those of the second layer of the forest canopy.
3.5. Association of Dominant Plants with A. spinulosa Populations
A. spinulosa population sizes were positively correlated with most of the dominant plants, wherein the degree of positive correlation decreased with increasing area. In addition, a negative correlation was observed between Mallotus philippensis and Eurya nitida at the 0–25 m scale and the degree of negative correlation decreased with increasing scale, while no correlation was observed across the rest of the scale. The correlation with Lasianthus chinensis was low, exhibiting a negative correlation at the 4.5–8 m scale, a positive correlation at the 24–29 m scale, and no correlation across the rest of the scale (Table 2).
4. Discussion
4.1. Influence of Community Type and Habitat Heterogeneity on A. spinulosa Population Structures
Community types significantly affected A. spinulosa population structures in this study. Population densities were the lowest in the EF transect and the highest in the BFB transect. This may have occurred because A. spinulosa is a pioneer plant of the communities, and simply structured community environments are more suitable for their growth. In contrast, the competitiveness of pioneer plants will gradually decrease as community succession occurs. Similarly, community types affect the stability of plant population structures [28]. The DBH structures of the populations did not significantly differ among transects, while the crown and height structures of the tree significantly varied among transects. A. spinulosa does not exhibit substantial radial growth, perhaps leading to insignificant differences in DBH among populations. The lowest degree of variation was observed in the ET transect, suggesting that a staggered zone community could improve the stability of A. spinulosa thoracic diameter structure. The canopy structures of the populations in the EF transect significantly differed from those in the other transects. The EF transect community type also greatly influenced the canopy structure of A. spinulosa populations. However, variation in the canopy structure of the populations was the lowest in the EF transect, while variation in height structure was the highest for the EF transect. The age class of the EF community strongly fluctuates with different age classes of the individuals. Nevertheless, the number of each age class remained stable, indicating that the conditions in the EF transect promoted stable survival of the populations.
Individuals of all age classes of A. spinulosa populations exhibited similar spatial distributions under both models used in this study. However, the HP model tended to produce more random patterning. The HP null model tests the intrinsic characteristics and formation mechanisms of the spatial pattern formation of populations, thereby compensating for the shortcomings of the CSR null model [29]. This suggested that habitat heterogeneity has an important influence on the spatial distribution of A. spinulosa populations, although the exact mechanism underlying this influence remains unclear. Under both models, the degree of population aggregation varied most significantly at the 0–5 m scale. Thus, this spatial range may critically influence A. spinulosa growth, such that the habitat conditions and species composition at this scale highly Influence A. spinulosa survival.
4.2. Spatial Relationships of A. spinulosa
The results from this study reveal stronger positive correlations between the juvenile and lower age classes of A. spinulosa populations that mostly simultaneously exist at small spatial scales. In contrast, the correlations between age classes significantly differed at larger scales and tended to plateau. This may result from a combination of clustering [30], density constraints [31], dispersal limitation [32], and habitat heterogeneity [33]. Clustering can increase individual survival as a means of defense against external threats. After a change in individual survival strategy, adult individuals expend more energy on maintenance, with population clustering in the environment instead of increasing intraspecific competition and the weakening of clustering enabling the availability of adequate resources. Intraspecific aggregation may lead to asymmetric competition processes between neighboring plant individuals, wherein density effects can trigger the self-thinning of individual plants. Habitat heterogeneity affects population distributions at large scales, while density constraints and dispersal limitations affect population distributions at small scales. In general, larger individuals more strongly influence smaller individuals at smaller scales [34], consistent with the results of this study.
In this study, the positive association of community canopy substrates with A. spinulosa populations was lower than for the upper canopy. The positions of plants within vertical community structures determine the ability of plants to gain adequate access to environmental resources, and also impact colonization by other plant populations [35]. Light levels generally decrease extending from the top to the bottom of the forest layer, such that lower plant species have less light available for their use, and species competition for light is intense [36]. Most individuals in the population belong to the sub-forest layer and species interactions may be responsible for weakening positive interactions between them. The results from this study suggest that the vertical structure of communities influences population spatial relationships.
Population numbers in this study were positively associated with the community type and most of the dominant plants, with differences observed in the degree of positive association at moderate distance scales. The degree of spatial association between species is strongly scale-dependent, with increasing scale weakening the associations between species [37]. The negative correlations observed here between the A. spinulosa populations and the dominant plants in the EF zone, Mallotus philippensis and Eurya nitida, suggest that different plant communities may have an inhibitory effect on the distribution and growth of A. spinulosa. Thus, this study shows that changes in the dominant plants and plant community types impact the spatial relationships of A. spinulosa populations.
5. Conclusions
The results from this study demonstrate that the population structures of A. spinulosa are significantly influenced by different community types, with height structure and canopy structure most clearly responding to differences in community type. The CSR and HP null models showed that the populations are generally aggregated, and the degree of aggregation decreases with scale, while the young- and middle-aged individuals exhibited aggregated distributions across the entire study scale. Mature individuals were randomly distributed on a global scale. However, the aggregation degree of young individuals was most apparent at the 0–5 m scale, suggesting that this is a crucial spatial range that affects their growth. The trends and random distributions of populations under the HP null model indicated that habitat heterogeneity particularly affected the spatial distributions of A. spinulosa. Intra-species correlations between different age classes of the populations were most evident at small scales, with higher positive correlations observed between the upper layer of the community canopy and A. spinulosa populations compared with that of the second layer of the canopy. Furthermore, A. spinulosa populations were positively correlated with the presence of most of the dominant plants in the community. Habitat heterogeneity is one of the principal mechanisms affecting the spatial distribution of plants, while forest types affect spatial relationships. Thus, the effects of the inferred mechanisms structuring A. spinulosa population distributions should be further investigated to improve our understanding of the impacts of forest structure on the population structures of tree-forming ferns.
Author Contributions
Conceptualization, L.Y. (Lingbin Yan) and D.Y.; methodology, D.Y. and M.Y.; software, D.Y. and M.Y.; validation, L.Y. (Lifei Yu); formal analysis, J.M.; investigation, D.Y. and M.Y.; resources, M.A.; data curation, L.Y. (Lingbin Yan); writing—original draft preparation, D.Y.; writing—review and editing, L.Y. (Lingbin Yan); visualization, D.Y.; supervision, Q.H.; project administration, Q.H.; funding acquisition, Q.H. All authors have read and agreed to the published version of the manuscript.
Funding
This work was supported by the Special program for key protected plants in national nature reserves (NO-202204); Talent Introduction Scientific Research Project of Guizhou University (Guigengji (2020) No. 27); Construction Program of Biology First-class Discipline in Guizhou, Grant/Award Number: GNYL[2017]009.
Data Availability Statement
Data are contained within the article.
Acknowledgments
We are grateful to the Chishui Alsophila spinulosa National Nature Reserve Administration in Chishui for their help with the field survey.
Conflicts of Interest
The authors declare no conflict of interest.
References
- Peng, C.; Ai, W.; Qi, L.; Tu, J.; Meng, Y.; Yang, M.; Li, M. Cunninghamia lanceolata sprout population structure, dynamics and biomass allocation changes during Phyllostachys edulis expansion in middleō-southern China. Trees 2022, 36, 1207–1218. [Google Scholar] [CrossRef]
- Acquah, S.B.; Marshall, P.L.; Eskelson, B.N.; Barbeito, I. Temporal changes in tree spatial patterns in uneven-aged interior Douglas-fir dominated stands managed under different thinning treatments. For. Ecol. Manag. 2023, 528, 120640. [Google Scholar] [CrossRef]
- Wan, Z.B.; Li, X.Q.; Liu, C.G.; Sun, H.G.; Wang, X.F.; Fang, Y.J. Dynamic Analysis of Relationship among Tree Height, Diameter at the Breast Height and Crown of Artificial Sassafras tzumu Forest at Different Development Stages. Genom. Appl. Biol. 2017, 36, 331–339. [Google Scholar]
- Fibich, P.; Lepš, J.; Novotný, V.; Klimeš, P.; Těšitel, J.; Molem, K.; Damas, K.; Weiblen, G.D. Spatial patterns of tree species distribution in New Guinea primary and secondary lowland rain forest. J. Veg. Sci. 2016, 27, 328–339. [Google Scholar] [CrossRef]
- Dray, S.; Pélissier, R.; Couteron, P.; Fortin, M.J.; Legendre, P.; Peres-Neto, P.R.; Bellier, E.; Bivand, R.; Blanchet, F.G.; De Cáceres, M.; et al. Community ecology in the age of multivariate multiscale spatial analysis. Ecol. Monogr. 2012, 82, 257–275. [Google Scholar] [CrossRef]
- Stuber, E.F.; Carlson, B.S.; Jesmer, B.R. Spatial personalities: A meta-analysis of consistent individual differences in spatial behavior. Behav. Ecol. 2022, 33, 477–486. [Google Scholar] [CrossRef]
- Liu, Y.; Zeng, Y.; Yang, Y.; Wang, N.; Liang, Y. Competition, spatial pattern, and regeneration of Haloxylon ammoden dron and Haloxylon persicum communities in the Gurbantunggut Desert, Northwest China. J. Arid. Land 2022, 14, 1138–1158. [Google Scholar] [CrossRef]
- Pimm, S.L.; Jenkins, C.N.; Abell, R.; Brooks, T.M.; Gittleman, J.L.; Joppa, L.N.; Raven, P.H.; Roberts, C.M.; Sexton, J.O. The biodiversity of species and their rates of extinction, distribution, and protection. Science 2014, 344, 1246752. [Google Scholar] [CrossRef]
- Lefcheck, J.S.; Byrnes, J.E.K.; Isbell, F.; Gamfeldt, L.; Griffin, J.N.; Eisenhauer, N.; Hensel, M.J.S.; Hector, A.; Cardinale, B.J.; Duffy, J.E. Biodiversity enhances ecosystem multifunctionality across trophic levels and habitats. Nat. Commun. 2015, 6, 6936. [Google Scholar] [CrossRef]
- Yan, N.; Zhang, H.; Zhang, Z.; Zhang, H.; Zhou, L.; Chen, T.; Feng, S.; Ding, C.; Yuan, M. The extraction, antioxidant and against β-amyloid induced toxicity of polyphenols from Alsophila spinulosa leaves. Arab. J. Chem. 2022, 15, 103707. [Google Scholar] [CrossRef]
- He, Q.Q.; Weng, T.; Liu, B.Y.; Luo, X.H.; Mu, J.; Cheng, J.; An, M.T.; Yan, L.B. Research Advance in Conservation Strategies of Cyatheaceae Plant Communities based on Interspecific Relationships. J. Trop. Subtrop. Bot. 2022, 30, 753–762. [Google Scholar]
- Chen, Z.Y.; Zhang, F.L.; Lan, Q.Y.; Xu, Z.F.; Tao, G.D. Study on the propagatiom and conservation of germplasm in Alsophila spinulosa. Acta Bot. Yunnanica 1991, 13, 181–188. [Google Scholar]
- Lang, Y.T.; Ma, C.W.; Yu, J.; Buo, R.; Yan, Y.H.; Yang, D.M. Technology for Rapid Propagation in Vitro of Two Alsophila Species. Chin. J. Trop. Crops 2021, 42, 1579–1588. [Google Scholar]
- Xie, C.P.; Wang, C.L.; Wang, H.H.; Li, C.J.; Cheng, L. Population Structure and Dynami Characteristics of Alsophila spinulosa in Diaoluo Mountain Tropic Rain Forest of Hainan. J. Xinyang Norm. Univ. (Nat. Sci. Ed.) 2022, 35, 566–575. [Google Scholar]
- Xie, C.P.; Zhao, B.S.; Liu, D.W.; Fang, Y. Study on the Population Structure of Alsophila podophylla Hook in Bawangling Nature Reserve. J. Sichuan Agric. Univ. 2018, 36, 765–771. [Google Scholar]
- Yang, Q.J. Simulating the Potential Suitable Habitats of the Relict Plant Alsophila spinulosa in Different Periods Based on MaxEnt Model; Zhejisng University: Hangzhou, China, 2021. [Google Scholar]
- Ji, Y.; Cao, M.Y.; Bai, C.F.; Jing, L.Q.; Li, C.; Li, P. Population Structure and Dynamics of Alsophila spinulosa in Mount Emei. Acta Bot. Boreali Occident. Sin. 2019, 39, 543–551. [Google Scholar]
- Zhao, R.B. Study on Population Structure and Distribution Characteristics of Wild Cyatheaceae in Hainan Island; Hainan University: Haikou, China, 2018. [Google Scholar]
- Hu, Q.; Qian, R.; Zhang, Y.; Ma, X.; Ye, Y.; Zhang, X.; Lin, L.; Liu, H.; Zheng, J. Complete chloroplast genome molecular structure, comparative and phylogenetic analyses of Sphaeropteris lepifera of Cyatheaceae family: A tree fern from China. Sci. Rep. 2023, 13, 1356. [Google Scholar] [CrossRef]
- Du, Y. Study on Population Dynamics and Host Selection of Phytophagous Insects of Alsophila spinulosa; Guizhou Normal University: Guiyang, China, 2022. [Google Scholar]
- Zuo, Y.; Qu, H.; Xia, C.; Zhang, H.; Zhang, J.; Deng, H. Moso Bamboo Invasion Reshapes Community Structure of Denitrifying Bacteria in Rhizosphere of Alsophila spinulosa. Microorganisms 2022, 10, 180. [Google Scholar] [CrossRef] [PubMed]
- Ma, Y.; Jiao, P.; Qi, Z.; Jiang, Z.; Guan, S. Characterization of the complete chloroplast genome of Alsophila spinulosa, an endangered species endemic to China. Mitochondrial DNA Part B 2020, 5, 2262–2263. [Google Scholar] [CrossRef]
- Zhong, X.H. A Tentative Study on Community Characteristics and Population Dynamics of Alsophila spinulata of Chishui Alsophila spinulata National Nature Reserve; Southwest University: Chongqing, China, 2017. [Google Scholar]
- Jiao, J.; Hu, G.; Yan, J. Heterogeneity pursuit for spatial point pattern with application to tree locations: A Bayesian semipar ametric recourse. Environmetrics 2021, 32, e2694. [Google Scholar] [CrossRef]
- Wang, X.; Wang, D.; Li, H.; Tai, Y.; Jiang, C.; Liu, F.; Li, S.; Miao, B. Cumulative effects of K-function in point patterns. Chin. J. Appl. Ecol. 2022, 33, 1275–1282. [Google Scholar]
- Wiegand, T.; Moloney, K.A. Rings, circles, and null-models for point pattern analysis in ecology. Oikos 2004, 104, 209–229. [Google Scholar] [CrossRef]
- Miao, N.; Xu, H.; Moermond, T.C.; Li, Y.; Liu, S. Density-dependent and distance-dependent effects in a 60-ha tropical moun tain rain forest in the Jianfengling mountains, Hainan Island, China: Spatial pattern analysis. For. Ecol. Manag. 2018, 429, 226–232. [Google Scholar] [CrossRef]
- Wang, Y.; Chen, J.; Zhang, L.; Feng, L.; Yan, L.; Li, F.; Zhao, X.; Yu, L.; Liu, N. Relationship between diversity and stability of a karst plant community. Ecol. Evol. 2022, 12, e9254. [Google Scholar] [CrossRef]
- Wang, X.T.; Hou, Y.L.; Liang, C.Z.; Wang, W.; Liu, F. Point pattern analysis based on different null models for detecting spatial patterns. Biodivers. Sci. 2012, 20, 151–158. [Google Scholar]
- Jiao, J.; Wu, C.; Jiang, B.; Wang, Z.; Yuan, W.; Zhu, J.; Li, T.; Yang, S.; Yao, L. Negative Density Restricts the Coexistence and Spatial Distribution of Dominant Species in Subtropical Evergreen Broad-Leaved Forests in China. Forests 2022, 13, 1227. [Google Scholar] [CrossRef]
- Shi, W.; Wang, Y.Q.; Xiang, W.S.; Li, X.K.; Cao, K.F. Environmental filtering and dispersal limitation jointly shaped the taxonomic and phylogenetic beta diversity of natural forests in southern China. Ecol. Evol. 2021, 11, 8783–8794. [Google Scholar] [CrossRef]
- Wu, H.; Lei, J.; Li, X.; Wang, H.; Duan, A.; Zhang, J. Aggregation distributions across stand age in provenances of Cunninghamia lanceolata (Lamb.) Hook. For. Ecol. Manag. 2021, 494, 119317. [Google Scholar] [CrossRef]
- Yusup, A.; Halik, Ü.; Abliz, A.; Aishan, T.; Keyimu, M.; Wei, J. Population Structure and Spatial Distribution Pattern of Populus euphratica Riparian Forest under Environmental Heterogeneity along the Tarim River, Northwest China. Front. Plant Sci. 2022, 13, 844819. [Google Scholar] [CrossRef]
- Wiegand, T.; Gunatilleke, S.; Gunatilleke, N.; Okuda, T. Analyzing the Spatial Structure of a Sri Lankan Tree Species with Multiple Scales of Clustering. Ecology 2007, 88, 3088–3102. [Google Scholar] [CrossRef]
- Bland, M.; Baldocchi, D.D. Vertical structure heterogeneity in broadleaf forests: Effects on light interception and canopy photosynthesis. Agric. For. Meteorol. 2021, 307, 108525. [Google Scholar] [CrossRef]
- Song, Y.; Yan, G.; Zhang, G. Light Competition Contributes to the Death of Masson Pines of Coniferous-Broadleaf Mixed Forests in Subtropical China. Forests 2022, 13, 85. [Google Scholar] [CrossRef]
- Dodonov, P.; Harper, K.A. Spatial patterns of structural diversity across the boreal forest-tundra ecotone in Churchill, Canada. Acta Oecologica 2022, 117, 103862. [Google Scholar] [CrossRef]
Figure 1.
Age structure of Alsophila spinulosa populations in Chishui.

Figure 2.
Numbers of A. spinulosa individuals. The abbreviations BFB (bamboo forest belt), MF (a mixed forest of bamboo and arbor), ET (ecological transitional zone of community), and EF (evergreen broad-leaved forest) are defined in Table 1. Different lowercase letters indicated significant differences in the number of A. spinulosa among different communities.

Figure 3.
Structural features of A. spinulosa populations. The abbreviations BFB (bamboo forest belt), MF (a mixed forest of bamboo and arbor), ET (ecological transitional zone of community), and EF (evergreen broad-leaved forest) are defined in Table 1. * means p < 0.05, ** means p < 0.01 and *** means p < 0.001.

Figure 4.
Spatial distribution of A. spinulosa populations based on the CSR (complete spatial randomness) null model. In the figure, g(r) represents the degree of aggregation, and r(m) represents the spatial scale. The gray range is the coverage of the upper and lower limits of the envelope, the red dotted line is the theoretical value, and the black solid line represents the actual value. (a–d) show the spatial distributions of young, middle-aged, adult, and all A. spinulosa, respectively.

Figure 5.
Spatial distribution of A. spinulosa populations based on the HP (heterogeneous Poisson process) null model. In the figure, g(r) represents the degree of aggregation, and r(m) represents the spatial scale. The gray range is the coverage of the upper and lower limits of the envelope, the red dotted line is the theoretical value, and the black solid line represents the actual value. (a–d) show the spatial distributions of young, middle-aged, adult, and all A. spinulosa, respectively.

Figure 6.
Interspecific associations of A. spinulosa populations. In the figure, g(r) represents the degree of aggregation and r(m) represents the spatial scale. The gray range is the coverage of the upper and lower limits of the envelope, the red dotted line is the theoretical value, and the black solid line represents the actual value. (a) Spatial associations of young and middle-aged individuals of A. spinulosa. (b) Spatial associations of middle-aged and adult individuals of A. spinulosa. (c) Spatial associations of young and adult individuals of A. spinulosa.

Figure 7.
Spatial correlation between different community canopies and A. spinulosa populations. Point pattern analysis revealed that the community canopies were positively correlated with A. spinulosa populations. a, b, c, and d show the spatial correlations between all, young, middle-aged, and adult A. spinulosa and the secondary layer of the community canopies, respectively. e, f, g, and h show the spatial correlations between all, young, middle-aged, and adult A. spinulosa and the upper layer of the community canopies, respectively.


Table 1.
Sample belt basic information table.
| Transect | Slope Position | Altitude/m | Slope | Stand Density/(Plant/m2) | Alsophila spinulosa Density/(Plant/m2) | Community Height/m | Number of Species | Dominant Species |
|---|---|---|---|---|---|---|---|---|
| BFB | Downhill position | 526 | 16.32 | 0.432857 | 0.054286 | 7.91 ± 5.45 | 34 | Phyllostachys heterocycla, Brassaiopsis glomerulata, A. spinulosa, Bridelia tomentosa, Ficus virens |
| MF | Downhill position | 526 | 16.84 | 0.548929 | 0.047857 | 6.99 ± 5.23 | 49 | Phyllostachys heterocycla, Brassaiopsis glomerulata, Bridelia tomentosa, A. spinulosa, Ficus virens |
| ET | Medium position | 551 | 41.99 | 0.564286 | 0.035714 | 7.00 ± 4.88 | 37 | Phyllostachys heterocycla, Phyllostachys heterocycla, Brassaiopsis glomerulata, Maesa japonica, A. spinulosa |
| EF | Medium position | 551 | 44.76 | 0.4325 | 0.010357 | 4.08 ± 3.41 | 37 | Mallotus philippensis, Maesa japonica, Cinnamomum glanduliferum, Diplospora dubia, Phyllostachys heterocycla |
Table 2.
Spatial correlation between Alsophila spinulosa populations and dominant plants in the community.
Table 2.
Spatial correlation between Alsophila spinulosa populations and dominant plants in the community.
| Species | Significant Values | Highly/m | Associations |
|---|---|---|---|
| Phyllostachys edulis | 33.05 | 12.09 ± 2.20 | (+) |
| Maesa japonica | 8.28 | 3.27 ± 2.04 | (+) |
| Bridelia retusa | 5.59 | 3.90 ± 2.56 | (+) |
| Brassaiopsis glomerulata | 5.20 | 3.00 ± 1.37 | (+) |
| Ficus virens | 3.53 | 4.56 ± 2.19 | (+) |
| Diplospora dubia | 3.01 | 3.04 ± 1.71 | 0~8 m scale (0), under the rest of the scale (+) |
| Symplocos cochinchinensis | 2.94 | 4.72 ± 3.93 | (+) |
| Mallotus philippensis | 2.68 | 3.08 ± 1.95 | 0~21 m scale (−), under the rest of the scale (0) |
| Mallotus barbatus | 2.36 | 3.89 ± 1.78 | (+) |
| Dichroa febrifuga | 2.28 | 2.06 ± 1.09 | (+) |
| Eurya kueichowensis | 2.24 | 3.04 ± 2.01 | (+) |
| Musa basjoo | 2.02 | 4.29 ± 2.72 | 0~26 m scale (+), under the rest of the scale (0) |
| Toxicodendron sylvestre | 1.95 | 4.88 ± 3.57 | (+) |
| Cinnamomum glanduliferum | 1.86 | 3.28 ± 1.62 | (+) |
| Eurya nitida | 1.62 | 3.36 ± 1.90 | 0~24 m scale (−), under the rest of the scale (0) |
| Debregeasia orientalis | 1.46 | 1.70 ± 0.46 | (+) |
| Lasianthus chinensis | 1.02 | 1.61 ± 0.20 | 4.5~8 m scale (−), 24~29 m scale (+), under the rest of the scale (0) |
Note: (+) indicates a positive correlation, (−) indicates a negative correlation, and (0) indicates no correlation.
Disclaimer/Publisher’s Note: The statements, opinions and data contained in all publications are solely those of the individual author(s) and contributor(s) and not of MDPI and/or the editor(s). MDPI and/or the editor(s) disclaim responsibility for any injury to people or property resulting from any ideas, methods, instructions or products referred to in the content. |
© 2023 by the authors. Licensee MDPI, Basel, Switzerland. This article is an open access article distributed under the terms and conditions of the Creative Commons Attribution (CC BY) license (https://creativecommons.org/licenses/by/4.0/).
Share and Cite
MDPI and ACS Style
Yuan, D.; Yang, M.; Yu, L.; An, M.; He, Q.; Mu, J.; Yan, L. Population Structure, Distribution, and Spatial Characteristics of Alsophila spinulosa in Chishui, China. Diversity 2023, 15, 1200. https://doi.org/10.3390/d15121200
AMA Style
Yuan D, Yang M, Yu L, An M, He Q, Mu J, Yan L. Population Structure, Distribution, and Spatial Characteristics of Alsophila spinulosa in Chishui, China. Diversity. 2023; 15(12):1200. https://doi.org/10.3390/d15121200
Chicago/Turabian StyleYuan, Dongmei, Man Yang, Lifei Yu, Mingtai An, Qinqin He, Jun Mu, and Lingbin Yan. 2023. "Population Structure, Distribution, and Spatial Characteristics of Alsophila spinulosa in Chishui, China" Diversity 15, no. 12: 1200. https://doi.org/10.3390/d15121200
Note that from the first issue of 2016, this journal uses article numbers instead of page numbers. See further details here.