Article

Molecular Taxonomy of South Africa’s Catsharks: How Far Have We Come?

by
Michaela van Staden
1,*,
David A. Ebert
2,3,4,
Enrico Gennari
3,5,6,
Rob W. Leslie
6,7,
Meaghen E. McCord
8,9,
Matthew Parkinson
3,6,
Ralph G. A. Watson
6,10,
Sabine Wintner
11,12,
Charlene da Silva
13 and
Aletta E. Bester-van der Merwe
1,*
1
Department of Genetics, Stellenbosch University, Cape Town 7602, South Africa
2
Pacific Shark Research Center, Moss Landing Marine Laboratories, Moss Landing, CA 95039, USA
3
South African Institute for Aquatic Biodiversity, Makhanda 6140, South Africa
4
Department of Ichthyology, California Academy of Sciences, San Francisco, CA 94118, USA
5
Oceans Research Institute, Mossel Bay 6500, South Africa
6
Department of Ichthyology and Fisheries Science, Rhodes University, Makhanda 6140, South Africa
7
Marine Research Institute, University of Cape Town, Cape Town 7700, South Africa
8
South African Shark Conservancy, Hermanus 7200, South Africa
9
Canadian Parks and Wilderness Society, Vancouver, BC V6A 2T2, Canada
10
Dyer Island Conservation Trust, Gansbaai 7220, South Africa
11
KwaZulu-Natal Sharks Board, Durban 4320, South Africa
12
School of Life Sciences, University of KwaZulu-Natal, Durban 4000, South Africa
13
Department of Environment, Forestry and Fisheries, Cape Town 8012, South Africa
*
Authors to whom correspondence should be addressed.
Diversity 2023, 15(7), 828; https://doi.org/10.3390/d15070828
Submission received: 6 June 2023 / Revised: 27 June 2023 / Accepted: 28 June 2023 / Published: 1 July 2023

Abstract

:
The ability to correctly identify specimens at the species level is crucial for assessing and conserving biodiversity. Despite this, species-specific data are lacking for many of South Africa’s catsharks due to a high level of morphological stasis. As comprehensive and curated DNA reference libraries are required for the reliable identification of specimens from morphologically similar species, this study reviewed and contributed to the availability of cytochrome c oxidase subunit I (COI) and nicotinamide adenine dehydrogenase subunit 2 (NADH2) sequences for South Africa’s catsharks. A molecular taxonomic approach, implementing species delimitation and specimen assignment methods, was used to assess and highlight any taxonomic uncertainties and/or errors in public databases. The investigated species were summarised into 47 molecular operational taxonomic units (MOTUs), with some conflicting specimen assignments. Two Apristurus specimens sampled in this study remained unidentified, revealing the presence of previously undocumented genetic diversity. In contrast, haplotype sharing within Haploblepharus—attributed to nucleotide ambiguities—resulted in the delimitation of three congeners into a single MOTU. This study reveals that molecular taxonomy has the potential to flag undocumented species and/or misidentified specimens, and further highlights the need to implement integrated taxonomic assessments on catsharks that represent an irreplaceable component of biodiversity in the region.

1. Introduction

Catsharks are relatively small-bodied, demersal species that are globally distributed and typically found on continental shelves and slopes in tropical to cool temperate waters [1,2]. Catsharks represent the largest group of living sharks, comprising 18 genera and 165 species—many of which were described over the last two decades [1,2,3]. While the classification of catsharks within the order Carcharhiniformes is well defined [4,5], the arrangement and scope of the family has historically been complex [4,6]. Since phylogenetic inferences differ depending on the dataset analysed (i.e., morphology or DNA), phylogenetic relationships among catsharks remain uncertain [7]. However, Atelomycteridae (3 genera and 13 species), Pentanchidae (12 genera and 115 species), and Scyliorhinidae (3 genera and 37 species) are currently recognised as valid families [3,7].
The South African coastline has been appraised as a biodiversity hotspot for chondrichthyan species (sharks, skates, rays, and chimaeras) using three measures of species richness: the total number of species, evolutionarily distinct species, and endemic species [8,9]. The region was also highlighted as a priority area for the expansion of conservation measures, especially for threatened endemics [8,10]. Endemic species are of particular concern as the threat status of these species is exacerbated by a high habitat specificity and restricted geographic range [11]. South African waters are inhabited by a high number of catshark species (a large proportion of which are endemic or near-endemic), with Pentanchidae ranking as the second most speciose shark family in the region [12]. Although not targeted, species-specific data are required as catsharks are reported as incidental catch by several fisheries [13]. Additionally, range shifts and reductions in the area of occupancy—possibly linked to climate change and habitat degradation, respectively—have been suspected for a number of catshark species [14].
Following the recent global reassessment of the conservation status of chondrichthyan species [15], 7 of the 16 catsharks occurring in South African waters were categorised as threatened by the International Union for the Conservation of Nature’s (IUCN) Red List of Threatened Species (Table S1) [14]. Despite this, many of South Africa’s catsharks remain understudied, which is concerning as unresolved taxonomic issues still exist within the group. For example, the genus Apristurus comprises two locally described species (A. microps and A. saldanha); however, a taxonomic revision is currently in progress as an additional two or three unconfirmed species may be present [12]. Substantial taxonomic uncertainty also exists within the morphologically conserved genus Haploblepharus, which currently comprises four recognised species: H. edwardsii, H. fuscus, H. kistnasamyi, and H. pictus [12,16]. Prior to its description, H. kistnasamyi was thought to be a regional colour variant of H. edwardsii [6]. Although described as morphologically distinct [17], Human [18] reported that only 38.5% of H. kistnasamyi specimens could be correctly classified into their observed species group based on a comprehensive set of morphometric measurements. The requirement of a further detailed morphological and genetic study was suggested to fully delineate H. kistnasamyi from its congeners [12,16,18]. The possible occurrence of hybridisation among congeners, mentioned in morphological [16,18] and molecular studies [19], further confounds specimen identification issues within Haploblepharus.
Since poorly defined species boundaries result in unreliable abundance estimates, distribution ranges, and fishery catch data [20], the first step towards biodiversity monitoring and effective conservation is the accurate identification of specimens [21]. However, with limited access to taxonomic expertise or the ability to examine diagnostic traits (e.g., morphometrics), it has become apparent that in-field identification for some species remains problematic [13,22]. In elasmobranchs (sharks, skates, and rays), specimen misidentification is frequently reported due to difficulties in unambiguously identifying congeneric species as a result of highly similar—sometimes overlapping—morphological traits [16,23,24,25]. Morphology-based identification methods are further compromised when examining specimens at different life stages or when species display phenotypic plasticity [16,26]. In recent years, the use of DNA sequence-based methods (e.g., DNA barcoding) has been adopted to speed up the accurate documentation of biodiversity [27,28].
DNA barcoding assists with specimen identification and species discovery through the use of a standardised gene region, namely, the mitochondrial cytochrome c oxidase subunit I (COI) gene [29,30]. From an analytical perspective, DNA barcoding relies on the observation that between-species variation exceeds within-species variation—with researchers generally implementing the use of a 2% threshold for interspecific divergence [29,31]. However, elasmobranchs have previously been shown to have relatively low evolutionary rates [32,33], with some shark and ray genera displaying intrageneric genetic distances of approximately 1% [26,34,35]. The use of the fast-evolving nicotinamide adenine dehydrogenase subunit 2 (NADH2) gene was therefore recommended for elasmobranchs as it allows for the discrimination of closely related species, cryptic species, species complexes as well as geographical variants [36,37,38,39,40]. Although DNA-based methods were originally proposed for the assignment of unidentified specimens to known species [29], cryptic diversity and conflicting taxonomic hypotheses led to the development of several species delimitation methods [41,42,43].
Delimitation analyses have increasingly been applied to ascertain the number of species-level entities present within a given dataset [44], while specimen assignment methods are used to assign a query sequence from an unidentified specimen to a known species [45]. However, reliable specimen identification is ultimately limited to the accuracy of existing knowledge available on open-access databases such as the Barcode of Life Data System (BOLD) [46] or GenBank® [47]. Recent studies have suggested that the use of a molecular taxonomic approach, implementing both species delimitation and specimen assignment methods, has proven beneficial for the maintenance and validation of DNA reference libraries [48,49,50,51]—especially for taxonomically difficult lineages [52,53]. As such, the aim of the current study was to review and contribute to the availability of COI and NADH2 sequences for South Africa’s catsharks, comprising eight genera across two families. A combination of species delimitation and specimen assignment approaches were subsequently used to identify and critically discuss errors occurring in public databases which may compromise effective conservation and management of the investigated taxa.

2. Materials and Methods

2.1. Sample Collection

A total of 56 samples were collected along the South African coastline from a variety of catshark species. Specimens were caught using rod and reel fishing gear, by hand during snorkel surveys, or collected during research trawl surveys. Following capture, specimens were identified using external morphology and colour patterns according to guidelines described in Compagno et al. [54]. When possible, digital images and the sex of each individual were recorded. Specimens were measured on a fish measuring mat at capture site, and sharks larger than 40 centimetres (cm) in total length (TL) were tagged with an Oceanographic Research Institute (ORI) dart tag [55]. Approximately 1 cm2 of tissue sample was taken from the trailing edge of a dorsal fin and stored in 90% ethanol at room temperature. Specimen and collection data, in addition to the digital images, were uploaded to the “South Africa’s catsharks” project (Project Code: MBBSC), accessible through BOLD.

2.2. DNA Extraction, Amplification, and Sequencing

Genomic DNA was isolated using a cetyltrimethylammonium bromide (CTAB) extraction protocol [56]. The quantity and quality of extracted DNA were assessed using a NanoDrop ND 2000 spectrophotometer (Thermo Fisher Scientific, Waltham, MA, USA). Two mitochondrial genes (COI and NADH2) were amplified for 1 to 13 individuals per species.
The 5′ region of the COI gene was amplified using various combinations of universal primers: FishF1 and FishR1, FishF2 and FishR2, or VF2_t1 and FR1d_t1 [57,58]. Polymerase chain reaction (PCR) was carried out in 15 μL reaction volumes containing 1X PCR buffer, 2.5 mM MgCl2, 200 μM of deoxynucleotide triphosphates (dNTPs), 0.1 μM of each primer, 0.625 U of GoTaq® DNA polymerase (Promega, Madison, WI, USA), and ~50 ng of template DNA. The following thermocycling conditions were used: 95 °C for 2 min followed by 35 cycles of 94 °C for 30 s, optimised annealing temperature (57 °C for Fish1, 53 °C for Fish2, and 54 °C for the M13-tailed primers) for 30 s, 72 °C for 1 min, and a final elongation step at 72 °C for 10 min.
An ~1044 base pair (bp) fragment from the NADH2 gene was amplified using the Ilem-Mustelus and Asn-Mustelus primers [59]. The 15 μL reaction volume consisted of 1X PCR buffer, 2 mM MgCl2, 200 μM of dNTPs, 0.5 μM of each primer, 0.5 U of GoTaq® DNA polymerase (Promega, Madison, WI, USA), and ~50 ng of template DNA. Thermocycling conditions consisted of the following: 94 °C for 2 min, followed by 35 cycles of 94 °C for 30 s, 54 °C for 30 s, 72 °C for 90 s, and a final elongation step at 72 °C for 10 min.
Amplicons were purified using SigmaPrep spin columns (Sigma-Aldrich®, St. Louis, MO, USA) following the manufacturer’s protocol. Sanger sequencing was performed using the BigDye Terminator v3.1 Cycle Sequencing Kit (Applied Biosystems, Waltham, MA, USA) by the Central Analytical Facility (CAF) at Stellenbosch University. Sequences were quality checked and manually edited, when required, in Geneious Prime® v2022.1.1 (https://www.geneious.com (accessed on 13 December 2022)). Trace files, primer details, and sequence data were uploaded to BOLD and subsequently deposited on GenBank® (Table S2).

2.3. Genetic Data Analyses

To obtain a representative dataset of catsharks that occur in South African waters, COI and NADH2 sequences attributed to the species listed in Table S1 were retrieved from open-access databases. To build a more comprehensive dataset for each identified genus, a Basic Local Alignment Search Tool (BLAST; https://blast.ncbi.nlm.nih.gov/Blast.cgi (accessed on 12 January 2023)) analysis was conducted against the GenBank® database to identify congeneric species with >95% similarity. Subsequent analyses were carried out on four separate datasets, one dataset per gene (COI and NADH2) for each of the two catshark families (Table S2).
Sequences were aligned using the MAFFT v7.450 [60] algorithm as implemented in Geneious Prime® and subsequently trimmed to ensure equal length. Sequences shorter than the trimmed alignment lengths were excluded from downstream analyses. Previously published sequences included in this study are listed in Table S2.
Genetic distances were calculated in MEGA v11.0.11 [61] using the p-distance model [62], with the pairwise deletion option for the treatment of gaps and missing data. The presence of a ‘barcode gap’—a disjunction between the levels of intraspecific and interspecific genetic distances—was assessed by plotting the maximum intraspecific p-distance against the nearest neighbour (NN; i.e., the closest congeneric) distance for each individual in the dataset [63].

2.4. Species Delimitation Analyses

Species identified based on morphological characters are referred to as species, while species delimited using DNA sequence data are referred to as Molecular Operational Taxonomic Units (MOTUs) [64,65]. In the present study, the number of MOTUs was inferred using five different algorithms: (a) Refined Single Linkage (RESL) as implemented on BOLD [43], (b) Automatic Barcode Gap Discovery (ABGD) [42], (c) Assemble Species by Automatic Partitioning (ASAP) [66], (d) Bayesian implementation of the Poisson Tree Processes (PTP) method (bPTP) [67], and (e) PTP in its multi-rate version (mPTP) [68]. The delimited MOTUs were considered ‘concordant’ when comprising sequences attributed to the same species and ‘discordant’ when comprising sequences from different species. Consensus MOTUs were assigned based on the number of species delimitation methods that supported any given MOTU. To compare the distributions of genetic variation between species and consensus MOTUs, intra- and inter-MOTU p-distances were estimated in MEGA following the aforementioned methodology.
The three distance-based delimitation methods (RESL, ABGD, and ASAP) were conducted using DNA sequence alignments. Barcode Index Numbers (BINs) were automatically assigned to sequences deposited on BOLD using the RESL algorithm. The ABGD (https://bioinfo.mnhn.fr/abi/public/abgd/abgdweb.html (accessed on 28 January 2023)) and ASAP (https://bioinfo.mnhn.fr/abi/public/asap/asapweb.html (accessed on 5 February 2023)) delimitation methods were implemented on the relevant web servers using default settings under the uncorrected pairwise distance model, with a relative gap width (X) of 1.0 for the ABGD method.
The two tree-based delimitation methods (bPTP and mPTP) were performed based on a maximum likelihood (ML) tree. Prior to analysis, datasets were adjusted to retain haplotypes for each species as identified using DnaSP v6.12 [69]. Sequences from Poroderma africanum and Holohalaelurus regani were used as outgroups for the Pentanchidae and Scyliorhinidae datasets, respectively. The ML analyses were performed on the PhyML v3.0 web server (http://www.atgc-montpellier.fr/phyml/ (accessed on 13 February 2023)) [70] with default settings. The best substitution model was determined based on the Akaike Information Criterion (AIC) using the Smart Model Selection [71] software as implemented online.

2.5. Specimen Assignment Analyses

The reliability of the datasets and the accuracy of specimen assignments were estimated using the distance-based ‘best close match analysis’ (BCMA) [72] in the R package Spider v1.5.0 [41]. The theshOpt() function was used to identify the optimal threshold value for each dataset [73]. Considering the concerns associated with the use of distance measures to infer specimen identity [74], an additional three specimen assignment methods implemented in the R package BarcodingR v1.0.3 [75] were used: (a) the back-propagation neural networks method (BP) [74], (b) the fuzzy-set based approach (FZ) [45], and (c) the alignment-free kmer-based approach (FZKMER) [76]. To perform the specimen assignments, reference libraries were constructed using a single representative that was randomly selected for each species. A consensus assignment was considered to emerge if at least two of the three methods were converging.

3. Results

A total of 95 sequences (52 COI and 43 NADH2) were generated from 56 specimens in this study. Specimens were distributed as follows: Western Cape (n = 33), Eastern Cape (n = 7), and KwaZulu-Natal (n = 16). The newly sequenced specimens were spread across 2 families, 6 genera, and 10 species, contributing ex novo sequences for 5 species. All sequences were in excess of 600 bp in length, with no insertions, deletions, or premature stop codons observed. This suggests that no nuclear mitochondrial DNA segments (NUMTs) were amplified [77], even though nucleotide ambiguities were identified in the COI and NADH2 sequences of two Haploblepharus species (Figure 1). To address concerns surrounding cross-contamination, the laboratory protocol was repeated from DNA extraction to sequence analysis—resulting in the detection of the same nucleotide ambiguities. The integration of sequences generated in this study to those on open-access databases resulted in 16 species with COI barcodes and 13 species with NADH2 sequences.

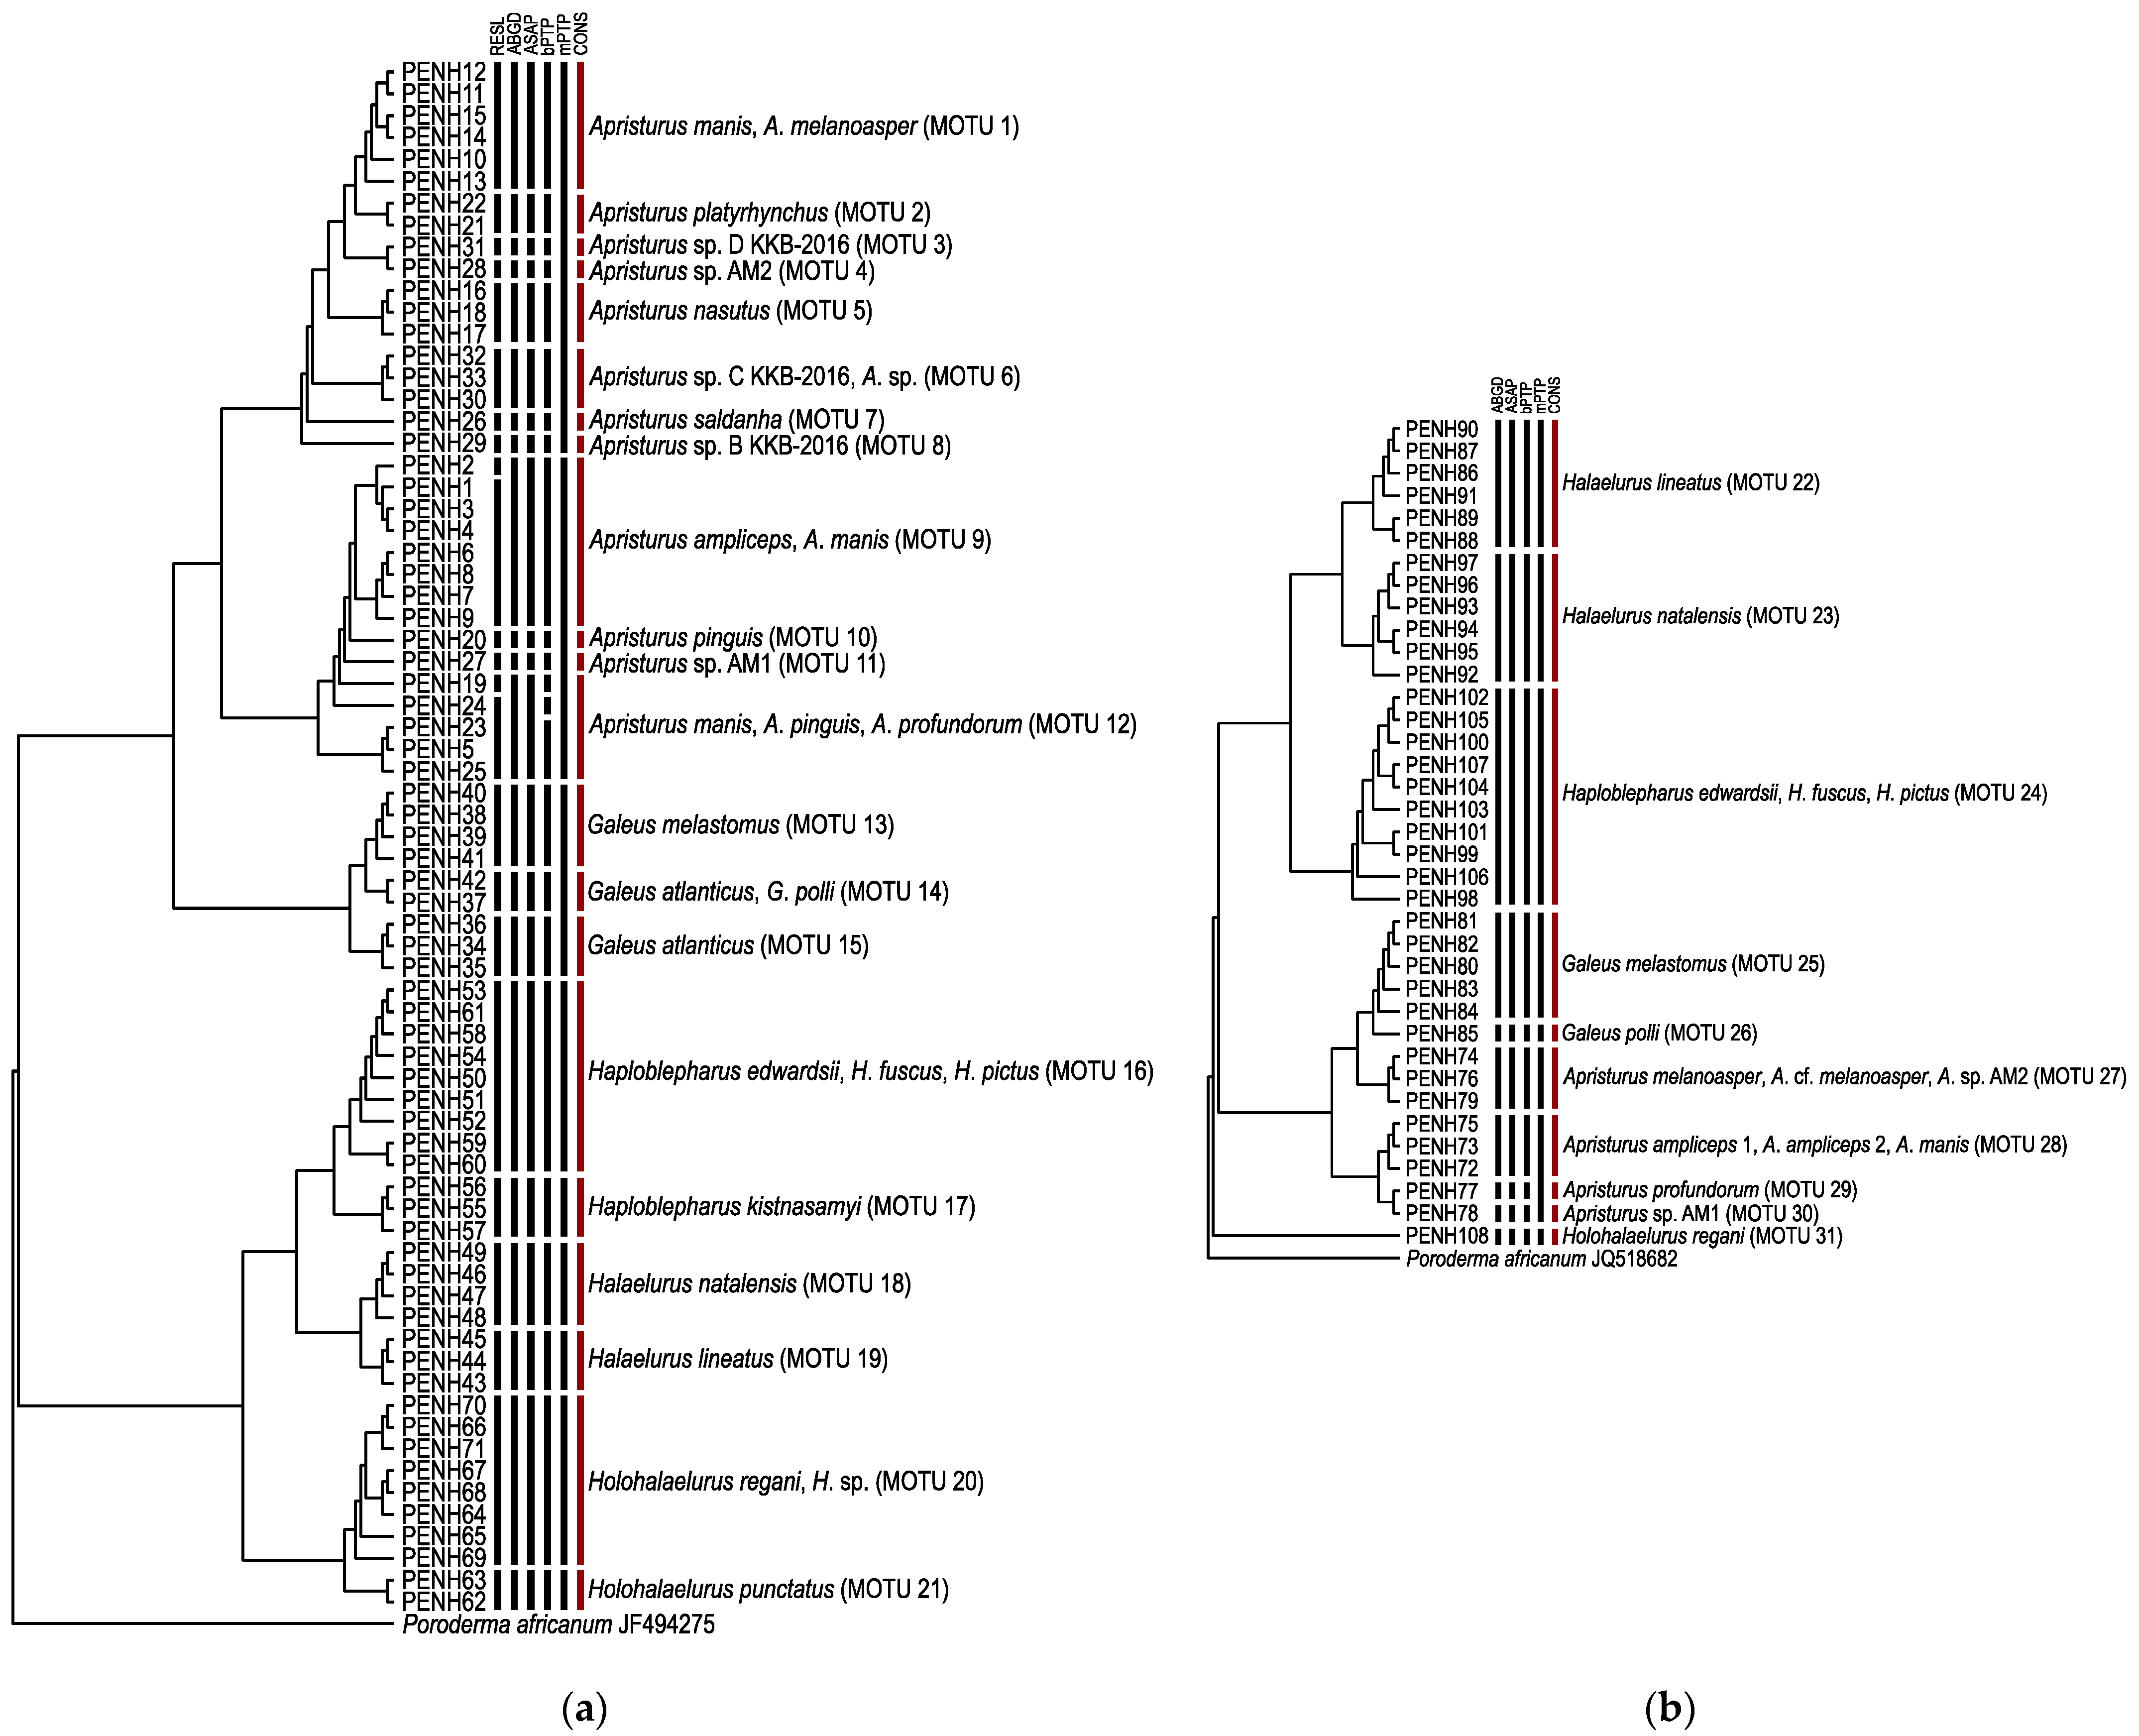
3.1. Species Delimitation and Specimen Assignment Analyses within the Family Pentanchidae

The final alignment of the COI and NADH2 datasets included 241 sequences (598 bp in length) from 27 species and 49 sequences (816 bp in length) from 16 species, respectively. Species delimitation analyses resulted in a consensus of 21 MOTUs for the COI dataset, with the number of delimited MOTUs varying depending on the method used (23 using RESL and bPTP, 21 using ABGD and ASAP, and 9 using mPTP) (Figure 2a). Three methods (ABGD, ASAP, and bPTP) supported a consensus of 10 MOTUs for the NADH2 dataset, while only 8 MOTUs were delimited using the mPTP method (Figure 2b).
Based on the COI dataset, eight species (Apristurus manis, A. pinguis, Galeus atlanticus, Haploblepharus edwardsii, H. fuscus, H. pictus, Holohalaelurus regani, and Holohalaelurus sp.) displayed lower NN distances than maximum intraspecific distances (Figure 3a). In comparison to sequences grouped by species, consensus MOTUs showed a decrease in maximum intraspecific distances (15.89% to 2.68%) and an increase in minimum NN distances (0.00 to 1.84%) (Table S3). This resulted in a reduction in the number of lineages lacking a ‘barcode gap’, as only two lineages (MOTU 9 and MOTU 12) displayed lower NN distances than maximum intraspecific distances (Figure 3a). For the NADH2 dataset—even though an increase in both maximum intraspecific distances (1.01 to 2.57%) and minimum NN distances (0.00 to 3.57%) was observed for the consensus MOTUs in comparison to the sequences grouped by species (Table S3)—the number of lineages lacking a ‘barcode gap’ decreased (Figure 3b).
Discrepancies between the estimated number of MOTUs and the reported number of species were largely due to MOTUs comprising haplotypes assigned to more than one species. In some cases, this discrepancy was caused by the attribution of sequences to provisional names (MOTU 6—Apristurus sp. C and A. sp.; MOTU 20—Holohalaelurus regani and H. sp.). While in other cases, discordant MOTUs included specimens with conflicting identifications in the public databases and/or species that were indistinguishable by the delimitation methods (MOTU 1—Apristurus manis and A. melanoasper; MOTU 9 and MOTU 28—Apristurus ampliceps and A. manis; MOTU 12—Apristurus manis, A. pinguis, and A. profundorum; MOTU 14—Galeus atlanticus and G. polli; MOTU 16 and 24—Haploblepharus edwardsii, H. fuscus and H. pictus; and MOTU 27—Apristurus melanoasper and A. sp. AM2). Finally, specimens reported as Apristurus manis were split among three MOTUs (MOTU 1, 9, and 12), while Apristurus pinguis (MOTU 10 and 12) and Galeus atlanticus (MOTU 14 and 15) were split into two MOTUs per species.
The BCMA conducted on the COI and NADH2 datasets, using an optimised threshold of 1.0%, revealed that 79.0% of specimens were correctly assigned to their reported species, while 4.8% of specimens remained unidentified (Table S4). Specimen assignment errors amounted to 16.2% and mostly concerned species within the genera Apristurus (9.3%) and Haploblepharus (5.5%). The reliability of the two datasets for specimen assignment was 89.8% based on the BP and FZ methods, and 85.2% using the FZKMER approach. Probabilities associated with each specimen assignment varied among the three methods (Table S5). It is important to note that despite differences among the methods, a consensus emerged for all analysed specimens, with the three methods converging in 91% of the cases.

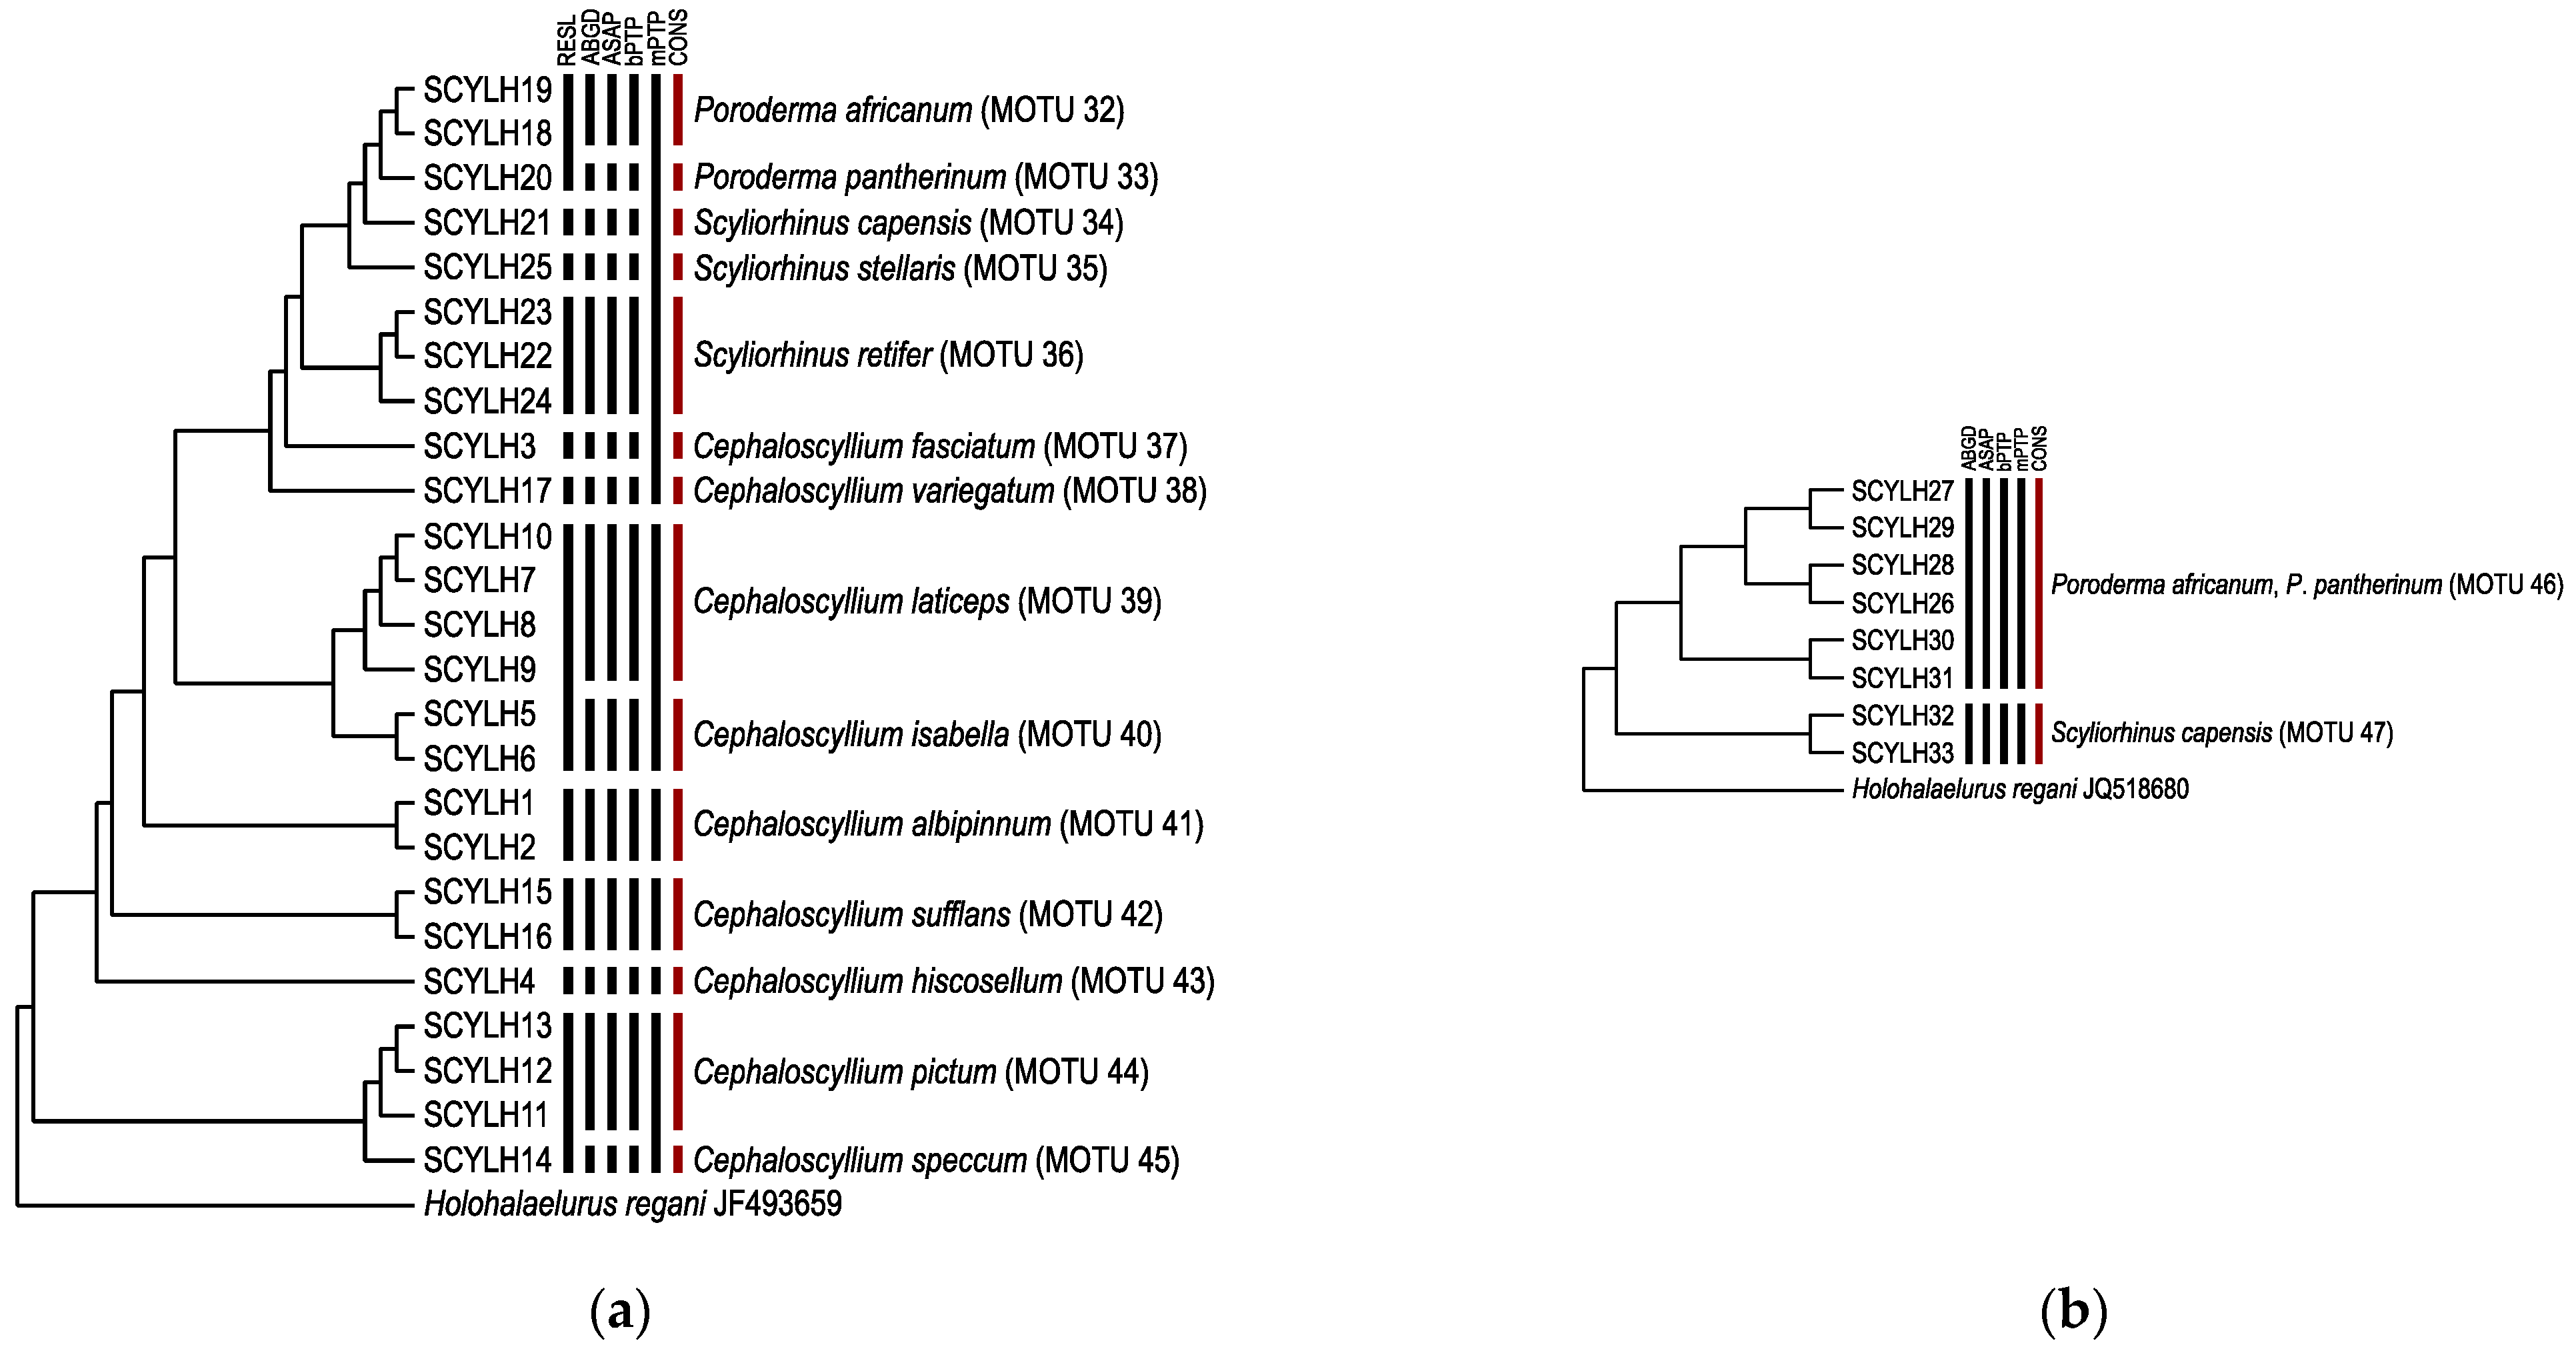
3.2. Species Delimitation and Specimen Assignment Analyses within the Family Scyliorhinidae

The final alignment of the COI and NADH2 datasets included 64 sequences (637 bp in length) from 14 species and 15 sequences (887 bp in length) from 3 species, respectively. For the COI dataset, the number of delimited MOTUs varied depending on the species delimitation method used: 11 using RESL, 14 using ABGD, ASAP, and bPTP, and 6 using mPTP (Figure 4a). A consensus number of 14 MOTUs was obtained from the five methods, which was congruent with the reported number of species. Conversely, four methods (ABGD, ASAP, bPTP, and mPTP) were unable to delimit the Poroderma species pair based on the NADH2 dataset, resulting in a consensus of two MOTUs (Figure 4b).
Maximum intraspecific distances ranged from 0.00 to 0.63% in the COI dataset, while the lowest NN distance (0.60%) was found in the NADH2 dataset between Poroderma africanum and P. pantherinum (Table S3). Nearest neighbour distances below one percent were observed between the Poroderma species pair in both datasets; however, maximum intraspecific distances were always lower than the distance to the NN, indicating the presence of a ‘barcode gap’ (Figure 3c,d).
The BCMA conducted on the COI and NADH2 datasets, using an optimised threshold of 0.4% and 1.0%, respectively, showed that 94.9% of specimens were correctly recognised to their reported species, while 5.1% of specimens remained unidentified (Table S4). Specimen identification efficacy was 100% using the BP and FZ methods, and 87.9% using the FZKMER approach. Probabilities associated with each specimen assignment varied among the three methods (Table S5). Despite differences among the methods, a consensus emerged for all analysed specimens.

4. Discussion

With limited access to taxonomic expertise, molecular taxonomy has gained recognition as an effective tool for resolving discrepancies in species boundaries [51,52]. In previous cases of ambiguous morphological classifications, molecular taxonomy has been used to aid in the description of new species [34,39,40,78,79] as well as the resurrection of synonymised species [36,38,80,81]. As comprehensive and curated DNA reference libraries are required to accurately assign unidentified specimens to known species, one of the main limitations to molecular taxonomy is the presence of taxonomic misidentifications in public databases [22,48,49]. In the current study, both species delimitation and specimen assignment approaches were used to investigate the reliability of publicly available data for South Africa’s catshark species.
Despite low mutation rates exhibited by the COI gene in chondrichthyans [32], DNA barcoding has proven efficient for specimen identification in the majority of elasmobranchs assessed [26,34,51,82]. Similarly, in the current study, the effectiveness of DNA barcoding was demonstrated in the species delimitation analyses as 85% (represented by 35 MOTUs) of the 41 assessed species were recovered. After reviewing the delimited MOTUs, the number of species investigated was found to be artificially inflated by the use of provisional names. Specimen assignment methods resolved uncertainties for two discordant MOTUs (Apristurus ampliceps/A. manis and A. pinguis/A. profundorum) and supported the erroneous delimitations of specimens reported as Apristurus manis, A. pinguis, and Galeus atlanticus. This highlights the urgent need to verify the taxonomic identifications of specimens in public databases, as misidentifications can bias data analyses and the interpretations thereof. For example, Apristurus melanoasper was originally described from the North Atlantic Ocean [78] and subsequently identified in the western South Pacific, Indian, and eastern South Atlantic Oceans—representing the largest known geographical distribution for a catshark species [83]. However, Naylor et al. [36] suggested that a detailed taxonomic revision is required as North Atlantic Ocean specimens clustered separately to specimens from Australia and New Zealand based on a NADH2 dataset. In this study, the presence of A. melanoasper in the eastern South Atlantic Ocean is supported as two specimens sampled in Namibia and reported as A. manis (HVDBF463-11 and HVDBF464-11) were reclassified as A. melanoasper—with one sequence identical to that of the North Atlantic Ocean specimens. Furthermore, a specimen reported as Galeus atlanticus (UKFBK223-08) caught in the southern Algarve of Portugal was reclassified as G. polli based on both species delimitation and specimen assignment analyses. This suggests that the distribution range of G. polli requires further investigation as G. polli is currently described as occurring in the Eastern Atlantic Ocean, from southern Morocco to the Northern Cape of South Africa [84].
In contrast to earlier research that recommended the use of the NADH2 gene for the discrimination of closely related elasmobranch species [36], only 63% of the 19 investigated species could be delimited. However, the reduced performance of the species delimitation methods in the NADH2 datasets is likely due to intrinsic limitations of the methods as delimitation analyses are known to be influenced by a low number of individuals sampled per species (e.g., one sequence per nominal species within Apristurus) [85]. Additionally, delimitation analyses perform poorly when the contrast between intra- and interspecific variation is moderate (e.g., Poroderma africanum and P. pantherinum) [44,65,66,67,68,85]. Even though the two Poroderma species can be readily identified based on morphological and meristic characters [86], previous studies have reported interspecific distances that are below commonly used species divergence thresholds [26,36]. Despite this, reliable specimen identification was obtained in this study as interspecific variation exceeded intraspecific variation for all specimens analysed. The presence of distinct morphological features and absence of haplotype sharing suggests that the low level of sequence divergence within Poroderma is most likely a result of recent speciation and/or a slow mutation rate rather than taxonomic over-splitting.
The joint use of species delimitation and specimen assignment analyses in this study allowed for the confirmation of morphological identifications for newly sequenced specimens of Halaelurus lineatus, H. natalensis, Holohalaelurus punctatus, H. regani, Poroderma africanum, and Scyliorhinus capensis. In contrast, species-level identifications could not be obtained for specimens within the genera Apristurus and Haploblepharus—albeit for different reasons. Prior to this study, no COI or NADH2 sequence data were publicly available for Apristurus species sampled in South Africa. Although a single COI sequence is publicly available for Apristurus saldanha (HVDB138-10), this record should be treated with caution as the specimen was sampled in northern Namibia, which is outside of the known distribution range for this species [12]. Due to the limited data available, the two newly sequenced Apristurus specimens were delimited into singleton MOTUs—revealing the presence of two unique and previously undocumented species. Although the ongoing taxonomic revision of Apristurus is expected to aid in clarifying the number of species-level entities present along the South African coastline [12], the development of comprehensive DNA reference libraries is required to improve specimen assignments which are susceptible to insufficient taxonomic coverage and/or intraspecific genetic diversity.
For the genus Haploblepharus, the novel COI data generated in this study for H. fuscus and H. pictus allowed for the first assessment of genetic divergence among all four congeners—confirming H. kistnasamyi (a cryptic species that is difficult to distinguish from H. edwardsii) as distinct. Conversely, three morphologically distinct congeners (H. edwardsii, H. fuscus, and H. pictus) were delimited into discordant MOTUs, and specimen assignment methods returned a number of conflicting identifications. Previous studies have reported the limitations of mitochondrial DNA in accurately delineating elasmobranch species [24,34,87]. In recently diverged species, it is difficult to discern whether a shared genetic variation is a result of the retention of ancestral polymorphisms (i.e., incomplete lineage sorting) or due to gene flow following secondary contact (i.e., introgression) [88]. Steinke et al. [26] provided two possible scenarios that could result in MOTU sharing: species may belong to monophyletic clusters separated by low sequence divergence (e.g., Poroderma), or haplotype sharing may occur between the species involved. In the current study, haplotype sharing among the three Haploblepharus species was attributed to the presence of nucleotide ambiguities.
Dudu et al. [89] advised that the presence of NUMTs (i.e., nuclear-encoded mitochondrial pseudogenes) should be carefully considered when detecting double peaks in mitochondrial DNA. While NUMTs cannot be completely disregarded, no premature stop codons were detected in this study, and all sequences were in excess of 600 bp in length [77]. Additionally, it is important to note that the ambiguous sites identified in the NADH2 gene were also present in the publicly available sequence for H. edwardsii (JQ518679) [36]. Although further investigation is required, the identified ambiguities could be regarded as a heteroplasmic signal (i.e., the presence of multiple mitochondrial genomes in a single individual or tissue) [90]. However, as heteroplasmy has previously been shown to resolve to homoplasmy within a few generations [91,92], the shared characteristic of ambiguous sites among Haploblepharus species could be explained by the occurrence of contemporary hybridisation and paternal leakage (i.e., the bi-parental inheritance of mitochondrial DNA) [77,93]. Although the inability to delineate species was not the intended outcome of this study, the previously reported overlap of morphological features [16,18] and admixed species clusters [19], in conjunction with the presence of nucleotide ambiguities, highlights the ongoing evolutionary mechanisms at play within this morphologically conserved genus. It is important to note that the presence of heteroplasmy is mentioned herein with caution. Additional research should explore this phenomenon in more detail as a thorough description of the ambiguous sites may provide haplotypes that prove to be correlated with genetically distinct groups. Considering the elevated conservation concern associated with three of the four Haploblepharus species, further research is urgently required in order to clarify evolutionary distinctness and distribution ranges for these species.
Despite controversies surrounding the use of DNA-based methods for the sorting of species [94,95], species delimitation and specimen assignment approaches rely on different theoretical frameworks [50]. In the present study, the concurrent application of the species delimitation and specimen assignment approaches proved to be advantageous for the validation of DNA reference libraries. Additionally, the use of multiple methods allows for the normalisation of the over- or underestimation of species-level entities as well as improved confidence in specimen assignments [50,96]. From a practical perspective, the delimitation of MOTUs should be used to facilitate taxonomic workflow by highlighting lineages that require further investigation. Recent studies have illustrated that the implementation of integrative taxonomy has streamlined procedures and aided in overcoming the taxonomic impediment (i.e., the decline of taxonomic expertise) [49,53]. Given the difficulties associated with morphological specimen identification, this study highlights the need for an in-depth taxonomic revision for the genera Apristurus and Haploblepharus through the implementation of an integrative approach. The use of molecular data in taxonomically complicated lineages may aid in identifying morphologically distinct characters that can be utilised for the in-field identification of specimens.

5. Conclusions

The implementation of a molecular taxonomic approach proved to be advantageous for the curation of DNA reference libraries for South Africa’s catsharks. The requirement of validated reference libraries is emphasised in the present study as the improved accuracy of specimen assignments provided support for the occurrence of Apristurus melanoasper in the eastern South Atlantic Ocean and suggests that the distribution range of Galeus polli requires further investigation. Although taxonomic misidentifications were present within the investigated dataset, the major limitation to South African catshark molecular taxonomy was found to be a paucity of publicly available sequence data—especially for the NADH2 gene. Following exhaustive searches for publicly available data, no records for Apristurus microps and Holohalaelurus favus were found for the COI or NADH2 gene. Even though DNA reference libraries will benefit from increased taxonomic coverage [50,51], this study reveals that reliable molecular specimen identification could be achieved for 10 out of the 16 South African catshark species (Galeus polli, Halaelurus lineatus, H. natalensis, Haploblepharus kistnasamyi, Holohalaelurus punctatus, H. regani, Cephaloscyllium sufflans, Poroderma africanum, P. pantherinum, and Scyliorhinus capensis). Since accurate species-level identification forms the basis of conservation assessments, this study highlights the need for integrative taxonomic revisions of the genera Apristurus and Haploblepharus.

Supplementary Materials

The following supporting information can be downloaded at https://www.mdpi.com/article/10.3390/d15070828/s1. Table S1: Biodiversity of catshark species occurring in South African waters modified from Ebert et al. [12]. The conservation status of each species based on global assessments and as categorised by the International Union for the Conservation of Nature (IUCN), followed by the year assessed in parentheses, is indicated. Table S2: Details of the specimens analysed in this study, including associated GenBank accession and/or BOLD Process ID numbers. Haplotype codes are indicated for each of the four datasets (A–D). Table S3: Genetic p-distances for catshark species and consensus MOTUs identified in four separate datasets. The numbers of individuals (n) per species and MOTU are given. Distances (%) are given as the mean, with ranges indicated in parentheses. Table S4: Results from the best close match analyses (BCMA) conducted on four separate datasets. The BCMA output is highlighted in red for specimens attributed to multiple species or when the assigned species differed from the species label. Table S5: Results of the specimen assignment analyses conducted on four separate datasets using three methods: BP—back-propagation neural networks, FZ—fuzzy set-based approach, and FZKMER—alignment-free kmer-based method. Each potential identification is assigned a “bp.probability” by the BP method and an “FMF value” by both the FZ and FZKMER methods. The number of votes indicates the number of methods that supported the consensus assignment for each specimen. Specimen assignments are highlighted in red when the assigned species differed from the reported identification on GenBank and/or BOLD. References [97,98,99,100,101,102,103,104,105,106] are cited in Supplementary Materials.

Author Contributions

Conceptualisation, M.v.S., M.E.M., C.d.S. and A.E.B.-v.d.M.; resources and data curation, M.v.S., D.A.E., E.G., R.W.L., M.E.M., M.P., R.G.A.W., S.W. and A.E.B.-v.d.M.; formal analysis and visualisation, M.v.S.; validation, D.A.E., R.W.L. and A.E.B.-v.d.M.; writing—original draft preparation, M.v.S. and A.E.B.-v.d.M.; writing—review and editing, M.v.S., D.A.E., E.G., R.W.L., M.E.M., M.P., R.G.A.W., S.W., C.d.S. and A.E.B.-v.d.M.; supervision, project administration and funding acquisition, A.E.B.-v.d.M. and C.d.S. All authors have read and agreed to the published version of the manuscript.

Funding

This research was funded by the Foundational Biodiversity Information Programme, grant number FBIP180523333686, and the National Research Foundation of South Africa, grant number 123268.

Institutional Review Board Statement

The animal study protocol was approved by the Ethics Committee of Stellenbosch University (protocol code ACU-2021-21616).

Data Availability Statement

The data presented in this study are openly available on the Barcode of Life Data System and/or GenBank (Table S2).

Acknowledgments

The authors would like to thank Warren Teixeira and Mary Rowlinson for assisting with sample collection. Sequence data was generated by the Central Analytical Facility, Stellenbosch University. D.A.E. would like to thank the Save Our Seas Foundation (grant number 594), Moss Landing Marine Laboratories, and the South African Institute for Aquatic Biodiversity.

Conflicts of Interest

The authors declare no conflict of interest. The funders had no role in the design of the study; in the collection, analyses, or interpretation of data; in the writing of the manuscript; or in the decision to publish the results.

References

  1. Weigmann, S. Annotated Checklist of the Living Sharks, Batoids and Chimaeras (Chondrichthyes) of the World, with a Focus on Biogeographical Diversity. J. Fish Biol. 2016, 88, 837–1037. [Google Scholar] [CrossRef] [PubMed]
  2. Ebert, D.A.; Dando, M.; Fowler, S. Sharks of the World: A Complete Guide; Princeton University Press: Princeton, NJ, USA, 2021; ISBN 978-0-691-20599-1. [Google Scholar]
  3. Fricke, R.; Eschmeyer, W.N.; Van der Laan, R. Eschmeyer’s Catalog of Fishes: Genera, Species, References. Available online: https://researcharchive.calacademy.org/research/ichthyology/catalog/fishcatmain.asp (accessed on 14 June 2023).
  4. Compagno, L.J.V. Sharks of the Order Carcharhiniformes; Princeton University Press: Princeton, NJ, USA, 1988; ISBN 0-691-08453-X. [Google Scholar]
  5. De Carvalho, M.R. Higher-level Elasmobranch Phylogeny, Basal Squaleans, and Paraphyly. In Interrelationships of Fishes; Stiassny, M.L.J., Parenti, L.R., Johnson, G.D., Eds.; Academic Press: New York, NY, USA, 1996; pp. 35–62. ISBN 978-0-12-670950-6. [Google Scholar]
  6. Springer, S. A Revision of the Catsharks, Family Scyliorhinidae; NOAA Technical Report NMFS Circular; U.S. Department of Commerce: Washington, DC, USA, 1979; Volume 422, pp. 1–152.
  7. Soares, K.D.A.; Mathubara, K. Combined Phylogeny and New Classification of Catsharks (Chondrichthyes: Elasmobranchii: Carcharhiniformes). Zool. J. Linn. Soc. 2022, 195, 761–814. [Google Scholar] [CrossRef]
  8. Stein, R.W.; Mull, C.G.; Kuhn, T.S.; Aschliman, N.C.; Davidson, L.N.K.; Joy, J.B.; Smith, G.J.; Dulvy, N.K.; Mooers, A.O. Global Priorities for Conserving the Evolutionary History of Sharks, Rays and Chimaeras. Nat. Ecol. Evol. 2018, 2, 288–298. [Google Scholar] [CrossRef] [PubMed] [Green Version]
  9. Derrick, D.H.; Cheok, J.; Dulvy, N.K. Spatially Congruent Sites of Importance for Global Shark and Ray Biodiversity. PLoS ONE 2020, 15, e0235559. [Google Scholar] [CrossRef]
  10. Davidson, L.N.K.; Dulvy, N.K. Global Marine Protected Areas to Prevent Extinctions. Nat. Ecol. Evol. 2017, 1, 0040. [Google Scholar] [CrossRef]
  11. Davies, K.F.; Margules, C.R.; Lawrence, J.F. A Synergistic Effect Puts Rare, Specialized Species at a Greater Risk of Extinction. Ecology 2004, 85, 265–271. [Google Scholar] [CrossRef] [Green Version]
  12. Ebert, D.A.; Wintner, S.P.; Kyne, P.M. An Annotated Checklist of the Chondrichthyans of South Africa. Zootaxa 2021, 4947, 1–127. [Google Scholar] [CrossRef]
  13. da Silva, C.; Booth, A.J.; Dudley, S.F.J.; Kerwath, S.E.; Lamberth, S.J.; Leslie, R.W.; McCord, M.E.; Sauer, W.H.H.; Zweig, T. The Current Status and Management of South Africa’s Chondrichthyan Fisheries. Afr. J. Mar. Sci. 2015, 37, 233–248. [Google Scholar] [CrossRef]
  14. The IUCN Red List of Threatened Species. Version 2022-2. Available online: https://www.iucnredlist.org (accessed on 5 February 2023).
  15. Dulvy, N.K.; Pacoureau, N.; Rigby, C.L.; Pollom, R.A.; Jabado, R.W.; Ebert, D.A.; Finucci, B.; Pollock, C.M.; Cheok, J.; Derrick, D.H.; et al. Overfishing Drives over One-Third of All Sharks and Rays toward a Global Extinction Crisis. Curr. Biol. 2021, 31, 4773–4787. [Google Scholar] [CrossRef] [PubMed]
  16. Human, B.A. A Taxonomic Revision of the Catshark Genus Haploblepharus Garman 1913 (Chondrichthyes: Carcharhiniformes: Scyliorhinidae). Zootaxa 2007, 1451, 1–40. [Google Scholar] [CrossRef]
  17. Human, B.A.; Compagno, L.J.V. Description of Haploblepharus kistnasamyi, a New Catshark (Chondrichthyes: Scyliorhinidae) from South Africa. Zootaxa 2006, 1318, 41–58. [Google Scholar] [CrossRef]
  18. Human, B.A. Size-Corrected Shape Variation Analysis and Quantitative Species Discrimination in a Morphologically Conservative Catshark Genus, Haploblepharus Garman, 1913 (Chondrichthyes: Carcharhiniformes: Scyliorhinidae). Afr. Nat. Hist. 2007, 3, 59–73. [Google Scholar]
  19. van Staden, M.; Gledhill, K.S.; Gennari, E.; McCord, M.E.; Parkinson, M.; Watson, R.G.A.; Rhode, C.; Bester-van der Merwe, A.E. Microsatellite Development and Detection of Admixture among Three Sympatric Haploblepharus Species (Carcharhiniformes: Scyliorhinidae). Aquat. Conserv. 2020, 30, 2336–2350. [Google Scholar] [CrossRef]
  20. Abercrombie, D.L.; Clarke, S.C.; Shivji, M.S. Global-Scale Genetic Identification of Hammerhead Sharks: Application to Assessment of the International Fin Trade and Law Enforcement. Conserv. Genet. 2005, 6, 775–788. [Google Scholar] [CrossRef]
  21. Dayrat, B. Towards Integrative Taxonomy. Biol. J. Linn. 2005, 85, 407–417. [Google Scholar] [CrossRef] [Green Version]
  22. Cerutti-Pereyra, F.; Meekan, M.G.; Wei, N.-W.V.; O’Shea, O.; Bradshaw, C.J.A.; Austin, C.M. Identification of Rays through DNA Barcoding: An Application for Ecologists. PLoS ONE 2012, 7, e36479. [Google Scholar] [CrossRef] [Green Version]
  23. Pank, M.; Stanhope, M.; Natanson, L.; Kohler, N.; Shivji, M. Rapid and Simultaneous Identification of Body Parts from the Morphologically Similar Sharks Carcharhinus obscurus and Carcharhinus plumbeus (Carcharhinidae) Using Multiplex PCR. Mar. Biotechnol. 2001, 3, 231–240. [Google Scholar] [CrossRef]
  24. Morgan, J.A.T.; Harry, A.V.; Welch, D.J.; Street, R.; White, J.; Geraghty, P.T.; Macbeth, W.G.; Tobin, A.; Simpfendorfer, C.A.; Ovenden, J.R. Detection of Interspecies Hybridisation in Chondrichthyes: Hybrids and Hybrid Offspring between Australian (Carcharhinus tilstoni) and Common (C. limbatus) Blacktip Shark Found in an Australian Fishery. Conserv. Genet. 2012, 13, 455–463. [Google Scholar] [CrossRef]
  25. Nakaya, K.; Kawauchi, J. A Review of the Genus Apristurus (Chondrichthyes: Carcharhiniformes: Scyliorhinidae) from Taiwanese Waters. Zootaxa 2013, 3752, 130–171. [Google Scholar] [CrossRef] [PubMed] [Green Version]
  26. Steinke, D.; Connell, A.D.; Hebert, P.D.N. Linking Adults and Immatures of South African Marine Fishes. Genome 2016, 59, 959–967. [Google Scholar] [CrossRef] [PubMed] [Green Version]
  27. Blaxter, M. Counting Angels with DNA. Nature 2003, 421, 122–123. [Google Scholar] [CrossRef]
  28. Tautz, D.; Arctander, P.; Minelli, A.; Thomas, R.H.; Vogler, A.P. A Plea for DNA Taxonomy. Trends Ecol. Evol. 2003, 18, 70–74. [Google Scholar] [CrossRef]
  29. Hebert, P.D.N.; Cywinska, A.; Ball, S.L.; deWaard, J.R. Biological Identifications through DNA Barcodes. Proc. R. Soc. B 2003, 270, 313–321. [Google Scholar] [CrossRef] [PubMed]
  30. Hebert, P.D.N.; Stoeckle, M.Y.; Zemlak, T.S.; Francis, C.M. Identification of Birds through DNA Barcodes. PLoS Biol. 2004, 2, e312. [Google Scholar] [CrossRef] [PubMed] [Green Version]
  31. Ward, R.D.; Hanner, R.; Hebert, P.D.N. The Campaign to DNA Barcode All Fishes, FISH-BOL. J. Fish Biol. 2009, 74, 329–356. [Google Scholar] [CrossRef] [PubMed]
  32. Moore, A.B.M.; White, W.T.; Ward, R.D.; Naylor, G.J.P.; Peirce, R. Rediscovery and Redescription of the Smoothtooth Blacktip Shark, Carcharhinus leiodon (Carcharhinidae), from Kuwait, with Notes on Its Possible Conservation Status. Mar. Freshw. Res. 2011, 62, 528–539. [Google Scholar] [CrossRef]
  33. Hara, Y.; Yamaguchi, K.; Onimaru, K.; Kadota, M.; Koyanagi, M.; Keeley, S.D.; Tatsumi, K.; Tanaka, K.; Motone, F.; Kageyama, Y.; et al. Shark Genomes Provide Insights into Elasmobranch Evolution and the Origin of Vertebrates. Nat. Ecol. Evol. 2018, 2, 1761–1771. [Google Scholar] [CrossRef] [Green Version]
  34. Ward, R.D.; Holmes, B.H.; White, W.T.; Last, P.R. DNA Barcoding Australasian Chondrichthyans: Results and Potential Uses in Conservation. Mar. Freshw. Res. 2008, 59, 57–71. [Google Scholar] [CrossRef]
  35. Ferrari, A.; Di Crescenzo, S.; Cariani, A.; Crobe, V.; Benvenuto, A.; Piattoni, F.; Mancusi, C.; Bonnici, L.; Bonello, J.J.; Schembri, P.J.; et al. Puzzling over Spurdogs: Molecular Taxonomy Assessment of the Squalus Species in the Strait of Sicily. Eur. Zool. J. 2021, 88, 181–190. [Google Scholar] [CrossRef]
  36. Naylor, G.J.P.; Caira, J.N.; Jensen, K.; Rosana, K.A.M.; White, W.T.; Last, P.R. A DNA Sequence—Based Approach to the Identification of Shark and Ray Species and Its Implications for Global Elasmobranch Diversity and Parasitology. Bull. Am. Mus. Nat. Hist. 2012, 367, 1–262. [Google Scholar] [CrossRef]
  37. Giles, J.L.; Riginos, C.; Naylor, G.J.P.; Dharmadi; Ovenden, J.R. Genetic and Phenotypic Diversity in the Wedgefish Rhynchobatus australiae, a Threatened Ray of High Value in the Shark Fin Trade. Mar. Ecol. Prog. Ser. 2016, 548, 165–180. [Google Scholar] [CrossRef] [Green Version]
  38. Henderson, A.C.; Reeve, A.J.; Jabado, R.W.; Naylor, G.J.P. Taxonomic Assessment of Sharks, Rays and Guitarfishes (Chondrichthyes: Elasmobranchii) from South-Eastern Arabia, Using the NADH Dehydrogenase Subunit 2 (NADH2) Gene. Zool. J. Linn. Soc. 2016, 176, 399–442. [Google Scholar] [CrossRef] [Green Version]
  39. Fernando, D.; Bown, R.M.K.; Tanna, A.; Gobiraj, R.; Ralicki, H.; Jockusch, E.L.; Ebert, D.A.; Jensen, K.; Caira, J.N. New Insights into the Identities of the Elasmobranch Fauna of Sri Lanka. Zootaxa 2019, 4585, 201–238. [Google Scholar] [CrossRef] [PubMed] [Green Version]
  40. Petean, F.F.; Naylor, G.J.P.; Lima, S.M.Q. Integrative Taxonomy Identifies a New Stingray Species of the Genus Hypanus Rafinesque, 1818 (Dasyatidae, Myliobatiformes), from the Tropical Southwestern Atlantic. J. Fish Biol. 2020, 97, 1120–1142. [Google Scholar] [CrossRef] [PubMed]
  41. Brown, S.D.J.; Collins, R.A.; Boyer, S.; Lefort, M.-C.; Malumbres-Olarte, J.; Vink, C.J.; Cruickshank, R.H. SPIDER: An R Package for the Analysis of Species Identity and Evolution, with Particular Reference to DNA Barcoding. Mol. Ecol. Resour. 2012, 12, 562–565. [Google Scholar] [CrossRef]
  42. Puillandre, N.; Lambert, A.; Brouillet, S.; Achaz, G. ABGD, Automatic Barcode Gap Discovery for Primary Species Delimitation. Mol. Ecol. 2012, 21, 1864–1877. [Google Scholar] [CrossRef]
  43. Ratnasingham, S.; Hebert, P.D.N. A DNA-Based Registry for All Animal Species: The Barcode Index Number (BIN) System. PLoS ONE 2013, 8, e66213. [Google Scholar] [CrossRef] [Green Version]
  44. Dellicour, S.; Flot, J.-F. The Hitchhiker’s Guide to Single-Locus Species Delimitation. Mol. Ecol. Resour. 2018, 18, 1234–1246. [Google Scholar] [CrossRef]
  45. Zhang, A.-B.; Muster, C.; Liang, H.-B.; Zhu, C.-D.; Crozier, R.; Wan, P.; Feng, J.; Ward, R.D. A Fuzzy-Set-Theory-Based Approach to Analyse Species Membership in DNA Barcoding. Mol. Ecol. 2012, 21, 1848–1863. [Google Scholar] [CrossRef]
  46. Ratnasingham, S.; Hebert, P.D.N. BOLD: The Barcode of Life Data System (http://www.barcodinglife.org). Mol. Ecol. Notes 2007, 7, 355–364. [Google Scholar] [CrossRef] [Green Version]
  47. Sayers, E.W.; Cavanaugh, M.; Clark, K.; Pruitt, K.D.; Schoch, C.L.; Sherry, S.T.; Karsch-Mizrachi, I. GenBank. Nucleic Acids Res. 2022, 50, D161–D164. [Google Scholar] [CrossRef]
  48. Hubert, N.; Delrieu-Trottin, E.; Irisson, J.-O.; Meyer, C.; Planes, S. Identifying Coral Reef Fish Larvae through DNA Barcoding: A Test Case with the Families Acanthuridae and Holocentridae. Mol. Phylogenet. Evol. 2010, 55, 1195–1203. [Google Scholar] [CrossRef] [PubMed]
  49. Hubert, N.; Hanner, R. DNA Barcoding, Species Delineation and Taxonomy: A Historical Perspective. DNA Barcodes 2015, 3, 44–58. [Google Scholar] [CrossRef] [Green Version]
  50. Delrieu-Trottin, E.; Durand, J.-D.; Limmon, G.; Sukmono, T.; Kadarusman; Sugeha, H.Y.; Chen, W.-J.; Busson, F.; Borsa, P.; Dahruddin, H.; et al. Biodiversity Inventory of the Grey Mullets (Actinopterygii: Mugilidae) of the Indo-Australian Archipelago through the Iterative Use of DNA-based Species Delimitation and Specimen Assignment Methods. Evol. Appl. 2020, 13, 1451–1467. [Google Scholar] [CrossRef] [PubMed] [Green Version]
  51. Carugati, L.; Melis, R.; Cariani, A.; Cau, A.; Crobe, V.; Ferrari, A.; Follesa, M.C.; Geraci, M.L.; Iglésias, S.P.; Pesci, P.; et al. Combined COI Barcode-based Methods to Avoid Mislabeling of Threatened Species of Deep-sea Skates. Anim. Conserv. 2022, 25, 38–52. [Google Scholar] [CrossRef]
  52. Piemontese, L.; Giovannini, I.; Guidetti, R.; Pellegri, G.; Dioli, P.; Maistrello, L.; Rebecchi, L.; Cesari, M. The Species Identification Problem in Mirids (Hemiptera: Heteroptera) Highlighted by DNA Barcoding and Species Delimitation Studies. Eur. Zool. J. 2020, 87, 310–324. [Google Scholar] [CrossRef]
  53. Bellodi, A.; Benvenuto, A.; Melis, R.; Mulas, A.; Barone, M.; Barría, C.; Cariani, A.; Carugati, L.; Chatzispyrou, A.; Desrochers, M.; et al. Call Me by My Name: Unravelling the Taxonomy of the Gulper Shark Genus Centrophorus in the Mediterranean Sea through an Integrated Taxonomic Approach. Zool. J. Linn. Soc. 2022, 195, 815–840. [Google Scholar] [CrossRef]
  54. Compagno, L.J.V.; Ebert, D.A.; Smale, M.J. Guide to the Sharks and Rays of Southern Africa; Struik: Cape Town, South Africa, 1989; ISBN 978-0-86977-880-7. [Google Scholar]
  55. Dunlop, S.W.; Mann, B.Q.; Van Der Elst, R.P. A Review of the Oceanographic Research Institute’s Cooperative Fish Tagging Project: 27 Years down the Line. Afr. J. Mar. Sci. 2013, 35, 209–221. [Google Scholar] [CrossRef]
  56. Sambrook, J.F.; Russell, D.W. Molecular Cloning: A Laboratory Manual, 3rd ed.; Cold Spring Harbor Laboratory Press: Cold Spring Harbor, NY, USA, 2001; ISBN 978-0-87969-577-4. [Google Scholar]
  57. Ward, R.D.; Zemlak, T.S.; Innes, B.H.; Last, P.R.; Hebert, P.D.N. DNA Barcoding Australia’s Fish Species. Philos. Trans. R. Soc. B 2005, 360, 1847–1857. [Google Scholar] [CrossRef]
  58. Ivanova, N.V.; Zemlak, T.S.; Hanner, R.H.; Hebert, P.D.N. Universal Primer Cocktails for Fish DNA Barcoding. Mol. Ecol. Notes 2007, 7, 544–548. [Google Scholar] [CrossRef]
  59. Naylor, G.J.P.; Ryburn, J.A.; Fedrigo, O.; Lopez, A. Phylogenetic Relationships among the Major Lineages of Modern Elasmobranchs. In Reproductive Biology and Phylogeny of Chondrichthyes: Sharks, Batoids, and Chimaeras; Hamlett, W.C., Ed.; CRC Press: Boca Raton, FL, USA, 2005; pp. 1–25. ISBN 978-0-429-06290-2. [Google Scholar]
  60. Katoh, K.; Standley, D.M. MAFFT Multiple Sequence Alignment Software Version 7: Improvements in Performance and Usability. Mol. Biol. Evol. 2013, 30, 772–780. [Google Scholar] [CrossRef] [PubMed] [Green Version]
  61. Tamura, K.; Stecher, G.; Kumar, S. MEGA11: Molecular Evolutionary Genetics Analysis Version 11. Mol. Biol. Evol. 2021, 38, 3022–3027. [Google Scholar] [CrossRef] [PubMed]
  62. Jukes, T.H.; Cantor, C.R. Evolution of Protein Molecules. In Mammalian Protein Metabolism; Munro, H.N., Ed.; Academic Press: New York, NY, USA, 1969; pp. 21–132. ISBN 978-1-4832-3211-9. [Google Scholar]
  63. Collins, R.A.; Cruickshank, R.H. The Seven Deadly Sins of DNA Barcoding. Mol. Ecol. Resour. 2013, 13, 969–975. [Google Scholar] [CrossRef] [PubMed]
  64. Moritz, C. Defining ‘Evolutionarily Significant Units’ for Conservation. Trends Ecol. Evol. 1994, 9, 373–375. [Google Scholar] [CrossRef]
  65. Vogler, A.P.; Desalle, R. Diagnosing Units of Conservation Management. Conserv. Biol. 1994, 8, 354–363. [Google Scholar] [CrossRef]
  66. Puillandre, N.; Brouillet, S.; Achaz, G. ASAP: Assemble Species by Automatic Partitioning. Mol. Ecol. Resour. 2021, 21, 609–620. [Google Scholar] [CrossRef]
  67. Zhang, J.; Kapli, P.; Pavlidis, P.; Stamatakis, A. A General Species Delimitation Method with Applications to Phylogenetic Placements. Bioinformatics 2013, 29, 2869–2876. [Google Scholar] [CrossRef] [Green Version]
  68. Kapli, P.; Lutteropp, S.; Zhang, J.; Kobert, K.; Pavlidis, P.; Stamatakis, A.; Flouri, T. Multi-Rate Poisson Tree Processes for Single-Locus Species Delimitation under Maximum Likelihood and Markov Chain Monte Carlo. Bioinformatics 2017, 33, 1630–1638. [Google Scholar] [CrossRef] [Green Version]
  69. Rozas, J.; Ferrer-Mata, A.; Sánchez-DelBarrio, J.C.; Guirao-Rico, S.; Librado, P.; Ramos-Onsins, S.E.; Sánchez-Gracia, A. DnaSP 6: DNA Sequence Polymorphism Analysis of Large Data Sets. Mol. Biol. Evol. 2017, 34, 3299–3302. [Google Scholar] [CrossRef]
  70. Guindon, S.; Dufayard, J.-F.; Lefort, V.; Anisimova, M.; Hordijk, W.; Gascuel, O. New Algorithms and Methods to Estimate Maximum-Likelihood Phylogenies: Assessing the Performance of PhyML 3.0. Syst. Biol. 2010, 59, 307–321. [Google Scholar] [CrossRef] [Green Version]
  71. Lefort, V.; Longueville, J.-E.; Gascuel, O. SMS: Smart Model Selection in PhyML. Mol. Biol. Evol. 2017, 34, 2422–2424. [Google Scholar] [CrossRef] [Green Version]
  72. Meier, R.; Shiyang, K.; Vaidya, G.; Ng, P.K.L. DNA Barcoding and Taxonomy in Diptera: A Tale of High Intraspecific Variability and Low Identification Success. Syst. Biol. 2006, 55, 715–728. [Google Scholar] [CrossRef] [PubMed] [Green Version]
  73. Meyer, C.P.; Paulay, G. DNA Barcoding: Error Rates Based on Comprehensive Sampling. PLoS Biol. 2005, 3, e422. [Google Scholar] [CrossRef] [PubMed] [Green Version]
  74. Zhang, A.B.; Sikes, D.S.; Muster, C.; Li, S.Q. Inferring Species Membership Using DNA Sequences with Back-Propagation Neural Networks. Syst. Biol. 2008, 57, 202–215. [Google Scholar] [CrossRef] [PubMed] [Green Version]
  75. Zhang, A.-B.; Hao, M.-D.; Yang, C.-Q.; Shi, Z.-Y. BarcodingR: An Integrated R Package for Species Identification Using DNA Barcodes. Methods Ecol. Evol. 2017, 8, 627–634. [Google Scholar] [CrossRef]
  76. Zhang, A.-B.; Feng, J.; Ward, R.D.; Wan, P.; Gao, Q.; Wu, J.; Zhao, W.-Z. A New Method for Species Identification via Protein-Coding and Non-Coding DNA Barcodes by Combining Machine Learning with Bioinformatic Methods. PLoS ONE 2012, 7, e30986. [Google Scholar] [CrossRef] [PubMed] [Green Version]
  77. White, D.J.; Wolff, J.N.; Pierson, M.; Gemmell, N.J. Revealing the Hidden Complexities of MtDNA Inheritance. Mol. Ecol. 2008, 17, 4925–4942. [Google Scholar] [CrossRef]
  78. Iglésias, S.P.; Nakaya, K.; Stehmann, M. Apristurus melanoasper, a New Species of Deep-Water Catshark from the North Atlantic (Chondrichthyes: Carcharhiniformes: Scyliorhinidae). Cybium 2004, 28, 345–356. [Google Scholar] [CrossRef]
  79. De Astarloa, J.M.D.; Mabragaña, E.; Hanner, R.; Figueroa, D.E. Morphological and Molecular Evidence for a New Species of Longnose Skate (Rajiformes: Rajidae: Dipturus) from Argentinean Waters Based on DNA Barcoding. Zootaxa 2008, 1921, 35–46. [Google Scholar] [CrossRef]
  80. Ebert, D.A.; White, W.T.; Goldman, K.J.; Compagno, L.J.V.; Daly-Engel, T.S.; Ward, R.D. Resurrection and Redescription of Squalus suckleyi (Girard, 1854) from the North Pacific, with Comments on the Squalus acanthias Subgroup (Squaliformes: Squalidae). Zootaxa 2010, 2612, 22–40. [Google Scholar] [CrossRef]
  81. Viana, S.T.F.L.; De Carvalho, M.R. Resurrection and Redescription of the Southern Dogfish Squalus probatovi (Squalidae), a Valid Species from Angola. J. Ichthyol. 2018, 58, 617–632. [Google Scholar] [CrossRef]
  82. Cariani, A.; Messinetti, S.; Ferrari, A.; Arculeo, M.; Bonello, J.J.; Bonnici, L.; Cannas, R.; Carbonara, P.; Cau, A.; Charilaou, C.; et al. Improving the Conservation of Mediterranean Chondrichthyans: The ELASMOMED DNA Barcode Reference Library. PLoS ONE 2017, 12, e0170244. [Google Scholar] [CrossRef] [Green Version]
  83. Nakaya, K.; Sato, K.; Iglésias, S.P. Occurrence of Apristurus melanoasper from the South Pacific, Indian and South Atlantic Oceans (Carcharhiniformes: Scyliorhinidae). In Descriptions of New Australian Chondrichthyans; CSIRO Marine & Atmospheric Research Paper; CSIRO: Hobart, Australia, 2008; pp. 61–74. [Google Scholar]
  84. Ebert, D.A.; Fowler, S.L.; Compagno, L.J.V. Sharks of the World: A Fully Illustrated Guide; Wild Nature Press: Plymouth, UK, 2013; ISBN 978-0-9573946-0-5. [Google Scholar]
  85. Ahrens, D.; Fujisawa, T.; Krammer, H.-J.; Eberle, J.; Fabrizi, S.; Vogler, A.P. Rarity and Incomplete Sampling in DNA-Based Species Delimitation. Syst. Biol. 2016, 65, 478–494. [Google Scholar] [CrossRef] [Green Version]
  86. Human, B.A. A Taxonomic Revision of the Catshark Genus Poroderma Smith, 1837 (Chondrichthyes: Carcharhiniformes: Scyliorhinidae). Zootaxa 2006, 1229, 1–32. [Google Scholar] [CrossRef]
  87. Marino, I.A.M.; Finotto, L.; Colloca, F.; Di Lorenzo, M.; Gristina, M.; Farrell, E.D.; Zane, L.; Mazzoldi, C. Resolving the Ambiguities in the Identification of Two Smooth-Hound Sharks (Mustelus mustelus and Mustelus punctulatus) Using Genetics and Morphology. Mar. Biodivers. 2018, 48, 1551–1562. [Google Scholar] [CrossRef]
  88. Kashiwagi, T.; Marshall, A.D.; Bennett, M.B.; Ovenden, J.R. The Genetic Signature of Recent Speciation in Manta Rays (Manta alfredi and M. birostris). Mol. Phylogenet. Evol. 2012, 64, 212–218. [Google Scholar] [CrossRef]
  89. Dudu, A.; Georgescu, S.E.; Berrebi, P.; Costache, M. Site Heteroplasmy in the Mitochondrial Cytochrome b Gene of the Sterlet Sturgeon Acipenser ruthenus. Genet. Mol. Biol. 2012, 35, 886–891. [Google Scholar] [CrossRef] [PubMed] [Green Version]
  90. Just, R.S.; Irwin, J.A.; Parson, W. Mitochondrial DNA Heteroplasmy in the Emerging Field of Massively Parallel Sequencing. Forensic Sci. Int. Genet. 2015, 18, 131–139. [Google Scholar] [CrossRef] [Green Version]
  91. Cree, L.M.; Samuels, D.C.; De Sousa Lopes, S.C.; Rajasimha, H.K.; Wonnapinij, P.; Mann, J.R.; Dahl, H.-H.M.; Chinnery, P.F. A Reduction of Mitochondrial DNA Molecules during Embryogenesis Explains the Rapid Segregation of Genotypes. Nat. Genet. 2008, 40, 249–254. [Google Scholar] [CrossRef] [PubMed]
  92. Khrapko, K. Two Ways to Make an MtDNA Bottleneck. Nat. Genet. 2008, 40, 134–135. [Google Scholar] [CrossRef] [PubMed] [Green Version]
  93. Guo, X.; Liu, S.; Liu, Y. Evidence for Recombination of Mitochondrial DNA in Triploid Crucian Carp. Genetics 2006, 172, 1745–1749. [Google Scholar] [CrossRef] [PubMed] [Green Version]
  94. DeSalle, R.; Egan, M.G.; Siddall, M. The Unholy Trinity: Taxonomy, Species Delimitation and DNA Barcoding. Philos. Trans. R. Soc. B 2005, 360, 1905–1916. [Google Scholar] [CrossRef] [Green Version]
  95. Ebach, M.C.; Holdrege, C. DNA Barcoding Is No Substitute for Taxonomy. Nature 2005, 434, 697. [Google Scholar] [CrossRef] [Green Version]
  96. Blair, C.; Bryson, R.W. Cryptic Diversity and Discordance in Single-Locus Species Delimitation Methods within Horned Lizards (Phrynosomatidae: Phrynosoma). Mol. Ecol. Resour. 2017, 17, 1168–1182. [Google Scholar] [CrossRef] [PubMed] [Green Version]
  97. Wong, E.H.; Shivji, M.S.; Hanner, R.H. Identifying Sharks with DNA Barcodes: Assessing the Utility of a Nucleotide diagnostic approach. Mol. Ecol. Resour. 2009, 9, 243–256. [Google Scholar] [CrossRef] [PubMed]
  98. van der Bank, H. DNA Barcoding Results for Some Southern African Elephantfish, Guitarfish, Rattails, Rays, Sharks and Skates. Int. J. Oceanogr. Aquac. 2019, 3, 000163. [Google Scholar] [CrossRef]
  99. McCusker, M.R.; Denti, D.; Van Guelpen, L.; Kenchington, E.; Bentzen, P. Barcoding Atlantic Canada’s Commonly Encountered Marine Fishes. Mol. Ecol. Resour. 2013, 13, 177–188. [Google Scholar] [CrossRef]
  100. Costa, F.O.; Landi, M.; Martins, R.; Costa, M.H.; Costa, M.E.; Carneiro, M.; Alves, M.J.; Steinke, D.; Carvalho, G.R. A Ranking System for Reference Libraries of DNA Barcodes: Application to Marine Fish Species from Portugal. PLoS ONE 2012, 7, e35858. [Google Scholar] [CrossRef] [Green Version]
  101. Landi, M.; Dimech, M.; Arculeo, M.; Biondo, G.; Martins, R.; Carneiro, M.; Carvalho, G.R.; Lo Brutto, S.; Costa, F.O. DNA Barcoding for Species Assignment: The Case of Mediterranean Marine Fishes. PLoS ONE 2014, 9, e106135. [Google Scholar] [CrossRef]
  102. Castilho, R.; Freitas, M.; Silva, G.; Fernandez-Carvalho, J.; Coelho, R. Morphological and Mitochondrial DNA Divergence Validates Blackmouth, Galeus melastomus, and Atlantic Sawtail Catsharks, Galeus atlanticus, as Separate Species. J. Fish Biol. 2007, 70, 346–358. [Google Scholar] [CrossRef]
  103. Kousteni, V.; Mazzoleni, S.; Vasileiadou, K.; Rovatsos, M. Complete Mitochondrial Genome of Nine Species of Sharks and Rays and Their Phylogenetic Placement among Modern Elasmobranchs. Genes 2021, 12, 324. [Google Scholar] [CrossRef]
  104. Stoeckle, M.Y.; Das Mishu, M.; Charlop-Powers, Z. Improved Environmental DNA Reference Library Detects Overlooked Marine Fishes in New Jersey, United States. Front. Mar. Sci. 2020, 7, 226. [Google Scholar] [CrossRef]
  105. Moftah, M.; Abdel Aziz, S.H.; Elramah, S.; Favereaux, A. Classification of Sharks in the Egyptian Mediterranean Waters Using Morphological and DNA Barcoding Approaches. PLoS ONE 2011, 6, e27001. [Google Scholar] [CrossRef] [PubMed]
  106. López, J.A.; Ryburn, J.A.; Fedrigo, O.; Naylor, G.J.P. Phylogeny of Sharks of the Family Triakidae (Carcharhiniformes) and its Implications for the Evolution of Carcharhiniform Placental Viviparity. Mol. Phylogenet. Evol. 2006, 40, 50–60. [Google Scholar] [CrossRef] [PubMed]
Figure 1. Partial electropherograms from the cytochrome c oxidase subunit I (COI) gene illustrating the nucleotide ambiguities (highlighted in grey) present for two Haploblepharus species. Both forward (F) and reverse (R) trace files are given. The positions of the ambiguities (R = A/G; Y = C/T; M = A/C; K = G/T; and W = A/T) are given in comparison to a reference sequence from Haploblepharus edwardsii.
Diversity 15 00828 g001
Figure 2. Maximum likelihood tree of haplotypes identified for the family Pentanchidae based on (a) the COI dataset and (b) the NADH2 dataset. The MOTUs obtained using species delimitation analyses (RESL, ABGD, ASAP, bPTP, and mPTP) and the consensus analysis are indicated on the right.
Diversity 15 00828 g002
Figure 3. Relationship between the maximum intraspecific and nearest neighbour (NN) genetic distances among congeners within the families Pentanchidae (top) and Scyliorhinidae (bottom) based on (a,c) the COI datasets and (b,d) the NADH2 datasets. Points above the diagonal indicate the presence of a ‘barcode gap’.
Diversity 15 00828 g003
Figure 4. Maximum likelihood tree of haplotypes identified for the family Scyliorhinidae based on (a) the COI dataset and (b) the NADH2 dataset. The MOTUs obtained using species delimitation analyses (RESL, ABGD, ASAP, bPTP, and mPTP) and the consensus analysis are indicated on the right.
Diversity 15 00828 g004
Disclaimer/Publisher’s Note: The statements, opinions and data contained in all publications are solely those of the individual author(s) and contributor(s) and not of MDPI and/or the editor(s). MDPI and/or the editor(s) disclaim responsibility for any injury to people or property resulting from any ideas, methods, instructions or products referred to in the content.

