Article

Habitat Loss and Biotic Velocity Response to Climate Change for Alpine Plant Species in Atlantic Oceanic Islands

by
Víctor Bello-Rodríguez
1,*,
Andreas Hamann
2,
Jose Luis Martín-Esquivel
3,
Jonay Cubas
1,
Marcelino J. Del Arco
1 and
Juana María González-Mancebo
1
1
Plant Conservation and Biogeography Research Group, Departamento de Botánica, Universidad de La Laguna, Avenida Astrofísico Francisco Sánchez, Apdo. 456, 38200 San Cristóbal de La Laguna, Spain
2
Department of Renewable Resources, Faculty of Agricultural, Life and Environmental Sciences, University of Alberta, 751 General Services Building, Edmonton, AB T6G 2H1, Canada
3
Parque Nacional del Teide, Centro de Visitantes Telesforo Bravo, C/ Dr. Sixto Perera González, 25, La Orotava, 38300 Santa Cruz de Tenerife, Spain
*
Author to whom correspondence should be addressed.
Diversity 2023, 15(7), 864; https://doi.org/10.3390/d15070864
Submission received: 6 June 2023 / Revised: 6 July 2023 / Accepted: 11 July 2023 / Published: 17 July 2023
(This article belongs to the Section Biodiversity Conservation)

Abstract

:
Climate change may shift species outside of their current climatic tolerances, which can be problematic for oceanic islands with limited options for species migration. Their alpine habitats, which represent islands within islands, are a special concern due to high endemism rates. The Canary Islands have two examples for such fragile ecosystems above 2000 m, on La Palma and Tenerife. This study contributes an assessment of the Canary Islands’ climatic habitat for 47 alpine plant species under observed climate change (1959–1989 versus 1990–2019 periods) as well as for future projections (2041–2060 and 2061–2080 periods). We analyzed the contraction of climatic habitats and migration requirements (biotic velocity) for each species to compensate for observed and predicted climate change. Our results suggest that temporary climate refugia exist on Tenerife but are insufficient on La Palma, where habitat loss due to historical climate change has already created an area of significant concern: the Cumbre Vieja Natural Park. On Tenerife, current alpine species can find suitable climate habitats in the caldera area and on the Teide-Pico Viejo volcano. That said, migration paths toward these refugia are long and complex, and human-assisted migration may be required. Species-specific statistics to support such management interventions are provided in this study.

1. Introduction

Shifts in temperature and precipitation regimes due to anthropogenic climate change impact plant species, either by displacing their climatic habitat in altitude or latitude or by altering their composition and historical biotic and abiotic interactions [1,2]. These changes can lead to extinctions or compromised ecosystem function and services, especially in high-elevation areas [3,4,5]. The impact of shifts of climatic habitat depends on the tolerances of individual species, their capacity to adapt genetically or through a plastic response, and their capacity and opportunity to migrate to nearby habitat equivalent to their historical climate niche [4,6].
Islands and alpine habitats are potentially more vulnerable to climate change because species have limited options for migration. Island mountains and even small mountain ranges on the mainland also tend to harbor cold-adapted endemic species, creating a particularly high risk of biodiversity losses [7]. Furthermore, alpine ecosystems tend to experience greater rates of warming [3], causing more pronounced upward shifts of climatic habitat, which have been estimated to be three times as large for mountainous species than for low-elevation species [8]. This has led to documented increases in species richness in high-elevation ecosystems, by allowing lower-elevation species to enter habitat that was previously cold-limited [9]. However, this increase is expected to be a transient phenomenon hiding an extinction debt of cold-adapted species [9]. In fact, declines of overall species richness have already been documented in the upper bioclimatic belts, where shrubs encroach the habitats of cold-adapted specialists [7,10]. Shrub encroachment or expansion under climate change could also alter the soil organic carbon and nutrient regimes, thereby changing growing conditions that can lead to species replacements mediated by climate change [11,12]. Islands’ alpine habitats, which represent islands within islands, are a special concern in this context due to high endemism rates and scarce migration options [13]. In these areas, the rates of endemicity tend to be higher than on the continent due to a phenomenon of double isolation, one produced by the distance to the continent and another habitat isolation derived from elevation gradients that climatically separate the alpine ecosystem from the rest of the island territory [14,15]. Additionally, the overall habitat size on oceanic islands is small due to their limited land mass, which increases the vulnerability of these insular ecosystems to climate change [16,17].
All of these characteristics apply to the Canary Islands (Spain), where the alpine ecosystem is located on two of the eight islands, La Palma and Tenerife, with mountain ranges high enough to harbor it (peaking at 2426 m and 3715 m, respectively). Significantly greater warming in the last decades has been observed in the summit areas of the archipelago compared to low-elevation regions [18]. Further, studies also showed the encroachment of vegetation from lower elevation into the alpine ecosystems of the Canary Islands [19,20,21,22]. This justifies the need for research to identify potential climate change refugia and migration requirements that may prevent species from reaching climate change refugia. Where climate change outpaces the natural capacity of plants to adapt or migrate, the identification of potential refugia and human-assisted migration informed by such an analysis may be critical for the survival of many alpine endemics of the Canary Islands [23,24,25]. Although human-assisted migration could in principle be carried out among islands or to ex-situ reserves, we aim to recommend assisted migration prescriptions for higher-elevation locations within each island that could be implemented within the framework of standard ecosystem restoration practices [26].
While climatic habitat analyses have critical limitations in predicting climate change impacts, they can nevertheless also be essential conservation planning tools, where the objective is to ultimately manage migration through human intervention where necessary. Source and target locations for assisted migration prescriptions need to be characterized through matching historical, current, and future climate habitats. In this context, species-specific climatic habitat analysis for guiding assisted migration and setting priorities for monitoring and conservation activities is essential [27,28,29].
A second useful tool to identify climatic vulnerabilities and prioritize assisted migration interventions is landscape climatology metrics that quantify migration requirements to reach suitable climate habitat under observed and projected climate change. These metrics can be calculated for species and their populations and are referred to as biotic or bioclimatic climate change velocity [30,31,32], which relates the species or population-specific habitat shifts to the original concept of the velocity of climate change [33]. The metrics can be defined as a slope metric of a minimum movement distance in a gridded landscape, so that under an observed or predicted climate difference, a target grid cell maintains constant climate conditions, or in other words, the migration requirements for an individual in a landscape to maintain constant climate conditions. Climatic habitat analysis for both potentially vulnerable species (availability of refugia) and biotic velocity (distance to refugia) is needed to prioritize cases where human-assisted migration is necessary.
Here, we contribute an analysis that provides such information to identify potential climatic vulnerabilities for endemic plant species of the Canary Islands’ alpine ecosystems. This case study also serves as an example for how conservation planning and management can be guided to address past and anticipated climate change. Specifically, we evaluate (1) how the climatic habitat of 47 alpine plant species has shifted, expanded or contracted under past and future climate change, (2) quantify migration requirements through biotic velocity metrics for each species to maintain climate conditions to which they are adapted, and (3) identify and discuss possible limitations to that migration and potential refugia for biodiversity. We provide species-specific statistics that can be used to prioritize conservation management for threatened endemics and discuss the possibilities of natural and human-assisted migration and the role of geographical obstacles.

2. Materials and Methods

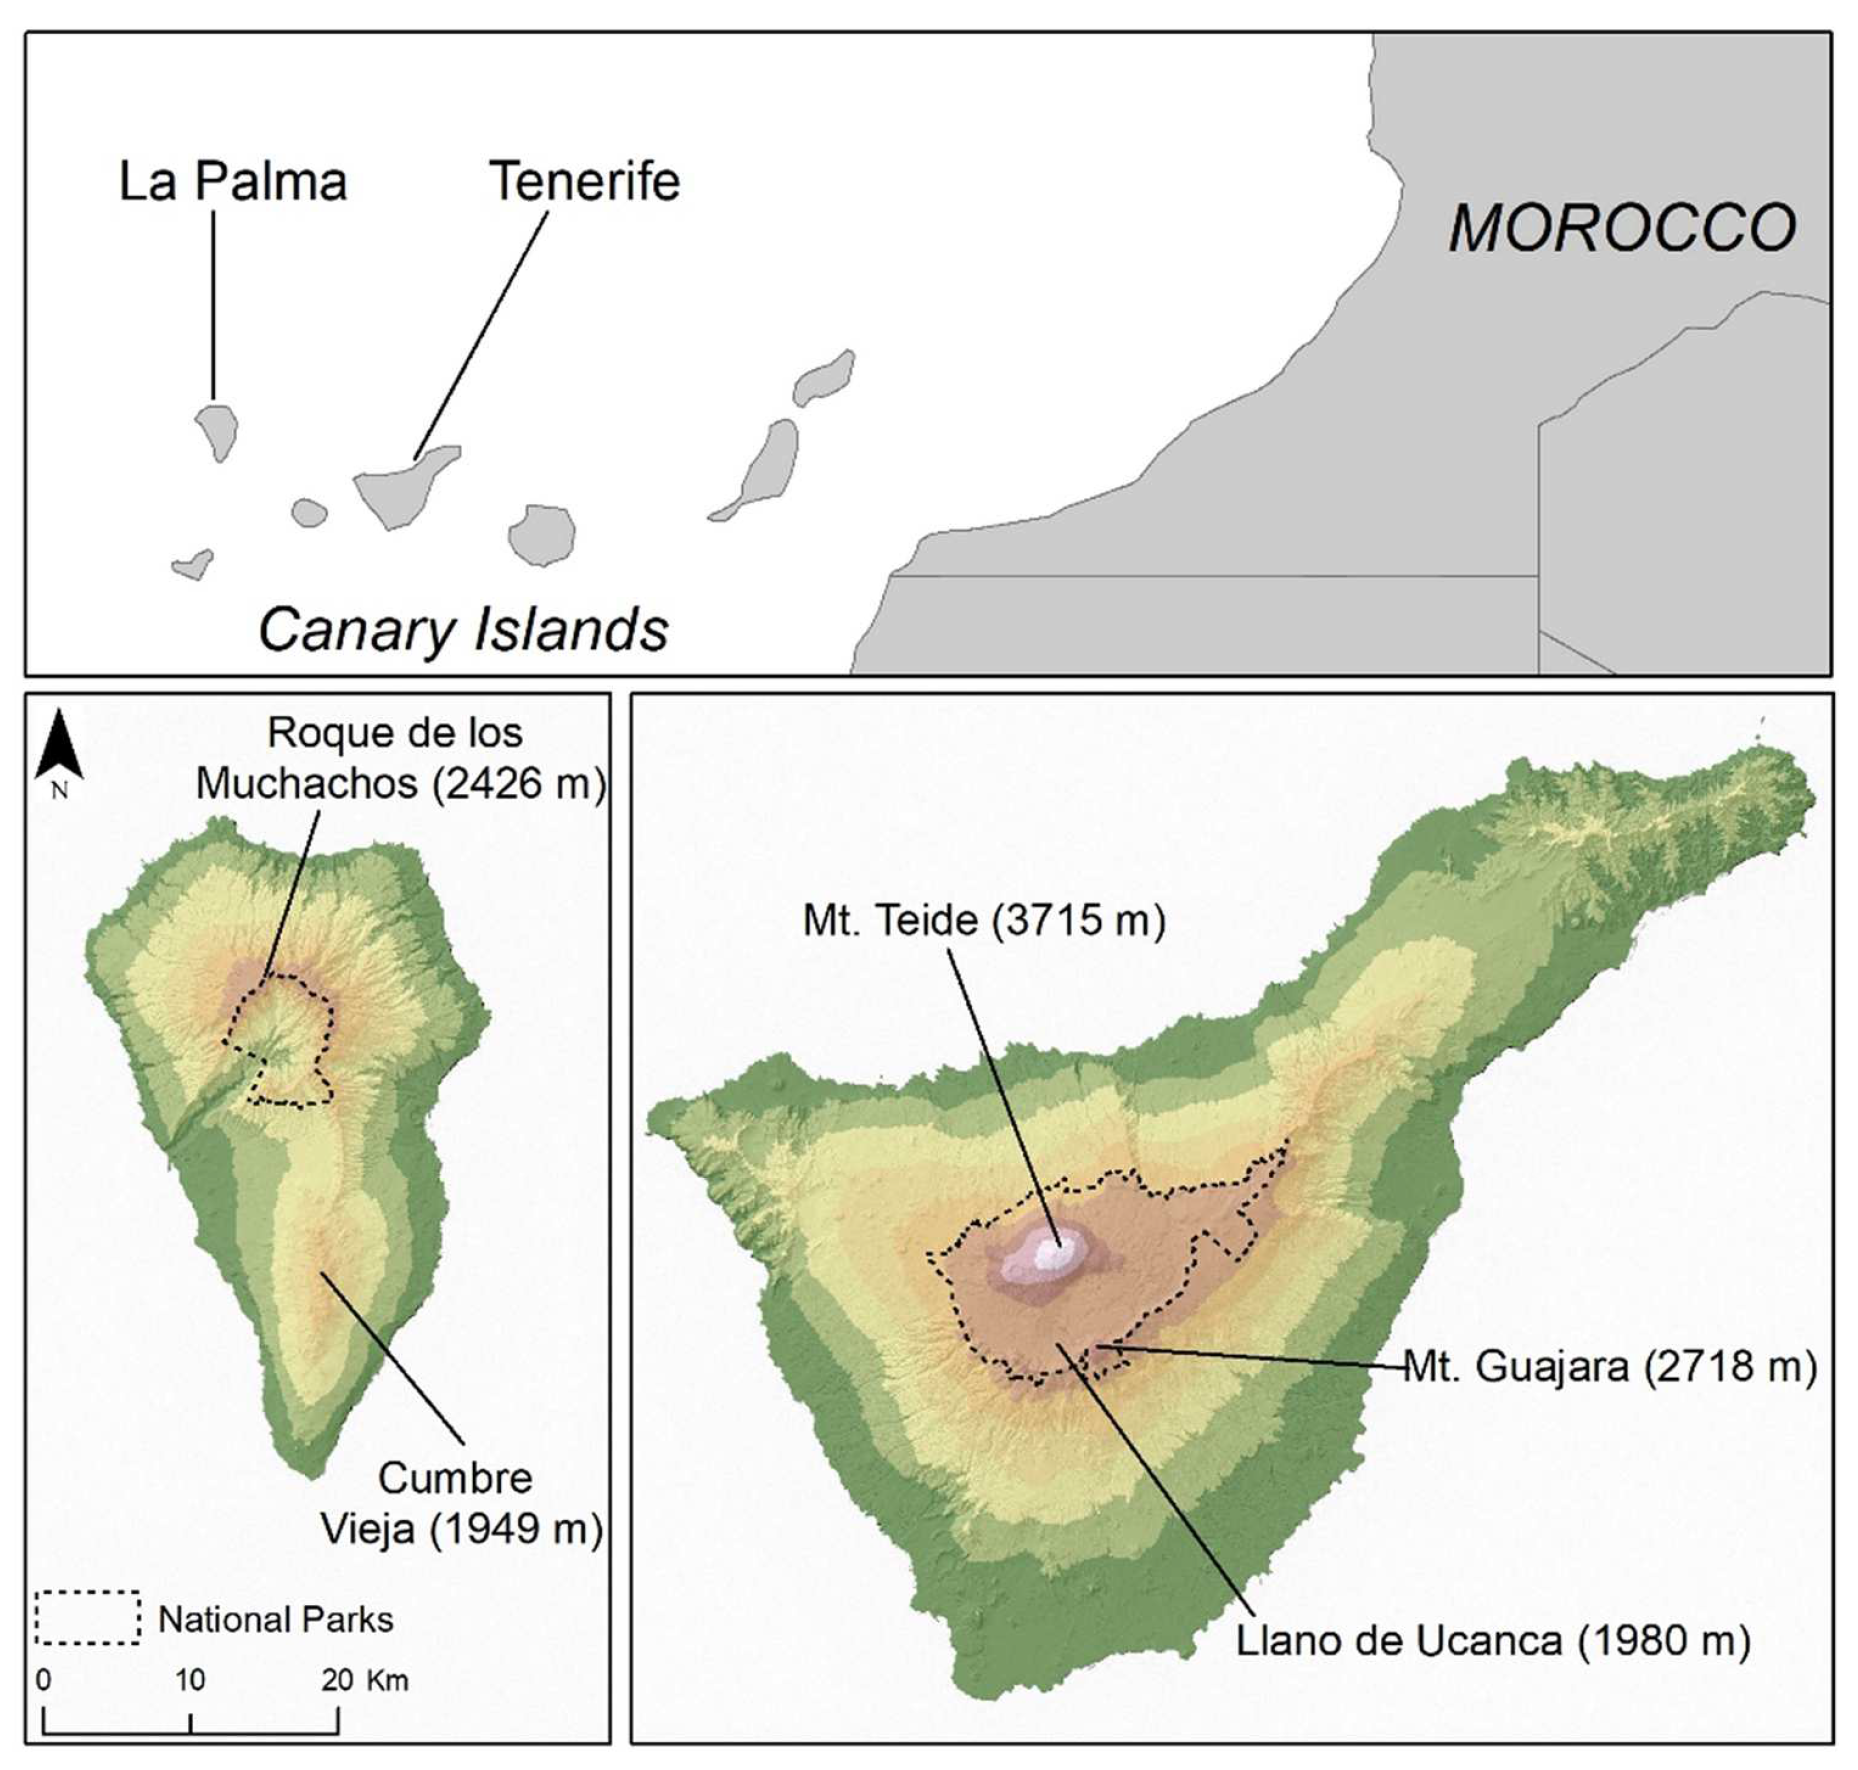
2.1. Study Area and Species Data

The study area is located around the highest peaks of La Palma and Tenerife in the Canary Islands (Figure 1). On La Palma, those areas coincide with part of Caldera de Taburiente National Park (2426 m maximum height) in the north of the island and also Cumbre Vieja (1949 m) in the south. On Tenerife, the study area mostly coincides with elevations above 2000 m, where El Teide National Park is located, and with its maximum elevation at El Teide stratovolcano at 3715 m. Both islands, La Palma and Tenerife, have many ecosystem-defining species in common in the alpine ecosystem, but a high proportion of single island endemics also exists. The relative frequencies of species may also differ among the alpine regions.
The occurrence data of alpine species were obtained from the Banco de Datos de Biodiversidad de Canarias: http://www.biodiversidadcanarias.es/biota (accessed on 10 March 2021) containing species records with approximately 500 m spatial accuracy. In addition, we used internal databases from National Parks as well as inventories from our research group with a location accuracy of 250 m or less. All of these data were carefully supervised so that the points coincided with areas where there are real populations despite the existing differences in accuracy. The list of species analyzed in this study include 47 species endemic to the Canary Islands. They have been classified as 17 Canarian endemics (present on both islands) and 30 single island endemics (17 from Tenerife and 13 from La Palma) and also categorized as threatened (14) and non-threatened species (33) according to the Banco de Datos de Biodiversidad de Canarias and the Centinela Database: https://www.biodiversidadcanarias.es/centinela (accessed on 10 March 2021). The complete list of species with their classifications is available as Appendix A Table A1.

2.2. Climate Data

Monthly climate data for precipitation and temperature for the period from 1959 to 2019 were obtained from a total of 113 meteorological stations with temperature data and 207 meteorological stations with precipitation data, provided by Agencia Estatal de Meteorología (AEMET), covering not only Tenerife and La Palma but also the nearby islands of La Gomera and El Hierro, which can help fill the climatic data gap between the two study islands. We homogenized monthly data to cover possible gaps in the series using the package ‘climatol’ of the R programming environment [34,35] and then split the data into two different periods: from 1959–1989 (labelled as “recent past” in this paper) and from 1990–2019 (referred to as the “present” period) for the purpose of quantifying past climate change as the difference between these two periods.
Climate data from weather stations were interpolated to a 200 × 200 m grid using a multiple regression approach to predict temperature with the ‘lm’ function of the R programming environment [34]. Interpolations for precipitation, which can have more complex spatial patterns, were implemented similarly with a machine learning method: ‘randomForest’ for the R programming environment [36]. A goodness-of-fit of climate surfaces was evaluated as out-of-bag explained variance (R2) in the weather station data, with all interpolated climate grids exceeding 85% variance explained in the weather station data.
Future climate change projections were represented by an average ensemble model calculated from MIROC-ESM-CHEM, BCC, and MRI-CGCM3 of the CMIP5 multimodel dataset [37]. These three models represent a wide range of possible futures, each representing a cluster of similar models [37], and cover a range of different projections for the Canary Islands. We analyzed projections for the representative concentration pathway (RCP) scenario 8.5 for the 2041–2060 and 2061–2080 periods. As such, our choices represent a pessimistic emission scenario and an ensemble average of a representative set of general circulation models. Although analyzing multiple model habitat predictions in a sensitivity analysis for different future climate projections would be interesting, this is beyond the scope of this study.
As further documentation of what our chosen model projection represents, projections relative to the present period were +1.2 °C with a decrease of −7.1% for precipitation in the RCP 8.5 2041–2060 scenario, while for RCP 8.5 2061–2080, the values were +2.0 °C and −11.9%, respectively. This compares to an observed mean increase in temperature of +0.5 °C and a decrease of −6.5% in precipitation compared with the present period (1959–1989) relative to the past climate (1990–2019) across the western islands of the archipelago. The future model projections are therefore in the same direction and of a magnitude consistent with climate change already observed in the past.
Our rationale for the chosen “past” and “present” observational periods and future time steps was to maximize potential inferences for conservation action. The time steps potentially allow us to demonstrate that climate change has already occurred at substantial magnitude, and since conservation objectives are usually long term, we chose the 2041–2060 period, which is predicted with relatively high certainty in terms of the variability in model projections, as well as the 2061–2080 period, which provides a longer term outlook.
The projections from general circulation models were downscaled to match the 200 × 200 m grid with the delta method relative to the 1990–2019 “present” period, using the R programming environment [34]. Subsequently, bioclimatic variables were derived from monthly climate grids as candidates for species distribution and biotic velocity modeling, including mean annual temperature, mean maximum temperature of the warmest month, mean minimum temperature of the coldest month, annual precipitation, and precipitation of the driest month [32], but to minimize autocorrelation issues, we discarded variables that were highly correlated with other selected variables (mean annual temperature and precipitation of the driest month).

2.3. Modeling and Analysis

Climatically suitable habitat was implemented with Maxent v3.4.1. [38], which is recommended in cases with limited presence-only data as is typically the case for rare species [39]. The performance of the model for each species was evaluated with the Area Under the Curve (AUC) statistic, with species yielding AUCs higher than 0.75 and most of them above 0.95. Good model fit statistics (AUC values above 0.80) are common for alpine species that occur along relatively distinct elevation bands, and our modeling results conformed to this expectation. As a cut-off value for suitable habitat, we used the 10th percentile of training presence data, which omits some areas with low habitat suitability but allows for a more robust delineation of the climate niche [38]. From spatial habitat projections for individual species, we calculated the amount of suitable climate habitat in units of hectares under the different scenarios and the percentage increase or decrease with respect to the present period.
The biotic velocity of climate change was calculated using the binary suitability maps of the previous section. Biotic velocity was calculated as the distance that the species had to migrate to find the same value of habitat suitability from the past to the present and from the present to projected future habitat maps, divided by the time period that separates each period with respect to the present. For the calculation, we used a modified algorithm that generates pixel-level distance maps for each species under the different scenarios [40]. To calculate the mean value per species and scenario expressed in m/year, we considered only the pixel values in which there was a change from presence to absence and from absence to presence as a measure of the overall distance of a species’ habitat shift between time intervals.
Further, we analyzed a set of geographical variables as potential obstacles to species’ migration paths. These variables included the mean elevation and slope values between the source and target habitat of each species as potential factors that can hinder migration. For some species, it may be more difficult for propagules to travel to higher elevations or to establish on terrain with steep slopes [41,42]. Further, we also calculated how much of the potential species’ habitat is under human use (farmlands or urban areas) or disturbed by relatively recent volcanic flows, where seed establishment may be impeded by undeveloped soils. We calculated the percentage of potential species’ habitat occupied by the polygons of those categories from the CORINE Land Cover Database https://land.copernicus.eu/pan-european/corine-land-cover/clc2018 (accessed on 10 March 2021).
Lastly, we performed non-parametric Mann–Whitney U tests to determine the statistical significance of differences in climate habitat, biotic velocity, and geographic barrier values among different groups of species (threatened vs. non-threatened, single-island endemic vs. Canarian endemics), islands (La Palma vs. Tenerife) and geographic barriers across time periods (past, present, and future projections).

3. Results

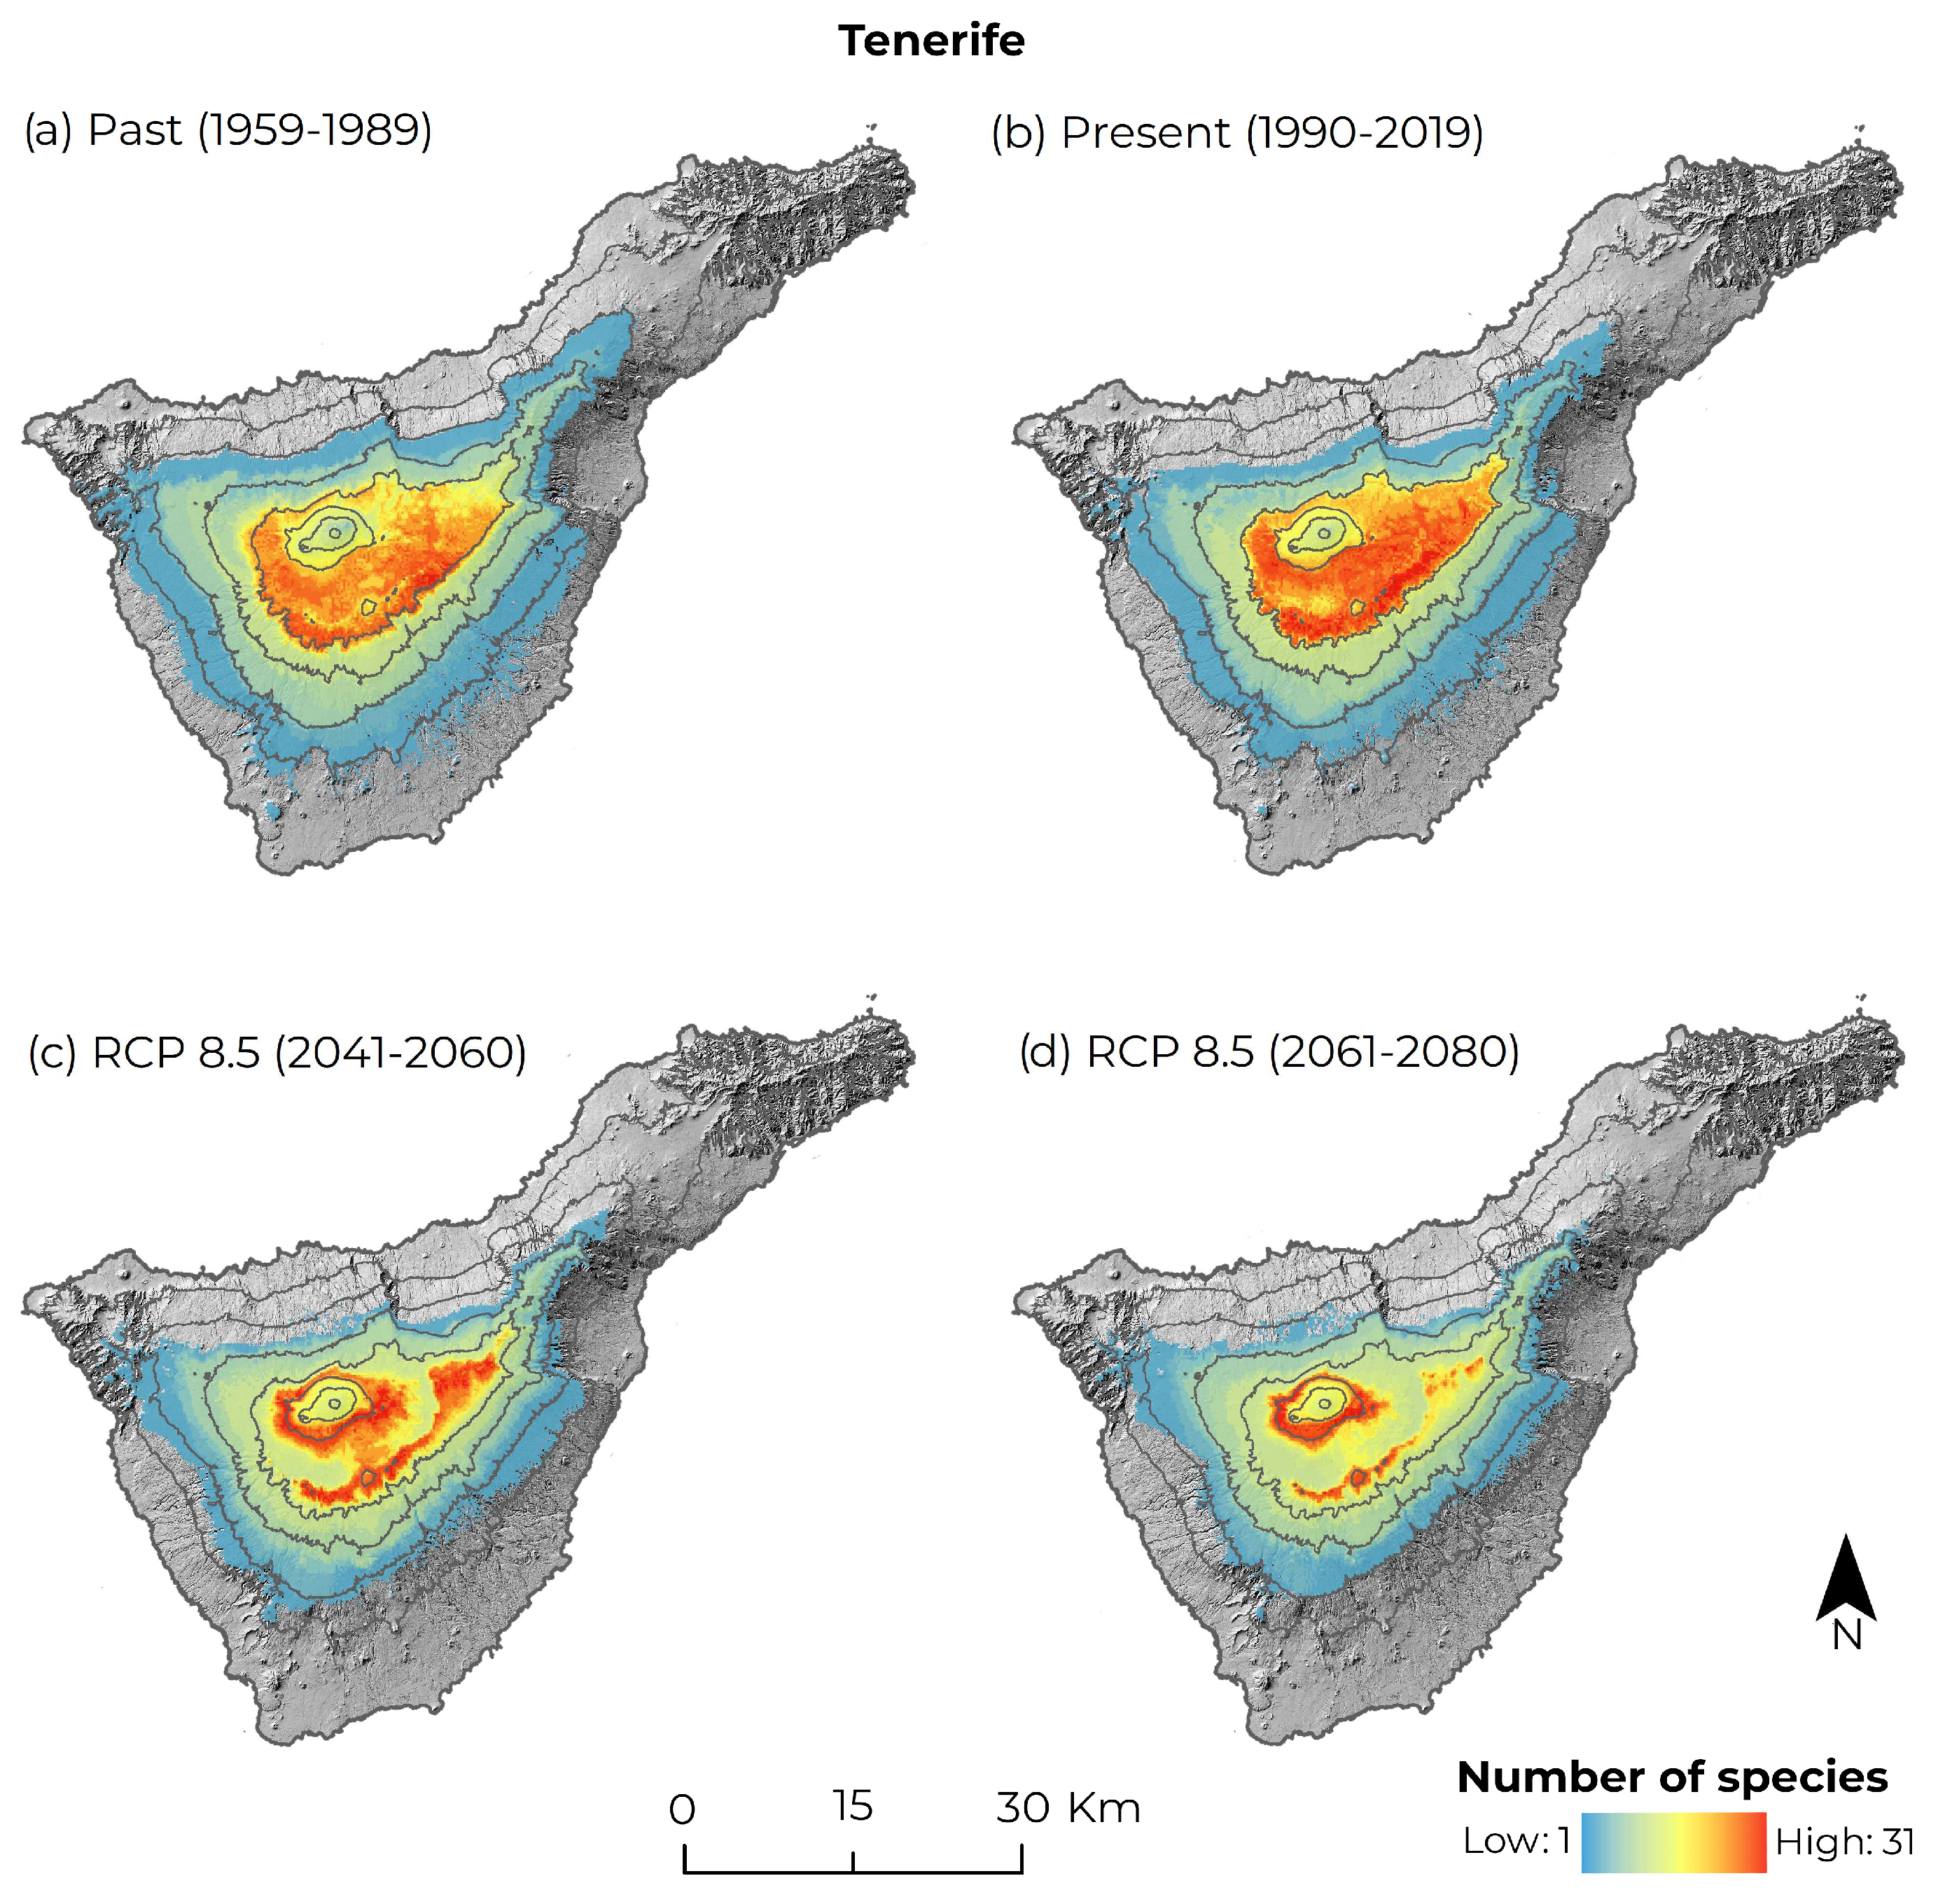
3.1. Changes in Suitable Climate Habitat

Evaluating overall changes to the modeled climate habitat of all species jointly, we observed a general trend of habitat contraction, which was much more pronounced on La Palma than on Tenerife for historical climate change but fairly similar for the two islands under future projections (Table 1). Most species of La Palma showed habitat contractions due to a displacement to a higher elevation under observed climate change (Figure 2a vs. Figure 2b).
In contrast, many species on Tenerife still showed an expansion dynamic under observed climate change (Figure 3a vs. Figure 3b) to relatively flat areas at the base of Mt. Teide or the northeast of the National Park, driven by species such as Bencomia exstipulata, Descurainia gonzalezii or Echium wildpretii (individual species maps not shown). However, this habitat buffer on Tenerife is not predicted to be a stable refugium into the future. Under the RCP 8.5 future scenario, we found sizable reductions for all species groups (Figure 3c,d), with some exceptions for individual species such as Plantago webbii and Descurainia gonzalezii on Tenerife or Helianthemun cirae, Andryala pinnatifida subsp. Pinnatifida, and Erysimum scoparium on La Palma.
Comparing threatened versus non-threatened species groups, threatened species generally showed a higher proportional habitat loss, although differences considering both islands together were not always statistically significant (Table 1). The same applies to the comparison between single island endemics and Canarian endemics.
To point out some individual species results relevant for setting conservation priorities, observed climate habitat contractions under observed climate trends on La Palma were largest for two Canarian endemics, Cheirolophus teydis (−60.3%) and Adenocarpus viscosus (−53.3%), and a single island endemic, Helianthemum cirae (−57.8%). Tenerife showed the greatest reductions for two vulnerable species and one endangered single island endemic: Silene nocteolens (−51.9%), Viola cheiranthifolia (−46.7%), and Rhaponticum canariense (−42.0%), respectively. Statistics of habitat changes for all species are provided in Appendix A Table A1.
Regarding future projections, the largest climate habitat reductions were predicted for two threatened single-island endemics on La Palma, Viola palmensis (−91.7%), Genista benehoavensis (−91.3%), and a Canarian endemic, Nepeta teydea (−99.2%) by 2061–2080, which were also the most affected species for 2041–2060 with more moderate reductions (63–82%). On Tenerife, the most severe reductions by 2041–2060 were predicted for two single island endemics: Echium auberianum (−75.3%), Laphangium teydeum (−57.5%, threatened) and the Canarian endemic Descurainia bourgeauana (−55.7%). For 2061–2080, again E. auberianum (−92.3%), and also the single island endemism Argyranthemum teneriffae (−80.0%) and the threatened Canarian endemic Cytisus supranubius (−75.7%) were most affected.

3.2. Biotic Velocity of Climate Change

The values of the biotic velocity of climate change were variable. The metric depends on whether the species were sensitive to predicted changes in temperature and precipitation but also on geographical barriers that species face (e.g., areas of lower elevation located between areas of higher elevation). In general, we observed that based on historic climate change (past to present), migration requirements were higher on La Palma than on Tenerife (Table 1). This occurs because of the afore-mentioned loss of suitability in Cumbre Vieja (Figure 2, habitat around the southern peak), so the species would be required to migrate to the north of the island to find habitat equivalent to their historic climate niche (i.e., Pimpinella cumbrae and Descurainia bourgaeana with more than 120 m/year).
The overall ranking of biotic velocities for La Palma versus Tenerife changed for future projections relative to present (Table 1). This occurs because on Tenerife, many species reach local maxima in elevated areas of the volcanic caldera border (Figure 3b,c, southern ring of red color) and subsequently find suitable areas approximately 5 km north on the main stratovolcano. This generates relatively high values of biotic velocity (25–40 m/year) for a number of species (Echium auberianum, Rhaponticum canariense, Viola guaxarensis). Biotic velocity statistics are reported in Appendix A Table A1 for each species. Summary statistics show that migration requirements are higher for threatened species, primarily observed on Tenerife and both islands together but not on La Palma separately (Table 1). Migration requirements were also higher for single island endemics versus Canarian endemics, especially in the future, although differences were not statistically significant.

3.3. Geographical Obstacles to Migration

In general, we observed an increase in the importance of obstacles to migration across the different scenarios (Figure 4). The species would migrate to more elevated areas (from a mean value of 2073 m in the recent past to 2413 m in 2061–2080), to areas with higher slopes (from 20.6° to 23.5°), and to areas with higher proportions of geologically young landscapes (8.2% to 15.3%). All these increases were significantly higher on Tenerife (see Figure 4). Human uses (farmlands or urban areas) had a low and decreasing impact in both islands (Figure 4), as they are the furthest ecosystem from the main urban population centers.

4. Discussion

Generally, our results support the notion that alpine climate habitat has increased in elevation and niche reduction, which has already occurred and will continue to be an issue for most of the species in the alpine ecosystem of La Palma and Tenerife, conforming to previous research [19,20,21,22,43,44]. We note that our research is grounded in already observed climate change trends. With observed trends conforming in magnitude and direction to general circulation models, a stronger case can be made for the need to address climate change impacts [45]. Global warming has been monitored on Tenerife, revealing an increase in the mean temperature of 0.14 ± 0.07 °C/decade for the period 1944–2010 [18], and droughts have become an increasingly recurrent phenomenon in recent years [46]. These changes are evident in our results, which include more recent temperature and precipitation data in the current scenario, covering the period 1990–2019. Overall, species climatic habitat has already been reduced by approximately 20% over the last 30 years, showing a mean velocity of response to climate change of 30 m/year in this case in both reduction and expansion processes depending on the species.
Different responses of similar groups of species have been described on islands that share part of their flora [47], as a consequence of differences in the species composition and localization or in the island extension, maximum elevation or relief configuration. In our case, on La Palma, most of the selected species are currently located inside the Caldera de Taburiente National Park and surroundings, so the models showed preference for that area. However, most of the species also showed certain suitability for the Cumbre Vieja area, which has a maximum elevation of 1949 m. As higher parts of that mountain chain fall within the lower limit of the alpine ecosystem and the upper limit of the pine forest, it is climatically a suitable area for many of the selected species, despite that some of them are not currently present. Future projections extend the potential for losing biodiversity for all of the summits of La Palma, with the same time habitat concentration and reductions for almost all species in the highest areas of La Caldera de Taburiente National Park, which barely currently harbor 1500 ha of suitable ecosystems [48]. On the contrary, Cumbre Vieja mountain region was identified as the area with the highest biotic velocities and likely losing all suitable alpine habitat in the long-term, so it should therefore not be the main focus of targeted conservation efforts. In terms of practical assisted migration recommendations for La Palma, the movement of Cumbre Vieja populations to the north of the island would not appear necessary, as those species also occur on the slopes of the Roque de los Muchachos mountain range in the north, where the habitat for alpine species is predicted to be maintained at a higher elevation. That said, species populations with a low regeneration rate and dispersal capability should be monitored or reinforced to increase their persistence in the southern alpine area. While it is possible to rank species according to their dispersal capabilities from known life history traits, from a practical perspective it may be more effective to monitor which alpine species have possibilities to migrate to higher elevation positions by themselves and restrict human intervention to those in decline [49,50].
The situation is somewhat different for Tenerife, being apparently more favorable for some species because the alpine area here is considerably higher and more extensive than that on La Palma [48]. However, the main summits of Tenerife have different elevations (Mt. Teide 3718 m, and Mt. Guajara 2718 m) and are separated by a valley at least 5 km wide, a factor that increases biotic velocity values for many species, and it likely prevents migration from the lower to the higher summit areas. Two species groups can be distinguished, those that currently are located at maximum elevations and tend to go higher (surroundings of Mt. Teide and Mt. Guajara) and others that are still entering to the flatter areas from the base of Mt. Teide, which explains some of the different behaviors between species or even the same species on different islands [47]. The changes from past to present reveal a concentration of biodiversity at the base of Mt. Teide and the surrounding areas of the volcanic caldera, which are the main future biodiversity refugia on this island.
In terms of practical recommendations for Tenerife, human-assisted migration efforts should be considered for species that currently only occur on Mt. Guajara but may find habitat in the future on Mt. Teide. An example target species is Viola guaxarensis, which is an endemic of Mt. Guajara and is already located at the top of that mountain [43,44], showing potential area reduction and increasing biotic velocity values across scenarios. It should be assisted to migrate to the Teide-Pico Viejo area, as long as possible hybridization problems with the also endemic V. cheiranthifolia can be avoided. Other species with currently few individuals or surviving in exclosures on the National Park may also require assisted migration to achieve their expected trajectories (e.g., Rhaponticum canariense, Bencomia exstipulata).
While our study mostly focuses on climatic habitat suitability and biotic velocity, other extrinsic and intrinsic factors need to be considered when developing conservation strategies and assisted migration prescriptions. External factors can hinder the arrival and establishment of migrants, such as elevated or steep slopes [13] or geologically recent areas and rocky areas with scarce soil development [42], as our data show especially on Tenerife. Other factors that can inhibit the expected species trajectories showed by the models but that have not been considered in this study are the presence of invasive herbivores (Barbary sheep, mouflons, and rabbits) [51,52,53,54] or trait-based factors of species [55,56] such as their current location, number of individuals, and seed dispersion methods, which are especially important for threatened species [44]. Our study highlights a general trend of higher vulnerability of threatened and single island endemics in some of the addressed scenarios, as also found elsewhere [57] although it was not always significant, which could reveal there are also some common species with high vulnerability. Lastly, the climate change refugia identified in this study carry inherent geological risks, highlighted by the recent resurgence of volcanic activity in Cumbre Vieja, also likely to occur in El Teide National Park, where partial extinctions of species due to volcanic activity have been already documented [58].
Nevertheless, it appears there are no other options for alpine endemics than high elevation climatic refugia close to the volcanic peaks. This is underscored by the observation that natural species migration from lower elevation ecosystems into alpine ecosystems has already been documented [8,9,10]. In the case of the Canary Islands, species occurring in forested ecosystems, such as Pinus canariensis, Argyranthemum adauctum or Descurainia gonzalesii, are particularly prone to encroach higher alpine ecosystems, enabled by the increase in minimum temperature [20,21]. Our maps show a potential concentration of alpine species in high elevation areas, which is in line with the observed dynamics in alpine ecosystems elsewhere [8,9,10]. However, the effect of increased species richness may be transitory [9,50] and dependent on migration ability [50]. Ultimately, high-elevation, cold-adapted specialists, which also tend to be endemics in small mountain ranges, are expected to be outcompeted in the upper alpine areas [7,10,50,59].
The encroachment of upper alpine areas and implied loss of habitat for cold-adapted specialists could further be exacerbated by an increase in mesonitrophilic and hemicryptophytic species, which has been observed in alpine environments due to their ability to be better adapted to drought conditions [1,2,60]. In our study area, dominant alpine species such as the keystone legume Cytisus supranubius are already showing declining dynamics due to droughts and herbivory, while others with nitrophilic behavior are increasing (Pterocephalus lasiospermus) [23,52,54,61]. This trend is supported by our models, with P. lasiospermus persisting in a better way and with lower biotic velocity values than the currently dominant C. supranubius. Lastly, an impoverishment of the lower areas of the current alpine ecosystem appears plausible in our case, as Canarian pine forests harbor considerably fewer species after centuries of exploitation, fires and the impact of invasive herbivores [21,48].
In conclusion, this analysis combining species distribution modeling and biotic velocity response to climate change has identified temporary and longer-term climate change refugia for species that compose the Canarian alpine ecosystem. We show in this case study that the approach allows for general conservation planning in areas that harbor high rates of endemicity. Individual species-level breakdowns, partially shown in this study, will be useful for local managers and decision makers, allowing them to identify potential refuges and sinks for species as prior and complementary support for any decision related to the conservation of the selected species. Our study also complements other research in highlighting the vulnerability and lack of options to conserve and maintain rare plant communities in island positions if efforts to reduce greenhouse gas emissions continue to be unsuccessful.

Author Contributions

Conceptualization, V.B.-R., A.H. and J.M.G.-M.; methodology, V.B.-R. and A.H.; formal analysis, V.B.-R., J.C. and A.H.; investigation, V.B.-R., J.M.G.-M. and J.C.; data curation, V.B.-R.; writing—original draft preparation, V.B.-R., A.H. and J.M.G.-M.; writing—review and editing, J.L.M.-E., M.J.D.A. and J.C.; visualization, V.B.-R. and J.C.; supervision, J.M.G.-M.; funding acquisition, J.M.G.-M. All authors have read and agreed to the published version of the manuscript.

Funding

This research was funded by two projects from Ministerio para la Transición Ecológica y el Reto Demográfico through its Fundación Biodiversidad (project ESTREDVUL) and Organismo Autónomo de Parques Nacionales (REF: 2656/2020) and another by Agencia Canaria De Investigación Innovación y Sociedad de la Información from the Canary Islands Government through its program for I + D RIS-3 projects cofunded in an 85% by the European Regional Development Fund (FEDER, 2014–2020) (ProID2020010122).

Data Availability Statement

The data presented in this study are openly available in the Figshare Repository at [https://doi.org/10.6084/m9.figshare.19221618.v3 accessed on 5 June 2023].

Acknowledgments

We are very grateful to Angel Palomares, Bruno Yanes, Ruymán D. Cedrés, and Lia Pitti for their assistance during the initial data collection phase of this study.

Conflicts of Interest

The authors declare no conflict of interest.

Appendix A

Table A1. Potential climate habitat and biotic velocities for Canarian (CAN) and single-island (SI) endemics on La Palma (LP) and Tenerife (TF). Both threatened (T) and non-threatened (NT) alpine plant species were included in this study. Time periods include the recent past (RP) between 1959 and 1989, present (P) from 1990–2019, and future RCP 8.5 projections for 2041–2060 (2050) and for 2061–2080 (2070). Odontites hollianus, which has a Macaronesian distribution and few individuals in La Palma was included in the CAN and T categories.
SpeciesIslandEndemicStatusClimatic Habitat (ha and % Change)Biotic Velocity (m/yr)
RPP20502070RP-PP-2050P-2070
Adenocarpus viscosusLPCANNT24,17712,044 (−50.2)10,632 (−11.7)9204 (−23.6)29.16.89.3
TFCANNT57,10852,280 (−8.5)47,344 (−9.4)43,180 (−17.4)15.213.512.6
Andryala pinnatifida ssp. pinnatifidaLPCANNT17,6618248 (−53.3)11,453 (38.9)11,818 (43.3)26.78.66.7
Andryala pinnatifida subsp. teydeaTFCANNT13,97217,104 (22.4)11,084 (−35.2)6268 (−63.4)201313.6
Argyranthemum haouarytheumLPSINT21,10412,038 (−43)10,919 (−9.3)9558 (−20.6)30.710.111.1
Argyranthemum tenerifaeTFSINT18,51618,794 (1.5)8828 (−53)3760 (−80)18.916.418.6
Arrhenatherum calderaeLPCANNT53682416 (−55)1536 (−36.4)944 (−60.9)90.710.49.5
TFCANNT18,80018,236 (−3.0)9708 (−46.8)4524 (−75.2)16.514.216.2
Bencomia exstipulataLPCANT87165128 (−41.2)2769 (−46)1632 (−68.2)31.813.614.8
TFCANT13,31218,856 (41.6)17,152 (−9)11,396 (−39.6)19.914.311.5
Bethencourtia palmensisLPCANNT13,5606877 (−49.3)6828 (−0.7)6200 (−9.8)36.2711.9
TFCANNT12,90212,288 (−4.8)10,301 (−16.2)6625 (−46.1)12.811.511
Carlina xeranthemoidesTFSINT15,33218,898 (23.3)13,359 (−29.3)8398 (−55.6)2011.713
Cerastium sventeniiLPCANNT11,1536092 (−45.4)4324 (−29)3288 (−46)37.68.57.8
TFCANNT60846145 (1)5369 (−12.6)4264 (−30.6)12.29.110.1
Cheirolophus teydisLPCANNT66962660 (−60.3)2604 (−2.1)2352 (−11.6)74.37.16.6
TFCANNT12,30011,916 (−3.1)10,208 (−14.3)6691 (−43.9)12.711.710.3
Cicer canarienseLPCANT21,29019,088 (−10.3)14,913 (−21.9)12,577 (−34.1)17.911.39.6
TFCANT50,74156,380 (11.1)62,620 (11.1)59,531 (5.6)19.221.724.4
Cistus osbeckiifoliusTFSINT25,95228,996 (11.7)27,748 (−4.3)24,584 (−15.2)25.410.29.1
Cytisus supranubiusLPCANT42922608 (−39.2)1112 (−57.4)336 (−87.1)52.610.515.5
TFCANT19,93619,328 (−3)10,004 (−48.2)4706 (−75.7)18.615.217.6
Descurainia bourgeauanaLPCANNT30511633 (−46.5)964 (−41)634 (−61.2)124.819.99
TFCANNT30,68921,778 (−29)9656 (−55.7)5820 (−73.3)18.620.324
Descurainia gilvaLPSINT11,8366268 (−47)4340 (−30.8)3128 (−50.1)24.920.714.3
Descurainia gonzaleziiTFSINT616810,494 (70.1)12,660 (20.6)11,001 (4.8)17.212.19.6
Echium auberianumTFSINT20,77214,396 (−30.7)3560 (−75.3)1108 (−92.3)13.230.938.8
Echium gentianoidesLPSINT61093161 (−48.3)1884 (−40.4)1112 (−64.8)81.59.99.7
Echium pereziiLPSINT81974093 (−50.1)2892 (−29.3)2124 (−48.1)89.19.88.8
Echium webbiiLPSINT23,78914,312 (−39.8)15,461 (8)14,253 (−0.4)27.89.88.4
Echium wildpretiiTFSINT735613,016 (76.9)11,568 (−11.1)7512 (−42.3)2012.711.4
Erigeron calderaeTFSINT11,31515,824 (39.9)9021 (−43)4625 (−70.8)20.913.116.7
Erysimum scopariumLPCANNT16,2626356 (−60.9)7822 (23.1)7545 (18.7)286.96
TFCANNT49,42442,738 (−13.5)34,323 (−19.7)29,073 (−32)14.412.314.3
Genista benehoavensisLPSIT47082608 (−44.6)912 (−65)228 (−91.3)63.511.915.9
Helianthemum ciraeLPSINT51582176 (−57.8)2792 (28.3)2728 (25.4)23.86.56
Helianthemum juliaeTFSIT12,35215,606 (26.3)8780 (−43.7)4088 (−73.8)19.613.514.8
Juniperus cedrusLPCANT24,36822,712 (−6.8)19,524 (−14.0)14,512 (−36.1)316.77.9
TFCANT21,36520,300 (−5)15,714 (−22.6)10,593 (−47.8)12.78.510.3
Lactuca palmensisLPSINT19,24111,864 (−38.3)8481 (−28.5)6597 (−44.4)27.110.510.1
Laphangium teydeumTFSIT13,4326714 (−50.0)3121 (−53.5)2416 (−64.0)19.563.449.7
Micromeria lachnophyllaTFSINT19,23918,544 (−3.6)10,226 (−44.9)5958 (−67.9)16.313.514.4
Nepeta teydeaLPCANNT25041464 (−41.5)268 (−81.7)12 (−99.2)211729.2
TFCANNT17,39815,942 (−8.4)9244 (−42)4452 (−72.1)12.313.715.5
Odontites hollianusLPCANT10,5266936 (−34.1)4196 (−39.5)2618 (−62.3)110.811.211.9
Pimpinella cumbraeLPCANNT10,5626925 (−34.4)4200 (−39.4)2600 (−62.5)130.511.211.5
TFCANNT24,22015,964 (−34.1)12,836 (−17.1)9572 (−40.0)25.411.212
Plantago webbiiLPCANNT11,8966500 (−45.4)5640 (−13.2)4677 (−28)45.59.79.8
TFCANNT12,82012,568 (−2.0)8756 (−26.7)5064 (−59.7)13.412.611.6
Pterocephalus lasiospermusTFSINT75,38666,845 (−11.3)60,415 (−9.6)56,610 (−15.3)1410.211
Pterocephalus porphyranthusLPSINT17,23212,297 (−28.6)8404 (−31.7)6136 (−50.1)15.78.59.4
Rhamnus integrifoliaTFSIT108,68698,346 (−9.5)95,913 (−2.5)91,077 (−7.4)46.915.714.9
Rhaponticum canarienseTFSIT17,93710,397 (−42)4408 (−57.6)3040 (−70.8)11.221.135.5
Scrophularia glabrataLPCANNT14,66512,872 (−12.2)6577 (−48.9)4072 (−68.4)11.513.114.8
TFCANNT18,60918,748 (0.7)12,021 (−35.9)5992 (−68)14.812.314.2
Silene nocteolensTFSIT99084768 (−51.9)2560 (−46.3)2068 (−56.6)1960.242.9
Silene pogonocalyxLPSINT15,1287505 (−50.4)6889 (−8.2)5756 (−23.3)33.7119
Teline stenopetalaLPSINT19,50510,005 (−48.7)8572 (−14.3)7092 (−29.1)35.29.712.1
Tolpis calderaeLPSINT16,83312,808 (−23.9)7292 (−43.1)5489 (−57.1)16.51653.9
Tolpis webbiiTFSINT17,05718,254 (7)10,332 (−43.4)4904 (−73.1)1813.815.7
Viola cheiranthifoliaTFSIT70223745 (−46.7)2332 (−37.7)1860 (−50.3)19.640.825.3
Viola guaxarensisTFSIT79606152 (−22.7)4148 (−32.6)3132 (−49.1)11.415.520.6
Viola palmensisLPSIT29881784 (−40.3)648 (−63.7)148 (−91.7)21.111.916.7

References

  1. Evangelista, A.; Frate, L.; Carranza, M.L.; Attorre, F.; Pelino, G.; Stanisci, A. Changes in composition, ecology and structure of high-mountain vegetation: A re-visitation study over 42 years. AoB Plants 2016, 8, plw004. [Google Scholar] [CrossRef] [Green Version]
  2. Feeley, K.J.; Bravo-Avila, C.; Fadrique, B.; Perez, T.M.; Zuleta, D. Climate-driven changes in the composition of New World plant communities. Nat. Clim. Chang. 2020, 10, 965–970, Erratum in Nat. Clim. Chang. 2020, 10, 1062. [Google Scholar] [CrossRef]
  3. Palomo, I. Climate change impacts on ecosystem services in high mountain areas: A literature review. Mt. Res. Dev. 2017, 37, 179–187. [Google Scholar] [CrossRef] [Green Version]
  4. Pereira, H.M.; Leadley, P.W.; Proenca, V.; Alkemade, R.; Scharlemann, J.P.W.; Fernandez-Manjarres, J.F.; Araujo, M.B.; Balvanera, P.; Biggs, R.; Cheung, W.W.L.; et al. Scenarios for global biodiversity in the 21st century. Science 2010, 330, 1496–1501. [Google Scholar] [CrossRef] [PubMed] [Green Version]
  5. Wiens, J.J. Climate-related local extinctions are already widespread among plant and animal species. PLoS Biol. 2016, 14, e2001104. [Google Scholar] [CrossRef] [Green Version]
  6. Huxley, J.D.; Spasojevic, M.J. Area not geographic isolation mediates biodiversity responses of alpine refugia to climate change. Front. Ecol. Evol. 2021, 9, 633697. [Google Scholar] [CrossRef]
  7. Lamprecht, A.; Pauli, H.; Fernández Calzado, M.R.; Lorite, J.; Molero Mesa, J.; Steinbauer, K.; Winkler, M. Changes in plant diversity in a water-limited and isolated high-mountain range (Sierra Nevada, Spain). Alp. Bot. 2021, 131, 27–39. [Google Scholar] [CrossRef]
  8. Lenoir, J.; Gegout, J.C.; Marquet, P.A.; de Ruffray, P.; Brisse, H. A significant upward shift in plant species optimum elevation during the 20th century. Science 2008, 320, 1768–1771. [Google Scholar] [CrossRef]
  9. Steinbauer, M.J.; Grytnes, J.-A.; Jurasinski, G.; Kulonen, A.; Lenoir, J.; Pauli, H.; Rixen, C.; Winkler, M.; Bardy-Durchhalter, M.; Barni, E.; et al. Accelerated increase in plant species richness on mountain summits is linked to warming. Nature 2018, 556, 231–234. [Google Scholar] [CrossRef] [Green Version]
  10. Pauli, H.; Gottfried, M.; Dullinger, S.; Abdaladze, O.; Akhalkatsi, M.; Alonso, J.L.B.; Coldea, G.; Dick, J.; Erschbamer, B.; Calzado, R.F.; et al. Recent plant diversity changes on Europe’s mountain summits. Science 2012, 336, 353–355. [Google Scholar] [CrossRef] [Green Version]
  11. Nie, X.Q.; Yang, L.C.; Xiong, F.; Li, C.B.; Li, F.; Zhou, G.Y. Aboveground biomass of the alpine shrub ecosystems in Three-River Source Region of the Tibetan Plateau. J. Mt. Sci. 2018, 15, 357–363. [Google Scholar] [CrossRef]
  12. Nie, X.Q.; Wang, D.; Yang, L.C.; Zhou, G.Y. Controls on variation of soil organic carbon concentration in the shrublands of the north-eastern Tibetan Plateau. Eur. J. Soil. Sci. 2021, 72, 1817–1830. [Google Scholar] [CrossRef]
  13. Harter, D.E.V.; Irl, S.D.H.; Seo, B.; Steinbauer, M.J.; Gillespie, R.; Triantis, K.A.; Fernandez-Palacios, J.M.; Beierkuhnlein, C. Impacts of global climate change on the floras of oceanic islands—Projections, implications and current knowledge. Perspect. Plant Ecol. 2015, 17, 160–183. [Google Scholar] [CrossRef]
  14. Steinbauer, M.J.; Field, R.; Grytnes, J.A.; Trigas, P.; Ah-Peng, C.; Attorre, F.; Birks, H.J.B.; Borges, P.A.V.; Cardoso, P.; Chou, C.H.; et al. Topography-driven isolation, speciation and a global increase of endemism with elevation. Global Ecol. Biogeogr. 2016, 25, 1097–1107. [Google Scholar] [CrossRef]
  15. Flantua, S.G.A.; Payne, D.; Borregaard, M.K.; Beierkuhnlein, C.; Steinbauer, M.J.; Dullinger, S.; Essl, F.; Irl, S.D.H.; Kienle, D.; Kreft, H.; et al. Snapshot isolation and isolation history challenge the analogy between mountains and islands used to understand endemism. Global Ecol. Biogeogr. 2020, 29, 1651–1673. [Google Scholar] [CrossRef]
  16. Caujape-Castells, J.; Tye, A.; Crawford, D.J.; Santos-Guerra, A.; Sakai, A.; Beaver, K.; Lobin, W.; Florens, F.B.V.; Moura, M.; Jardim, R.; et al. Conservation of oceanic island floras: Present and future global challenges. Perspect. Plant Ecol. 2010, 12, 107–129. [Google Scholar] [CrossRef]
  17. Veron, S.; Mouchet, M.; Govaerts, R.; Haevermans, T.; Pellens, R. Vulnerability to climate change of islands worldwide and its impact on the tree of life. Sci. Rep. 2019, 9, 14471. [Google Scholar] [CrossRef] [Green Version]
  18. Martin, J.L.; Bethencourt, J.; Cuevas-Agullo, E. Assessment of global warming on the island of Tenerife, Canary Islands (Spain). Trends in minimum, maximum and mean temperatures since 1944. Climatic Chang. 2012, 114, 343–355. [Google Scholar] [CrossRef]
  19. Del Arco, M.J. La flora y la vegetación canaria ante el cambio climático actual. In Naturaleza Amenazada por los Cambios en el Clima Actas III Semana Científica Telesforo Bravo; Instituto de Estudios Hispánicos de Canarias: Puerto de la Cruz, Spain, 2008; pp. 105–140. [Google Scholar]
  20. Martín-Esquivel, J.L.; Marrero-Gómez, M.V.; González Mancebo, J.M. Efectos del cambio climático en la vegetación de la alta montaña de Tenerife. Ecosistemas 2021, 30, 2189. [Google Scholar] [CrossRef]
  21. Bello-Rodriguez, V.; Cubas, J.; Del Arco, M.J.; Martin, J.L.; Gonzalez-Mancebo, J.M. Elevational and structural shifts in the treeline of an oceanic island (Tenerife, Canary Islands) in the context of global warming. Int. J. Appl. Earth Obs. Geoinform. 2019, 82, 101918. [Google Scholar] [CrossRef]
  22. Renner, S.S.; Otto, R.; Martín-Esquivel, J.L.; Marrero-Gómez, M.V.; Fernández-Palacios, J.M. Vegetation change on Mt. Teide, the Atlantic’s highest volcano, inferred by incorporating the data underlying Humboldt’s Tableau Physique des Iles Canaries. J. Biogeogr. 2023, 50, 251–261. [Google Scholar] [CrossRef]
  23. Martín-Esquivel, J.L.; Marrero-Gomez, M.; Cubas, J.; Gonzalez-Mancebo, J.M.; Olano, J.M.; del Arco, M. Climate warming and introduced herbivores disrupt alpine plant community of an oceanic island (Tenerife, Canary Islands). Plant Ecol. 2020, 221, 1117–1131. [Google Scholar] [CrossRef]
  24. Morelli, T.L.; Barrows, C.W.; Ramirez, A.R.; Cartwright, J.M.; Ackerly, D.D.; Eaves, T.D.; Ebersole, J.L.; Krawchuk, M.A.; Letcher, B.H.; Mahalovich, M.F.; et al. Climate-change refugia: Biodiversity in the slow lane. Front. Ecol. Environ. 2020, 18, 228–234. [Google Scholar] [CrossRef] [PubMed]
  25. Hallfors, M.H.; Aikio, S.; Fronzek, S.; Hellmann, J.J.; Ryttari, T.; Heikkinen, R.K. Assessing the need and potential of assisted migration using species distribution models. Biol. Conserv. 2016, 196, 60–68. [Google Scholar] [CrossRef] [Green Version]
  26. Baur, B. Dispersal-limited species—A challenge for ecological restoration. Basic. Appl. Ecol. 2014, 15, 559–564. [Google Scholar] [CrossRef]
  27. Engler, R.; Guisan, A.; Rechsteiner, L. An improved approach for predicting the distribution of rare and endangered species from occurrence and pseudo-absence data. J. Appl. Ecol. 2004, 41, 263–274. [Google Scholar] [CrossRef]
  28. Guisan, A.; Tingley, R.; Baumgartner, J.B.; Naujokaitis-Lewis, I.; Sutcliffe, P.R.; Tulloch, A.I.T.; Regan, T.J.; Brotons, L.; McDonald-Madden, E.; Mantyka-Pringle, C.; et al. Predicting species distributions for conservation decisions. Ecol. Lett. 2013, 16, 1424–1435. [Google Scholar] [CrossRef]
  29. Sousa-Silva, R.; Alves, P.; Honrado, J.; Lomba, A. Improving the assessment and reporting on rare and endangered species through species distribution models. Glob. Ecol. Conserv. 2014, 2, 226–237. [Google Scholar] [CrossRef] [Green Version]
  30. Burrows, M.T.; Schoeman, D.S.; Richardson, A.J.; Molinos, J.G.; Hoffmann, A.; Buckley, L.B.; Moore, P.J.; Brown, C.J.; Bruno, J.F.; Duarte, C.M.; et al. Geographical limits to species-range shifts are suggested by climate velocity. Nature 2014, 507, 492–495. [Google Scholar] [CrossRef] [Green Version]
  31. Carroll, C.; Lawler, J.J.; Roberts, D.R.; Hamann, A. Biotic and climatic velocity identify contrasting areas of vulnerability to climate change. PLoS ONE 2015, 10, e0140486. [Google Scholar] [CrossRef] [Green Version]
  32. Serra-Diaz, J.M.; Franklin, J.; Ninyerola, M.; Davis, F.W.; Syphard, A.D.; Regan, H.M.; Ikegami, M. Bioclimatic velocity: The pace of species exposure to climate change. Divers. Distrib. 2014, 20, 169–180. [Google Scholar] [CrossRef]
  33. Loarie, S.R.; Duffy, P.B.; Hamilton, H.; Asner, G.P.; Field, C.B.; Ackerly, D.D. The velocity of climate change. Nature 2009, 462, 1052–1055. [Google Scholar] [CrossRef]
  34. R Core Team. R: A Language and Environment for Statistical Computing; R Foundation for Statistical Computing: Vienna, Austria, 2022; Available online: https://www.R-project.org/ (accessed on 5 June 2022).
  35. Guijarro, J.A. Homogeneización de Series Climáticas con Climatol. Repositorio AEMET. 2018. Available online: https://repositorio.aemet.es/bitstream/20.500.11765/12185/1/homog_climatol-es.pdf (accessed on 5 June 2023).
  36. Breiman, L. Random Forests. Mach. Learn. 2001, 45, 5–32. [Google Scholar] [CrossRef] [Green Version]
  37. Karger, D.N.; Conrad, O.; Bohner, J.; Kawohl, T.; Kreft, H.; Soria-Auza, R.W.; Zimmermann, N.E.; Linder, H.P.; Kessler, M. Data Descriptor: Climatologies at high resolution for the earth’s land surface areas. Sci. Data 2017, 4, 170122. [Google Scholar] [CrossRef] [Green Version]
  38. Phillips, S.J.; Anderson, R.P.; Schapire, R.E. Maximum entropy modeling of species geographic distributions. Ecol. Model. 2006, 190, 231–259. [Google Scholar] [CrossRef] [Green Version]
  39. West, A.M.; Kumar, S.; Brown, C.S.; Stohlgren, T.J.; Bromberg, J. Field validation of an invasive species Maxent model. Ecol. Inform. 2016, 36, 126–134. [Google Scholar] [CrossRef] [Green Version]
  40. Hamann, A.; Roberts, D.R.; Barber, Q.E.; Carroll, C.; Nielsen, S.E. Velocity of climate change algorithms for guiding conservation and management. Glob. Chang. Biol. 2015, 21, 997–1004. [Google Scholar] [CrossRef]
  41. Vitasse, Y.; Ursenbacher, S.; Klein, G.; Bohnenstengel, T.; Chittaro, Y.; Delestrade, A.; Monnerat, C.; Rebetez, M.; Rixen, C.; Strebel, N.; et al. Phenological and elevational shifts of plants, animals and fungi under climate change in the European Alps. Biol. Rev. 2021, 96, 1816–1835. [Google Scholar] [CrossRef]
  42. Otto, R.; Krusi, B.O.; Delgado, J.D.; Fernandez-Palacios, J.M.; Garcia-Del-Rey, E.; Arevalo, J.R. Regeneration niche of the Canarian juniper: The role of adults, shrubs and environmental conditions. Ann. For. Sci. 2010, 67, 709. [Google Scholar] [CrossRef]
  43. Bello-Rodríguez, V.; Cubas, J.; Del Arco, M.J.; Martín-Esquivel, J.L.; Marrero-Gómez, M.V.; González-Mancebo, J.M. Velocidad de respuesta al cambio climático de las especies del género Viola en la alta montaña de Canarias. Conserv. Veg. 2021, 25, 16–19. [Google Scholar] [CrossRef]
  44. Rodriguez-Rodriguez, P.; de Castro, A.G.F.; Segui, J.; Traveset, A.; Sosa, P.A. Alpine species in dynamic insular ecosystems through time: Conservation genetics and niche shift estimates of the endemic and vulnerable Viola cheiranthifolia. Ann. Bot. 2019, 123, 505–519. [Google Scholar] [CrossRef] [Green Version]
  45. Scherrer, D.; Massy, S.; Meier, S.; Vittoz, P.; Guisan, A. Assessing and predicting shifts in mountain forest composition across 25 years of climate change. Divers. Distrib. 2017, 23, 517–528. [Google Scholar] [CrossRef] [Green Version]
  46. Olano, J.M.; Brito, P.; Gonzalez-Rodriguez, A.M.; Martin-Esquivel, J.L.; Garcia-Hidalgo, M.; Rozas, V. Thirsty peaks: Drought events drive keystone shrub decline in an oceanic island mountain. Biol. Conserv. 2017, 215, 99–106. [Google Scholar] [CrossRef]
  47. Ferreira, M.T.; Cardoso, P.; Borges, P.A.V.; Gabriel, R.; de Azevedo, E.B.; Elias, R.B. Implications of climate change to the design of protected areas: The case study of small islands (Azores). PLoS ONE 2019, 14, e0218168. [Google Scholar] [CrossRef]
  48. Del Arco, M.J.A.; Gonzalez-Gonzalez, R.; Garzon-Machado, V.; Pizarro-Hernandez, B. Actual and potential natural vegetation on the Canary Islands and its conservation status. Biodivers. Conserv. 2010, 19, 3089–3140. [Google Scholar] [CrossRef]
  49. Anderson, A.S.; Reside, A.E.; VanDerWal, J.J.; Shoo, L.P.; Pearson, R.G.; Williams, S.E. Immigrants and refugees: The importance of dispersal in mediating biotic attrition under climate change. Glob. Chang. Biol. 2012, 18, 2126–2134. [Google Scholar] [CrossRef]
  50. Benito, B.M.; Lorite, J.; Perez-Perez, R.; Gomez-Aparicio, L.; Penas, J. Forecasting plant range collapse in a mediterranean hotspot: When dispersal uncertainties matter. Divers. Distrib. 2014, 20, 72–83. [Google Scholar] [CrossRef] [Green Version]
  51. Nogales, M.; Rodriguez-Luengo, J.L.; Marrero, P. Ecological effects and distribution of invasive non-native mammals on the Canary Islands. Mammal. Rev. 2006, 36, 49–65. [Google Scholar] [CrossRef]
  52. Cubas, J.; Martin-Esquivel, J.L.; Nogales, M.; Irl, S.D.H.; Hernandez-Hernandez, R.; Lopez-Darias, M.; Marrero-Gomez, M.; del Arco, M.J.; Gonzalez-Mancebo, J.M. Contrasting effects of invasive rabbits on endemic plants driving vegetation change in a subtropical alpine insular environment. Biol. Invasions 2018, 20, 793–807. [Google Scholar] [CrossRef]
  53. Cubas, J.; Irl, S.D.H.; Villafuerte, R.; Bello-Rodriguez, V.; Rodriguez-Luengo, J.L.; del Arco, M.; Martin-Esquive, J.L.; Gonzalez-Mancebo, J.M. Endemic plant species are more palatable to introduced herbivores than non-endemics. Proc. R. Soc. B Biol. Sci. 2019, 286, 20190136. [Google Scholar] [CrossRef] [Green Version]
  54. Ibarrola-Ulzurrun, E.; Marcello, J.; Gonzalo-Martin, C.; Martin-Esquivel, J.L. Temporal dynamic analysis of a mountain ecosystem based on multi-source and multi-scale remote sensing data. Ecosphere 2019, 10, e02708. [Google Scholar] [CrossRef] [Green Version]
  55. Willis, S.G.; Foden, W.; Baker, D.J.; Belle, E.; Burgess, N.D.; Carr, J.A.; Doswald, N.; Garcia, R.A.; Hartley, A.; Hof, C.; et al. Integrating climate change vulnerability assessments from species distribution models and trait-based approaches. Biol. Conserv. 2015, 190, 167–178. [Google Scholar] [CrossRef]
  56. Foden, W.B.; Young, B.E.; Akcakaya, H.R.; Garcia, R.A.; Hoffmann, A.A.; Stein, B.A.; Thomas, C.D.; Wheatley, C.J.; Bickford, D.; Carr, J.A.; et al. Climate change vulnerability assessment of species. Wires Clim. Chang. 2019, 10, e551. [Google Scholar] [CrossRef] [Green Version]
  57. Manes, S.; Costello, M.J.; Beckett, H.; Debnath, A.; Devenish-Nelson, E.; Grey, K.A.; Jenkins, R.; Khan, T.M.; Kiessling, W.; Krause, C.; et al. Endemism increases species’ climate change risk in areas of global biodiversity importance. Biol. Conserv. 2021, 257, 109070. [Google Scholar] [CrossRef]
  58. Marrero-Gómez, M.V.; Martín Esquivel, J.L.; Docoito Diaz, J.R.; Suárez Izquierdo, M. Viola guaxarensis (Violaceae): A new Viola from Tenerife, Canary Islands, Spain. Willdenowia 2020, 50, 13–21. [Google Scholar] [CrossRef] [Green Version]
  59. Benito, B.; Lorite, J.; Peñas, J. Simulating potential effects of climatic warming on altitudinal patterns of key species in Mediterranean-alpine ecosystems. Clim. Chang. 2011, 108, 471–483. [Google Scholar] [CrossRef]
  60. Di Biase, L.; Pace, L.; Mantoni, C.; Fattorini, S. Variations in plant richness, biogeographical composition, and life forms along an elevational gradient in a Mediterranean mountain. Plants 2021, 10, 2090. [Google Scholar] [CrossRef]
  61. Köhler, L.; Gieger, T.; Leuschner, C. Altitudinal change in soil and foliar nutrient concentrations and in microclimate across the tree line on the subtropical island mountain Mt. Teide (Canary Islands). Flora Morphol. Distrib. Funct. Ecol. 2006, 201, 202–214. [Google Scholar] [CrossRef]
Figure 1. Location of the study area on the islands of La Palma and Tenerife, with detail of the main altitudinal isolines. Each color represents a different elevational level, each 400 m.
Diversity 15 00864 g001
Figure 2. Maps of cumulative number of species per pixel on La Palma projected for (a) the past climate normal period (1959–1989), (b) present climate normal (1990–2019), (c) future multimodel projection for the Representative Concentration Pathway 8.5 scenario for the 2041–2060 period, and (d) the 2061–2080 period. Each isoline represents 500 m of altitude.
Diversity 15 00864 g002
Figure 3. Maps of cumulative number of species per pixel on Tenerife projected for (a) the past climate normal period (1959–1989), (b) present climate normal (1990–2019), (c) future multimodel projection Representative Concentration Pathway 8.5 scenario for the 2041–2060 period, and (d) the 2061–2080 period. Each isoline represents 500 m of altitude.
Diversity 15 00864 g003
Figure 4. Medians, quartiles, and ranges of elevation, slope, and percentage of geologically young and human use areas for climatic habitat projections across all species on Tenerife and La Palma. Time periods include the recent past (RP) between 1959 and 1989, present (P) from 1990–2019 and future RCP 8.5 projections for 2041–2060 (2050) and for 2061–2080 (2070). Different lower-case letters indicate significant differences among time periods, while n.s. means there were not significant differences between groups.
Diversity 15 00864 g004
Table 1. Average percent habitat change and migration requirements of 47 species included in this study for past climate change (difference between 1959–1989 and 1990–2019) and future RCP 8.5 projections. Standard deviations of the means are given in parentheses. Statistically significant differences at p < 0.05 are highlighted in bold, based on non-parametric Mann–Whitney U tests, with species assumed to be independent sampling units representing the paired groups for these tests.
Change in Species Habitat (%)Biotic Velocity (m/Year)
Islands and Species GroupsPast2041–20602061–2080Past2041–20602061–2080
Island means
La Palma−43 (±12)−25 (±27)−41 (±34)46 (±33)11 (±4)13 (±9)
Tenerife−2 (±29)−29 (±23)−50 (±27)17 (±6)18 (±13)18 (±10)
La Palma comparisons
Single-island endemic−43 (±9)−26 (±26)−43 (±33)38 (±24)11 (±4)14 (±12)
Canary endemic−42 (±13)−24 (±28)−40 (±35)52 (±37)11 (±4)11 (±5)
Threatened−36 (±11)−44 (±19)−66 (±24)47 (±30)11 (±2)13 (±3)
Non-threatened−45 (±11)−19 (±27)−34 (±33)46 (±34)11 (±4)12 (±10)
Tenerife comparisons
Single-island endemic−1 (±38)−33 (±24)−52 (±27)20 (±8)22 (±16)21 (±12)
Canary endemic−3 (±17)−25 (±17)−48 (±22)16 (±4)14 (±3)14 (±4)
Threatened vs.−14 (±31)−30 (±22)−47 (±25)20 (±9)26 (±19)24 (±13)
Non-threatened+5 (±28)−29 (±21)−51 (±25)17 (±4)14 (±4)15 (±6)
Both islands
Single-island end. vs.−18 (±36)−30 (±25)−48 (±30)27 (±19)18 (±14)19 (±13)
Canary endemic−24 (±25)−25 (±24)−44 (±30)35 (±32)12 (±4)13 (±5)
Threatened vs.−24 (±27)−35 (±22)−53 (±26)30 (±24)20 (±16)20 (±11)
Non-threatened−19 (±33)−24 (±26)−43 (±33)32 (±28)12 (±4)14 (±8)
Disclaimer/Publisher’s Note: The statements, opinions and data contained in all publications are solely those of the individual author(s) and contributor(s) and not of MDPI and/or the editor(s). MDPI and/or the editor(s) disclaim responsibility for any injury to people or property resulting from any ideas, methods, instructions or products referred to in the content.

