Review

Recent Insights into the Measurement of Carbon Dioxide Concentrations for Clinical Practice in Respiratory Medicine

1
Department of General Medicine, School of Medicine, IUHW Shioya Hospital, International University of Health and Welfare (IUHW), Yaita 329-2145, Japan
2
Department of Physical Therapy, School of Health Science, International University of Health and Welfare, Otawara 324-8501, Japan
3
Department of Rehabilitation, IUHW Shioya Hospital, International University of Health and Welfare (IUHW), Yaita 329-2145, Japan
4
Department of Pharmacology, School of Pharmacy, International University of Health and Welfare, Otawara 324-8501, Japan
5
Department of Pharmacology, School of Pharmacy at Fukuoka, International University of Health and Welfare, Okawa 831-8501, Japan
6
Faculty of Rehabilitation, School of Healthcare, Fujita Health University, Toyoake 470-1192, Japan
7
Faculty of Health Sciences, Uekusa Gakuen University, Chiba 264-0007, Japan
8
Laboratory of Electrophysiology, Clinical Research Center, Murayama Medical Center, Musashimurayama 208-0011, Japan
9
Department of Child Health and the Child Health Research Institute, MU Women’s and Children’s Hospital, University of Missouri, Columbia, MO 65201, USA
*
Author to whom correspondence should be addressed.
Sensors 2021, 21(16), 5636; https://doi.org/10.3390/s21165636
Submission received: 26 June 2021 / Revised: 6 August 2021 / Accepted: 16 August 2021 / Published: 21 August 2021
(This article belongs to the Special Issue Advances and Application of Gas Sensors)

Abstract

:
In the field of respiratory clinical practice, the importance of measuring carbon dioxide (CO2) concentrations cannot be overemphasized. Within the body, assessment of the arterial partial pressure of CO2 (PaCO2) has been the gold standard for many decades. Non-invasive assessments are usually predicated on the measurement of CO2 concentrations in the air, usually using an infrared analyzer, and these data are clearly important regarding climate changes as well as regulations of air quality in buildings to ascertain adequate ventilation. Measurements of CO2 production with oxygen consumption yield important indices such as the respiratory quotient and estimates of energy expenditure, which may be used for further investigation in the various fields of metabolism, obesity, sleep disorders, and lifestyle-related issues. Measures of PaCO2 are nowadays performed using the Severinghaus electrode in arterial blood or in arterialized capillary blood, while the same electrode system has been modified to enable relatively accurate non-invasive monitoring of the transcutaneous partial pressure of CO2 (PtcCO2). PtcCO2 monitoring during sleep can be helpful for evaluating sleep apnea syndrome, particularly in children. End-tidal PCO2 is inferior to PtcCO2 as far as accuracy, but it provides breath-by-breath estimates of respiratory gas exchange, while PtcCO2 reflects temporal trends in alveolar ventilation. The frequency of monitoring end-tidal PCO2 has markedly increased in light of its multiple applications (e.g., verify endotracheal intubation, anesthesia or mechanical ventilation, exercise testing, respiratory patterning during sleep, etc.).

1. Introduction

Atmospheric carbon dioxide (CO2) concentration is increasing worldwide by the increasing consumption of carbon-based combustibles along with progressive deforestation [1,2]. Increases in atmospheric CO2 concentrations are thought to cause elevation of atmospheric temperature as a result of the greenhouse effect. High concentrations of atmospheric CO2 can facilitate the onset of human health problems, such as increased fatigue, headache, and tinnitus. Inhalation of 0.1% CO2 for a short time has been reported to cause marked changes in respiratory, circulatory, and cerebral electrical activity [3,4]. More recently, continuous measurements of atmospheric CO2 concentrations have been viewed as being helpful for the evaluation of ventilation conditions in rooms or buildings, and it has been utilized as guidance to avoid the transmission of severe acute respiratory syndrome coronavirus 2 (SARS-CoV-2) [5]. SARS-CoV-2 can cause the coronavirus disease 2019 (COVID-19), which has emerged as a serious problem in respiratory clinical practice [6,7,8].
On the other hand, arterial blood gas analysis (ABGA) is very commonly implemented in routine clinical practice of respiratory medicine [9,10,11]. Arterial partial pressure of CO2 (PaCO2) is commonly evaluated in any type of respiratory disease. PaCO2 is useful for the diagnosis of hypo- or hyperventilation and to evaluate potential respiratory drive depression and CO2 narcosis in patients with chronic obstructive pulmonary disease (COPD) or other conditions. The evaluation of acid–base imbalance in the context of respiratory acidosis can be performed using pH and PaCO2 data. Non-invasive alternative methods such as end-tidal CO2 partial pressure of exhaled gas (PetCO2) and transcutaneous partial pressure of CO2 (PtcCO2) have been developed, and their accuracy and usefulness have been evaluated by Bland–Altman analysis [12].
Another use of CO2 concentration measurements in exhaled air involves assessment of CO2 production [9]. The respiratory quotient (RQ) can be calculated using the data of CO2 production ( V ˙ CO2) and oxygen (O2) consumption ( V ˙ O2). Then, the difference of partial pressure of oxygen (PO2) between mean alveolar gas and arterial blood can be calculated [10]. This approach has been used for the evaluation of gas exchange impairment in various lung diseases [9,10,13]. Energy expenditure can be also evaluated, and this is particularly of interest in obese patients with obstructive sleep apnea syndrome (OSAS) using CO2 production data and oxygen consumption data [14].
Thus, depending on the objectives driving the measurement of CO2 concentrations, the most suitable method should be adopted. In order to better understand the considerations involved in such choices, we will discuss the principles, sensitivity, and limitations of the various methods available for measuring CO2 concentrations.

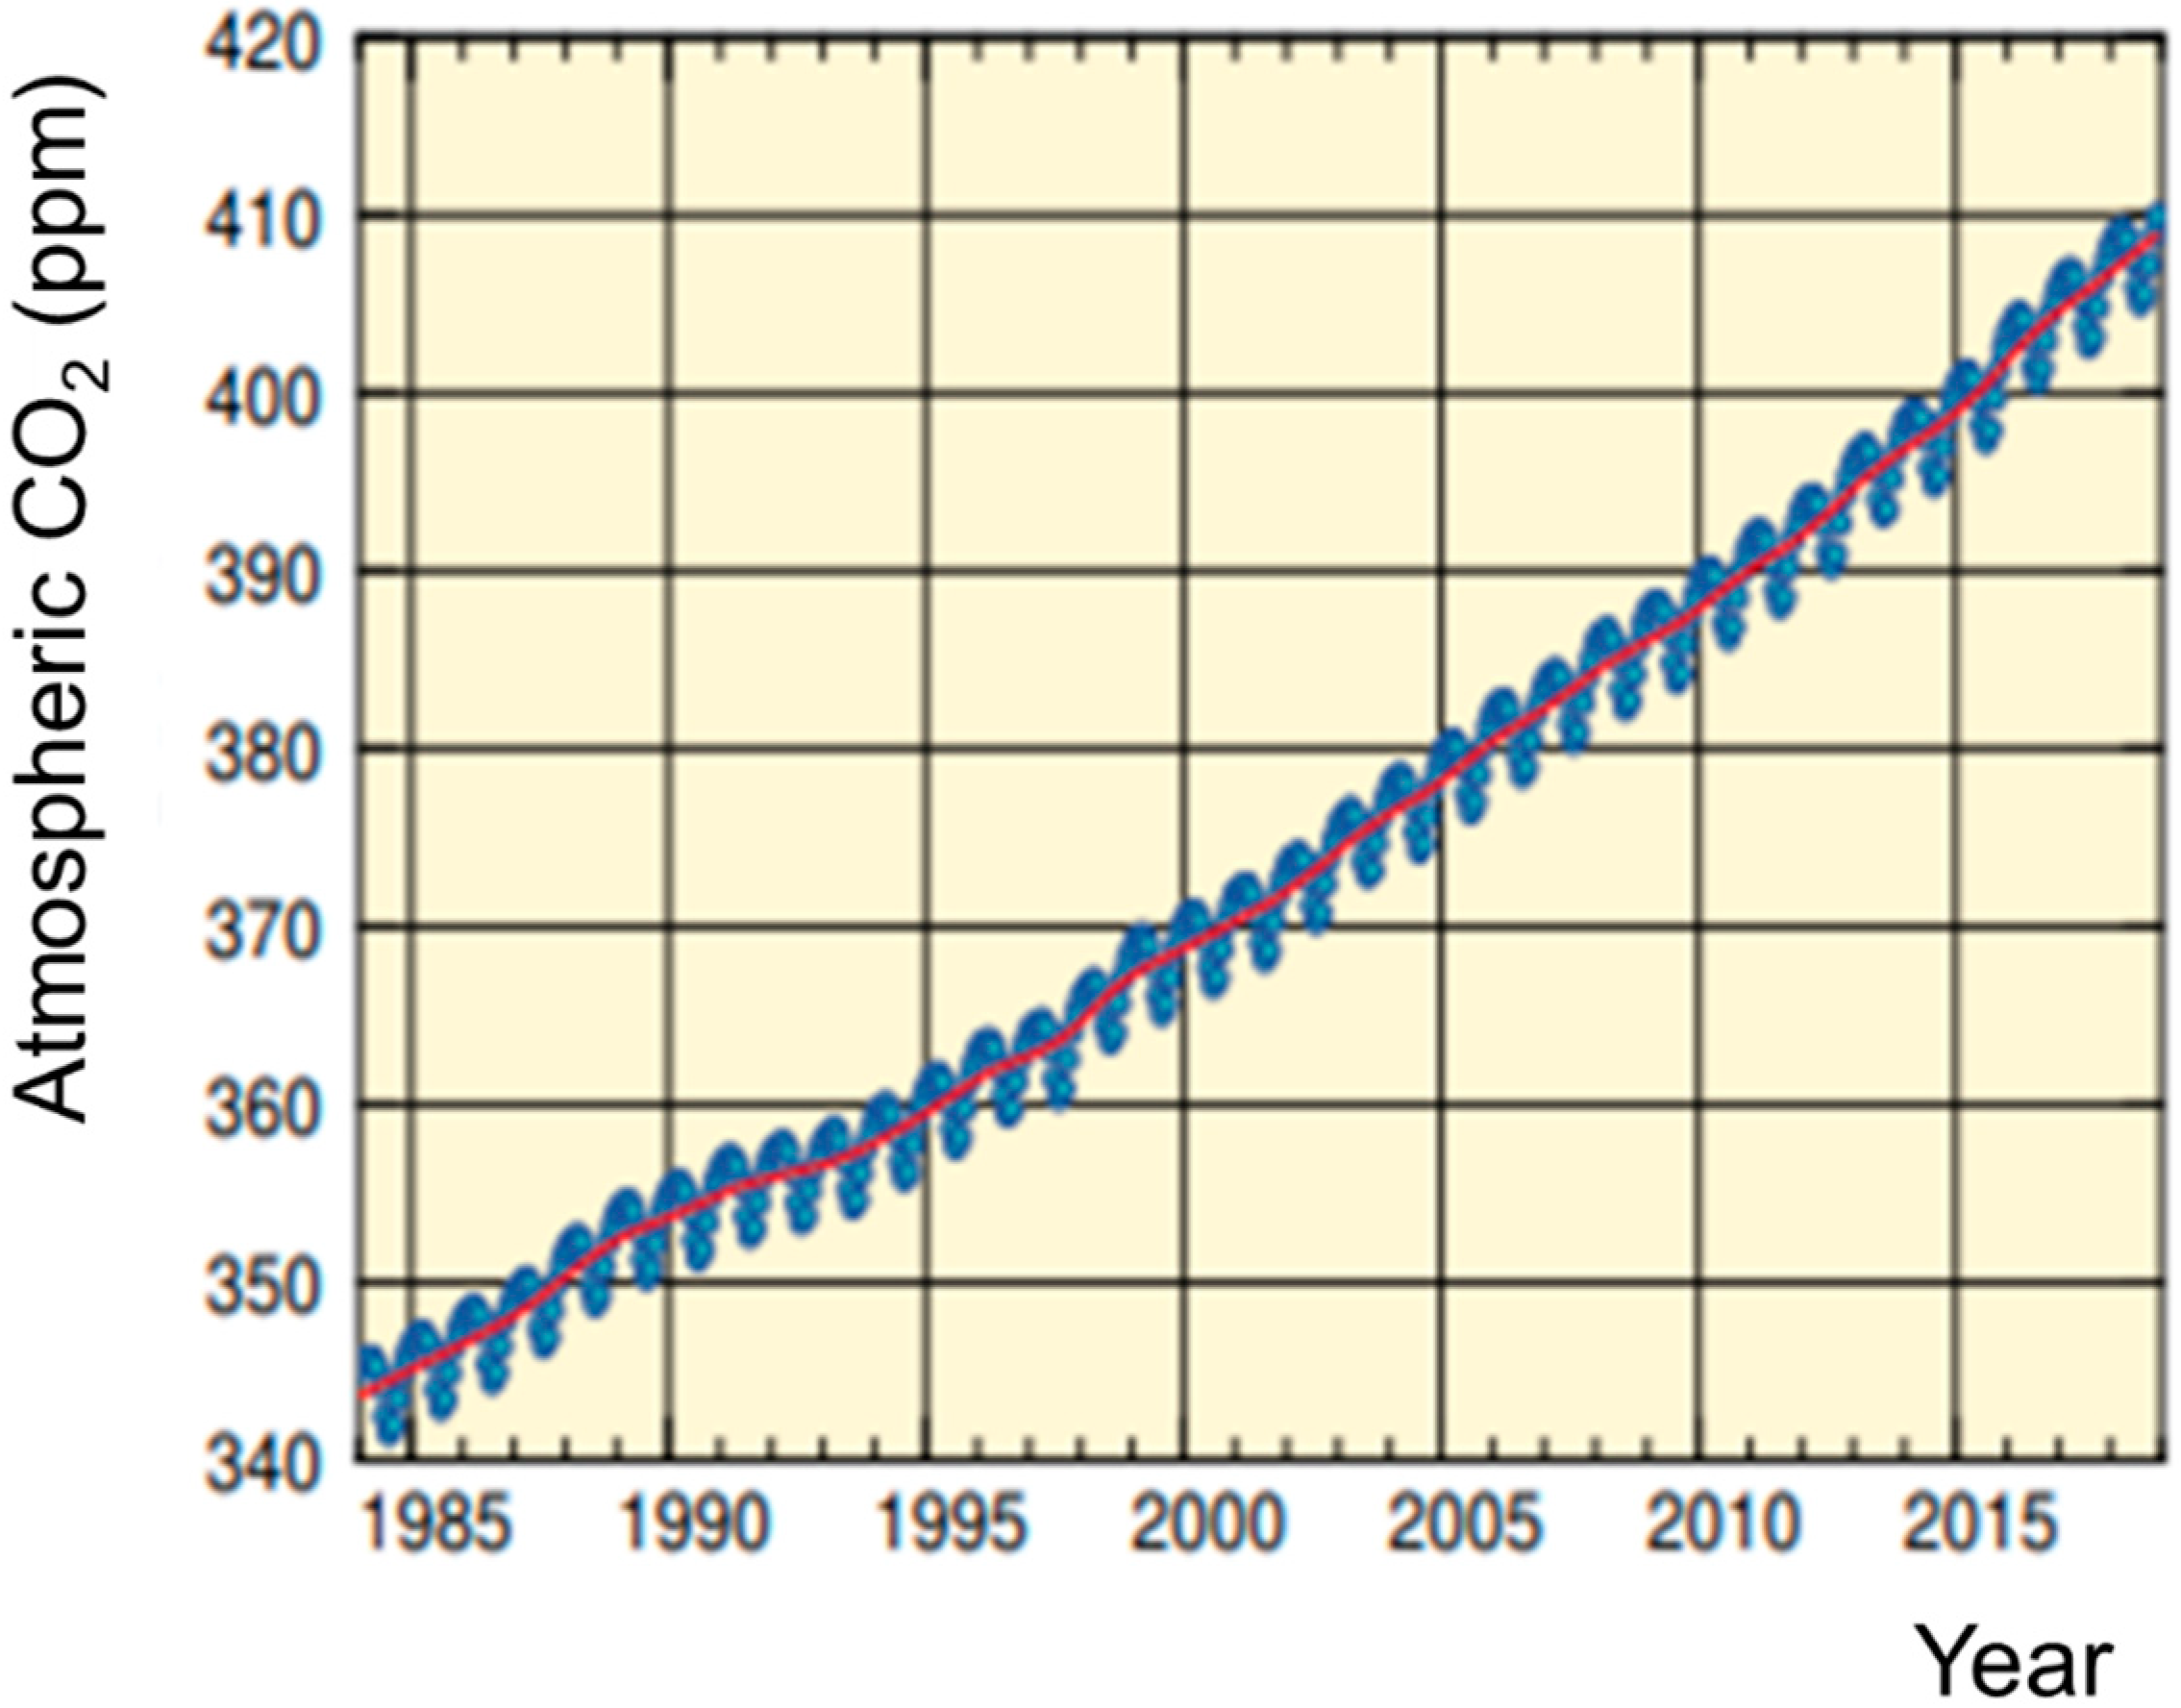
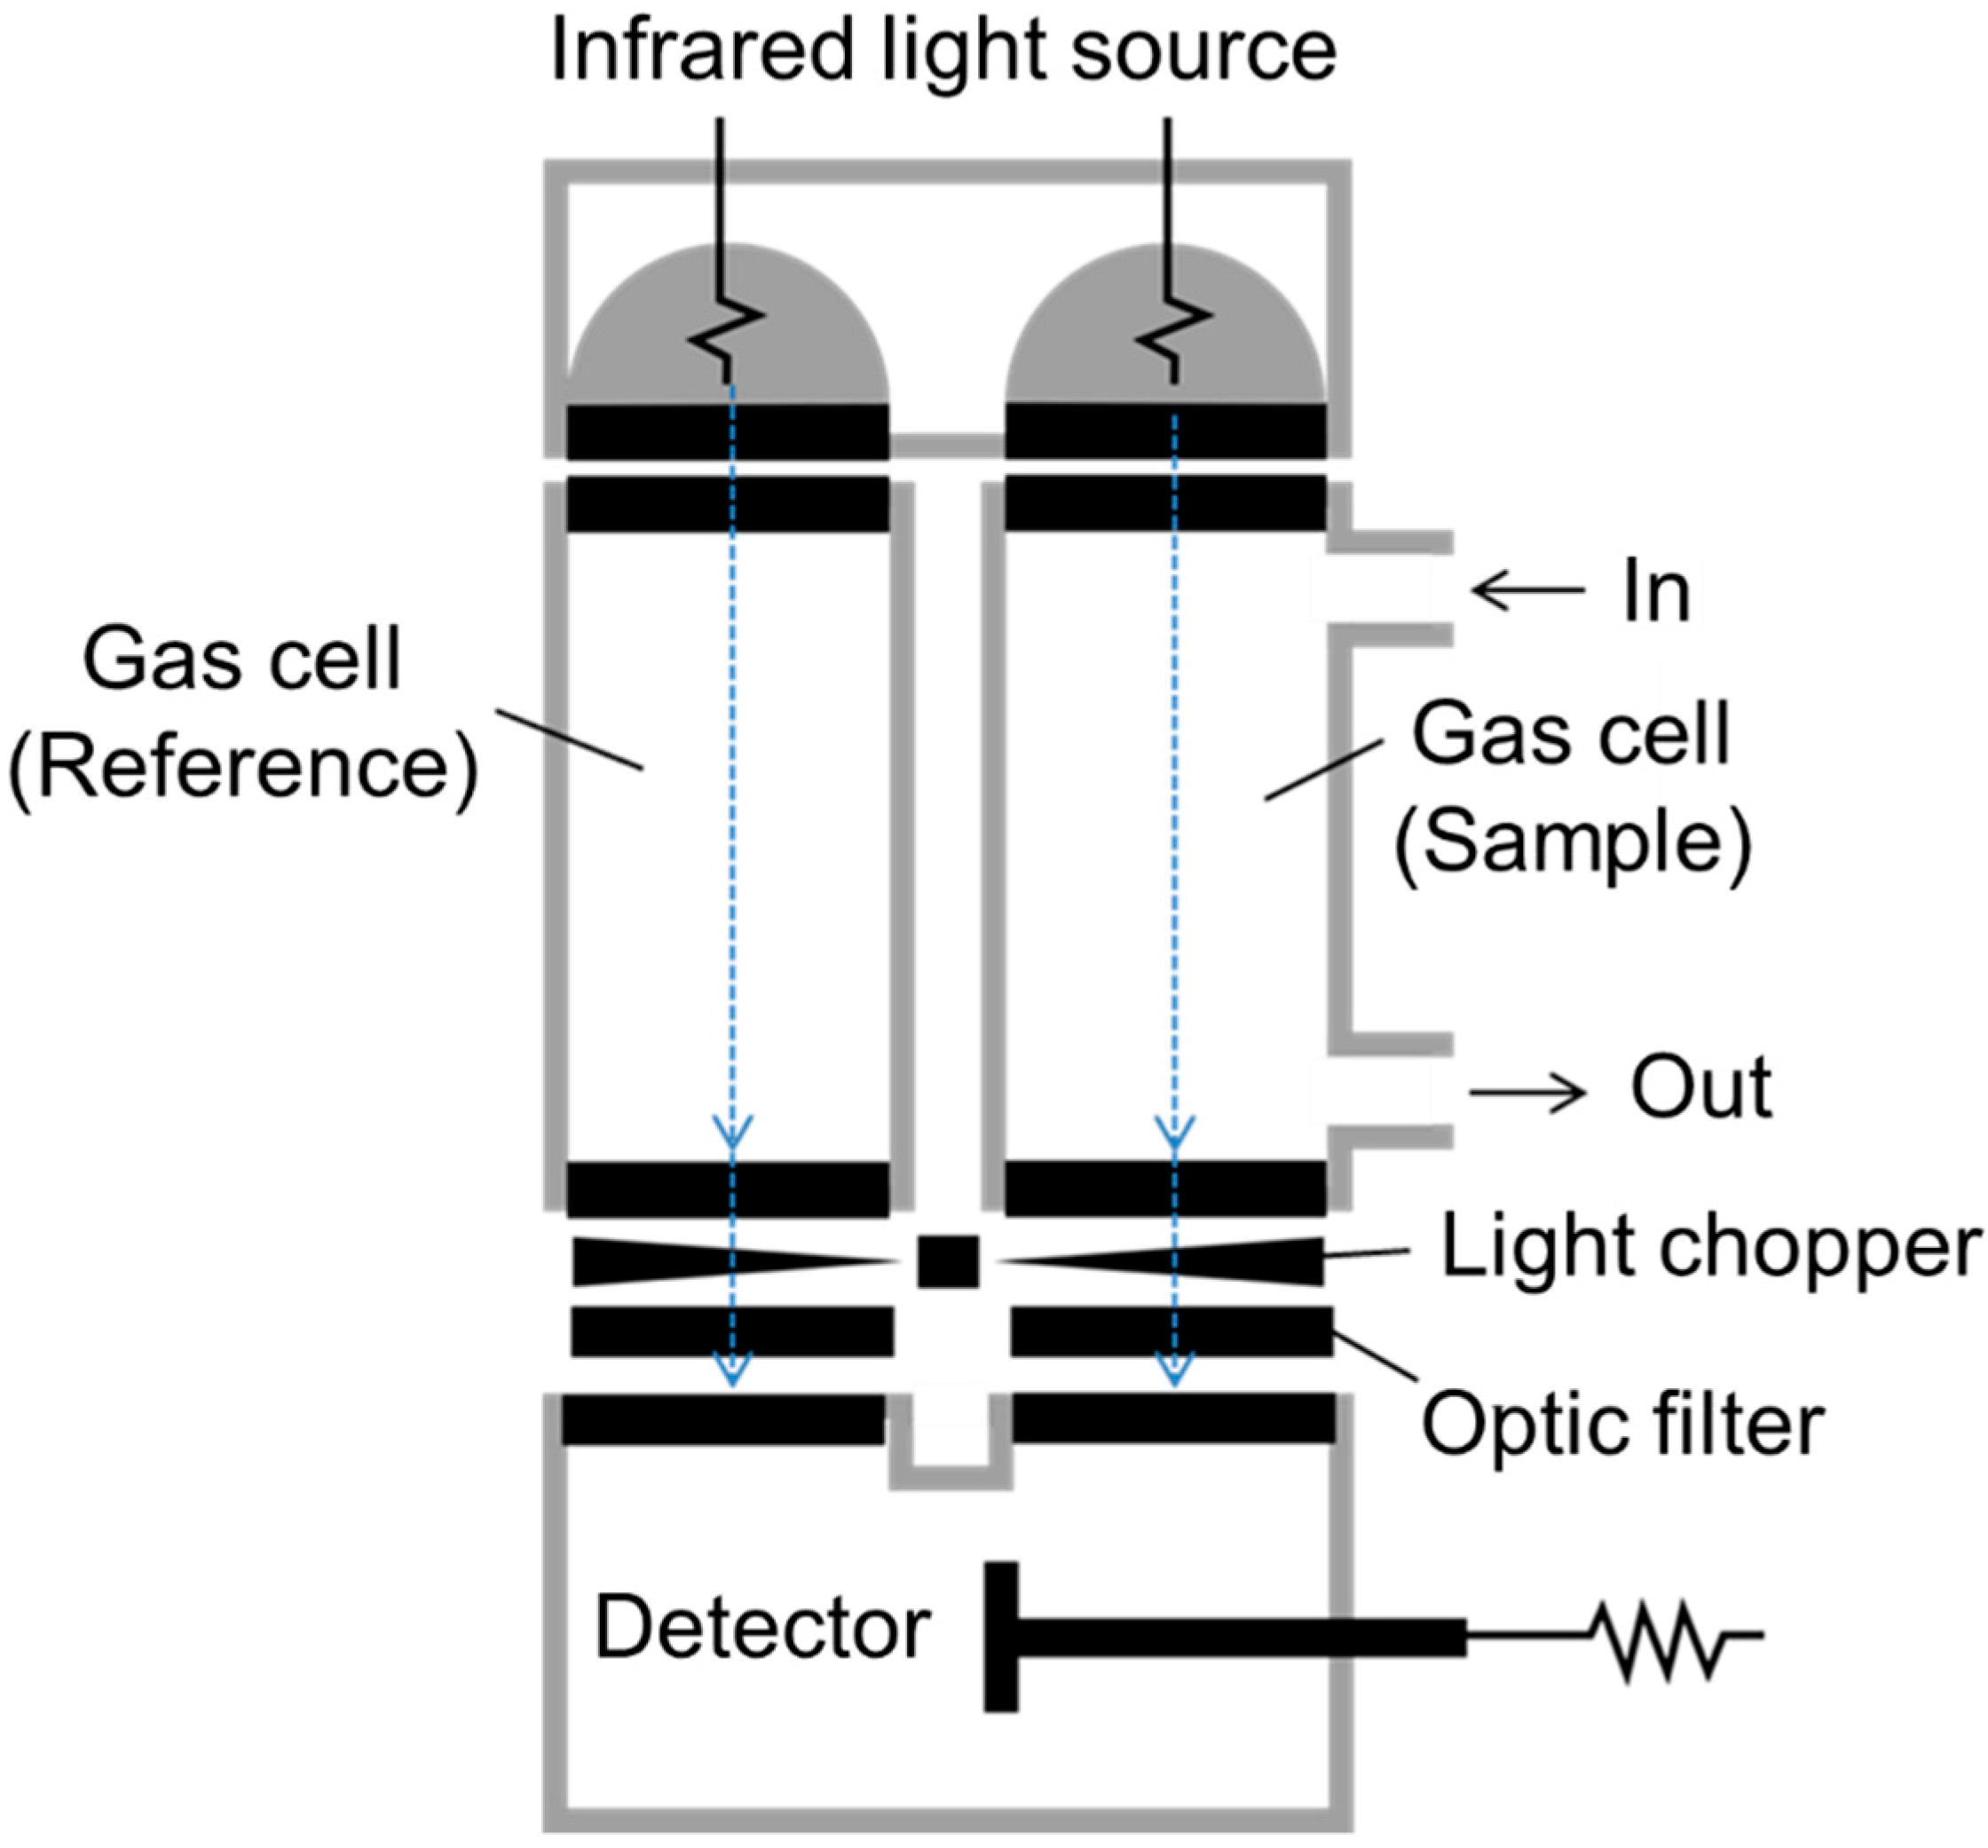
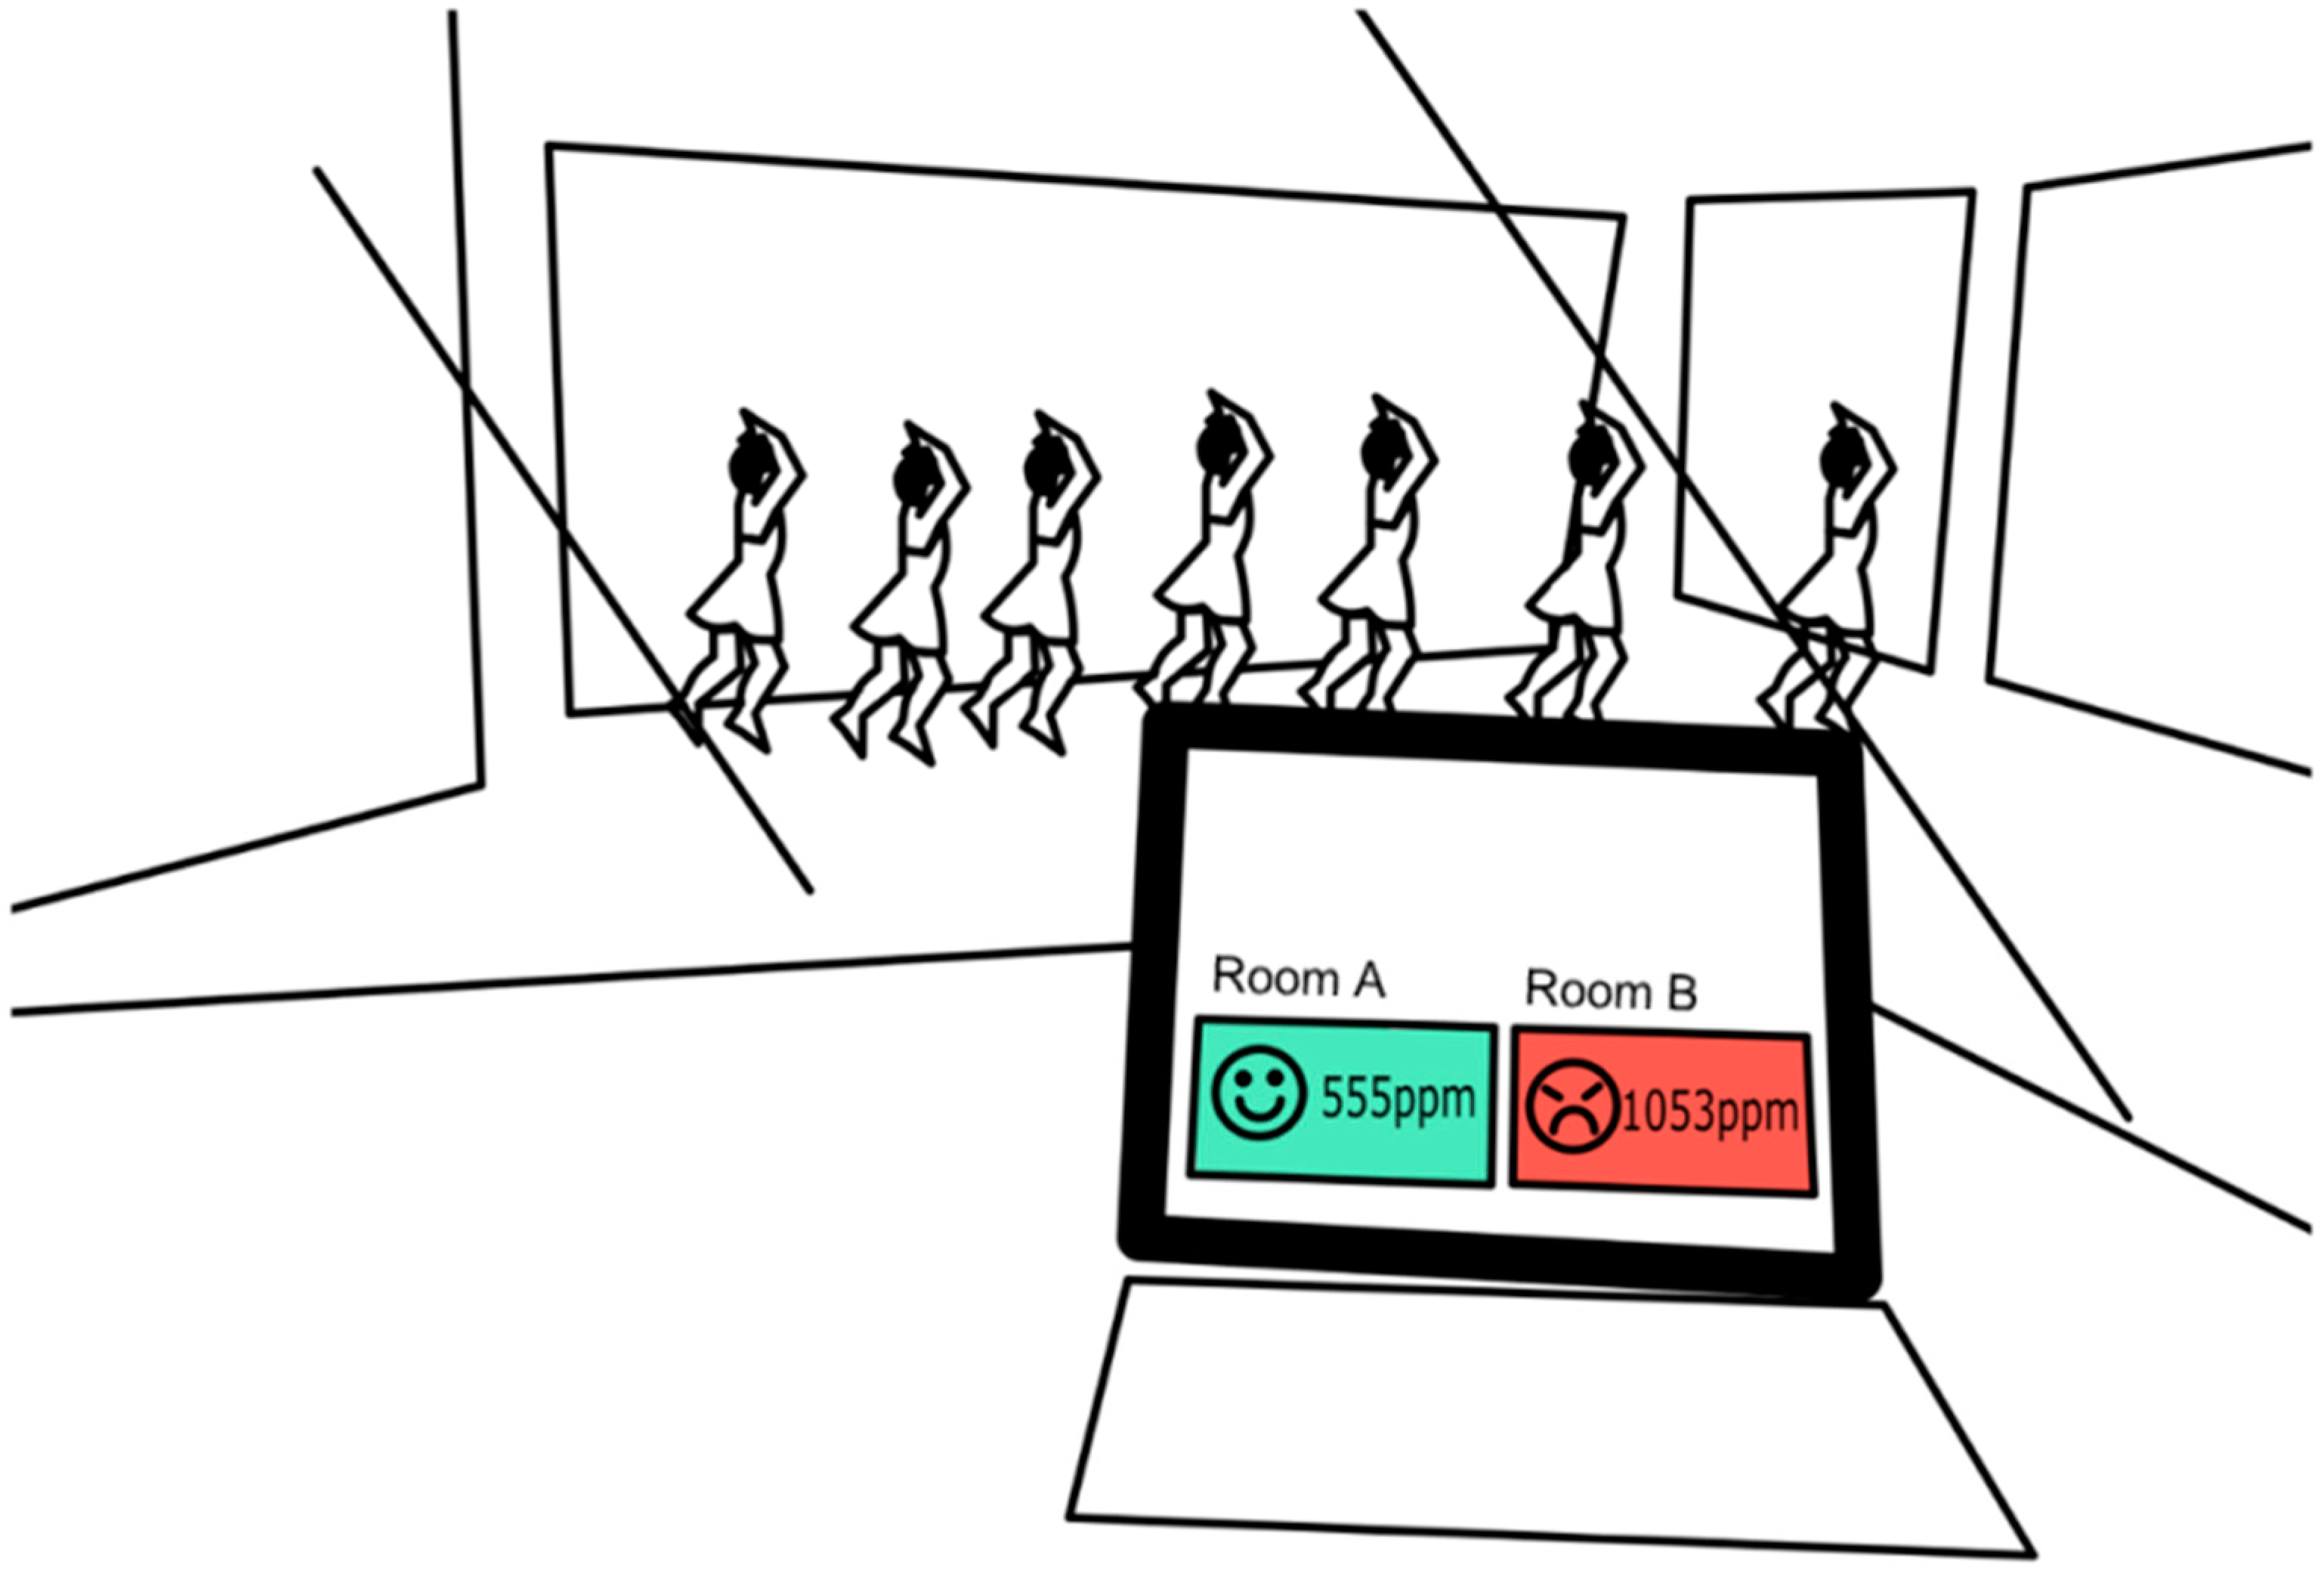
2. Atmospheric Carbon Dioxide Concentration

The World Data Centre for Greenhouse Gases reported that atmospheric CO2 concentrations are increasing worldwide, and they are currently around 410 ppm (Figure 1) [2]. The method to measure this concentration is by non-dispersive infrared technology (Figure 2) [15,16,17,18]. This increase in CO2 level has been mainly attributed to increasing the consumption of carbon-based energy sources (e.g., coal, oil) with significant concomitant deforestation due to unregulated expansion of industrial agriculture initiatives [1,2].
When atmospheric CO2 concentration rises, human PaCO2 will rise, but its toxicity has been reported to be little, if any, at 5% (50,000 ppm) or lower [19]. Atmospheric CO2 concentrations of more than 50,000 ppm may cause hypercapnia, respiratory acidosis, and increased respiratory rate. Severe acidosis will ultimately result in depression of the respiration and the circulation. Atmospheric CO2 concentrations of more than 10% (100,000 ppm) may cause convulsions, coma, and death [19].
Duarte et al. showed the standard CO2 levels in air in indoors environments (i.e., >15,000 ppm: accident by CO2 intoxication; 10,000 ppm: submarines; 5000 ppm: crowded indoors; 600 ppm: well-ventilated indoors) [20].
According to the documents of the World Health Organization, the amplitude (depth) of respiratory movements was reduced by the inhalation of 0.1% (1000 ppm) CO2, while peripheral blood flow was increased, and the amplitude of brain electrical waves was increased [3,4]. In these documents from the 1960s, it was suggested that the indoors concentrations of CO2 should not exceed 1000 ppm. A man engaged in light work exhales about 22.6 L of CO2 per hour [4], and since the recent normal concentration of CO2 in the atmosphere is 0.04% (0.4 L/m3), the volume of required fresh air per person to ensure CO2 concentrations not exceeding 0.1% (1.0 L/m3) would be 22.6/(1.0 − 0.4) = 38 m3 per hour. Thus, strict monitoring of air circulation and CO2 concentrations are essential in indoor locations where the density of humans is high (e.g., cinemas, theaters, office buildings, hospitals, etc.).
Measuring atmospheric CO2 concentrations has been helpful for evaluation of the ventilation conditions in rooms of buildings aiming to decrease the transmission risk of SARS-CoV-2, which can cause COVID-19 (Figure 3) [5,21,22]. Smaller droplets (<10 μm) with SARS-CoV-2 content expired from COVID-19 patients can travel tens of meters in the air while indoors and cause airborne transmission [23,24]. The Japanese government recommended the use of atmospheric CO2 sensors in rooms such as restaurants in order to prevent COVID-19 especially in cold weather [25]. Guidelines for indoor CO2 concentrations to reduce indoors COVID-19 infection risk should be more helpful if they account for environment and activity types [5]. Marr et al. suggested that indoor CO2 concentrations should not exceed 700 ppm in classrooms and 550 ppm in hallways in order to limit the COVID-19 transmission in schools [26]. Teachers in many countries may be required to keep the indoor CO2 concentrations low and decrease the students’ risk of inhaling SARS-CoV-2 floating in the air in classrooms. By measuring indoor CO2 concentrations, teachers can evaluate how widely the windows should be opened (e.g., fully or partially open) in classrooms considering the meteorological conditions (especially wind) and estimate the overall rate of ventilation in the classroom [26].
In addition, there was a fatal accident involving CO2 fire extinguishing equipment in Japan in April 2021 [27]. Four people died and two people were injured due to the high concentrations of CO2 because the equipment in the basement parking garage was mistakenly activated. The mandate of monitoring atmospheric CO2 concentration is increasing and is likely to become mandatory in buildings and similar public structures. Currently, the measurement of CO2 concentrations using infrared is the fastest method to obtain data from atmospheric samples at low cost; as such, this method is suitable in most of the situations.

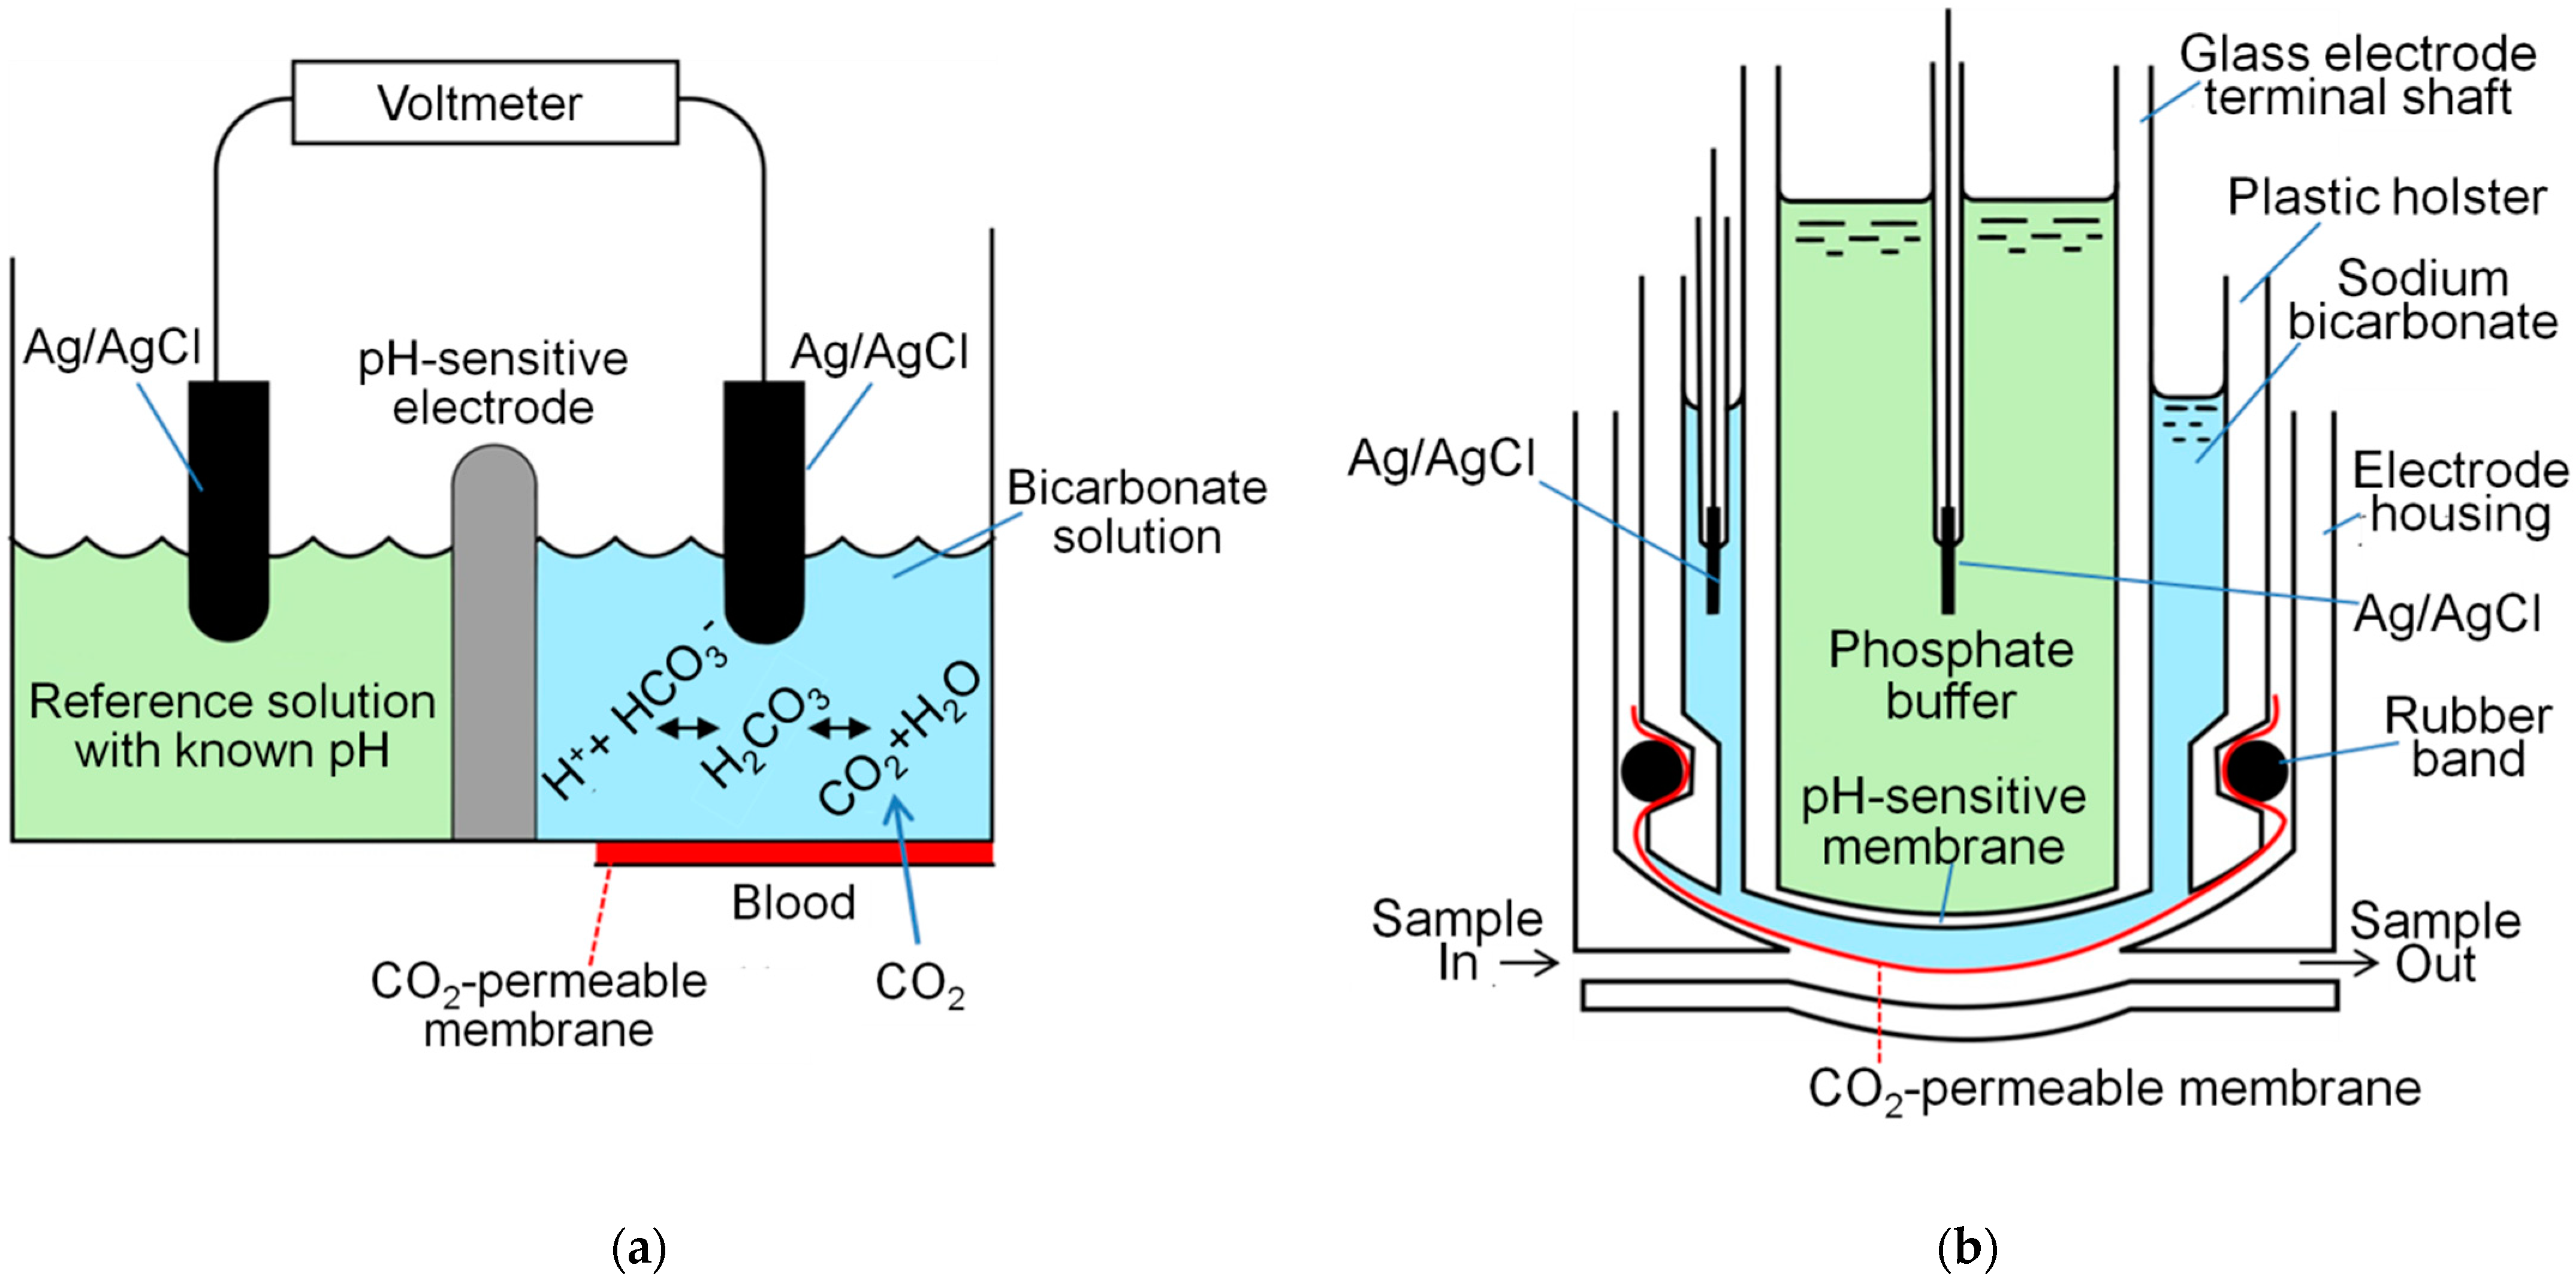
3. Blood Gas Analysis: Principle of PaCO2 Electrode

Apart from atmospheric CO2 concentration measures, it is frequently necessary to measure the partial pressure of CO2 (PCO2) in blood in respiratory clinical practice. The analysis of blood gas values has been performed by means of electrochemical devices [28]. The traditionally used electrode for measuring PCO2 is termed the Severinghaus PCO2 electrode, per the last name of the inventor of this electrode, Dr. John Severinghaus (Figure 4) [28,29]. This PCO2 electrode contains the CO2-permeable membrane and the principle of pH meter with a pH-sensitive glass membrane. PaCO2 is usually measured for the evaluation of any type of lung disease [9,10]. PaCO2 is useful for the diagnosis of hyperventilation, hypoventilation, CO2 retention, and CO2 narcosis in patients with COPD and many other pulmonary conditions [10,30,31].
The evaluation of acid–base imbalance (i.e., respiratory acidosis, respiratory alkalosis, metabolic acidosis, and metabolic alkalosis), with the consideration of compensation, can be performed using simultaneous arterial pH and PaCO2 measurements [32,33]. The majority of CO2 is transported in the body as bicarbonate ion (HCO3) [34]. HCO3 plays a central role in maintaining the pH level in blood [32,33,34]. Therefore, it is important to calculate its concentration ([HCO3]) in blood using the Henderson–Hasselbalch equation. [HCO3] is calculated using the following equation on devices such as Rapidlab 1265 (Siemens Healthcare Diagnostics, Sudbury, UK).
[HCO3] = 0.0307 × PCO2 × 10(pH−6.105)
The normal ranges for PaCO2, arterial pH, and arterial [HCO3] are 35–45 mmHg, 7.35–7.45, and 22–26 mEq/L, respectively [35]. These data are useful for the calculation of anion gap (AG) [32,34,36]. Using the plasma sodium concentration ([Na+]) and plasma chloride concentration ([Cl]), AG is calculated by the following equation.
AG = [Na+] − ([Cl] + [HCO3])
The normal range for AG is 6–12 mmol/L [32]. AG is utilized for the differential diagnosis of metabolic acidosis. High-AG metabolic acidosis due to increased fixed acid includes ketoacidosis, lactic acidosis, renal failure, toxin by salicylates, etc. [32,34,36]. Normal-AG metabolic acidosis includes renal tubular acidosis, HCO3 loss from the gastrointestinal tract, etc. [32,34,36].
The usual clinical practice for ABGA in conscious patients involves a single arterial puncture; however, the procedure may cause pain and cause hyperventilation [11]. PaCO2 via the arterial puncture performed after a resting period of 20–30 min has been understood as the gold standard, because arterial blood samples must be drawn when the patient is in a steady state [11,37]. Therefore, newly developed surrogates should be compared with this gold standard PaCO2 data.
PaCO2 is also useful for the evaluation of the ventilatory support being provided to patients with respiratory insufficiency [38]. However, an arterial puncture is necessary for measuring PaCO2, and it is sometimes difficult and painful, e.g., for pediatric patients. Therefore, less invasive or non-invasive surrogate measurements have been sought, and they include venous or capillary partial pressure of CO2, PetCO2, and PtcCO2.

4. Non-Invasive Alternative Methods to Estimate PaCO2

4.1. Venous Blood Gas Analysis (VBGA)
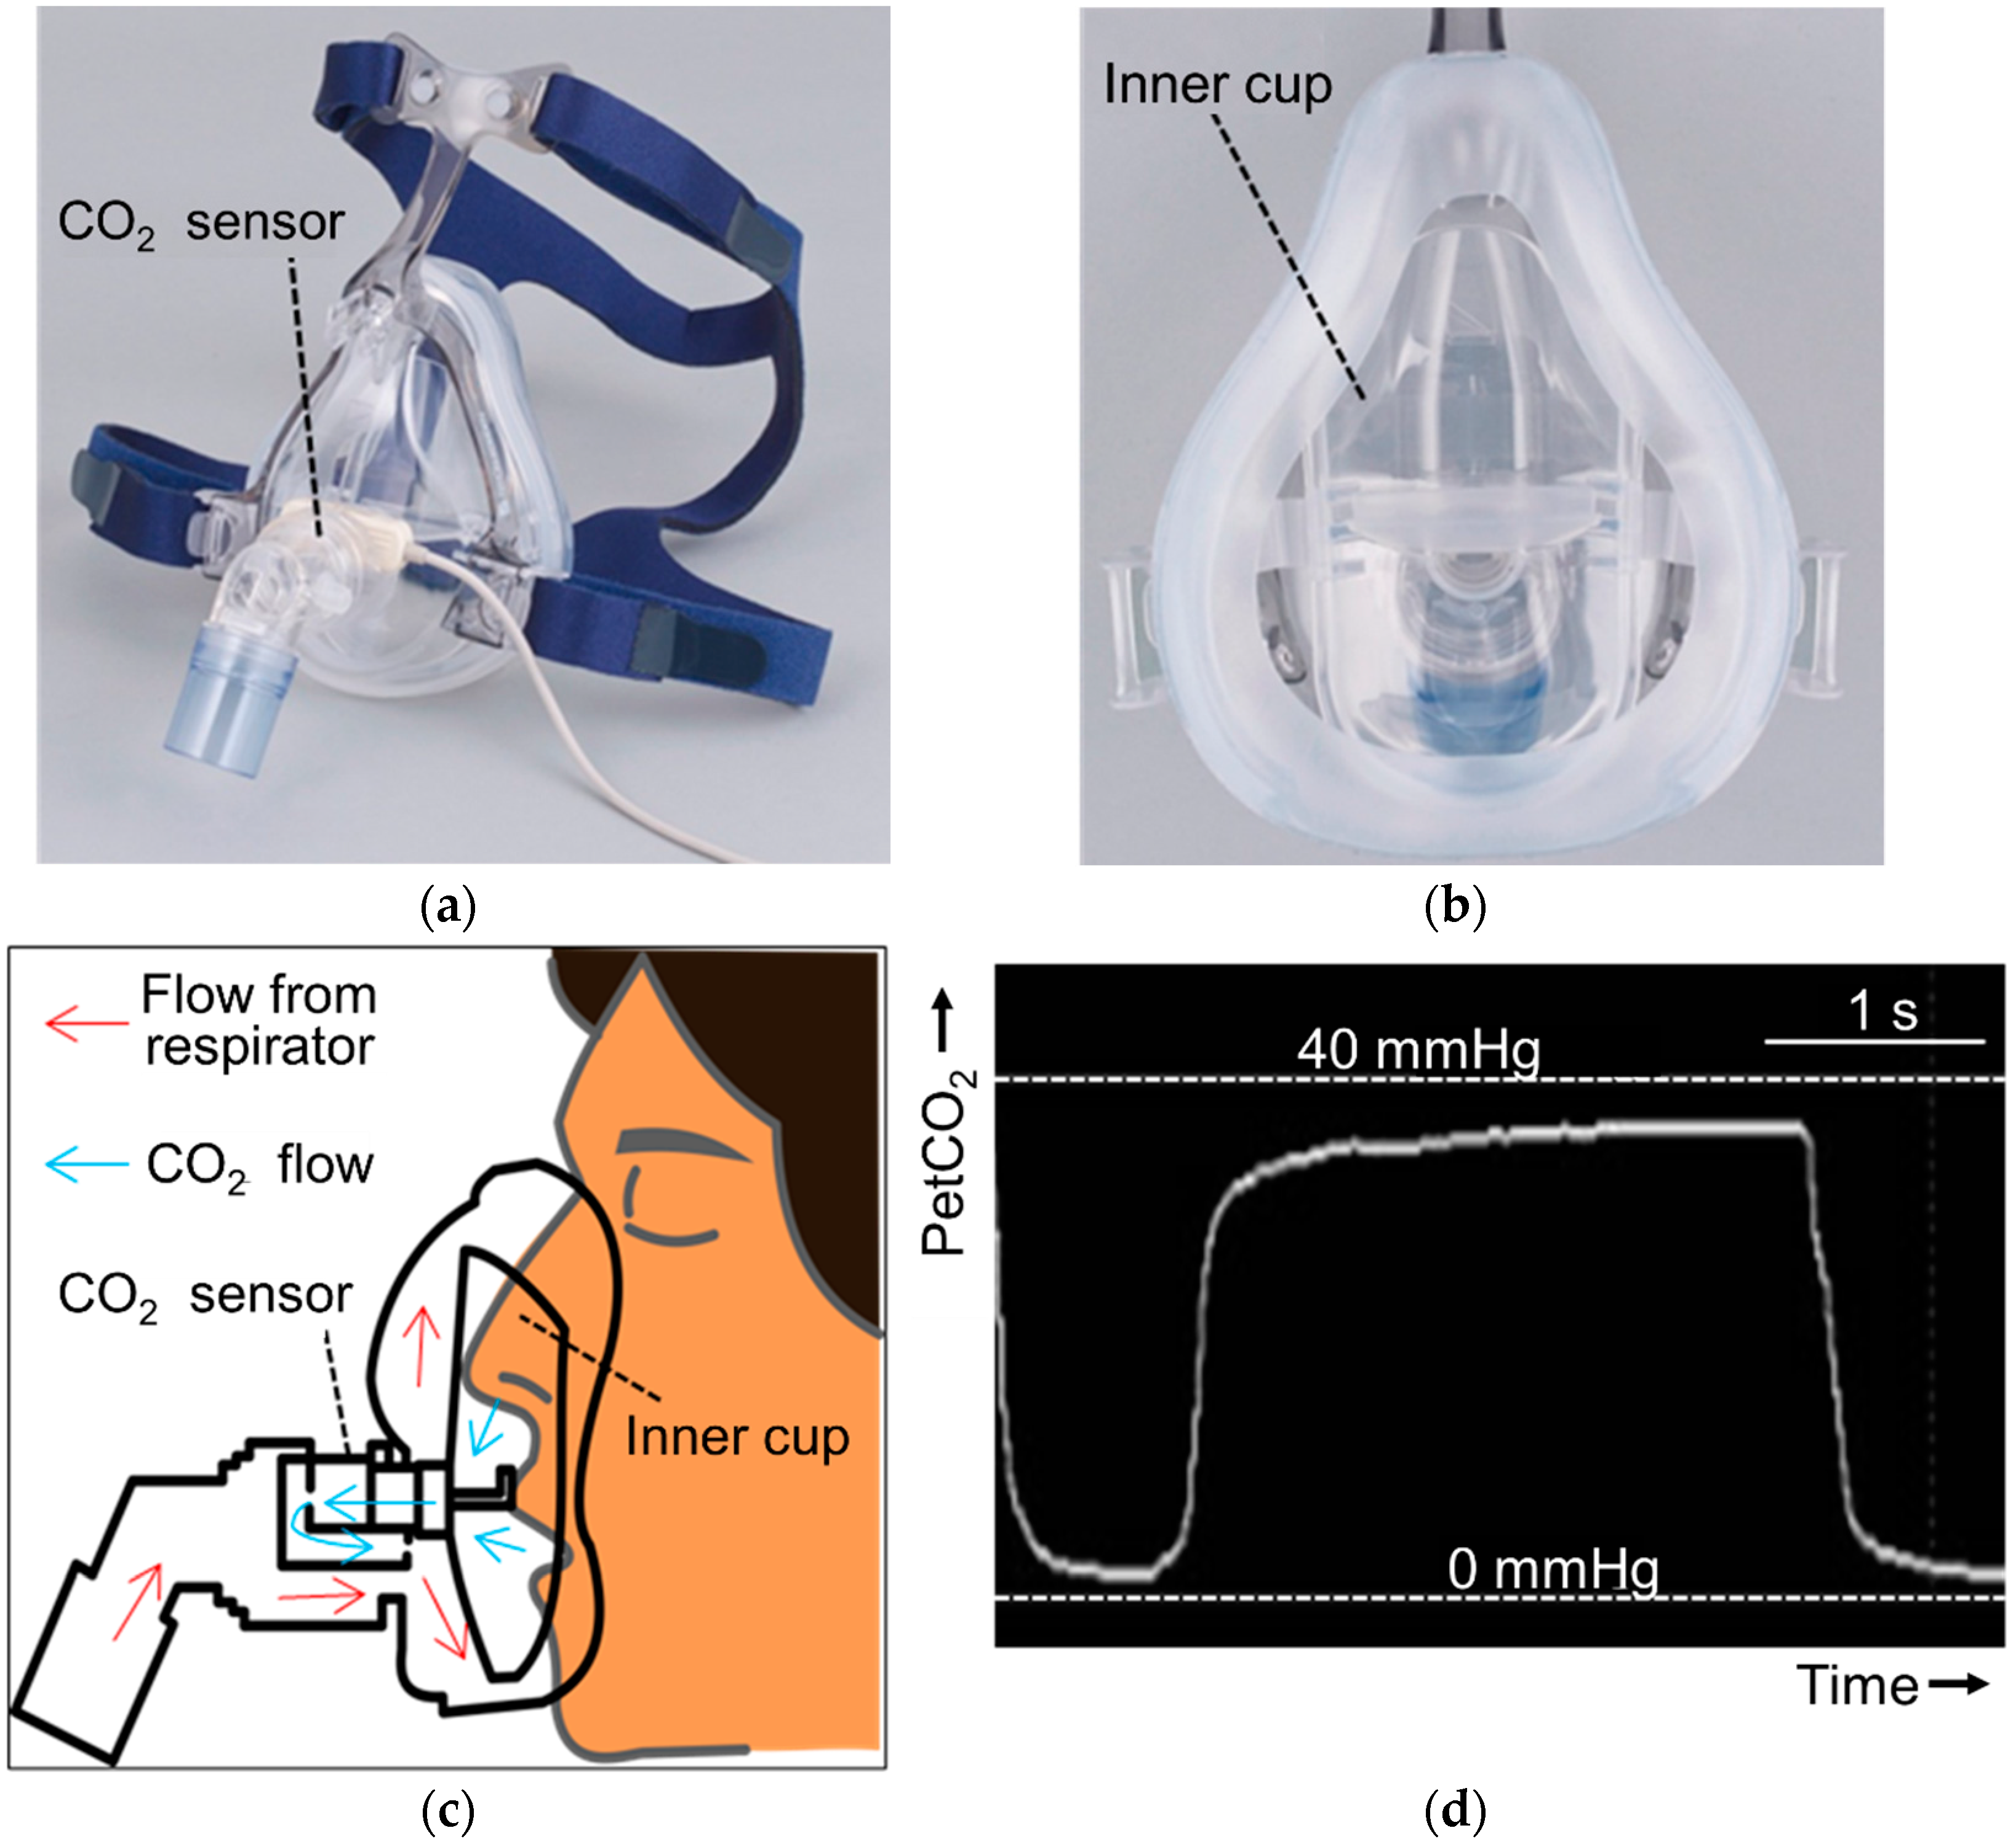
The pulse oximeter allows the measurement of the levels of systemic O2 by determining the degree of percutaneous O2 saturation (SpO2) [39,40]. Therefore, peripheral VBGA with simultaneous evaluation of SpO2 offers an alternative to arterial blood gas analysis [41,42,43]. This approach has become standard practice, particularly among pediatric patients and in the emergency department, owing to its advantages (i.e., easiness and less invasive nature) over arterial blood gas analysis [44,45,46]. Capillary blood gas analysis can also be performed. This is particularly useful in children and involves warming the extremity to arterialize the subcutaneous vascular bed and extracting a minute amount of blood using a lancet. The gas content of this sample should be similar to the values obtained for actual arterial blood samples [47,48,49]. It has been demonstrated that intentional hyperventilation increases venous–arterial PCO2 differences and pH differences [50]. Moreover, in patients with respiratory alkalosis who did not receive treatment, the condition may be underestimated by the “SpO2 plus VBGA” method [50]. Furthermore, hyperventilation increases differences in the concentration of venous–arterial bicarbonate [51]. Therefore, these changes may be attributed to a reduction in peripheral blood perfusion induced by hyperventilation-associated systemic vasoconstriction [50,51].

4.2. End-Tidal PCO2

Traditionally, the concentration of CO2 in an exhaled gas is calculated by determining the levels of chemically absorbed CO2 and other gases [52,53,54]. The absorbed CO2 is subsequently compared with the total volume of the gas, thereby revealing the levels of CO2 present. The concentration of CO2 in an exhaled gas can also be measured by gas chromatography and/or mass spectrometry, but these systems are voluminous, sturdy, and expensive [55,56,57]. The technological advancement of exhaled CO2 monitoring has enabled the reduction of system size and the adequate monitoring of ventilation using the infrared analyzer. PetCO2 is the highest and closest estimate of PaCO2 in the time course of continuous sampling of expiratory PCO2 data [54,58]. Typically, PaCO2 and PetCO2 differ by 2–5 mmHg. However, the presence of lung disease, such as acute respiratory distress syndrome, COPD, and asthma, ventilation/perfusion ( V ˙ / Q ˙ ) mismatch (especially relative increase in high V ˙ / Q ˙ regions) in the lungs can cause the PaCO2–PetCO2 difference to increase, in which case the non-invasive measurements may be potentially misleading. Patients with gas exchange impairments may be unable to efficiently exhale CO2. Therefore, PetCO2 is not a good surrogate of PaCO2 for patients with pulmonary diseases. Furthermore, PetCO2 cannot replace PaCO2 [58,59]. Nevertheless, PetCO2 has been reported to be a useful indicator of pulmonary perfusion and cardiac output during cardiopulmonary resuscitation [54,58,59,60], and its use was recommended by numerous guidelines (American Heart association [61], European Resuscitation Council [62], and American College of Emergency Physicians [63]). Particularly, the use of waveform capnography was recommended during cardiopulmonary resuscitation [59,61,62]. The return of spontaneous circulation is indicated by a sudden continuous rise in PetCO2 (≥40 mmHg) [61]. Patients with an average PetCO2 of 15 mmHg are more likely to be successfully resuscitated than those with a value of 7 mmHg [64]. In patients with a low or decreasing PetCO2, reassessment of cardiopulmonary resuscitation is recommended [61]. In adults and children, capnometry or capnography can be utilized to continuously monitor alterations in exhaled CO2 from the onset of intubation to extubation [54,58,65,66]. Both PetCO2 and (PaCO2–PetCO2) are useful for monitoring V ˙ / Q ˙ mismatch especially (physiologic deadspace)/(tidal volume) evaluation, and useful to assess pulmonary embolism [58,59]. PetCO2 monitoring is a faster indicator than pulse oximetry or ECG tracing in order to find patient mishaps such as a ventilator becoming disconnected or other catastrophic events [58].
Monitoring with capnography is recommended not only in intubated patients but also in non-intubated patients undergoing non-invasive positive pressure ventilation (NPPV) [67]. Figure 5 shows the new CO2 sensor, TG-980P (Nihon Kohden, Tokyo, Japan) and a mask, cap-ONE (Nihon Kohden, Tokyo, Japan) in the NPPV system with the recently rolled out ventilator, NKV-330 (Nihon Kohden, Tokyo, Japan). In cap-ONE, the inner cup is included, and exhaled air will efficiently reach TG-980P. Monitoring with capnography is possible at a remote place. The electromechanical response of the new devices for NPPV (NKV-330 with cap-ONE and TG-980P), as shown by breathing on the sensor measuring atmospheric PCO2, elicited an increase in PCO2 within 3 s even at remote places such as a nurse station in a hospital ward.
There are two methods to sample and detect CO2 in clinical situations: mainstream and sidestream [57,68]. Mainstream CO2 is measured using a sensor inserted in an airway adapter, and the sample is directly taken from the airway, providing accurate data. Sidestream CO2 is measured by pulling the patient’s exhalation air through a small tube into a CO2 detector that is placed at the end of the small tube. Although mainstream CO2 measurement requires a relatively large amount (150 mL/min) of sample gas, only a small amount (50 mL/min) of gas is sufficient for sidestream [68]. Currently, TG-980P is the smallest and the lightest mainstream PetCO2 sensor, where special anti-fog film is used on the window of specimens, and therefore, the heater to avoid fog is unnecessary (Figure 6).

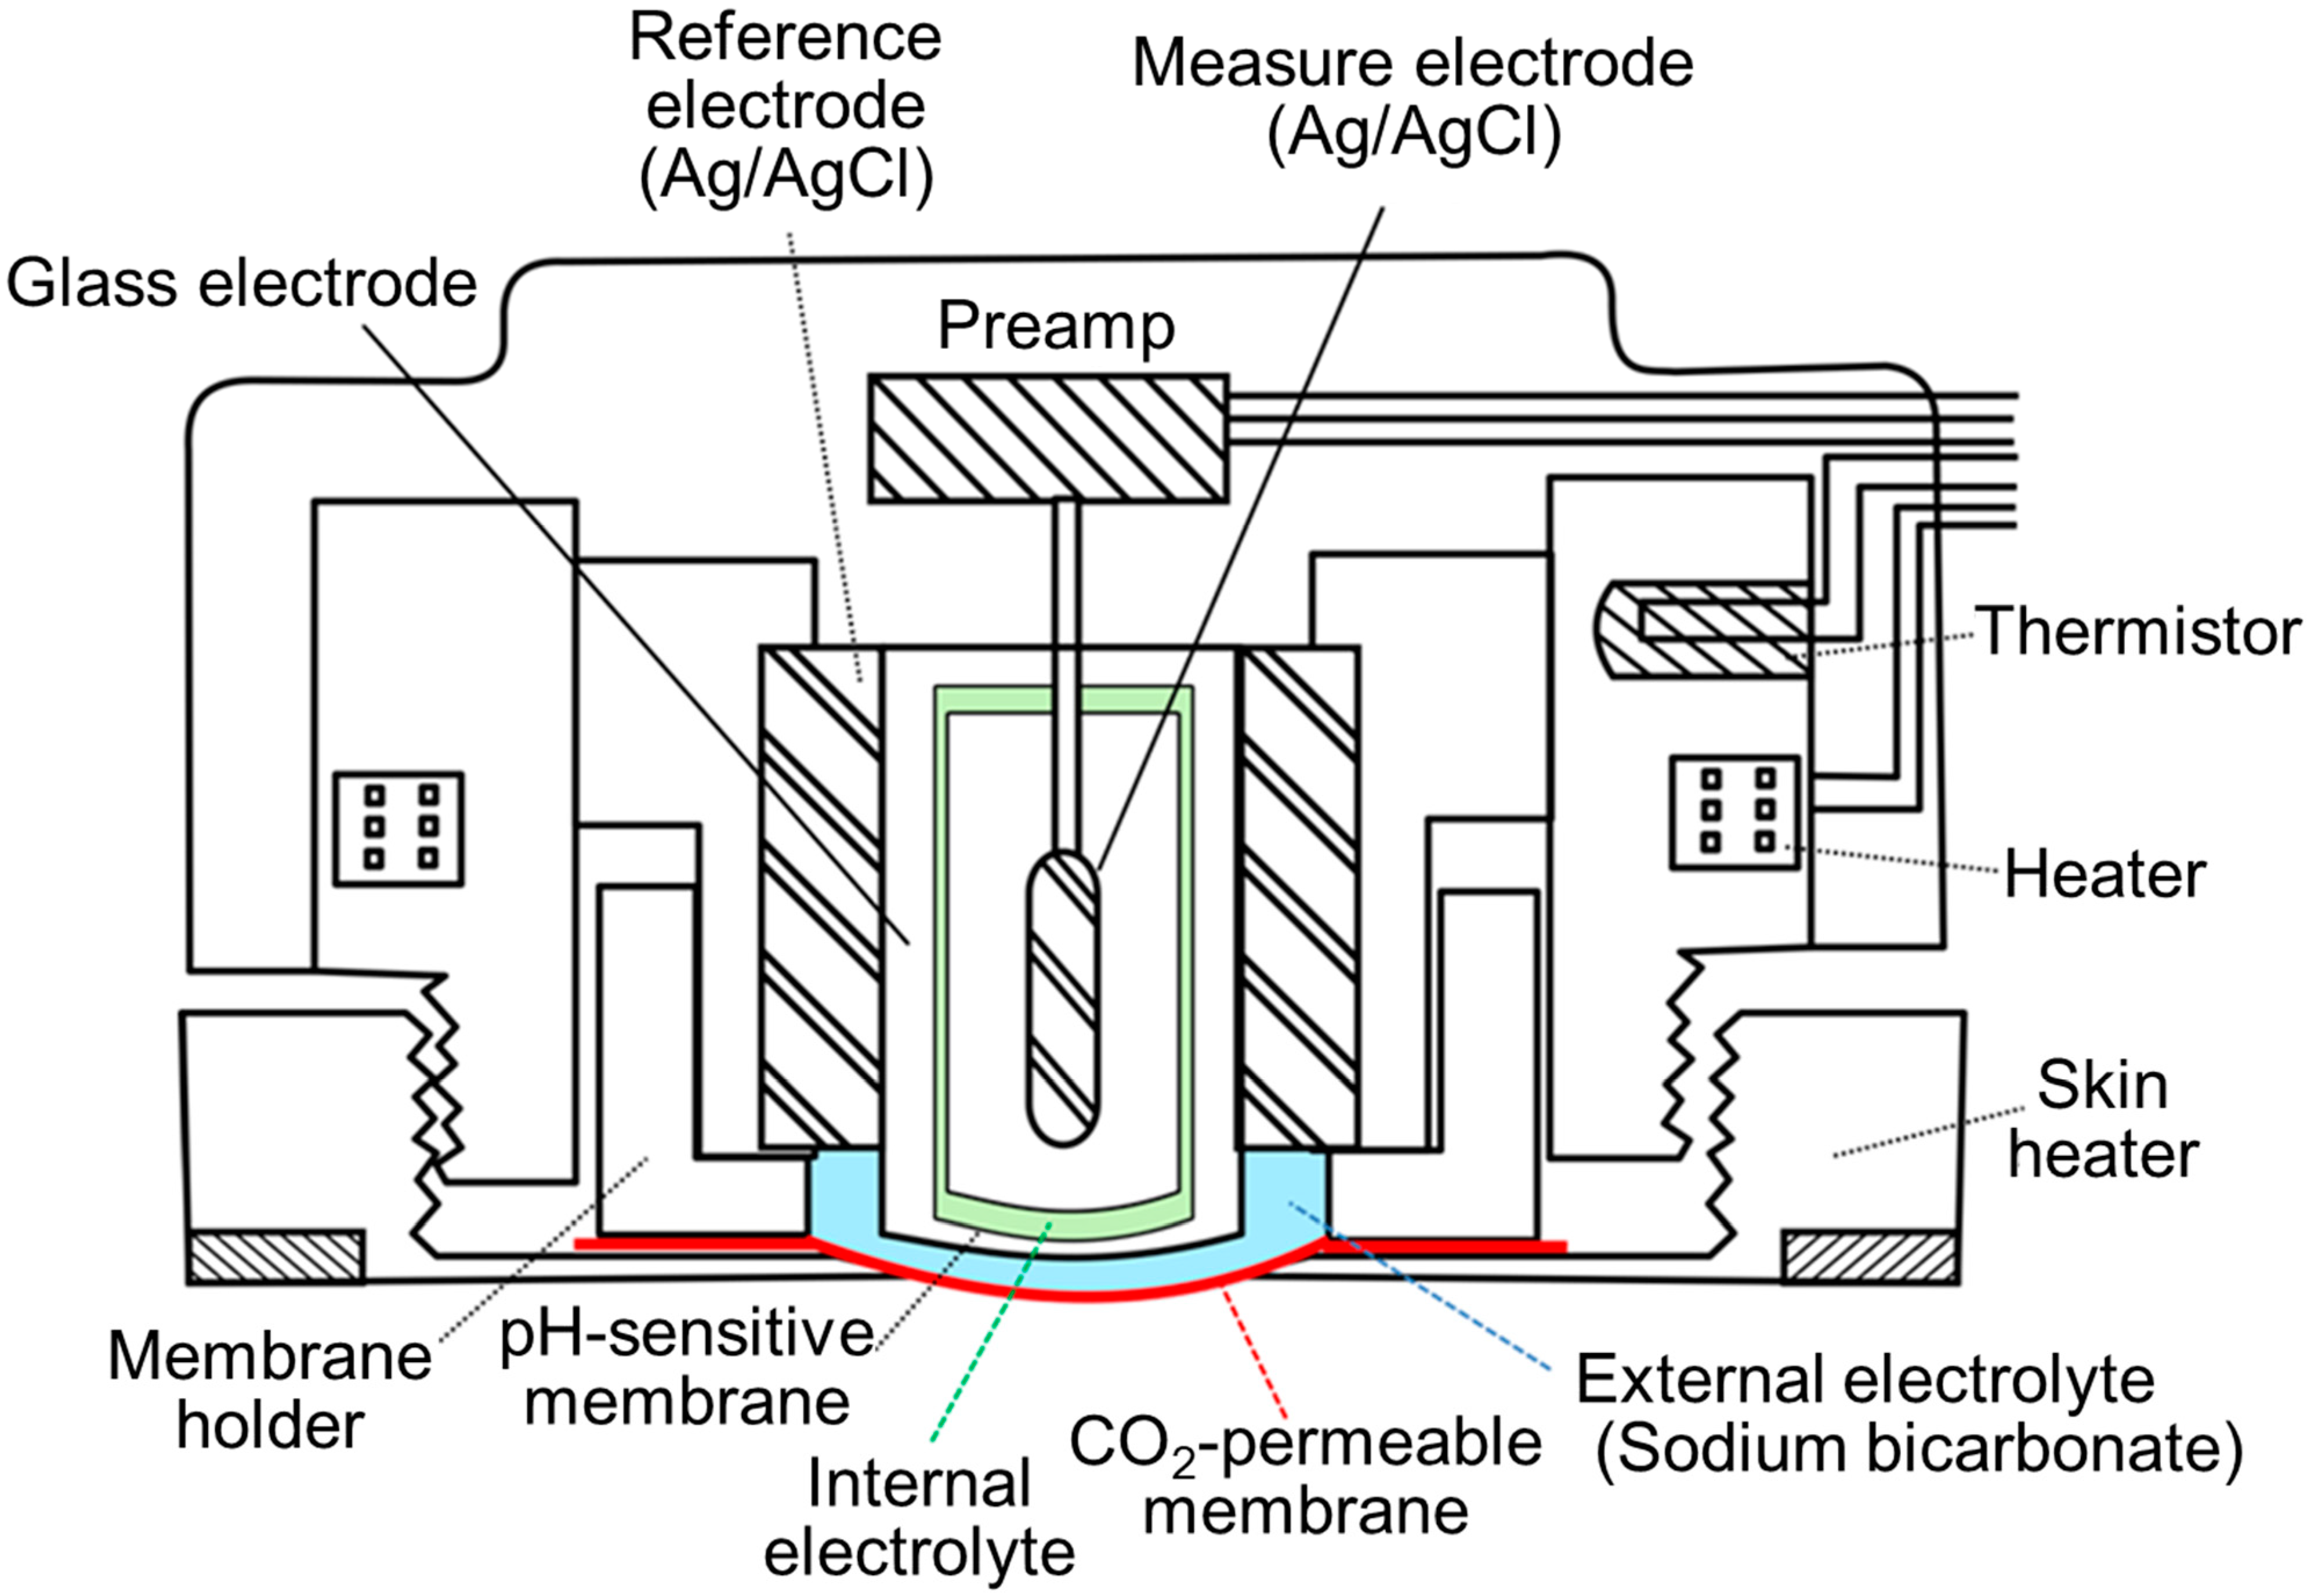
4.3. Transcutaneous Blood Gas Analysis

Evaluation of dissolved gases diffusing into the surface of the skin can be used to determine the partial pressure of gases in blood [69,70,71,72,73]. Heating of the skin locally, occasionally accompanied by measurement of transcutaneous PO2, is necessary for determining the PtcCO2. This dilation of vessels increases the flow of arterial blood to the skin capillary bed below the detector, thereby accelerating the diffusion of gas [69,70,74,75] (Figure 7). According to Severinghaus et al., the PtcCO2 electrode contains a relatively large solid silver reference electrode inside the glass pH sensor, which enhances the transfer of heat from the heater to the skin via the glass pH electrode [69,70]. The presence of an ultra-thin film of buffer electrolyte between the silver and glass appeared to be important. This internal electrolyte contains reference solution (e.g., phosphate buffer) (light green, Figure 4 and Figure 7). The external electrolyte contains bicarbonate solution (light blue, Figure 4 and Figure 7). The precise blueprints of recent PtcCO2 sensors are different according to manufacturing companies. This approach is commonly used to evaluate the pulmonary gas exchange function in pediatric patients as well as in adults with acute/chronic respiratory failure [76,77,78]. Moreover, this methodology can be employed to monitor patients receiving mechanical ventilation and managing limb ischemia [79,80,81].

4.4. Comparison of Accuracy

The accuracy of an alternative new method has been evaluated by Bland–Altman analysis for use in respiratory clinical practice (Table 1) [12,45,50,82,83,84,85,86,87,88,89].
PaCO2, arterial partial pressure of CO2; PetCO2, end-tidal CO2 partial pressure of exhaled gas; PtcCO2, transcutaneous partial pressure of CO2; PvCO2, venous partial pressure of CO2; SD, standard deviation. The width of ± 1.96 SD means the 95% limits of agreement.

5. Usefulness and limitation of Transcutaneous Blood Gas Analysis

Currently, the most accurate non-invasive alternative surrogate of PaCO2 is PtcCO2 (Table 1). We performed various subgroup analyses on the PtcCO2 bias (PtcCO2—PaCO2) in order to use PtcCO2 efficiently in the future [89].

5.1. Various Subgroup Analyses on the PtcCO2 Bias

Subgroup analyses (sex, age, PaCO2 level, and PaO2 level) were performed using the data at 30 min after the placement of detectors (n = 272).

5.1.1. Sex

The results of the analysis did not show significant differences in the PtcCO2 bias (males/females: 168/104 [89]).

5.1.2. Age

Comparison of the PtcCO2 bias between four age groups: 20–39 years (n = 11); 40–59 years (n = 12); 60–79 years (n = 138); and ≥80 years (n = 111) (Figure 8a). The PtcCO2 bias was significantly lower in young adults (20–39 years) versus those aged 40–59 years and ≥80 years (p < 0.05, respectively). PtcCO2 and PtcO2 are frequently utilized in newborns. The increases in PtcCO2 bias induced by aging may be due to the thickness of the skin with increasingly reduced permeability to gas exchange.

5.1.3. PaCO2 Level

Comparison of the PtcCO2 bias between the severe hypocapnia group (PaCO2 < 31 mmHg; n = 7), mild hypocapnia group (31 mmHg ≤ PaCO2 < 35 mmHg; n = 24), and normal range group (35 mmHg ≤ PaCO2 ≤ 45 mmHg; n = 202) is shown in Figure 8b. The PtcCO2 bias was significantly higher in the severe hypocapnia group versus the normal range group (p < 0.01), and this was an intensity-dependent effect. Comparison of bias between the normal range group (35 mmHg ≤ PaCO2 ≤ 45 mmHg; n = 202), mild hypercapnia group (45 mmHg < PaCO2 ≤ 50 mmHg; n = 26), and severe hypercapnia group (50 mmHg < PaCO2; n = 13) is shown in Figure 8c. The PtcCO2 bias was significantly lower in the mild hypercapnia group versus the normal PaCO2 group (p < 0.01). The hypocapnic systemic vasoconstriction is thought to be the mechanism of increases in the PtcCO2 bias [50]. CO2 concentration in blood is very important for peripheral blood perfusion. On the other hand, severe hypercapnic subjects (>50 mmHg) frequently have comorbid conditions such as circulatory failure, heart failure, edema, infection, etc.

5.1.4. PaO2 Level

Comparison of the PtcCO2 bias between the hypoxemia group (PaO2 < 80 mmHg; n = 158), normal range group (80 mmHg ≤ PaO2 ≤ 100 mmHg; n = 102), and hyperoxemia group (100 mmHg < PaO2, n = 12) is shown in Figure 8d. The PtcCO2 bias was significantly lower in the hypoxemia group versus the normal PaO2 group (p < 0.05), and this was thought to be a PaO2 level-dependent effect. Previous studies have investigated hypoxemic systemic vasodilation [90]. The concentration of O2 in blood appears to be associated with peripheral perfusion and PtcCO2 bias.

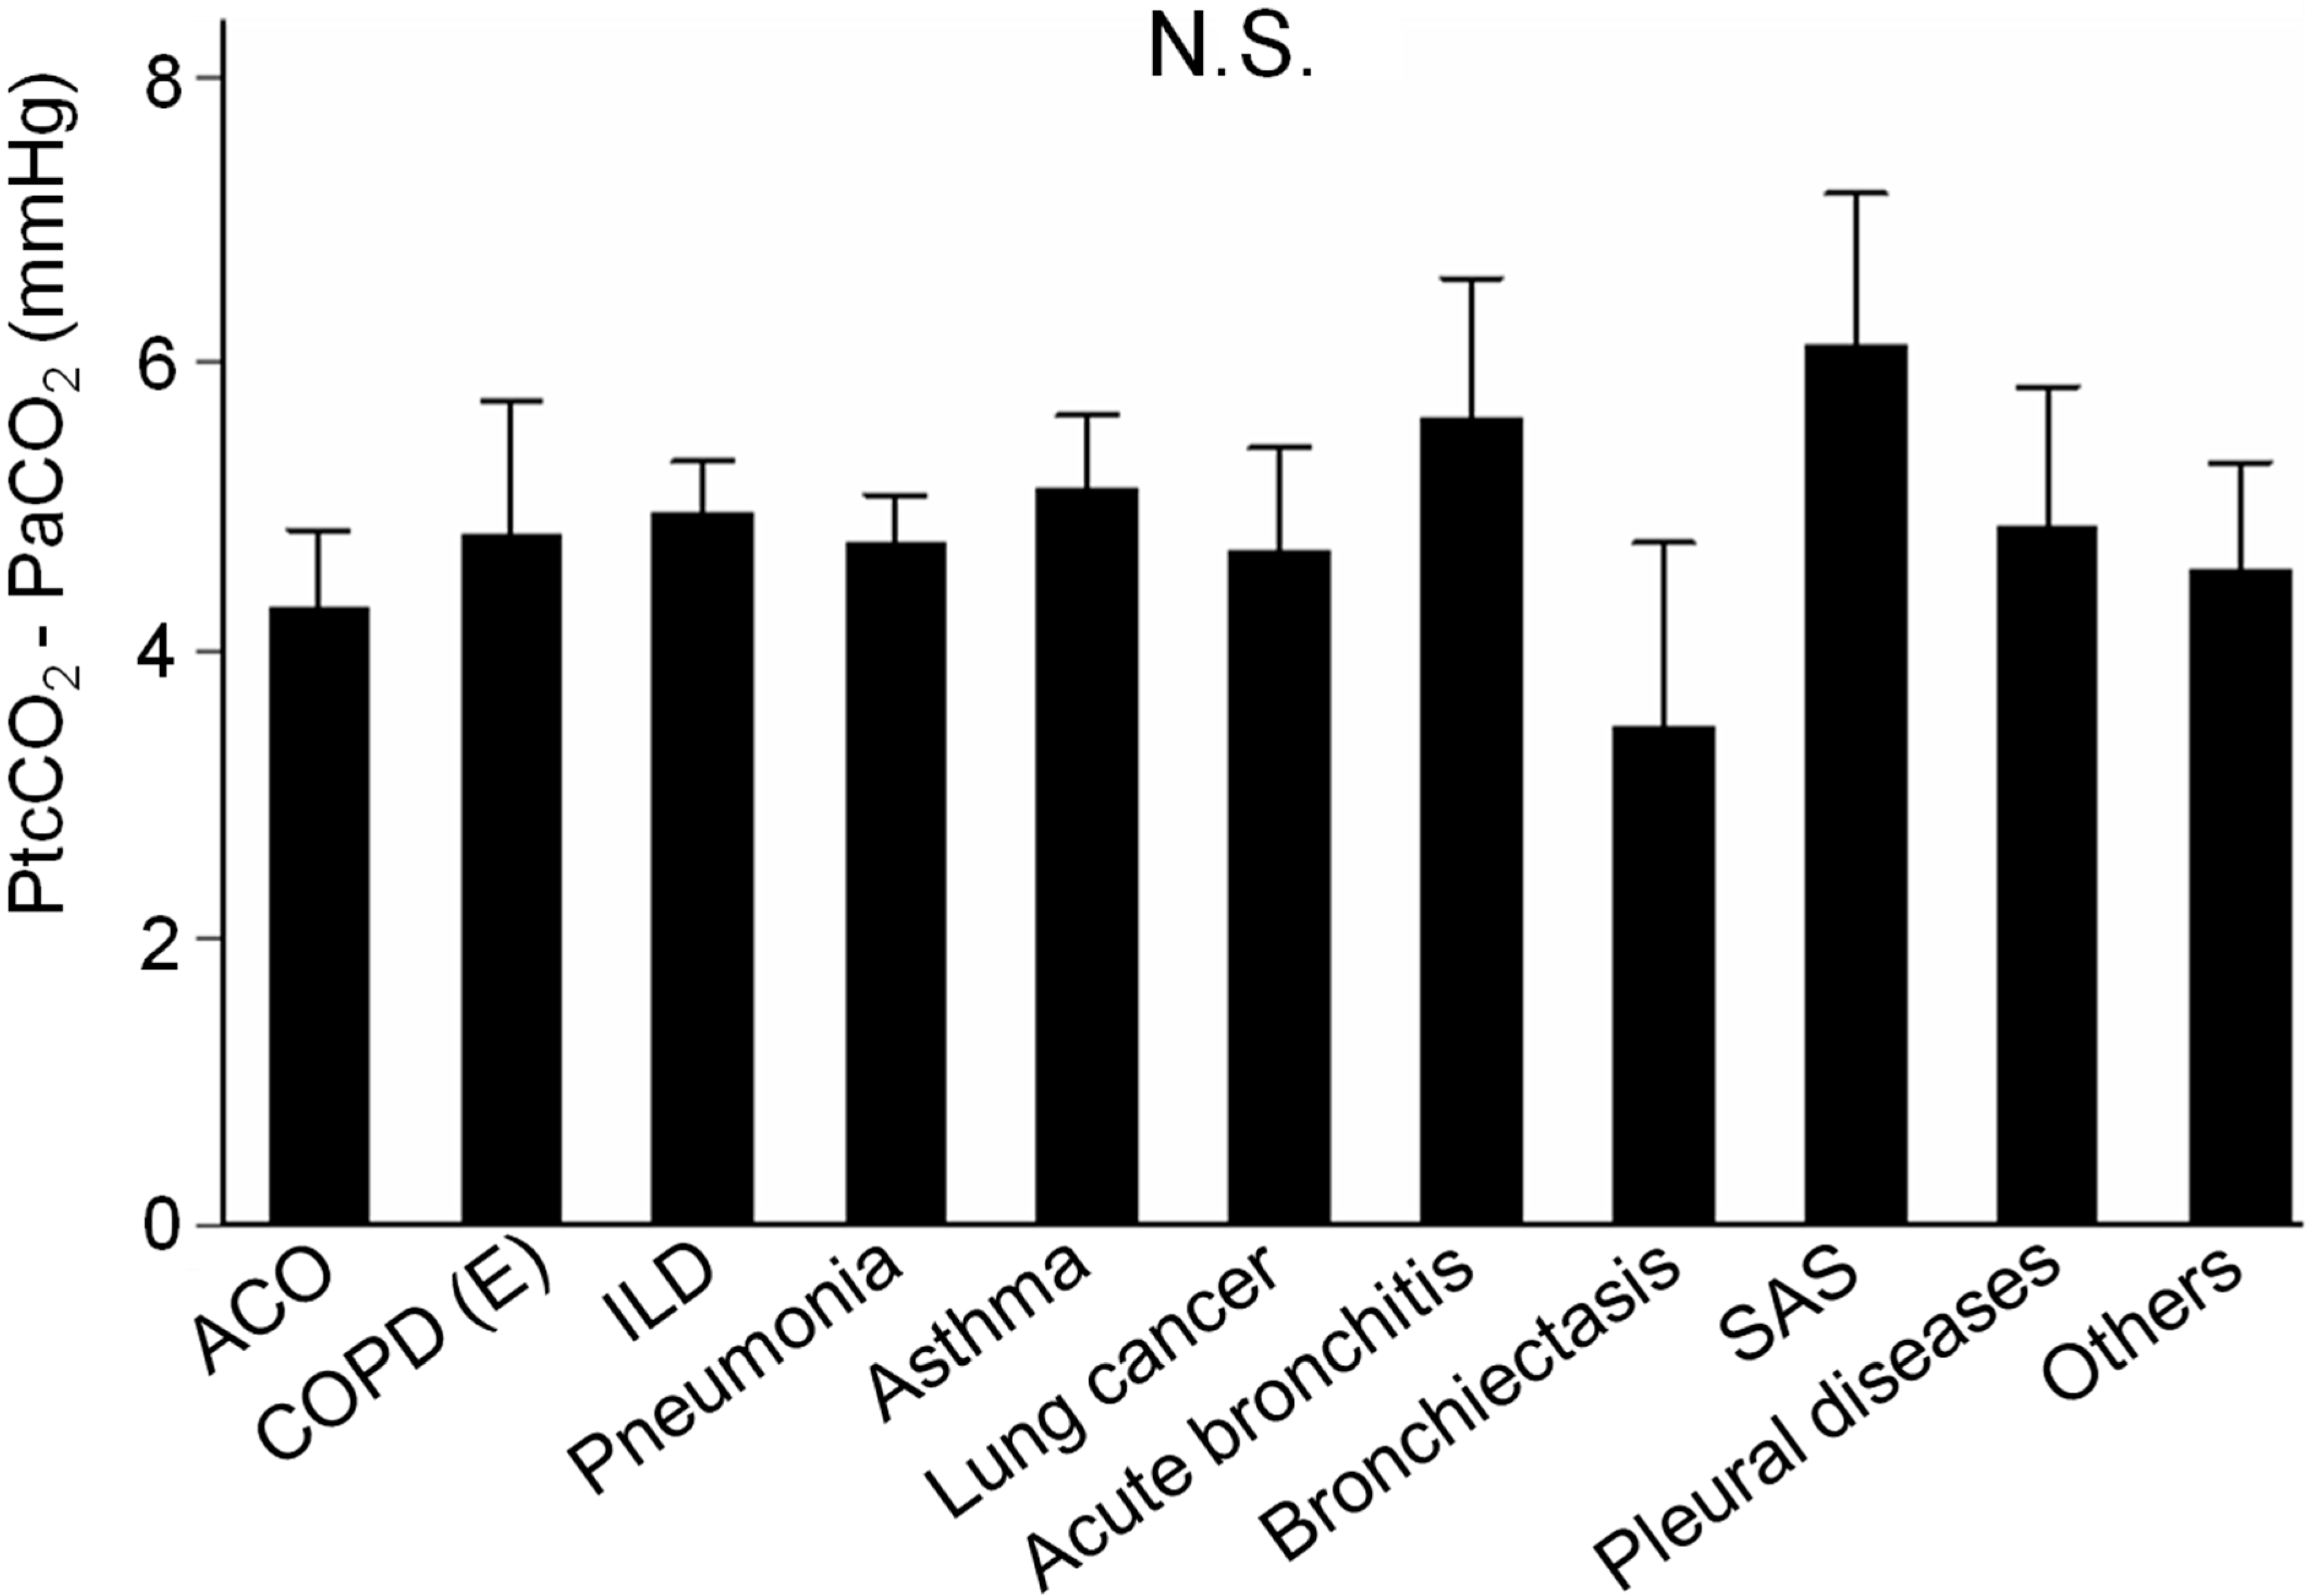
5.1.5. Among Various Respiratory Diseases

There were not significant differences in the PtcCO2 bias among various respiratory diseases in the data of [89] (Figure 9). The breakdown of respiratory diseases was as follows: asthma–COPD overlap (n = 39), COPD due to emphysema (n = 25), interstitial lung disease (n = 41), pneumonia (n = 74), asthma (n = 27), lung cancer (n = 10), acute bronchitis (n = 15), bronchiectasis (n = 7), sleep apnea syndrome (n = 6), pleural diseases (n = 5), and others (n = 15).

5.2. Usefulness

The use of this non-invasive PtcCO2 monitor leads to an accurate assessment of CO2 retention. All hypercapnia patients with PaCO2 > 50 mmHg (n = 13→20) showed PtcCO2 ≥ 50 mmHg until 12 min [89] (additional data). Utilization of thinner films for CO2-permeable and/or pH-sensitive membranes (Figure 7) may accelerate the speed to equilibration in order to reach the accurate data. The American Association for Respiratory Care has recommended an acceptable clinical range of agreement between PtcCO2 and PaCO2 (±1.96 standard deviation: ±7.5 mmHg or narrower) [80]. This range of agreement, determined through TCM4 with a tcSensor 84 (Radiometer Medical AsP, Copenhagen, Denmark), was reduced over time: ±13.6 mmHg at 4 min, ±7.5mmHg at 12–13 min, and ±6.3 mmHg at 30 min [89].

5.3. Limitations

Although PtcCO2 is currently the best non-invasive surrogate of PaCO2, there were still some cases with large bias over 10 mmHg. PaCO2 cannot be replaced with PtcCO2 completely even after considering the average bias of 4–5 mmHg (Table 1) [89]. Other limitations include the occurrence of technical drift; therefore, the baseline calibration is necessary [91,92]. In addition, rapid results are not available, and the results are not independent of dermal perfusion, edema, or increased skin thickness [91,93].

5.4. Future Use

PtcCO2 monitoring during sleep study has been reported to be useful for evaluating the necessity of ventilatory support especially in patients with neuromuscular disorders [94,95]. PtcCO2 monitoring with polysomnography may become the standard method of sleep study in the future [94]. PtcCO2 monitoring during rehabilitation may be the promising method, too [96,97,98]. However, the actual PaCO2 will not be disregarded, because the PCO2 bias is sometimes large, and PtcCO2 cannot replace PaCO2 completely [89]. Therefore, future use of PtcCO2 monitoring will be limited and may be just focusing on relative evolution.

6. Other Applications of Measuring CO2 Mainly for Research Use

Measuring CO2 in exhaled gas is also used for assessment of the metabolic condition of subjects. Energy expenditure (EE) is determined using the Weir equation (e.g., MK-5000, Muromachi Kikai, Tokyo, Japan) (Figure 10) [99,100,101]. RQ is calculated using the pulmonary exchange ratio ( V ˙ CO2/ V ˙ O2)
EE   ( kcal / kg / h )   =   ( 3.815   ×   V ˙ O 2 )   +   ( 1.232   ×   V ˙ C O 2 )   =   [ 3.815   +   ( 3.815   ×   RQ ) ]   ×   V ˙ O 2
The measurement of V ˙ CO2 and V ˙ O2 is based on the principles of infrared analysis [15,16] and magneto-electrical analysis [102], respectively. The administration of nasal continuous positive airway pressure (CPAP) in patients with sleep apnea has been linked to body weight gain [103,104]. Therefore, long-term exposure to intermittent hypoxia may result in greater reductions in O2 consumption and EE. Human and animal studies have examined the metabolic rates. However, the EE or metabolic rates were not found to be decreased in animal models of intermittent hypoxia or in OSAS patients compared to after the treatment with nasal CPAP [14,100]. Conversely, Tachikawa et al. reported significant decreases in basal metabolic rate in OSAS patients by nasal CPAP [14]. Non-agitated sleep without airway obstruction enabled by treatment with CPAP may contribute to this phenomenon. Measure of EE and the calculation of RQ by the pulmonary exchange ratio will undoubtedly contribute to obesity research and other research focused on lifestyle-related diseases in the future [100,105,106,107].
When carbohydrates, fat, and protein are oxydized, RQ are calculated to 1.0, 0.7, and 0.8, respectively [108]. Recently, Lin et al. monitored both CO2 and O2 concentrations in human breath samples using a home-made gas chromatography/milli-whistle analyzer and reported that the changes in CO2 concentrations (and the index of CO2/O2 ratio) were related to the changes in blood sugar concentrations [109]. They sugested that their compact gas chromatography system may be used for a non-invasive and time-dependent (continuous and rapid) blood sugar monitoring in the future.
In addition, historically, gas chromatography and mass spectrometry had been often used as the gas analyzer in respiratory research, and the peak expired PCO2 had been measured by this technology [55,56,57]. The advantage of these methods over the infrared CO2 analysis is that concentrations of multiple gases can be simultaneously measured. Nevertheless, the use of mass spectrometry for respiratory research has decreased since 2000, which is likely because of cost and tehcnical fragility of the mass spectrometers, which require more extensive technical support [57]. Furthermore, the method of photoinduced electron transfer is rapidly developping in various research fields, and CO2 has been reported to be detected using amine-containing fluorophores [110,111]. The evaluation of local CO2 concentrations in various small organs of animals might be possible by this technology.

7. Conclusions

In summary, measures of CO2 concentrations in the air are done using the infrared analyzer. Data are important for both the climate problem and the regulatory monitoring of buildings to avoid poor aeration and more recently COVID-19 transmission. Measure of arterial CO2 concentration is performed by measuring PaCO2 using the Severinghaus electrode. The most accurate non-invasive alternative method of PaCO2 is PtcCO2. Measure of CO2 production with O2 consumption may be used for further investigation in the various fields of metabolism, obesity with obstructive sleep apnea syndrome, and lifestyle-related diseases.

Author Contributions

Conceptualization, Y.O. and A.U.; formal analysis, A.U.; investigation, I.F., M.I., A.I. and A.M.; writing—original draft preparation, A.U.; writing—review and editing, Y.O., D.G., K.T. and K.M.; supervision, H.T.; project administration, Y.O. and A.U.; funding acquisition, A.U. All authors have read and agreed to the published version of the manuscript.

Funding

This work was partly supported by International University of Health and Welfare.

Institutional Review Board Statement

Not applicable.

Informed Consent Statement

Not applicable.

Data Availability Statement

Not applicable.

Acknowledgments

We thank Airi Umeda for the help of drawing figures.

Conflicts of Interest

The authors declare no conflict of interest.

Abbreviations

The following abbreviations are used in this manuscript:
ABGAArterial blood gas analysis
ACOAsthma chronic obstructive pulmonary disease overlap
Ag/AgClSilver electrode plated with silver chloride
ANOVAAnalysis of variance
[Cl]Plasma chloride concentration
COPDChronic obstructive pulmonary disease
CO2Carbon dioxide
COVID-19Corona virus disease 2019
CPAPContinuous positive airway pressure
EEmphysema
EEEnergy expenditure
H+Hydrogen ion
HCO3Bicarbonate ion
[HCO3]Bicarbonate concentration
H2CO3Carbonic acid
ILDInterstitional lung disease
[Na+]Plasma sodium concentration
NPPVNon-invasive positive pressure ventilation
N.S.Not significant
OSASObstructive sleep apnea syndrome
O2Oxygen
PaCO2Arterial partial pressure of carbon dioxide
PaO2Arterial partial pressure of oxygen
PCO2Partial pressure of carbon dioxide
PetCO2End-tidal carbon dioxide partial pressure of exhaled gas
PO2Partial pressure of oxygen
PtcCO2Transcutaneous partial pressure of carbon dioxide
RQRespiratory quotient
SARS-CoV-2Severe acute respiratory syndrome coronavirus 2
SAS Sleep apnea syndrome
SDStandard deviation
SEM Standard error of the mean
SpO2 Percutaneous oxygen saturation
VBGAVenous blood gas analysis
V ˙ CO2Carbon dioxide production
V ˙ O2Oxygen consumption
V ˙ / Q ˙ Ventilation/perfusion

References

  1. Bernstein, A.S. Climate change and infectious disease. In Harrison’s Principles of Internal Medicine, 20th ed.; McGraw-Hill Education: New York, NY, USA, 2018; pp. 900–908. [Google Scholar]
  2. The World Data Centre for Greenhouse Gases. World Meteorological Organization. WMO WDCGG Data Summary. WDCGG No. 44. Available online: https://gaw.kishou.go.jp/publications/summary (accessed on 18 August 2021).
  3. Eliseeva, O.V. On the determination of maximum permissible carbon dioxide concentrations in the air of apartment buildings and public buildings. Gig Sanit. 1964, 29, 10–15. [Google Scholar]
  4. Goromosov, M.S. The Physiological Basis of Health Standards for Dwellings; Public Health Papers No. 33; World Health Organization: Geneva, Switzerland, 1968; Available online: https://apps.who.int/iris/handle/10665/39749 (accessed on 18 August 2021).
  5. Peng, Z.; Jimenez, J.L. Exhaled CO2 as COVID-19 infection risk proxy for different indoor environments and activities. Environ. Sci. Technol. Lett. 2021, 8, 392–397. [Google Scholar] [CrossRef]
  6. Zhu, N.; Zhang, D.; Wang, W.; Li, X.; Yang, B.; Song, J.; Zhao, X.; Huang, B.; Shi, W.; Lu, R.; et al. For the China Novel Coronavirus investigating and research team. A novel coronavirus from patients with Pneumonia in China, 2019. N. Engl. J. Med. 2020, 382, 727–733. [Google Scholar] [CrossRef]
  7. Goyal, P.; Choi, J.J.; Pinheiro, L.C.; Schenck, E.J.; Chen, R.; Jabri, A.; Satlin, M.J.; Campion, T.R., Jr.; Nahid, M.; Ringel, J.B.; et al. Clinical characteristics of COVID-19 in New York City. N. Engl. J. Med. 2020, 382, 2372–2374. [Google Scholar] [CrossRef]
  8. Wiersinga, W.J.; Rhodes, A.; Cheng, A.C.; Peacock, S.J.; Prescott, H.C. Pathophysiology, transmission, diagnosis and treatment of coronavirus disease 2019 (COVID-19): A Review. JAMA 2020, 324, 782–793. [Google Scholar] [CrossRef]
  9. Stoller, J.K.; Hill, N.S. Respiratory monitoring in critical care. In Goldman-Cecil Medicine, 26th ed.; Goldman, L., Schhafer, A.I., Eds.; Elsevier: Philadelphia, PA, USA, 2020; pp. 622–625. [Google Scholar]
  10. Matthay, M.A.; Ware, L.B. Acute respiratory failure. In Goldman-Cecil Medicine, 26th ed.; Goldman, L., Schhafer, A.I., Eds.; Elsevier: Philadelphia, PA, USA, 2020; pp. 625–635. [Google Scholar]
  11. Malley, W.J. Arterial blood gases. In Clinical Blood Gases: Assessment and Intervention, 2nd ed.; Elsevier Saunders: St. Louis, MO, USA; Elsevier: Philadelphia, PA, USA, 2005; pp. 3–34. [Google Scholar]
  12. Bland, J.M.; Altman, D.G. Statistical methods for assessing agreement between two methods of clinical measurement. Lancet 1986, 1, 307–310. [Google Scholar] [CrossRef]
  13. West, J.B. Ventilation/Blood Flow and Gas Exchange, 4th ed.; Blackwell Scientific Publications: Oxford, UK, 1985. [Google Scholar]
  14. Tachikawa, R.; Ikeda, K.; Minami, T.; Matsumoto, T.; Hamada, S.; Murase, K.; Tanizawa, K.; Inouchi, M.; Oga, T.; Akamizu, T.; et al. Changes in energy metabolism after continuous positive airway pressure for obstructive sleep apnea. Am. J. Respir. Crit. Care Med. 2016, 194, 729–738. [Google Scholar] [CrossRef] [PubMed] [Green Version]
  15. Bate, G.C.; D’Aoust, A.; Canvin, D.T. Calibration of Infra-Red CO2 Gas Analyzers. Plant. Physiol. 1969, 44, 1122–1126. [Google Scholar] [CrossRef] [PubMed] [Green Version]
  16. Ramwell, P.W.; Dawson, J.B. The calibration of infra-red gas analysers for use in the estimation of carbon dioxide. Phys. Med. Biol. 1958, 2, 280–286. [Google Scholar] [CrossRef]
  17. Fowler, R.C. A rapid infra-red gas analyzer. Rev. Sci Instrum. 1949, 20, 175–178. [Google Scholar] [CrossRef]
  18. HORIBA, Ltd. NDIR: Non Dispersive Infrared. Available online: https://www.horiba.com/jp/scientific/core-technology/ndir/ (accessed on 9 May 2021).
  19. Permentier, K.; Vercammen, S.; Soetaert, S.; Schellemans, C. Carbon dioxide poisoning: A literature review of an often forgotten cause of intoxication in the emergency department. Int. J. Emerg. Med. 2017, 10, 14. [Google Scholar] [CrossRef] [PubMed]
  20. Duarte, C.M.; Jaremko, Ł.; Jaremko, M. Hypothesis: Potentially systemic impacts of elevated CO2 on the human proteome and health. Front. Public Health. 2020, 8, 543322. [Google Scholar] [CrossRef]
  21. Martin, A.K.T. Shut that window! Open that window! Coronavirus in winter presents new challenge. Japan Times, 28 December 2020. [Google Scholar]
  22. Gilio, A.D.; Palmisani, J.; Pulimeno, M.; Cerino, F.; Cacace, M.; Miani, A.; Gennaroa, G.D. CO2 concentration monitoring inside educational buildings as a strategic tool to reduce the risk of SARS-CoV-2 airborne transmission. Environ. Res. 2021, 202, 111560. [Google Scholar] [CrossRef]
  23. Morawska, L.; Cao, J. Airborne transmission of SARS-CoV-2: The world should face the reality. Environ. Int. 2020, 139, 105730. [Google Scholar] [CrossRef] [PubMed]
  24. Correia, G.; Rodrigues, L.; Silva, M.G.D.; Gonçalves, T. Airborne route and bad use of ventilation systems as non-negligible factors in SARS-CoV-2 transmission. Med. Hypotheses 2020, 141, 109781. [Google Scholar] [CrossRef]
  25. Office for Novel Coronavirus Disease Control, Cabinet Secretariat, Government of Japan. Suggestion to the Japanese Governmental Officers to Facilitate the Important Writings to Various Guidelines in Order to Prevent COVID-19. 11 November 2020. Available online: https://www.mhlw.go.jp/content/000695178.pdf (accessed on 14 May 2021).
  26. Marr, L.; Miller, S.; Prather, K.; Haas, C.; Bahnfleth, W.; Corsi, R.; Tang, J.; Herrmann, H.; Pollitt, K.; Ballester, J.; et al. FAQs on Protecting Yourself from COVID-19 Aerosol Transmission. Version: 1.87. 9 December 2020. Available online: http://tinyurl.com/faqs-aerosol (accessed on 31 July 2021).
  27. Jiji, K. Four die in fire suppression system accident in Tokyo parking garage. Japan Times, 16 April 2021. [Google Scholar]
  28. Malley, W.J. Blood gas electrodes and quality assurance. In Clinical Blood Gases: Assessment and Intervention, 2nd ed.; Elsevier Saunders: St. Louis, MO, USA; Elsevier: Philadelphia, PA, USA, 2005; pp. 82–113. [Google Scholar]
  29. Severinghaus, J.W.; Astrup, P.B. History of blood gas analysis. III. Carbon dioxide tension. J. Clin. Monit. 1986, 2, 60–73. [Google Scholar] [CrossRef]
  30. McConville, J.F.; Solway, J.; Mokhlesi, B. Disorders of venntilation. In Harrison’s Principles of Internal Medicine, 20th ed.; McGraw-Hill Education: New York, NY, USA, 2018; pp. 2010–2013. [Google Scholar]
  31. Silverman, E.K.; Crapo, J.D.; Make, B.J. Chronic obstructive pulmonary disease. In Harrison’s Principles of Internal Medicine, 20th ed.; McGraw-Hill Education: New York, NY, USA, 2018; pp. 1990–1999. [Google Scholar]
  32. DuBose, T.D., Jr. Acidosis and alkalosis. In Harrison’s Principles of Internal Medicine, 20th ed.; McGraw-Hill Education: New York, NY, USA, 2018; pp. 315–324. [Google Scholar]
  33. Goldring, R.M.; Kazemi, H. Regulation of ventilation in metabolic acidosis and alkalosis. In Pulmonary Diseases and Disorders, 2nd ed.; Fisherman, A.P., Ed.; McGraw-Hill: New York, NY, USA, 1988; pp. 281–288. [Google Scholar]
  34. Sharma, S.; Hashmi, M.F.; Aggarwal, S. Hyperchloremic Acidosis; StatPearls Publishing: Treasure Island, FL, USA, 2021. Available online: https://pubmed.ncbi.nlm.nih.gov/29493965/ (accessed on 18 August 2021).
  35. Malley, W.J. Blood gas classification. In Clinical Blood Gases: Assessment and Intervention, 2nd ed.; Elsevier Saunders: St. Louis, MO, USA; Elsevier: Philadelphia, PA, USA, 2005; pp. 35–57. [Google Scholar]
  36. Malley, W.J. Regulation of acids, bases, and electrolytes. In Clinical Blood Gases: Assessment and Intervention, 2nd ed.; Elsevier Saunders: St. Louis, MO, USA; Elsevier: Philadelphia, PA, USA, 2005; pp. 307–331. [Google Scholar]
  37. American Association for Respiratory Care. AARC clinical practice guideline. Sampling for arterial blood gas analysis. Respir. Care 1992, 37, 913–917. [Google Scholar]
  38. Slutsky, A.S.; Brochard, L. Mechanical ventilation. In Goldman-Cecil Medicine, 26th ed.; Goldman, L., Schhafer, A.I., Eds.; Elsevier: Philadelphia, PA, USA, 2020; pp. 635–641. [Google Scholar]
  39. Severinghaus, J.W.; Honda, Y. History of blood gas analysis. VII. Pulse oximetry. J. Clin. Monit. 1987, 3, 135–138. [Google Scholar] [CrossRef]
  40. Lee, W.W.; Mayberry, K.; Crapo, R.; Jensen, R.L. The accuracy of pulse oximetry in the emergency department. Am. J. Emerg. Med. 2000, 18, 427–431. [Google Scholar] [CrossRef] [PubMed]
  41. Brooks, D.; Wynn, V. Use of venous blood for pH and carbon-dioxide studies: Especially in respiratory failure and during anaesthesia. Lancet. 1959, 1, 227–230. [Google Scholar] [CrossRef]
  42. Harrison, E.M.; Galloon, S. Venous blood as an alternative to arterial blood for the measurement of carbon dioxide tensions. Br. J. Anaesth. 1965, 37, 13–18. [Google Scholar] [CrossRef] [Green Version]
  43. Brandenburg, M.A.; Dire, D.J. Comparison of arterial and venous blood gas values in the initial emergency department evaluation of patients with diabetic ketoacidosis. Ann. Emerg. Med. 1998, 31, 459–465. [Google Scholar] [CrossRef]
  44. Gokel, Y.; Paydas, S.; Koseoglu, Z.; Alparslan, N.; Seydaoglu, G. Comparison of blood gas and acid-base measurements in arterial and venous blood samples in patients with uremic acidosis and diabetic ketoacidosis in the emergency room. Am. J. Nephrol. 2000, 20, 319–323. [Google Scholar] [CrossRef] [PubMed]
  45. Kelly, A.M.; Kyle, E.; McAlpine, R. Venous pCO2 and pH can be used to screen for significant hypercarbia in emergency patients with acute respiratory disease. J. Emerg. Med. 2002, 22, 15–19. [Google Scholar] [CrossRef]
  46. Rang, L.C.F.; Murray, H.E.; Wells, G.A.; MacGougan, C.K. Can peripheral venous blood gases replace arterial blood gases in emergency department patients? Can. J. Emerg. Med. 2002, 4, 7–15. [Google Scholar] [CrossRef] [Green Version]
  47. Harrison, A.M.; Lynch, J.M.; Dean, J.M.; White, M.K. Comparison of simultaneously obtained arterial and capillary blood gases in pediatric intensive care unit patients. Crit. Care Med. 1997, 25, 1904–1908. [Google Scholar] [CrossRef] [PubMed]
  48. McGillivray, D.; Ducharme, F.M.; Charron, Y.; Mattimoe, C.; Treherne, S. Clinical decision making based on venous versus capillary blood gas values in the wellperfused child. Ann. Emerg. Med. 1999, 34, 58–63. [Google Scholar] [CrossRef]
  49. Zavorsky, G.S.; Cao, J.; Mayo, N.E.; Gabbay, R.; Murias, J.M. Arterial versus capillary blood gases: A meta-analysis. Respir. Physiol. Neurobiol. 2007, 155, 268–279. [Google Scholar] [CrossRef] [PubMed]
  50. Umeda, A.; Kawasaki, K.; Abe, T.; Watanabe, M.; Ishizaka, A.; Okada, Y. Hyperventilation and finger exercise increase venous-arterial PCO2 and pH differences. Am. J. Emerg. Med. 2008, 26, 975–980. [Google Scholar] [CrossRef]
  51. Umeda, A.; Kawasaki, K.; Abe, T.; Yamane, T.; Okada, Y. Effects of hyperventilation on venous-arterial bicarbonate concentration difference: A possible pitfall in venous blood gas analysis. Int. J. Clin. Med. 2014, 5, 76–80. [Google Scholar] [CrossRef] [Green Version]
  52. Scholander, P.F. Analyzer for accurate estimation of respiratory gases in one-half cubic centimeter samples. J. Biol Chem. 1947, 167, 235–250. [Google Scholar] [CrossRef]
  53. Forbes, A.M.; Behar, M.G.; Smith, T.C. Analysis of oxygen, carbon dioxide and nitrous oxide mixtures with the Scholander apparatus. Anesthesiology 1967, 28, 928–933. [Google Scholar] [CrossRef]
  54. Siobal, M.S. Monitoring Exhaled Carbon Dioxide. Respir. Care 2016, 61, 1397–1416. [Google Scholar] [CrossRef] [Green Version]
  55. Johansson, U.B. Determination of respiratory gases (CO2, O2, Ar and N2) with gas solid chromatography. Scand. J. Clin. Lab. Investig. 1983, 43, 91–94. [Google Scholar] [CrossRef]
  56. Whitesell, R.; Asiddao, C.; Gollman, D.; Jablonski, J. Relationship between arterial and peak expired carbon dioxide pressure during anesthesia and factors influencing the difference. Anesth. Analg. 1981, 60, 508–512. [Google Scholar] [CrossRef] [PubMed]
  57. Arieli, R. Mass spectrometer for respiratory research. Respir. Physiol. Neurobiol. 2010, 170, 183–184. [Google Scholar] [CrossRef]
  58. Malley, W.J. Noninvasive blood gas monitoring. In Clinical Blood Gases: Assessment and Intervention, 2nd ed.; Elsevier Saunders: St. Louis, MO, USA; Elsevier: Philadelphia, PA, USA, 2005; pp. 387–418. [Google Scholar]
  59. Walsh, B.K.; Crotwell, D.N.; Restrepo, R.D. AARC clinical practice guideline: Capnography/Capnometry during mechanical ventilation: 2011. Respir. Care 2011, 56, 503–509. [Google Scholar] [CrossRef] [PubMed]
  60. Falk, J.L.; Rackow, E.C.; Weil, M.H. End-tidal carbon dioxide concentration during cardiopulmonary resuscitation. N. Engl. J. Med. 1988, 318, 607–611. [Google Scholar] [CrossRef]
  61. Panchal, A.R.; Bartos, J.A.; Cabañas, J.G.; Donnino, M.W.; Drennan, I.R.; Hirsch, K.G.; Kudenchuk, P.J.; Kurz, M.C.; Lavonas, E.J.; Morley, P.T.; et al. Adult basic and advanced life support writing group. Part 3: Adult Basic and advanced life support: 2020 American Heart Association guidelines for cardiopulmonary resuscitation and emergency cardiovascular care. Circulation 2020, 142, S366–S468. [Google Scholar] [CrossRef]
  62. Soar, J.; Böttiger, B.W.; Carli, P.; Couper, K.; Deaking, C.D.; Djärv, T.; Carsten, L.; Olasveengen, T.; Paal, P.; Pellis, T.; et al. European Resuscitation Council Guidelines 2021: Adult advanced life support. Resuscitation 2021, 161, 115–151. [Google Scholar] [CrossRef] [PubMed]
  63. American College of Emergency Physicians. Policy Statement: Verification of Endotracheal Tube Placement. Revised January 2016. Available online: https://www.acep.org/patient-care/policy-statements/verification-of-endotracheal-tube-placement/ (accessed on 19 August 2021).
  64. Sanders, A.B.; Kern, K.B.; Otto, C.W.; Milander, M.M.; Ewy, G.A. End-Tidal carbon dioxide monitoring during cardiopulmonary resuscitation. A prognostic indicator for survival. JAMA 1989, 262, 1347–1351. [Google Scholar] [CrossRef]
  65. Cheifetz, I.M.; Myers, T.R. Respiratory therapies in the critical care setting. Should every mechanically ventilated patient be monitored with capnography from intubation to extubation? Respir. Care 2007, 52, 423–442. [Google Scholar]
  66. American Society of Anesthesiologists. Standards for Basic Anesthetic Monitoring. Developed By: Committee on Standards and Practice Parameters. Available online: https://www.asahq.org/standards-and-guidelines/standards-for-basic-anesthetic-monitoring (accessed on 18 August 2021).
  67. Restrepo, R.D.; Nuccio, P.; Spratt, G.; Waugh, J. Current applications of capnography in non-intubated patients. Expert. Rev. Respir. Med. 2014, 8, 629–639. [Google Scholar] [CrossRef]
  68. Duyu, M.; Bektas, A.D.; Karakaya, Z.; Bahar, M.; Gunalp, A.; Caglar, Y.M.; Yersel, M.N.; Bozkurt, O. Comparing the novel microstream and the traditional mainstream method of end-tidal CO2 monitoring with respect to PaCO2 as gold standard in intubated critically ill children. Sci. Rep. 2020, 10, 22042. [Google Scholar] [CrossRef]
  69. Severinghaus, J.W.; Bradley, A.F.; Stafford, M.J. Transcutaneous PCO2 electrode design with internal silver heat path. Birth Defects Orig. Artic. Ser. 1979, 15, 265–270. [Google Scholar]
  70. Severinghaus, J.W.; Stafford, M.; Bradley, A.F. tcPCO2 electrode design, calibration and temperature gradient problems. Acta Anaesthesiol. Scand. Suppl. 1978, 68, 118–122. [Google Scholar] [CrossRef] [PubMed]
  71. Huch, R.; Huch, A.; Albani, M.; Gabriel, M.; Schulte, F.J.; Wolf, H.; Rupprath, G.; Emmrich, P.; Stechele, U.; Duc, G.; et al. Transcutaneous PO2 monitoring in routine management of infants and children with cardiorespiratory problems. Pediatrics 1976, 57, 681–690. [Google Scholar] [PubMed]
  72. Huch, A.; Seiler, D.; Meinzer, K.; Huch, R.; Galster, H.; Lübbers, D.W. Transcutaneous PCO2 measurement with a miniaturised electrode. Lancet 1977, 1, 982–983. [Google Scholar] [CrossRef]
  73. Hagiwara, B. Transcutaneous electrodes for blood gas determination. Jpn. J. Med. Electron. Biol. Eng. Iyodenshi Seitai Kogaku 1983, 21, 524–530. [Google Scholar]
  74. Lucey, J.F. Clinical uses of transcutaneous oxygen monitoring. Adv. Pediatr. 1981, 28, 27–56. [Google Scholar]
  75. Wimberley, P.D.; Pedersen, K.G.; Thode, J.; Fogh-Andersen, N.; Sørensen, A.M.; Siggaard-Andersen, O. Transcutaneous and capillary pCO2 and pO2 measurements in healthy adults. Clin. Chem. 1983, 29, 1471–1473. [Google Scholar] [CrossRef]
  76. Rüdiger, M.; Töpfer, K.; Hammer, H.; Schmalisch, G.; Wauer, R.R. A survey of transcutaneous blood gas monitoring among European neonatal intensive care units. BMC Pediatr. 2005, 5, 30. [Google Scholar] [CrossRef] [PubMed] [Green Version]
  77. Delerme, S.; Montout, V.; Goulet, H.; Arhan, A.; Le Saché, F.; Devilliers, C.; Riou, B.; Ray, P. Concordance between transcutaneous and arterial measurements of carbon dioxide in an ED. Am. J. Emerg. Med. 2012, 30, 1872–1876. [Google Scholar] [CrossRef] [PubMed]
  78. Stieglitz, S.; Matthes, S.; Priegnitz, C.; Hagmeyer, L.; Randerath, W. Comparison of transcutaneous and capillary measurement of PCO2 in hypercapnic subjects. Respir. Care 2016, 61, 98–105. [Google Scholar] [CrossRef] [Green Version]
  79. Nishiyama, T.; Nakamura, S.; Yamashita, K. Effects of the electrode temperature of a new monitor, TCM4, on the measurement of transcutaneous oxygen and carbon dioxide tension. J. Anesth. 2006, 20, 331–334. [Google Scholar] [CrossRef] [PubMed]
  80. Restrepo, R.D.; Hirst, K.R.; Wittnebel, L.; Wettstein, R. AARC clinical practice guideline: Transcutaneous monitoring of carbon dioxide and oxygen: 2012. Respir. Care 2012, 57, 1955–1962. [Google Scholar] [CrossRef]
  81. Ruangsetakit, C.; Chinsakchai, K.; Mahawongkajit, P.; Wongwanit, C.; Mutirangura, P. Transcutaneous oxygen tension: A useful predictor of ulcer healing in critical limb ischaemia. J. Wound Care 2010, 19, 202–206. [Google Scholar] [CrossRef] [Green Version]
  82. Umeda, A.; Okada, Y. Comparison of Accuracy: Bland-Altman analysis of alternative examinations in the field of respiratory medicine. Kokyu Junkan Respir. Circ. 2012, 60, 840–848. [Google Scholar]
  83. Aliwalas, L.L.; Noble, L.; Nesbitt, K.; Fallah, S.; Shah, V.; Shah, P.S. Agreement of carbon dioxide levels measured by arterial, transcutaneous and end tidal methods in preterm infants <or = 28 weeks gestation. J. Perinatol. 2005, 25, 26–29. [Google Scholar]
  84. Tobias, J.D.; Meyer, D.J. Noninvasive monitoring of carbon dioxide during respiratory failure in toddlers and infants: End-tidal versus transcutaneous carbon dioxide. Anesth. Analg. 1997, 85, 55–58. [Google Scholar]
  85. Oshibuchi, M.; Cho, S.; Hara, T.; Tomiyasu, S.; Makita, T.; Sumikawa, K. A comparative evaluation of transcutaneous and end-tidal measurements of CO2 in thoracic anesthesia. Anesth. Analg. 2003, 97, 776–779. [Google Scholar] [CrossRef]
  86. Tingay, D.G.; Stewart, M.J.; Morley, C.J. Monitoring of end tidal carbon dioxide and transcutaneous carbon dioxide during neonatal transport. Arch. Dis. Child. Fetal Neonatal Ed. 2005, 90, F523–F526. [Google Scholar] [CrossRef] [PubMed] [Green Version]
  87. Hirabayashi, M.; Fujiwara, C.; Ohtani, N.; Kagawa, S.; Kamide, M. Transcutaneous PCO2 monitors are more accurate than end-tidal PCO2 monitors. J. Anesth. 2009, 23, 198–202. [Google Scholar] [CrossRef] [PubMed]
  88. Schwarz, S.B.; Wolfram Windisch, W.; Magnet, F.S.; Schmoor, C.; Karagiannidis, C.; Callegari, J.; Huttmann, S.E.; Storre, J.H. Continuous non-invasive PCO2 monitoring in weaning patients: Transcutaneous is advantageous over end-tidal PCO2. Respirology 2017, 22, 1579–1584. [Google Scholar] [CrossRef]
  89. Umeda, A.; Ishizaka, M.; Tasaki, M.; Yamane, T.; Watanabe, T.; Inoue, Y.; Mochizuki, T.; Okada, Y.; Kesler, S. Evaluation of time courses of agreement between minutely obtained transcutaneous blood gas data and the gold standard arterial data from spontaneously breathing Asian adults, and various subgroup analyses. BMC Pulm. Med. 2020, 20, 151. [Google Scholar] [CrossRef]
  90. Kulandavelu, S.; Balkan, W.; Hare, J.M. Regulation of oxygen delivery to the body via hypoxic vasodilation. Proc. Natl. Acad. Sci. USA. 2015, 112, 6254–6255. [Google Scholar] [CrossRef] [PubMed] [Green Version]
  91. Huttmann, S.E.; Windisch, W.; Storre, J.H. Techniques for the measurement and monitoring of carbon dioxide in the blood. Ann. Am. Thorac. Soc. 2014, 11, 645–652. [Google Scholar] [CrossRef]
  92. Janssens, J.P.; Perrin, E.; Bennani, I.; Muralt, B.; Titelion, V.; Picaud, C. Is continuous transcutaneous monitoring of PCO2 (Tc P CO2) over 8 h reliable in adults? Respir. Med. 2001, 95, 331–335. [Google Scholar] [CrossRef] [Green Version]
  93. Rodriguez, P.; Lellouche, F.; Aboab, J.; Buisson, C.B.; Brochard, L. Transcutaneous arterial carbon dioxide pressure monitoring in critically ill adult patients. Intensive Care Med. 2006, 32, 309–312. [Google Scholar] [CrossRef]
  94. Gerdung, C.A.; Adeleye, A.; Kirk, V.G. Noninvasive monitoring of CO2 during polysomnography: A review of the recent literature. Curr. Opin. Pulm. Med. 2016, 22, 527–534. [Google Scholar] [CrossRef]
  95. Trucco, F.; Pedemonte, M.; Fiorillo, C.; Tan, H.-L.; Carlucci, A.; Brisca, G.; Tacchetti, P.; Bruno, C.; Minetti, C. Detection of early nocturnal hypoventilation in neuromuscular disorders. J. Int. Med. Res. 2018, 46, 1153–1161. [Google Scholar] [CrossRef] [Green Version]
  96. Buekers, J.; Boever, P.D.; Theunis, J.; Houben-Wilke, S.; Vaes, A.W.; Franssen, F.M.E.; Wouters, E.F.M.; Simons, S.; Aerts, J.-M.; Spruit, M.A. Physiological changes differ between responders and nonresponders to pulmonary rehabilitation in COPD. Med. Sci. Sports Exerc. 2021, 53, 1125–1133. [Google Scholar] [CrossRef]
  97. Prieur, G.; Medrinal, C.; Combret, Y.; Lozeron, E.D.; Bonnevie, T.; Gravier, F.E.; Quieffin, J.; Lamia, B.; Borel, J.C.; Reychler, G. Nasal high flow does not improve exercise tolerance in COPD patients recovering from acute exacerbation: A randomized crossover study. Respirology 2019, 24, 1088–1094. [Google Scholar] [CrossRef] [PubMed] [Green Version]
  98. Sasaki, T.; Ishizaka, M.; Kaneko, J.; Umeda, A. Effect of resistance exercise and aerobic exercise on percutaneous oxygen pressure in the lower extremities. Rigakuryoho Kagaku 2020, 35, 855–859. [Google Scholar] [CrossRef]
  99. Mori, M.; Nakagami, H.; Rodriguez-Araujo, G.; Nimura, K.; Kaneda, Y. Essential role for miR-196a in brown adipogenesis of white fat progenitor cells. PLoS Biol. 2012, 10, e1001314. [Google Scholar] [CrossRef] [Green Version]
  100. Umeda, A.; Miyagawa, K.; Mochida, A.; Takeda, T.; Takeda, K.; Okada, Y.; Gozal, D. Intermittent hypoxia, energy expenditure, and visceral adipocyte recovery. Respir. Physiol. Neurobiol. 2020, 273, 103332. [Google Scholar] [CrossRef]
  101. Shimizu, N.; Maruyama, T.; Yoshikawa, N.; Matsumiya, R.; Ma, Y.; Ito, N.; Tasaka, Y.; Kuribara-Souta, A.; Miyata, K.; Oike, Y.; et al. A muscle-liver-fat signalling axis is essential for central control of adaptive adipose remodeling. Nat. Commun. 2015, 6, 6693. [Google Scholar] [CrossRef] [PubMed] [Green Version]
  102. Pauling, L.; Wood, R.E.; Sturdivant, J.H. An instrument for determining the partial pressure of oxygen in a gas. J. Am. Chem Soc. 1946, 68, 795–798. [Google Scholar] [CrossRef] [PubMed]
  103. Drager, L.F.; Brunoni, A.R.; Jenner, R.; Lorenzi-Filho, G.; Bensenor, I.M.; Lotufo, P.A. Effects of CPAP on body weight in patients with obstructive sleep apnoea: A meta-analysis of randomised trials. Thorax 2015, 70, 258–264. [Google Scholar] [CrossRef] [Green Version]
  104. Chen, B.; Drager, L.F.; Peker, Y.; Vgontzas, A.N.; Phillips, C.L.; Hoyos, C.M.; Salles, G.F.; Guo, M.; Li, Y. Effect of CPAP on Weight and Local Adiposity in Adults with Obstructive Sleep Apnea: A Meta-Analysis. Ann. Am. Thorac. Soc. 2021. [Google Scholar] [CrossRef]
  105. Dedual, M.A.; Wueest, S.; Borsigova, M.; Konrad, D. Intermittent fasting improves metabolic flexibility in short-term high-fat dietfed mice. Am. J. Physiol. Endocrinol. Metab. 2019, 317, E773–E782. [Google Scholar] [CrossRef] [PubMed]
  106. Grandl, G.; Straub, L.; Rudigier, C.; Arnold, M.; Wueest, S.; Konrad, D.; Wolfrum, C. Short-term feeding of a ketogenic diet induces more severe hepatic insulin resistance than an obesogenic high-fat diet. J. Physiol. 2018, 596, 4597–4609. [Google Scholar] [CrossRef] [PubMed]
  107. Umeda, A.; Miyagawa, K.; Mochida, A.; Takeda, H.; Takeda, K.; Okada, Y.; Gozal, D. Effects of normoxic recovery on intima-media thickness of aorta and pulmonary artery following intermittent hypoxia in mice. Front. Physiol. 2020, 11, 583735. [Google Scholar] [CrossRef]
  108. Patel, H.; Kerndt, C.C.; Bhardwaj, A. NCBI Resources: Physiology, Respiratory Quotient. Available online: https://www.ncbi.nlm.nih.gov/books/NBK531494/ (accessed on 4 May 2021).
  109. Lin, C.-H.; Wu, L.-X.; Chen, K.-H.; Lo, H.-F.; Lin, K.-C.; Kasai, T.; Chen, C.-C.; Shih, C.-H.; Manzano, M.C.; Santos, G.N.; et al. Non-Invasive and time-dependent blood-sugar monitoring via breath-derived CO2 correlation using gas chromatograph with a Milliwhistle gas analyzer. Anal. Sci. 2020, 36, 739–743. [Google Scholar] [CrossRef] [PubMed]
  110. Sun, W.; Li, M.; Fan, J.; Peng, X. Activity-Based sensing and theranostic probes based on photoinduced electron transfer. Acc. Chem. Res. 2019, 52, 2818–2831. [Google Scholar] [CrossRef]
  111. Herman, P.; Murtaza, Z.; Lakowicz, J.R. Sensing of carbon dioxide by a decrease in photoinduced electron transfer quenching. Anal. Biochem. 1999, 272, 87–93. [Google Scholar] [CrossRef]
Figure 1. Globally averaged monthly mean mole fraction of CO2 from 1984 to 2018 and the deseasonalized long-term trend shown as a red line (Adapted with permission from Ref. [2]. Copyright 2020 WMO WDCGG).
Sensors 21 05636 g001
Figure 2. Measuring system of CO2 by using the non-dispersive infrared analyzer. The light chopper delivers the data of infrared intensity as a continuous alternating current signal to the detector through the optic filter (Adapted with permission from Ref. [18]. Copyright 2021 HORIBA).
Sensors 21 05636 g002
Figure 3. Monitoring of CO2 levels in rooms. Higher levels of CO2 in a room can mean there is a greater risk of viral transmission (Adapted with permission from Ref. [21]. Copyright 2020 Kyodo).
Sensors 21 05636 g003
Figure 4. PCO2 electrode. (a) The CO2 from the blood diffuses through the membrane (red) into the bicarbonate solution (light blue). The hydrolysis reaction occurs in the bicarbonate solution and results in the production of hydrogen ions (H+) in proportion to the amount of dissolved CO2 present. The difference in voltage between the reference solution (light green) and the bicarbonate solution (light blue) is measured. Ag/AgCl, Silver electrode plated with silver chloride; HCO3, Bicarbonate ion; H2CO3, Carbonic acid (Adapted with permission from Ref. [28]. Copyright 2005 Elsevier). (b) Severinghaus PCO2 electrode. The principle of pH meter with pH-sensitive glass membrane is used (Adapted with permission from Ref. [28]. Copyright 2005 Elsevier).
Sensors 21 05636 g004
Figure 5. A system of measuring end-tidal PCO2 during non-invasive positive pressure ventilation. (a) Mainstream CO2 sensor (TG-980P, Nihon Kohden, Tokyo, Japan) is used in a mask (cap-ONE, Nihon Kohden, Tokyo, Japan). (b) The inner cup is attached inside the mask. (c) Air flow from respirator and exhaled flow from mouth or nose are shown. (d) Capnographic waveform on the monitor of non-invasive positive pressure ventilator (NKV-330, Nihon Kohden, Tokyo, Japan) is shown.
Sensors 21 05636 g005
Figure 6. Technology of size reduction of end-tidal PCO2 sensors. In the new CO2 sensor, the use of heaters to avoid water drops is unnecessary. (a) In ordinary CO2 sensors, heaters are necessary to prevent windows from being clouded by water vapor in expired air. Water drops on windows cause refraction and reflection of infrared lights. (b) The hydrophilic coating film used in the new CO2 sensor (TG-980P, Nihon Kohden, Tokyo, Japan) disabled the surface tension of water drops. Thanks to this anti-fog film, the new sensor does not require the use of heaters.
Sensors 21 05636 g006
Figure 7. Transcutaneous PCO2 sensor. The skin heater is necessary in addition to the Severinghaus electrode (Adapted with permission from Ref. [73]. Copyright 1983 Japanese Society for Medical and Biological Engineering). An ultra-thin film of buffer electrolyte (light green) is placed between the silver and glass. This internal electrolyte stabilizes the pH inside the glass electrode. The external electrolyte (light blue) contains sodium bicarbonate. According to the manufacturing companies, the precise blueprints of recent products differ.
Sensors 21 05636 g007
Figure 8. Comparisons of PtcCO2 and PaCO2 bias (n = 272). (a) Comparison of bias between four age groups. The bias was significantly lower in young adults (20–39 years) versus those aged 40–59 years and ≥80 years. (b) Comparison of bias between the severe, mild hypocapnia group, and normal range group. The bias was significantly higher in the severe hypocapnia group than the normal range group, and this was an intensity-dependent effect. (c) Comparison of bias between the normal range group and mild, severe hypercapnia group. The bias was significantly lower in the mild hypercapnia group versus the normal range group. (d) Comparison of bias between the hypoxemia group, normal range group, and hyperoxemia group. The bias was significantly lower in the hypoxemia group versus the normal range group, and this was a PaO2 level-dependent effect. Bars: SEM, *: p < 0.05, **: p < 0.01 [89]. PaCO2, arterial partial pressure of CO2; PaO2, arterial partial pressure of O2; PCO2, partial pressure of CO2; PtcCO2, transcutaneous partial pressure of CO2; SEM, standard error of the mean.
Sensors 21 05636 g008
Figure 9. Subgroup analyses on PCO2 bias (PtcCO2—PaCO2) of patients with various respirtory diseases (n = 272). Bars: SEM. There were no significant differences in PCO2 bias (ANOVA with Tukey’s post hoc test). ACO, asthma-chronic obstructive pulmonary disease overlap; ANOVA, analysis of variance; COPD, chronic obstructive pulmonary disease; E, emphysema; ILD, interstitial lung disease; N.S., not significant; PaCO2, arterial partial pressure of CO2; PCO2, partial pressure of CO2; PtcCO2, transcutaneous partial pressure of CO2; SAS, sleep apnea syndrome ([89], additional data).
Sensors 21 05636 g009
Figure 10. The system of measuring CO2 production and O2 consumption in mice. Inlet air routes from animal chamber, control air, and reference gases are periodically changed. CO2 concentration is measured by infrared absorption analysis. O2 concentration is measured by magneto-electrical analysis (MK-5000) [100].
Sensors 21 05636 g010
Table 1. Alternative non-invasive methods for measuring PaCO2.
SurrogateAverage Bias1.96 SDAccuracyUsefulness for Patients with Pulmonary DiseasesReferences
PvCO2Approximately 5 mmHg higher than PaCO214.7–15.0 mmHgWorstLimited[45,50]
PetCO22–5 mmHg lower than PaCO26.9–14.4 mmHgSecond bestLimited[83,84,85,86,87,88]
PtcCO24–5 mmHg higher than PaCO24.6–10.4 mmHgBestGood
(still not replaceable)
[83,84,85,86,87,88,89]
Publisher’s Note: MDPI stays neutral with regard to jurisdictional claims in published maps and institutional affiliations.

