Source-Specific Volatile Organic Compounds and Emergency Hospital Admissions for Cardiorespiratory Diseases †

 , , , and
Abstract
:1. Introduction
2. Materials and Methods
2.1. Outcome Assessment
2.2. Exposure and Covariate Assessment
2.3. Statistical Analysis
3. Results
4. Discussion
5. Conclusions
Supplementary Materials
Author Contributions
Funding
Acknowledgments
Conflicts of Interest
References
- Wang, S.; Wu, D.; Wang, X.M.; Fung, J.C.H.; Yu, J.Z. Relative contributions of secondary organic aerosol formation from toluene, xylenes, isoprene, and monoterpenes in hong kong and guangzhou in the pearl river delta, china: An emission-based box modeling study. J. Geophys. Res. Atmos. 2013, 118, 507–519. [Google Scholar] [CrossRef]
- Ling, Z.H.; Guo, H. Contribution of VOC sources to photochemical ozone formation and its control policy implication in Hong Kong. Environ. Sci. Policy 2014, 38, 180–191. [Google Scholar] [CrossRef]
- Cakmak, S.; Dales, R.E.; Liu, L.; Kauri, L.M.; Lemieux, C.L.; Hebbern, C.; Zhu, J. Residential exposure to volatile organic compounds and lung function: Results from a population-based cross-sectional survey. Environ. Pollut. 2014, 194, 145–151. [Google Scholar] [CrossRef] [PubMed] [Green Version]
- Elliott, L.; Longnecker, M.P.; Kissling, G.E.; London, S.J. Volatile organic compounds and pulmonary function in the Third National Health and Nutrition Examination Survey, 1988–1994. Environ. Health Perspect. 2006, 114, 1210–1214. [Google Scholar] [CrossRef] [Green Version]
- Martins, P.C.; Valente, J.; Papoila, A.L.; Caires, I.; Araújo-Martins, J.; Matae, P.; Lopes, M.; Torres, S.; Rosado-Pinto, J.; Borrego, C.; et al. Airways changes related to air pollution exposure in wheezing children. Eur. Respir. J. 2012, 39, 246–253. [Google Scholar] [CrossRef]
- Yoon, H.I.; Hong, Y.C.; Cho, S.H.; Kim, H.; Kim, Y.H.; Sohn, J.R.; Kwon, M.; Park, S.H.; Cho, M.H.; Cheong, H.K. Exposure to volatile organic compounds and loss of pulmonary function in the elderly. Eur. Respir. J. 2010, 36, 1270–1276. [Google Scholar] [CrossRef] [Green Version]
- Madureira, J.; Paciência, I.; Rufo, J.; Ramos, E.; Barros, H.; Teixeira, J.P.; de Oliveira Fernandes, E. Indoor air quality in schools and its relationship with children’s respiratory symptoms. Atmos. Environ. 2015, 118, 145–156. [Google Scholar] [CrossRef] [Green Version]
- Tsai, D.H.; Wang, J.L.; Chuang, K.J.; Chan, C.C. Traffic-related air pollution and cardiovascular mortality in central Taiwan. Sci. Total Environ. 2010, 408, 1818–1823. [Google Scholar] [CrossRef]
- Weichenthal, S.; Kulka, R.; Bélisle, P.; Joseph, L.; Dubeau, A.; Martin, C.; Wang, D.; Dales, R. Personal exposure to specific volatile organic compounds and acute changes in lung function and heart rate variability among urban cyclists. Environ. Res. 2012, 118, 118–123. [Google Scholar] [CrossRef]
- Hammond, S.K.; Gold, E.; Baker, R.; Quinlan, P.; Smith, W.; Pandya, R.; Balmes, J. Respiratory health effects related to occupational spray painting and welding. J. Occup. Environ. Med. 2005, 47, 728–739. [Google Scholar] [CrossRef]
- Kaukiainen, A.; Martikainen, R.; Riala, R.; Reijula, K.; Tammilehto, L. Work tasks, chemical exposure and respiratory health in construction painting. Am. J. Ind. Med. 2008, 51, 1–8. [Google Scholar] [CrossRef] [PubMed]
- Zhao, Q.; Li, Y.; Chai, X.; Xu, L.; Zhang, L.; Ning, P.; Huang, J.; Tian, S. Interaction of inhalable volatile organic compounds and pulmonary surfactant: Potential hazards of VOCs exposure to lung. J. Hazard. Mater. 2019, 369, 512–520. [Google Scholar] [CrossRef] [PubMed]
- Wesley, A.D.; Jalaludin, J. Indoor air pollutant exposure and eosinophil cationic protein as an upper airway inflammatory biomarker among preschool children. Procedia Environ. Sci. 2015, 30, 297–302. [Google Scholar] [CrossRef] [Green Version]
- Delfino, R.J.; Staimer, N.; Tjoa, T.; Polidori, A.; Arhami, M.; Gillen, D.L.; Kleinman, M.T.; Vaziri, N.D.; Longhurst, J.; Zaldivar, F.; et al. Circulating biomarkers of inflammation, antioxidant activity, and platelet activation are associated with primary combustion aerosols in subjects with coronary artery disease. Environ. Health Perspect. 2008, 116, 898–906. [Google Scholar] [CrossRef] [Green Version]
- Delfino, R.J.; Staimer, N.; Tjoa, T.; Arhami, M.; Polidori, A.; Gillen, D.L.; Kleinman, M.T.; Schauer, J.J.; Sioutas, C. Association of biomarkers of systemic inflammation with organic components and source tracers in quasi-ultrafine particles. Environ. Health Perspect. 2010, 118, 756–762. [Google Scholar] [CrossRef] [PubMed] [Green Version]
- Gordon, C.J.; Samsam, T.E.; Oshiro, W.M.; Bushnell, P.J. Cardiovascular effects of oral toluene exposure in the rat monitored by radiotelemetry. Neurotoxicol. Teratol. 2007, 29, 228–235. [Google Scholar] [CrossRef]
- Ye, D.; Klein, M.; Chang, H.H.; Sarnat, J.A.; Mulholland, J.A.; Edgerton, E.S.; Winquist, A.; Tolbert, P.E.; Sarnat, S.E. Estimating acute cardiorespiratory effects of ambient volatile organic compounds. Epidemiology 2017, 28, 197–206. [Google Scholar] [CrossRef]
- Ran, J.; Qiu, H.; Sun, S.; Tian, L. Short-term effects of ambient benzene and TEX (toluene, ethylbenzene, and xylene combined) on cardiorespiratory mortality in Hong Kong. Environ. Int. 2018, 117, 91–98. [Google Scholar] [CrossRef]
- Ran, J.; Qiu, H.; Sun, S.; Yang, A.; Tian, L. Are ambient volatile organic compounds environmental stressors for heart failure? Environ. Pollut. 2018. [Google Scholar] [CrossRef]
- Pun, V.C.; Tian, L.; Yu, I.T.S.; Kioumourtzoglou, M.A.; Qiu, H. Differential distributed lag patterns of source-specific particulate matter on respiratory emergency hospitalizations. Environ. Sci. Technol. 2015, 49, 3830–3838. [Google Scholar] [CrossRef]
- Pun, V.C.; Yu, I.T.; Ho, K.; Qiu, H.; Sun, Z.; Tian, L. Differential effects of source-specific particulate matter on emergency hospitalizations for ischemic heart disease in Hong Kong. Environ. Health Perspect. 2014, 122, 391–396. [Google Scholar] [CrossRef] [PubMed]
- Alfaro-Moreno, E.; Martínez, L.; García-Cuellar, C.; Bonner, J.C.; Clifford Murray, J.; Rosas, I.; De Rosales, S.P.L.; Osornio-Vargas, Á.R. Biologic effects induced in vitro by PM10 from three different zones of Mexico City. Environ. Health Perspect. 2002, 110, 715–720. [Google Scholar] [CrossRef] [PubMed]
- Tian, L.; Qiu, H.; Pun, V.C.; Lin, H.; Ge, E.; Chan, J.C.; Louie, P.K.; Ho, K.F.; Yu, I.T.S. Ambient carbon monoxide associated with reduced risk of hospital admissions for respiratory tract infections. Am. J. Respir. Crit. Care Med. 2013, 188, 1240–1245. [Google Scholar] [CrossRef] [PubMed]
- Wang, Y.; Wang, H.; Guo, H.; Lyu, X.; Cheng, H.; Ling, Z.; Louie, P.K.K.; Simpson, I.J.; Meinardi, S.; Blake, D.R. Long-term O3 -precursor relationships in Hong Kong: Field observation and model simulation. Atmos. Chem. Phys. 2017, 17, 10919–10935. [Google Scholar] [CrossRef] [Green Version]
- Ou, J.; Guo, H.; Zheng, J.; Cheung, K.; Louie, P.K.K.; Ling, Z.; Wang, D. Concentrations and sources of non-methane hydrocarbons (NMHCs) from 2005 to 2013 in Hong Kong: A multi-year real-time data analysis. Atmos. Environ. 2015, 103, 196–206. [Google Scholar] [CrossRef]
- Guo, H.; So, K.L.; Simpson, I.J.; Barletta, B.; Meinardi, S.; Blake, D.R. C1-C8 volatile organic compounds in the atmosphere of Hong Kong: Overview of atmospheric processing and source apportionment. Atmos. Environ. 2007, 41, 1456–1472. [Google Scholar] [CrossRef] [Green Version]
- Guo, H.; Cheng, H.R.; Ling, Z.H.; Louie, P.K.K.; Ayoko, G.A. Which emission sources are responsible for the volatile organic compounds in the atmosphere of Pearl River Delta? J. Hazard. Mater. 2011, 188, 116–124. [Google Scholar] [CrossRef]
- Paatero, P. Least squares formulation of robust non-negative factor analysis. Chemom. Intell. Lab. Syst. 1997, 37, 23–35. [Google Scholar] [CrossRef]
- Jaeckels, J.M.; Bae, M.S.; Schauer, J.J. Positive matrix factorization (PMF) analysis of molecular marker measurements to quantify the sources of organic aerosols. Environ. Sci. Technol. 2007, 41, 5763–5769. [Google Scholar] [CrossRef]
- Lau, A.K.H.; Yuan, Z.; Yu, J.Z.; Louie, P.K.K. Source apportionment of ambient volatile organic compounds in Hong Kong. Sci. Total Environ. 2010, 408, 4138–4149. [Google Scholar] [CrossRef]
- Brown, S.G.; Frankel, A.; Hafner, H.R. Source apportionment of VOCs in the Los Angeles area using positive matrix factorization. Atmos. Environ. 2007, 41, 227–237. [Google Scholar] [CrossRef]
- Gasparrini, A. Distributed lag linear and non-linear models in R: The package dlnm. J. Stat. Softw. 2011, 43, 1–20. [Google Scholar] [CrossRef] [PubMed] [Green Version]
- Ran, J.; Sun, S.; Yang, A.; Yang, L.; Han, L.; Mason, T.G.; Chan, K.P.; Li, J.; Tian, L. Effects of ambient benzene and toluene on emergency COPD hospitalizations: A time series study in Hong Kong. Sci. Total Environ. 2019, 657, 28–35. [Google Scholar] [CrossRef] [PubMed]
- Qiu, H.; Yu, I.T.S.; Tian, L.; Wang, X.; Tse, L.A.; Tam, W.; Wong, T.W. Effects of coarse particulate matter on emergency hospital admissions for respiratory diseases: A time-series analysis in Hong Kong. Environ. Health Perspect. 2012, 120, 572–576. [Google Scholar] [CrossRef] [PubMed] [Green Version]
- Scheff, P.A.; Wadden, R.A. Receptor modeling of volatile organic compounds. 1. emission inventory and validation. Environ. Sci. Technol. 1993, 27, 617–625. [Google Scholar] [CrossRef]
- Funk, J.L.; Jones, C.G.; Baker, C.J.; Fuller, H.M.; Giardina, C.P.; Lerdau, M.T. Diurnal variation in the basal emission rate of isoprene. Ecol. Appl. 2003, 13, 269–278. [Google Scholar] [CrossRef] [Green Version]
- McDonald, J.D.; Reed, M.D.; Campen, M.J.; Barrett, E.G.; Seagrave, J.C.; Mauderly, J.L. Health effects of inhaled gasoline engine emissions. Inhal. Toxicol. 2007, 19, 107–116. [Google Scholar] [CrossRef]
- Harati, B.; Shahtaheri, S.J.; Karimi, A.; Azam, K.; Ahmadi, A.; Afzali Rad, M.; Harati, A. Evaluation of respiratory symptoms among workers in an automobile manufacturing factory, Iran. Iran. J. Public Health 2018, 47, 237–245. [Google Scholar]
- Sherrill, D.L.; Lebowitz, M.D.; Halonen, M.; Barbee, R.A.; Burrows, B. Longitudinal evaluation of the association between pulmonary function and total serum IgE. Am. J. Respir. Crit. Care Med. 1995, 152, 98–102. [Google Scholar] [CrossRef]
- Fattahi, F.; ten Hacken, N.H.T.; Löfdahl, C.G.; Hylkema, M.N.; Timens, W.; Postma, D.S.; Vonk, J.M. Atopy is a risk factor for respiratory symptoms in COPD patients: Results from the EUROSCOP study. Respir. Res. 2013, 14, 1–8. [Google Scholar] [CrossRef] [Green Version]
- Foster, W.M.; Jiang, L.; Stetkiewicz, P.T.; Risby, T.H. Breath isoprene: Temporal changes in respiratory output after exposure to ozone. J. Appl. Physiol. 1996, 80, 706–710. [Google Scholar] [CrossRef] [PubMed]
- King, J.; Koc, H.; Unterkofler, K.; Mochalski, P.; Kupferthaler, A.; Teschl, G.; Teschl, S.; Hinterhuber, H.; Amann, A. Physiological modeling of isoprene dynamics in exhaled breath. J. Theor. Biol. 2010, 267, 626–637. [Google Scholar] [CrossRef] [PubMed] [Green Version]
- Villeneuve, P.J.; Jerrett, M.G.; Su, J.; Burnett, R.T.; Chen, H.; Wheeler, A.J.; Goldberg, M.S. A cohort study relating urban green space with mortality in Ontario, Canada. Environ. Res. 2012, 115, 51–58. [Google Scholar] [CrossRef] [PubMed]
- van Dorn, A. Urban planning and respiratory health. Lancet Respir. Med. 2017, 5, 781–782. [Google Scholar] [CrossRef]
- Parmes, E.; Pesce, G.; Sabel, C.E.; Baldacci, S.; Bono, R.; Brescianini, S.; D’Ippolito, C.; Hanke, W.; Horvat, M.; Liedes, H.; et al. Influence of residential land cover on childhood allergic and respiratory symptoms and diseases: Evidence from 9 European cohorts. Environ. Res. 2020, 183, 108953. [Google Scholar] [CrossRef]
- Rohr, A.C.; Shore, S.A.; Spengler, J.D. Repeated exposure to isoprene oxidation products causes enhanced respiratory tract effects in multiple murine strains. Inhal. Toxicol. 2003, 15, 1191–1207. [Google Scholar] [CrossRef]
- Ma, C.M.; Lin, L.Y.; Chen, H.W.; Huang, L.C.; Li, J.F.; Chuang, K.J. Volatile organic compounds exposure and cardiovascular effects in hair salons. Occup. Med. 2010, 60, 624–630. [Google Scholar] [CrossRef] [Green Version]
- Qiu, H.; Yu, I.T.S.; Wang, X.; Tian, L.; Tse, L.A.; Wong, T.W. Cool and dry weather enhances the effects of air pollution on emergency IHD hospital admissions. Int. J. Cardiol. 2013, 168, 500–505. [Google Scholar] [CrossRef]
- Tian, L.; Qiu, H.; Sun, S.; Lin, H. Emergency cardiovascular hospitalization risk attributable to cold temperatures in Hong Kong. Circ. Cardiovasc. Qual. Outcomes 2016, 9, 135–142. [Google Scholar] [CrossRef]
- Hong Kong Environmental Protection Department. Hong Kong Air Pollutant Emission Inventory-Volatile Organic Compounds. Available online: https://www.epd.gov.hk/epd/mobile/tc_chi/environmentinhk/air/data/emission_inve_voc_C.html. (accessed on 18 June 2019).


| Mean | SD | 25th | 50th | 75th | IQR | |
|---|---|---|---|---|---|---|
| Emergency hospital admissions (counts) | ||||||
| CVD | 202 | 28 | 182 | 199 | 218 | 36 |
| IHD | 37 | 8 | 31 | 36 | 41 | 10 |
| CHF | 39 | 12 | 31 | 37 | 46 | 15 |
| RD | 285 | 60 | 240 | 271 | 322 | 82 |
| COPD | 55 | 14 | 44 | 53 | 64 | 20 |
| Asthma | 18 | 6 | 14 | 18 | 22 | 8 |
| Source-apportioned VOC (ug/m3) | ||||||
| Gasoline emissions | 8.9 | 6.2 | 5.1 | 7.5 | 11.2 | 6.1 |
| LPG usage | 11.9 | 5.6 | 7.7 | 11.9 | 15.5 | 7.7 |
| Aged VOC | 8.1 | 6.1 | 2.8 | 7.3 | 12.0 | 9.1 |
| Architectural paints | 3.5 | 3.9 | 1.0 | 2.0 | 4.6 | 3.6 |
| Household products | 5.2 | 5.7 | 1.6 | 3.0 | 7.1 | 5.5 |
| Biogenic emissions | 2.4 | 1.8 | 0.8 | 2.1 | 3.7 | 2.9 |
| Meteorological conditions | ||||||
| Temperature (°C) | 23.8 | 5.2 | 19.8 | 25.1 | 28.3 | 8.5 |
| Relative humidity (%) | 78.7 | 10.4 | 74.0 | 79.0 | 86.0 | 12.0 |
| Trace gases | ||||||
| CO (mg/m3) | 0.9 | 0.3 | 0.7 | 0.9 | 1.0 | 0.4 |
| O3 (ug/m3) | 35.1 | 21.8 | 19.2 | 28.5 | 46.8 | 27.6 |
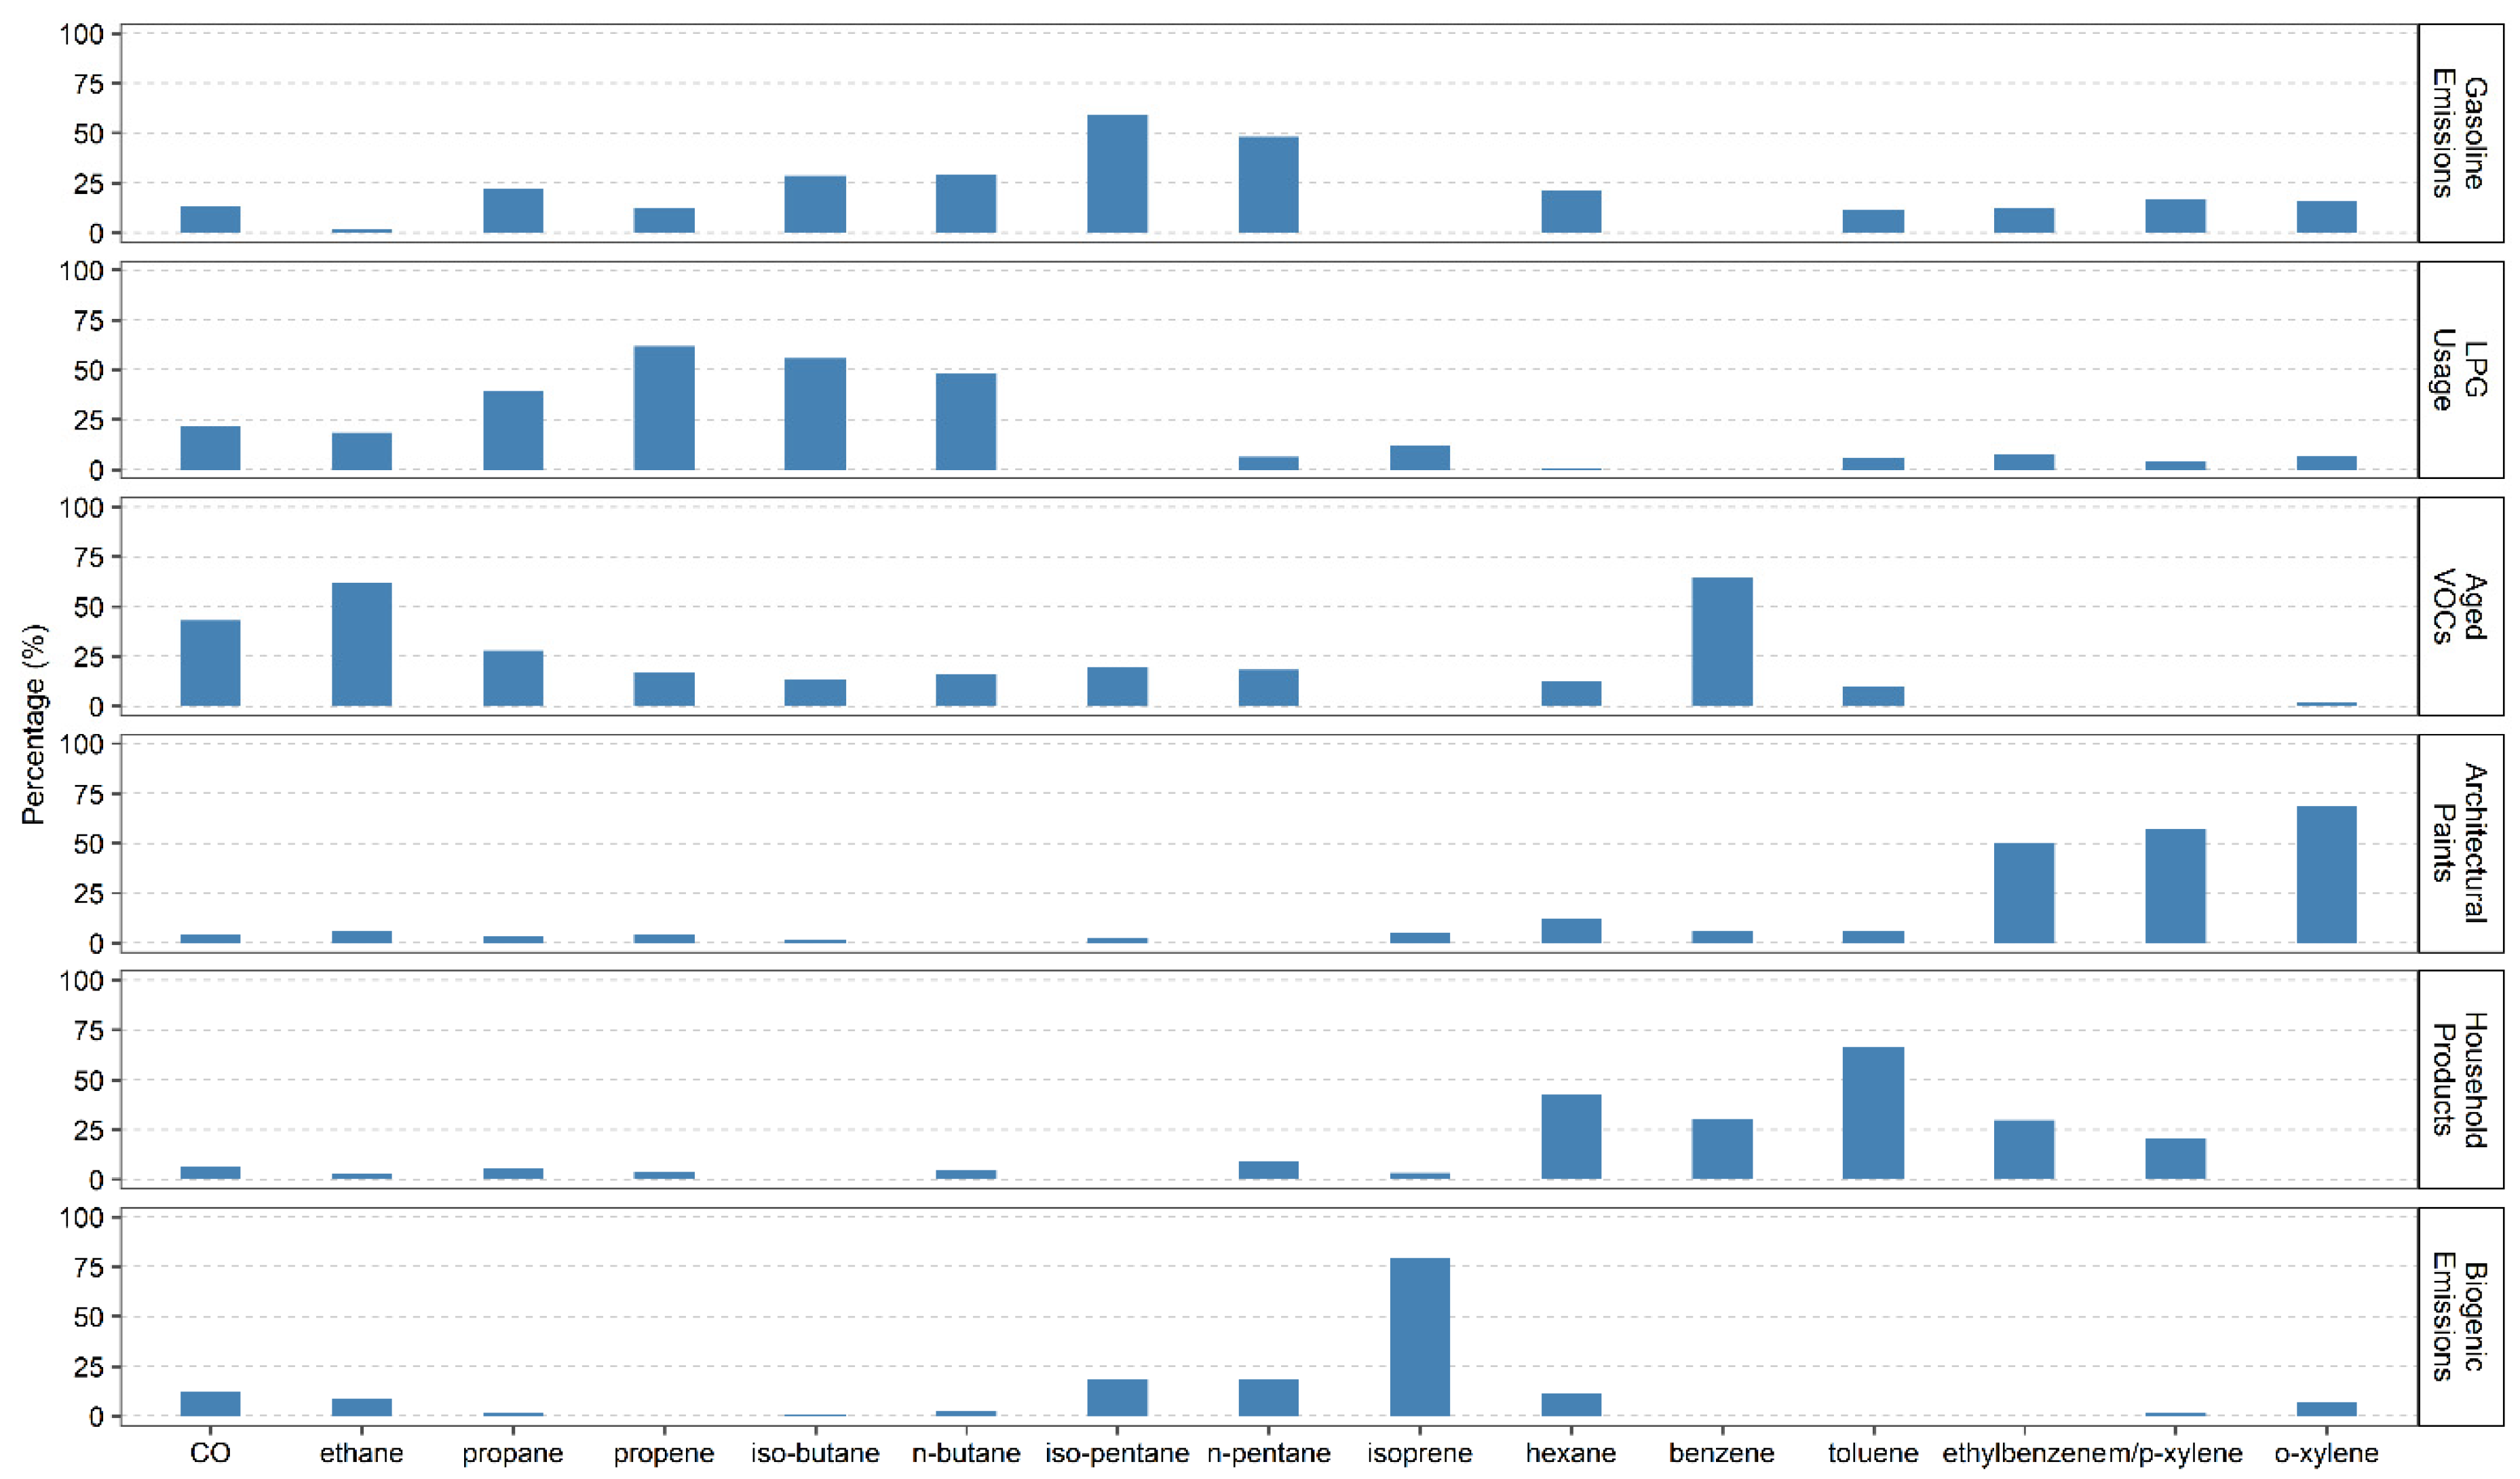
| Gasoline Emissions | LPG Usage | Aged VOCs | Architectural Paints | Household Products | Biogenic Emissions | |
|---|---|---|---|---|---|---|
| Gasoline emissions | 1.00 | |||||
| LPG Usage | 0 | 1.00 | ||||
| Aged VOCs | 0.19 | −0.28 | 1.00 | |||
| Architectural paints | 0.38 | −0.20 | 0.42 | 1.00 | ||
| Household products | 0.45 | −0.20 | 0.50 | 0.72 | 1.00 | |
| Biogenic emissions | −0.27 | −0.02 | −0.70 | −0.34 | −0.41 | 1.00 |
| All Seasons | Seasonal Variation | |||
|---|---|---|---|---|
| Cold Seasons | Warm Seasons | p-Value b | ||
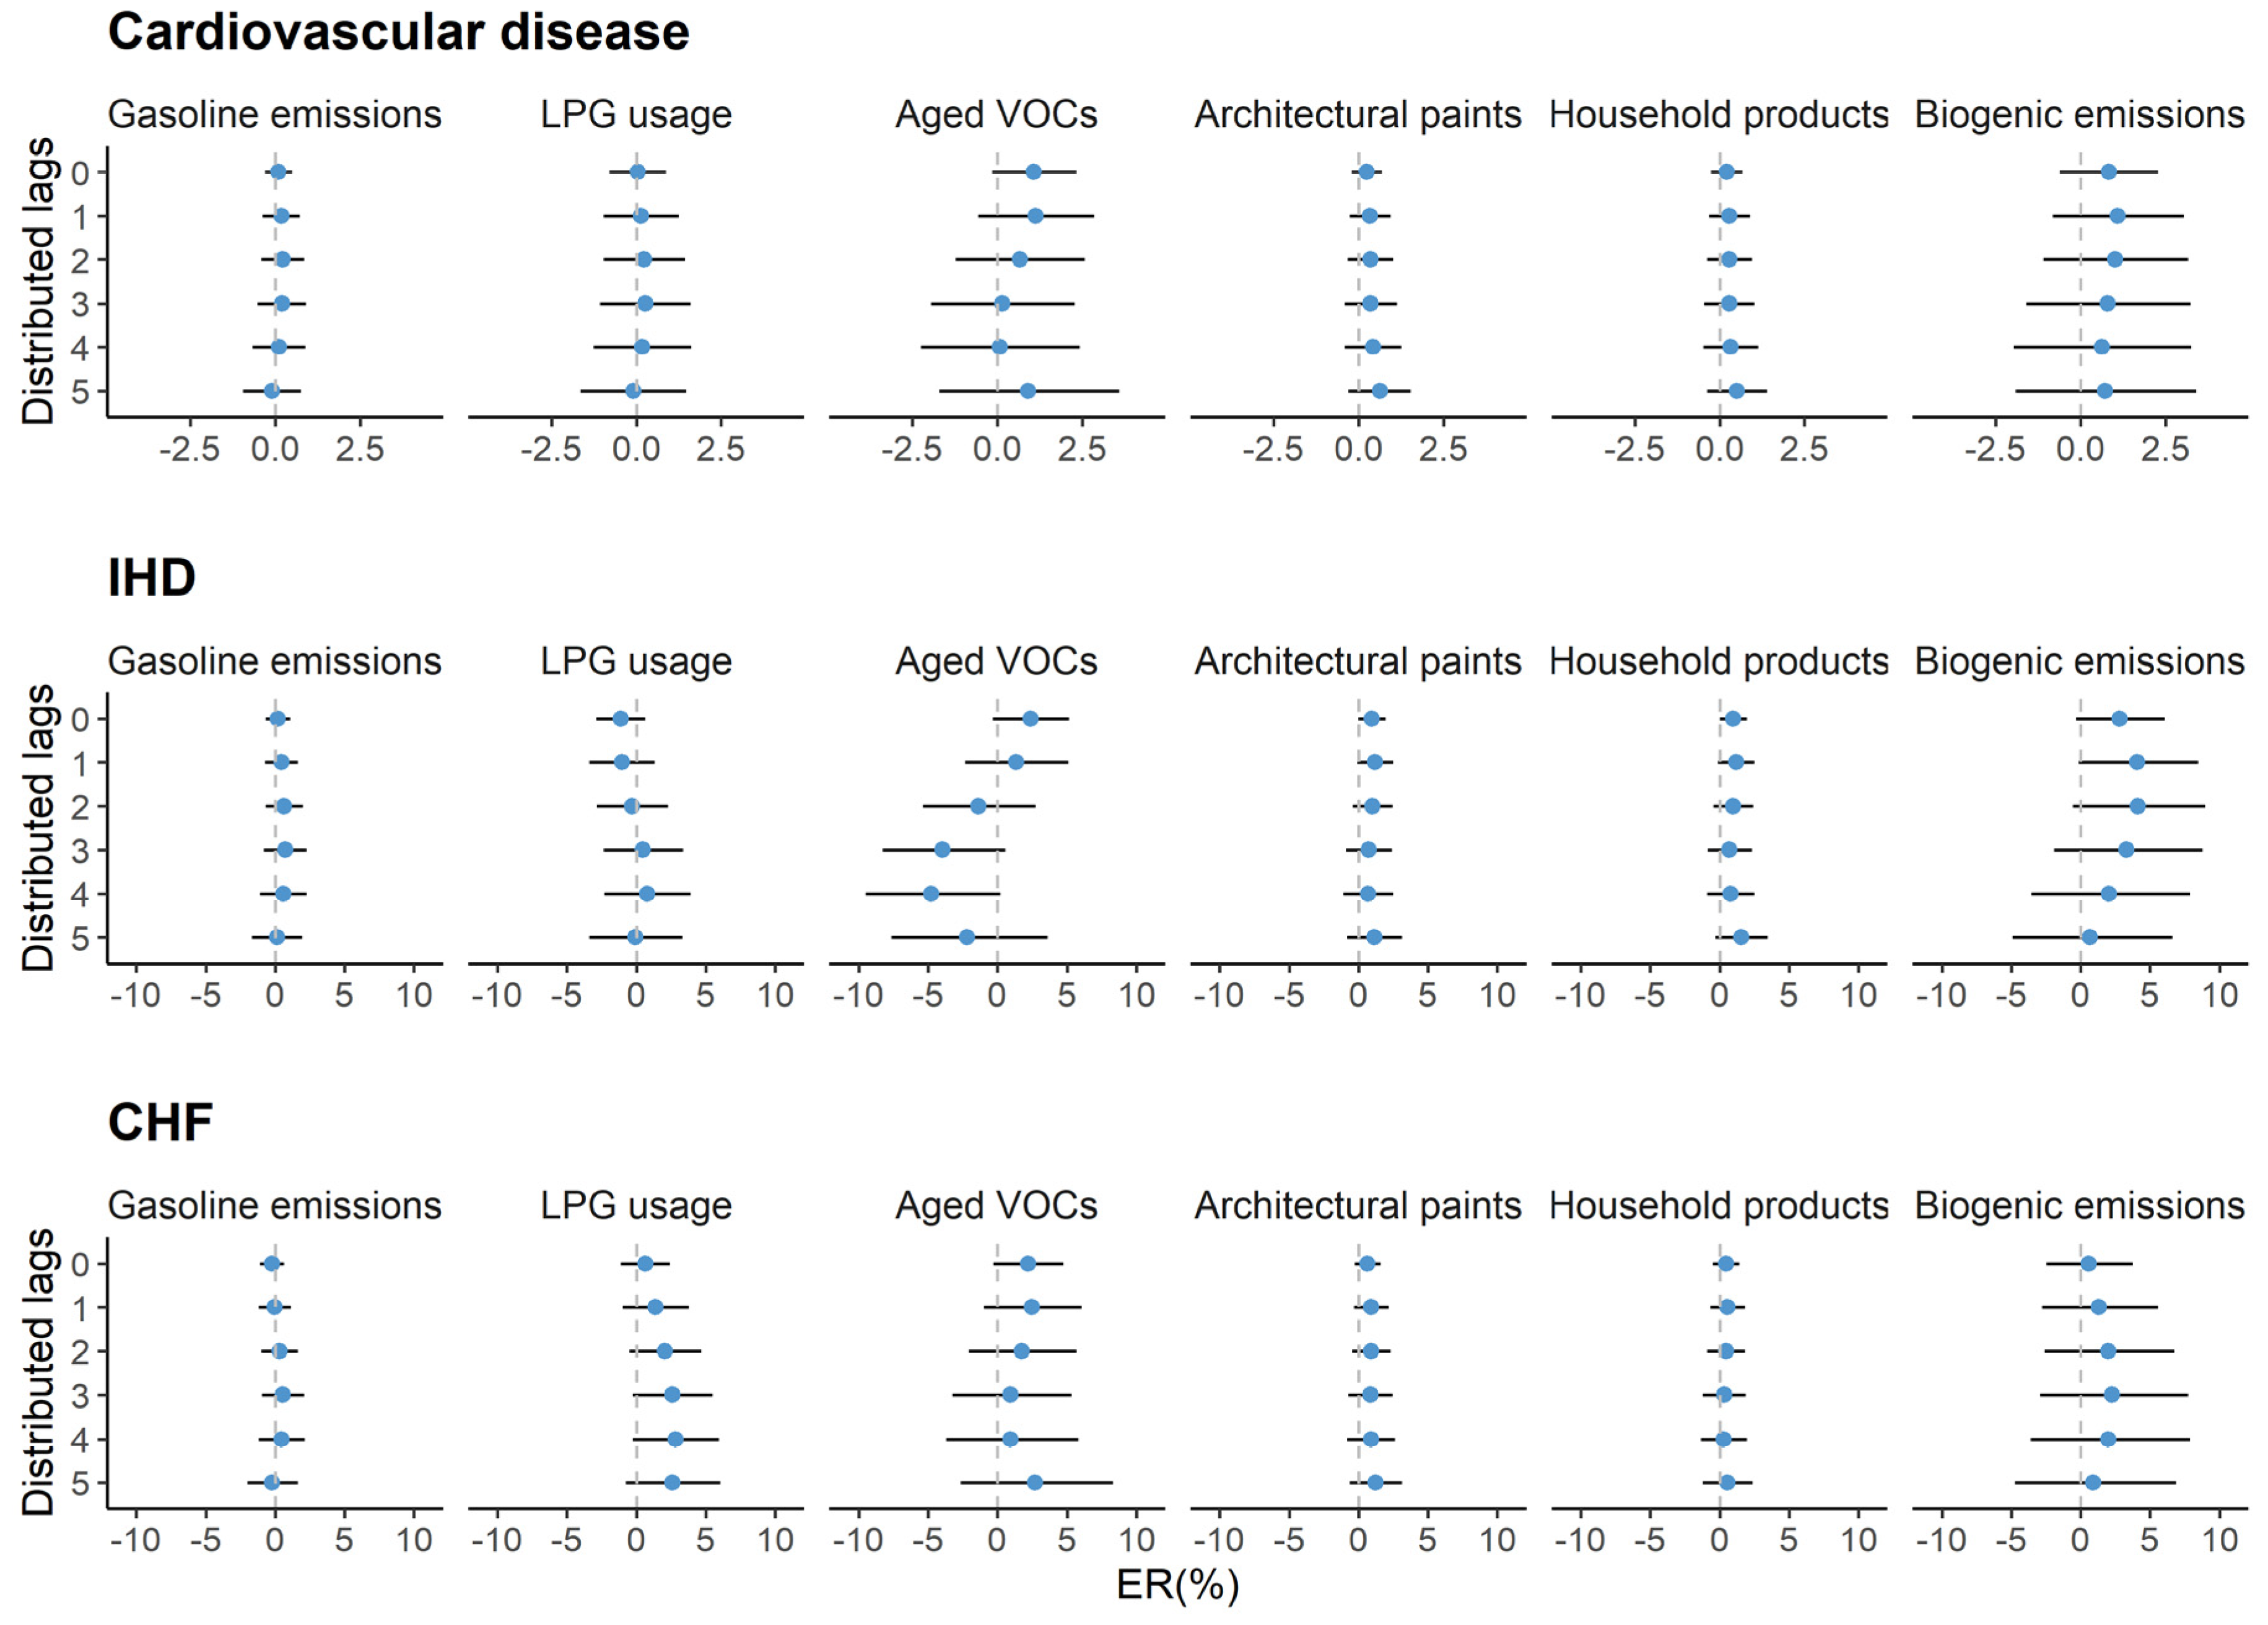
| Cardiovascular disease | ||||
| Gasoline emissions | 0.1 (−0.6, 0.8) | 0 (−1.1, 1.1) | 0.1 (−0.8, 1.0) | 0.902 |
| LPG usage | 0 (−1.3, 1.3) | 0.5 (−1.3, 2.4) | −0.6 (−2.3, 1.1) | 0.385 |
| Aged VOCs | 0.5 (−1.5, 2.5) | 0.5 (−1.3, 2.2) | −0.4 (−2.6, 1.9) | 0.571 |
| Architecture paints | 0.3 (−0.4, 1.0) | 0.6 (−0.8, 2.0) | 0.4 (−0.5, 1.3) | 0.851 |
| Household products | 0.3 (−0.4, 1.0) | 0.6 (−0.7, 1.9) | 0.3 (−0.3, 0.9) | 0.740 |
| Biogenic emissions | 1.0 (−1.3, 3.3) | 0.9 (−0.9, 2.7) | 1.2 (−0.8, 3.4) | 0.799 |
| IHD | ||||
| Gasoline emissions | 0.6 (−0.8, 2.1) | 0 (−2.2, 2.3) | 0.7 (−1.4, 2.8) | 0.651 |
| LPG usage | 0.2 (−2.5, 2.9) | 0.9 (−3.3, 5.4) | −0.1 (−3.4, 3.3) | 0.705 |
| Aged VOCs | −2.5 (−6.7, 1.8) | −1.1 (−4.6, 2.6) | −5.6 (−10.3, −0.6) | 0.148 |
| Architecture paints | 0.9 (−0.6, 2.5) | 1.2 (−1.6, 4.1) | 2.0 (0.1, 4.0) | 0.636 |
| Household products | 1.0 (−0.5, 2.5) | 1.8 (−0.8, 4.4) | 1.1 (−0.3, 2.5) | 0.662 |
| Biogenic emissions | 2.9 (−1.9, 8.0) | 2.1 (−1.5, 5.8) | 2.3 (−2.4, 7.3) | 0.935 |
| CHF | ||||
| Gasoline emissions | 0.3 (−1.1, 1.7) | 1.1 (−1.2, 3.5) | −1.0 (−2.9, 1.0) | 0.180 |
| LPG usage | 2.3 (−0.4, 5.0) | 3.6 (−0.2, 7.7) | 1.3 (−2.5, 5.4) | 0.422 |
| Aged VOCs | 0.3 (−3.7, 4.4) | 0.4 (−3.2, 4.1) | −0.7 (−5.5, 4.4) | 0.733 |
| Architecture paints | 0.7 (−0.7, 2.2) | 4.1 (1.2, 7.1) | −1.4 (−3.3, 0.5) | 0.002 |
| Household products | 0.4 (−1.0, 1.9) | 3.5 (0.8, 6.2) | −0.7 (−2.1, 0.6) | 0.006 |
| Biogenic emissions | 2.6 (−2.2, 7.7) | 1.9 (−1.8, 5.7) | 3.2 (−1.4, 8.1) | 0.669 |
| All Seasons | Seasonal Variation | |||
|---|---|---|---|---|
| Cold Seasons | Warm Seasons | p-Value b | ||
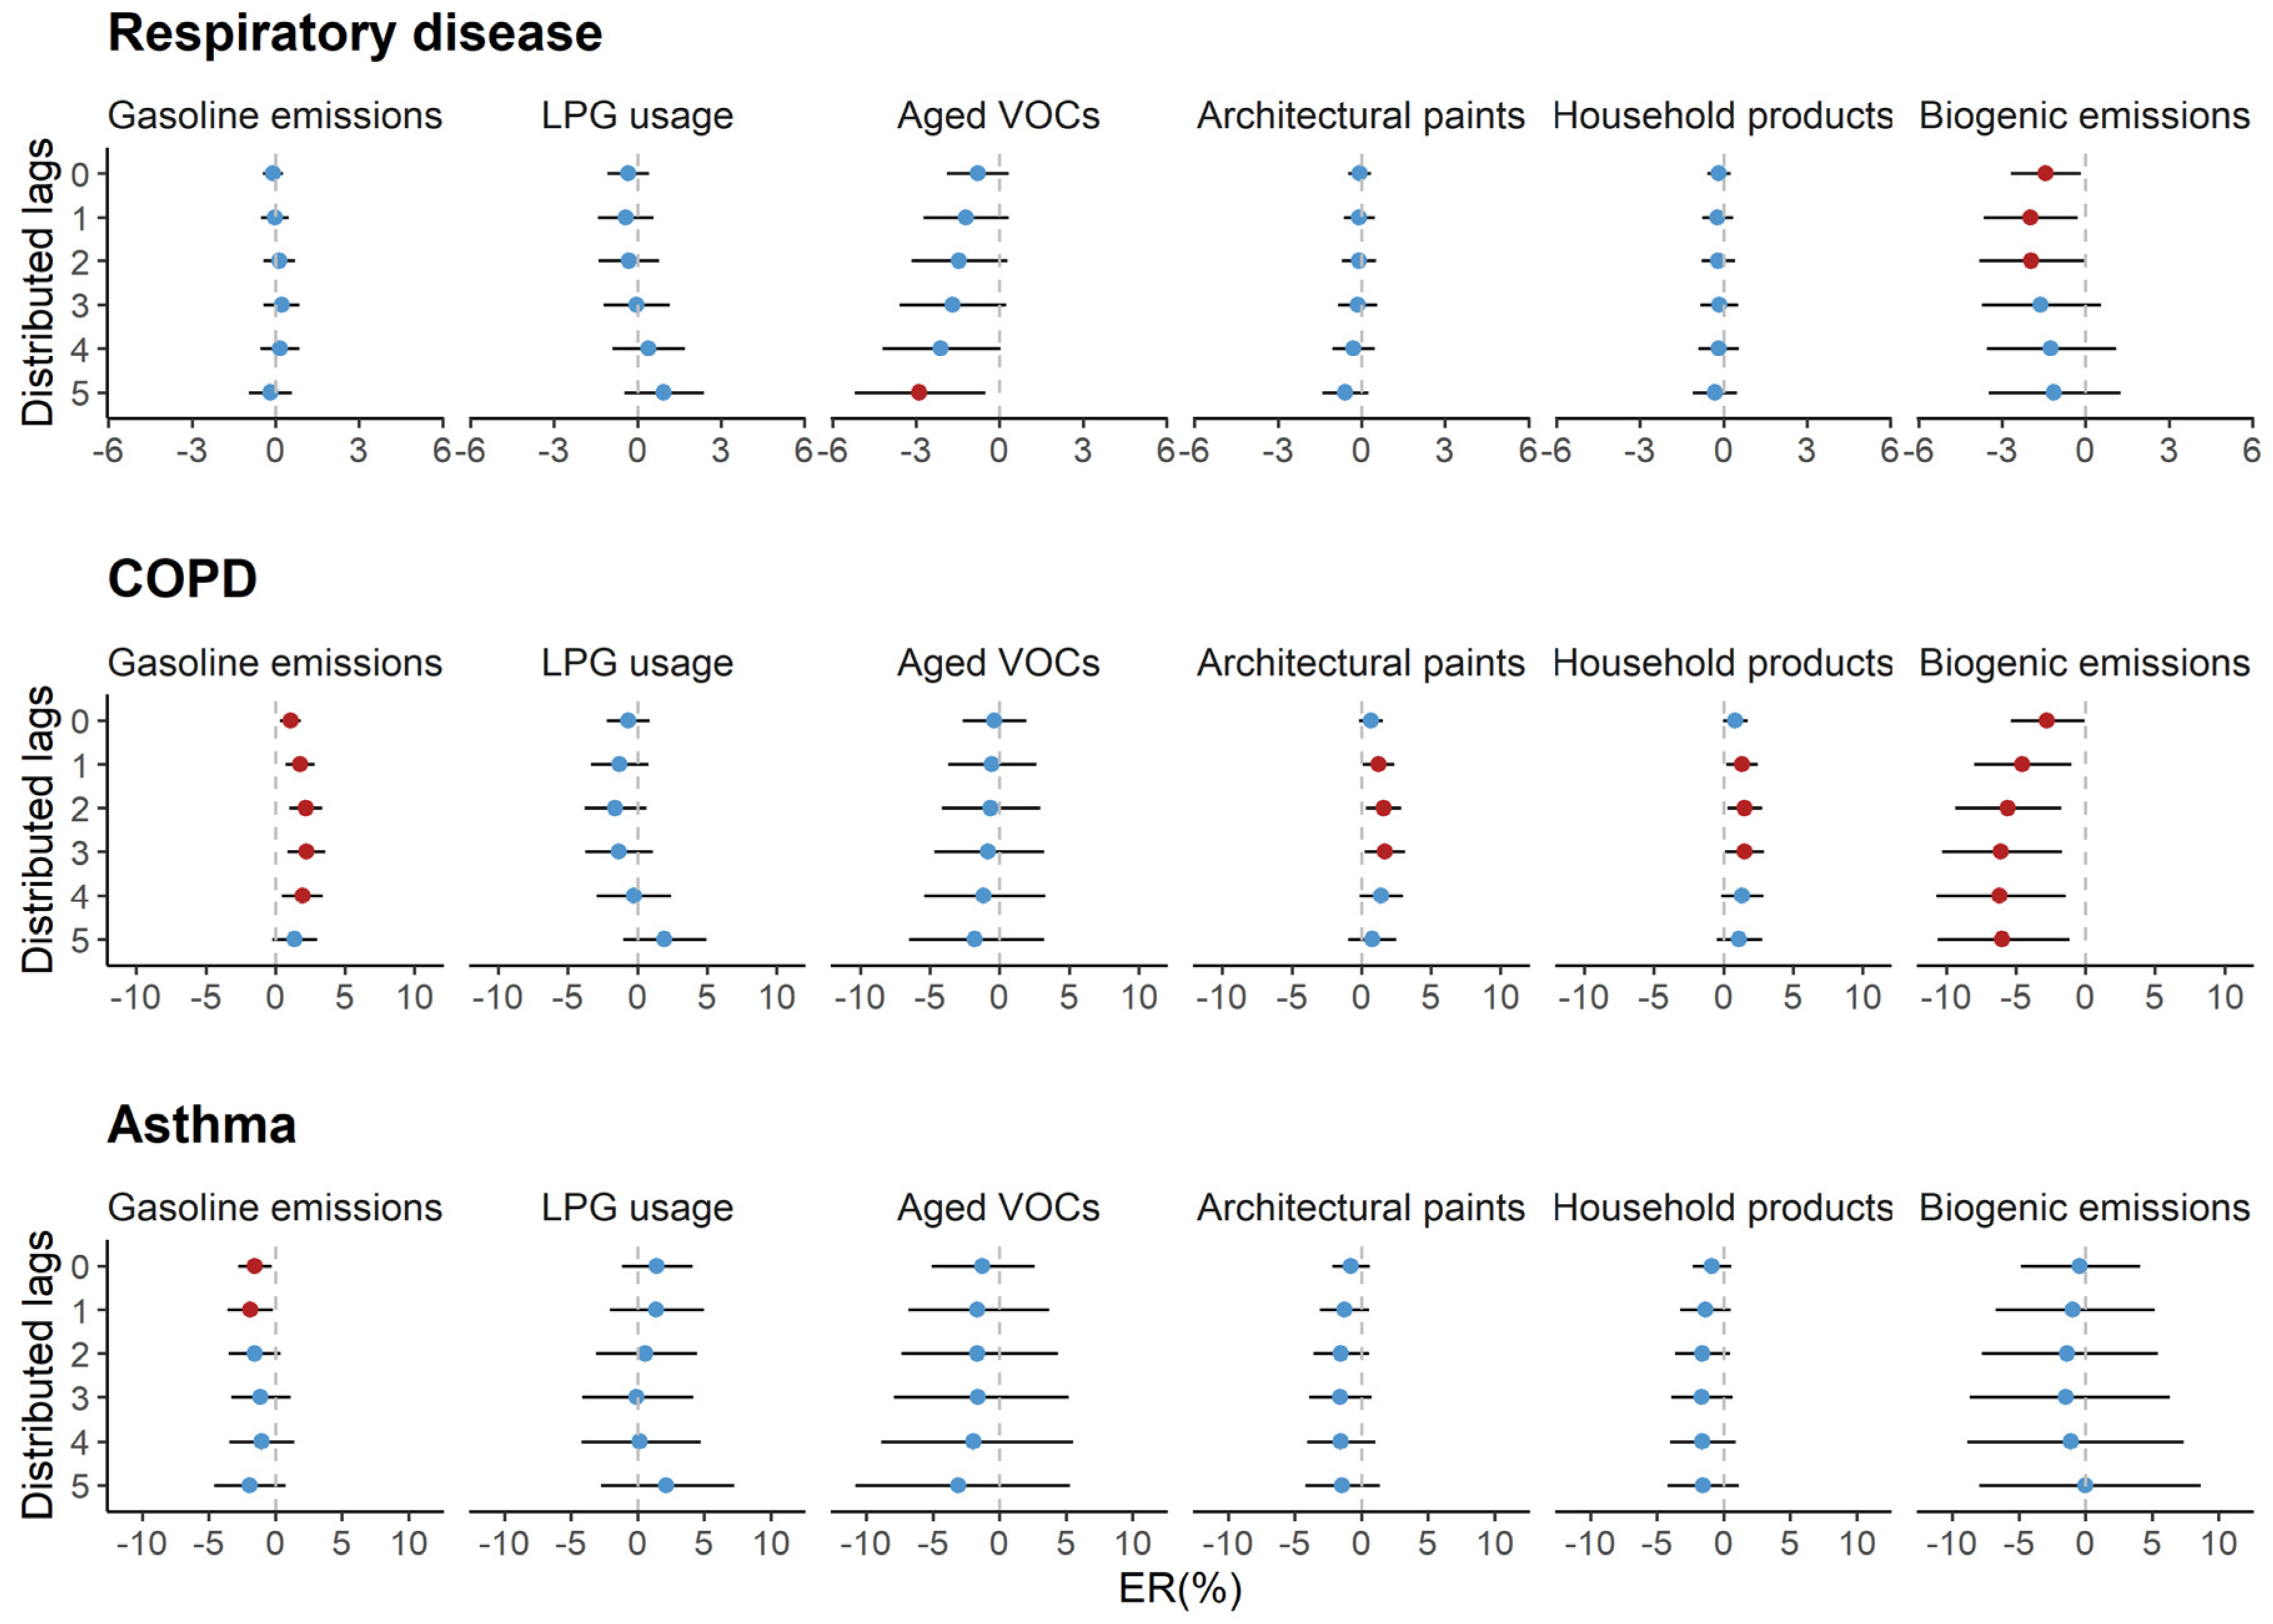
| Respiratory disease | ||||
| Gasoline emissions | 0.3 (−0.3, 0.9) | 0 (−1.0, 0.9) | 0.3 (−0.5, 1.2) | 0.567 |
| LPG usage | −0.1 (−1.2, 1.1) | −0.4 (−1.9, 1.2) | 1.1 (−0.5, 2.8) | 0.211 |
| Aged VOCs | −1.4 (−3.2, 0.5) | −1.1 (−2.7, 0.5) | −1.2 (−3.3, 0.9) | 0.934 |
| Architecture paints | −0.2 (−0.8, 0.5) | −0.2 (−1.4, 1.0) | 0.6 (−0.2, 1.4) | 0.293 |
| Household products | −0.1 (−0.7, 0.6) | −0.1 (−1.2, 1.0) | 0.3 (−0.3, 0.9) | 0.573 |
| Biogenic emissions | −2.2 (−4.1, −0.2) | −1.2 (−2.6, 0.3) | −0.8 (−2.7, 1.1) | 0.769 |
| COPD | ||||
| Gasoline emissions | 2.1 (0.9, 3.4) | 0.2 (−1.7, 2.1) | 2.9 (1.1, 4.8) | 0.048 |
| LPG usage | −0.7 (−3.0, 1.7) | −0.2 (−3.3, 3.1) | −0.8 (−4.3, 2.8) | 0.784 |
| Aged VOCs | −1.8 (−5.4, 2.0) | −1.6 (−4.6, 1.6) | −2.2 (−6.6, 2.3) | 0.806 |
| Architecture paints | 1.5 (0.2, 2.9) | −0.2 (−2.6, 2.3) | 3.1 (1.3, 4.9) | 0.035 |
| Household products | 1.5 (0.2, 2.8) | 0.5 (−1.7, 2.7) | 1.6 (0.4, 2.8) | 0.400 |
| Biogenic emissions | −6.6 (−10.4, −2.5) | 0.1 (−2.9, 3.2) | −5.3 (−9.2, −1.2) | 0.039 |
| Asthma | ||||
| Gasoline emissions | −1.4 (−3.4, 0.7) | −4.1 (−7.3, −0.8) | −1.0 (−4.0, 2.1) | 0.165 |
| LPG usage | 0.8 (−3.2, 4.8) | −2.9 (−8.1, 2.5) | 5.6 (−0.6, 12.1) | 0.041 |
| Aged VOCs | −1.3 (−7.4, 5.1) | −0.3 (−5.4, 5.2) | −0.6 (−7.9, 7.2) | 0.935 |
| Architecture paints | −1.3 (−3.5, 0.9) | −0.4 (−4.4, 3.8) | −0.4 (−3.3, 2.5) | 0.980 |
| Household products | −1.4 (−3.5, 0.8) | −0.9 (−4.6, 2.9) | −0.3 (−2.4, 1.8) | 0.768 |
| Biogenic emissions | −2.3 (−9.0, 4.8) | −1.4 (−6.5, 3.9) | 0.3 (−6.5, 7.6) | 0.696 |
© 2020 by the authors. Licensee MDPI, Basel, Switzerland. This article is an open access article distributed under the terms and conditions of the Creative Commons Attribution (CC BY) license (http://creativecommons.org/licenses/by/4.0/).
Share and Cite
Ran, J.; Kioumourtzoglou, M.-A.; Sun, S.; Han, L.; Zhao, S.; Zhu, W.; Li, J.; Tian, L. Source-Specific Volatile Organic Compounds and Emergency Hospital Admissions for Cardiorespiratory Diseases. Int. J. Environ. Res. Public Health 2020, 17, 6210. https://doi.org/10.3390/ijerph17176210
Ran J, Kioumourtzoglou M-A, Sun S, Han L, Zhao S, Zhu W, Li J, Tian L. Source-Specific Volatile Organic Compounds and Emergency Hospital Admissions for Cardiorespiratory Diseases. International Journal of Environmental Research and Public Health. 2020; 17(17):6210. https://doi.org/10.3390/ijerph17176210
Chicago/Turabian StyleRan, Jinjun, Marianthi-Anna Kioumourtzoglou, Shengzhi Sun, Lefei Han, Shi Zhao, Wei Zhu, Jinhui Li, and Linwei Tian. 2020. "Source-Specific Volatile Organic Compounds and Emergency Hospital Admissions for Cardiorespiratory Diseases" International Journal of Environmental Research and Public Health 17, no. 17: 6210. https://doi.org/10.3390/ijerph17176210