Article

Co-Production of Olefins, Fuels, and Electricity from Conventional Pipeline Gas and Shale Gas with Near-Zero CO2 Emissions. Part I: Process Development and Technical Performance

by
Yaser Khojasteh Salkuyeh
and
Thomas A. Adams II
*
Department of Chemical Engineering, McMaster University, 1280 Main St W, Hamilton, ON L8S 4L7, Canada
*
Author to whom correspondence should be addressed.
Energies 2015, 8(5), 3739-3761; https://doi.org/10.3390/en8053739
Submission received: 2 December 2014 / Revised: 9 March 2015 / Accepted: 16 March 2015 / Published: 30 April 2015

Abstract

:
A novel polygeneration process is presented in this paper that co-produces olefins, methanol, dimethyl ether, and electricity from conventional pipeline natural gas and different kinds of shale gases. Technical analyses of many variants of the process are performed, considering differences in power generation strategy and gas type. The technical analysis results show that the efficiency of the plant varies between 22%–57% (HHV) depending on the product portfolio. The efficiency is higher than a traditional methanol-to-olefin process, which enables it to be competitive with traditional naphtha cracking plants.

1. Introduction

In the chemical and petrochemical industries, high-value products such as ethylene and propylene are traditionally produced from crude oil. Although the industry is growing (around 4.5% per year [1]), it currently faces two significant challenges. First, the price of crude oil is now quite high—currently almost six times the price it was in early 1999 (adjusting for inflation). However, natural gas is comparatively much cheaper, being less than one third of the price of oil for the same energy content [2]. Second, the negative environmental impact of these processes is quite significant. The olefin industry is one of the largest consumers of primary energy, resulting in a total of 30% of direct CO2 emitted from chemical plants [3]. The indirect CO2 emissions attributed to electricity consumption by olefin production processes is roughly 12% of the total CO2 emissions of chemical and petrochemical plants [4].
Polygeneration processes, which are systems that co-produce a variety of products such as fuels, chemicals, and electricity, are a promising new strategy of chemical processing. By design, polygeneration systems tightly integrate different production trains together in an attempt to exploit synergies between them to yield higher efficiencies and profits. This can take the form of the integration of waste heat, clever reuse of waste gases, or strategic blending of certain streams. Often, these tightly integrated processes are both more profitable and more environmentally friendly processes compared to their stand-alone counterparts [5,6,7]. For example, Adams and Barton performed a techno-economic analysis that produces transportation fuels, methanol and power from coal and natural gas in response to market price fluctuations, product portfolios and CO2 emissions tax [8,9]. Cormos provided a detailed techno-economic analysis of a hybrid system that co-produces hydrogen and power showing reduced cost and greenhouse gas emissions compared to standalone power generation system [10]. In another example, the implementation of a coal-oven gas-to-olefins polygeneration concept was studied by Man et al. aiming to reduce the CO2 mitigation cost [11]. In their work, the H2/CO ratio of syngas was adjusted to its optimum value (around 2) by using an integrated coal gasification-coke oven dry reforming system.
The main goal of the present work is to attack the environmental issue by proposing novel polygeneration processes that co-produce methanol, liquid transportation fuel (dimethyl ether), and olefins from natural gas. In the work, four different advanced power generation options are examined in which electricity is produced from waste gases that enable 90%–100% capture of all CO2 produced inside the plant boundary. These are chemical looping combustion using nickel oxide, chemical looping combustion using iron oxide, oxyfuel combustion, and conventional combustion with a gas turbine, each with an integrated CO2 capture process. There is more than sufficient energy from the waste gases to provide for all electricity, cooling, and heat needs in each process. All process heat, water and electricity integration has been explicitly accounted. Thus, no utility is imported across the plant boundary. Only natural gas, process water, and air are consumed, and only water vapor, spent air, liquefied CO2, and products are output.
In addition to using conventional pipeline natural gas as the primary feedstock, four different qualities of shale gas are considered as the feedstock, due to its rapid growth in North America. The process steps for conventional pipeline natural gas and shale gas are similar, but their geographic location can be very different. All of the steps in the process using conventional gas are located at the same place, using a connection to a conventional natural gas pipeline as the feed. However, for the shale gas cases, gas is first converted not to conventional pipeline gas, but to methanol at a point near a collection of shale gas wellheads. The methanol is then transported to the main plant location where it is then converted to the various products. It is also possible that the main plant receives methanol from a variety of different methanol sources or shale gas sites over a wider area. This possibility was examined because it may be more economical to transport methanol as an intermediary rather than convert shale gas to pipeline quality natural gas and transport that, especially since methanol has to be created as an intermediate product anyway in the proposed process. In addition, because some CO2 is captured at the smaller upstream processes closer to the shale gas source, there is the potential for even more synergistic benefits because the CO2 can be used for enhanced gas recovery or enhanced oil recovery with minimum transportation penalty [12]. However, because this decision is highly dependent on each particular business supply chain circumstance, it is not the scope of this work to decide which is better. Rather, the objective is to propose and study several process options and estimate their efficiency, each of which might be the best choice in some circumstances.
As shown in Figure 1A, in the process using conventional gas, the gas is reformed to synthesis gas first and then used for methanol production. Depending on the market prices, the methanol can either be sold as a product, or converted into dimethyl ether (DME), olefins and C3+ via the methanol-to-olefins (MTO) process. DME is a non-toxic fuel that can be used as a substitute for diesel [13,14,15]. The unreacted gases from methanol synthesis are either recycled to the methanol reactor or are mixed with an off-gas stream coming from the MTO unit and sent to the power generation unit. Four different advanced power generation systems with 90%–100% CO2 capture are considered in this study in order to determine the best CO2 removal approach (Section 2.4).
The steps in the processes which use shale gas directly, as shown in Figure 1B, are very similar to the conventional natural gas process. However, in the shale-gas processes, methanol and DME are co-produced near the shale gas source in the “upstream” section. Depending on the type of shale gas, the upstream section may also contain additional separation steps to remove higher hydrocarbons from the shale gas that are not as prevalent in conventional pipeline gas. The methanol is then transported to the “downstream” section in which methanol is converted to olefins in a central locality. The key difference from a process perspective is that the upstream and downstream sections each require their own power generation, heat recovery & steam generation (HRSG), and CO2 capture and compression islands to handle waste gases and CO2 capture, and their performances will be different because the off-gases from upstream and downstream processes will not be mixed and the quality of available heat sources and sinks is also different. However, in this work, the processes were designed to ensure that both the upstream and downstream sections each independently produce their own utilities on site and virtually no CO2 is emitted from either one (in most cases).
In this paper, chemical process simulations were performed to determine the mass and energy flows of each stream in each variants of the process. A technical analysis of the plant was performed to determine the design parameters which resulted in the highest thermal efficiency. The models used for each of the individual unit operations were either developed in the prior work of our group or other groups. Furthermore, in part II of this work, a techno-economic optimization of the plant to determine the most profitable configurations in various market conditions is presented.
The present work focuses on the conversion of gas to more valuable products with minimum environmental effects. However, there are some other open research areas in the production of olefins and fuels from alternative resources such as biomass [16,17] and plastic wastes [18], which are out of scope of this paper. The primary novelty of this work is the proposal of the first complete MTO process with low-to-zero CO2 emissions (and all of its variants). We also note that the upstream/downstream approach (Figure 1B) could also be applied to conventional natural gas as well. Although that case is not modelled separately in this work, the results would be very similar to the case of Fayetteville shale gas reported herein since it has a similar makeup and heating value.
Figure 1. Scheme of the proposed polygeneration process: (A) Integrated plant. (B) Upstream/downstream approach.
Energies 08 03739 g001

2. Process Model and Simulations

Each process variant was simulated using standard chemical unit operation models contained in Aspen Plus 2006.5, except for the gas turbines which were simulated by using a custom model integrated into Aspen Plus via the Microsoft Excel interface (Section 2.4). The feed rate for each case was fixed at 1111 MW (LHV), which is 1976–2356 tonne/day depending on the composition of the gas used (see Table 1). The PR-BM equation of state was used for all units except for water-only unit operations (especially in the HRSG section and steam turbines) and amine units that were simulated by using NBS/NRC and Elec-NRTL models as suggested by Chen and Mathias [19]. The PR-BM model was chosen because it was found to predict experimentally determined vapor-liquid equilibrium data quite well for many different chemical pairs encountered in the process, as shown in the supplementary material. Other physical property packages such as the Ethylene package, which might be appropriate for some of the units of the process, were found to predict the equilibrium properties less accurately than the chosen methods, as shown in the supplementary material. The thermal efficiency calculations of the plant consider all external utility requirements, such as electricity, process steam, and steam for reboiler heating.
Table 1. Gas feedstocks composition, (molar).
Gas TypeCH4C2H6C3H8C4H10CO2N2Flowrate (Tonne/Day)Energy Content, HHV MW (LHV)
Marcellus [20]0.8720.0950.0250.0000.0050.00319761228 (1111)
Fayetteville [20]0.970.0150.0000.0000.0150.00020001232 (1111)
New Albany [20]0.8890.0150.0180.0000.0780.00023561231 (1111)
Haynesville [20]0.9480.0010.0000.0000.050.00122001233 (1111)
Conventional Gas [21]0.9390.0320.0070.0040.010.00820071231 (1111)

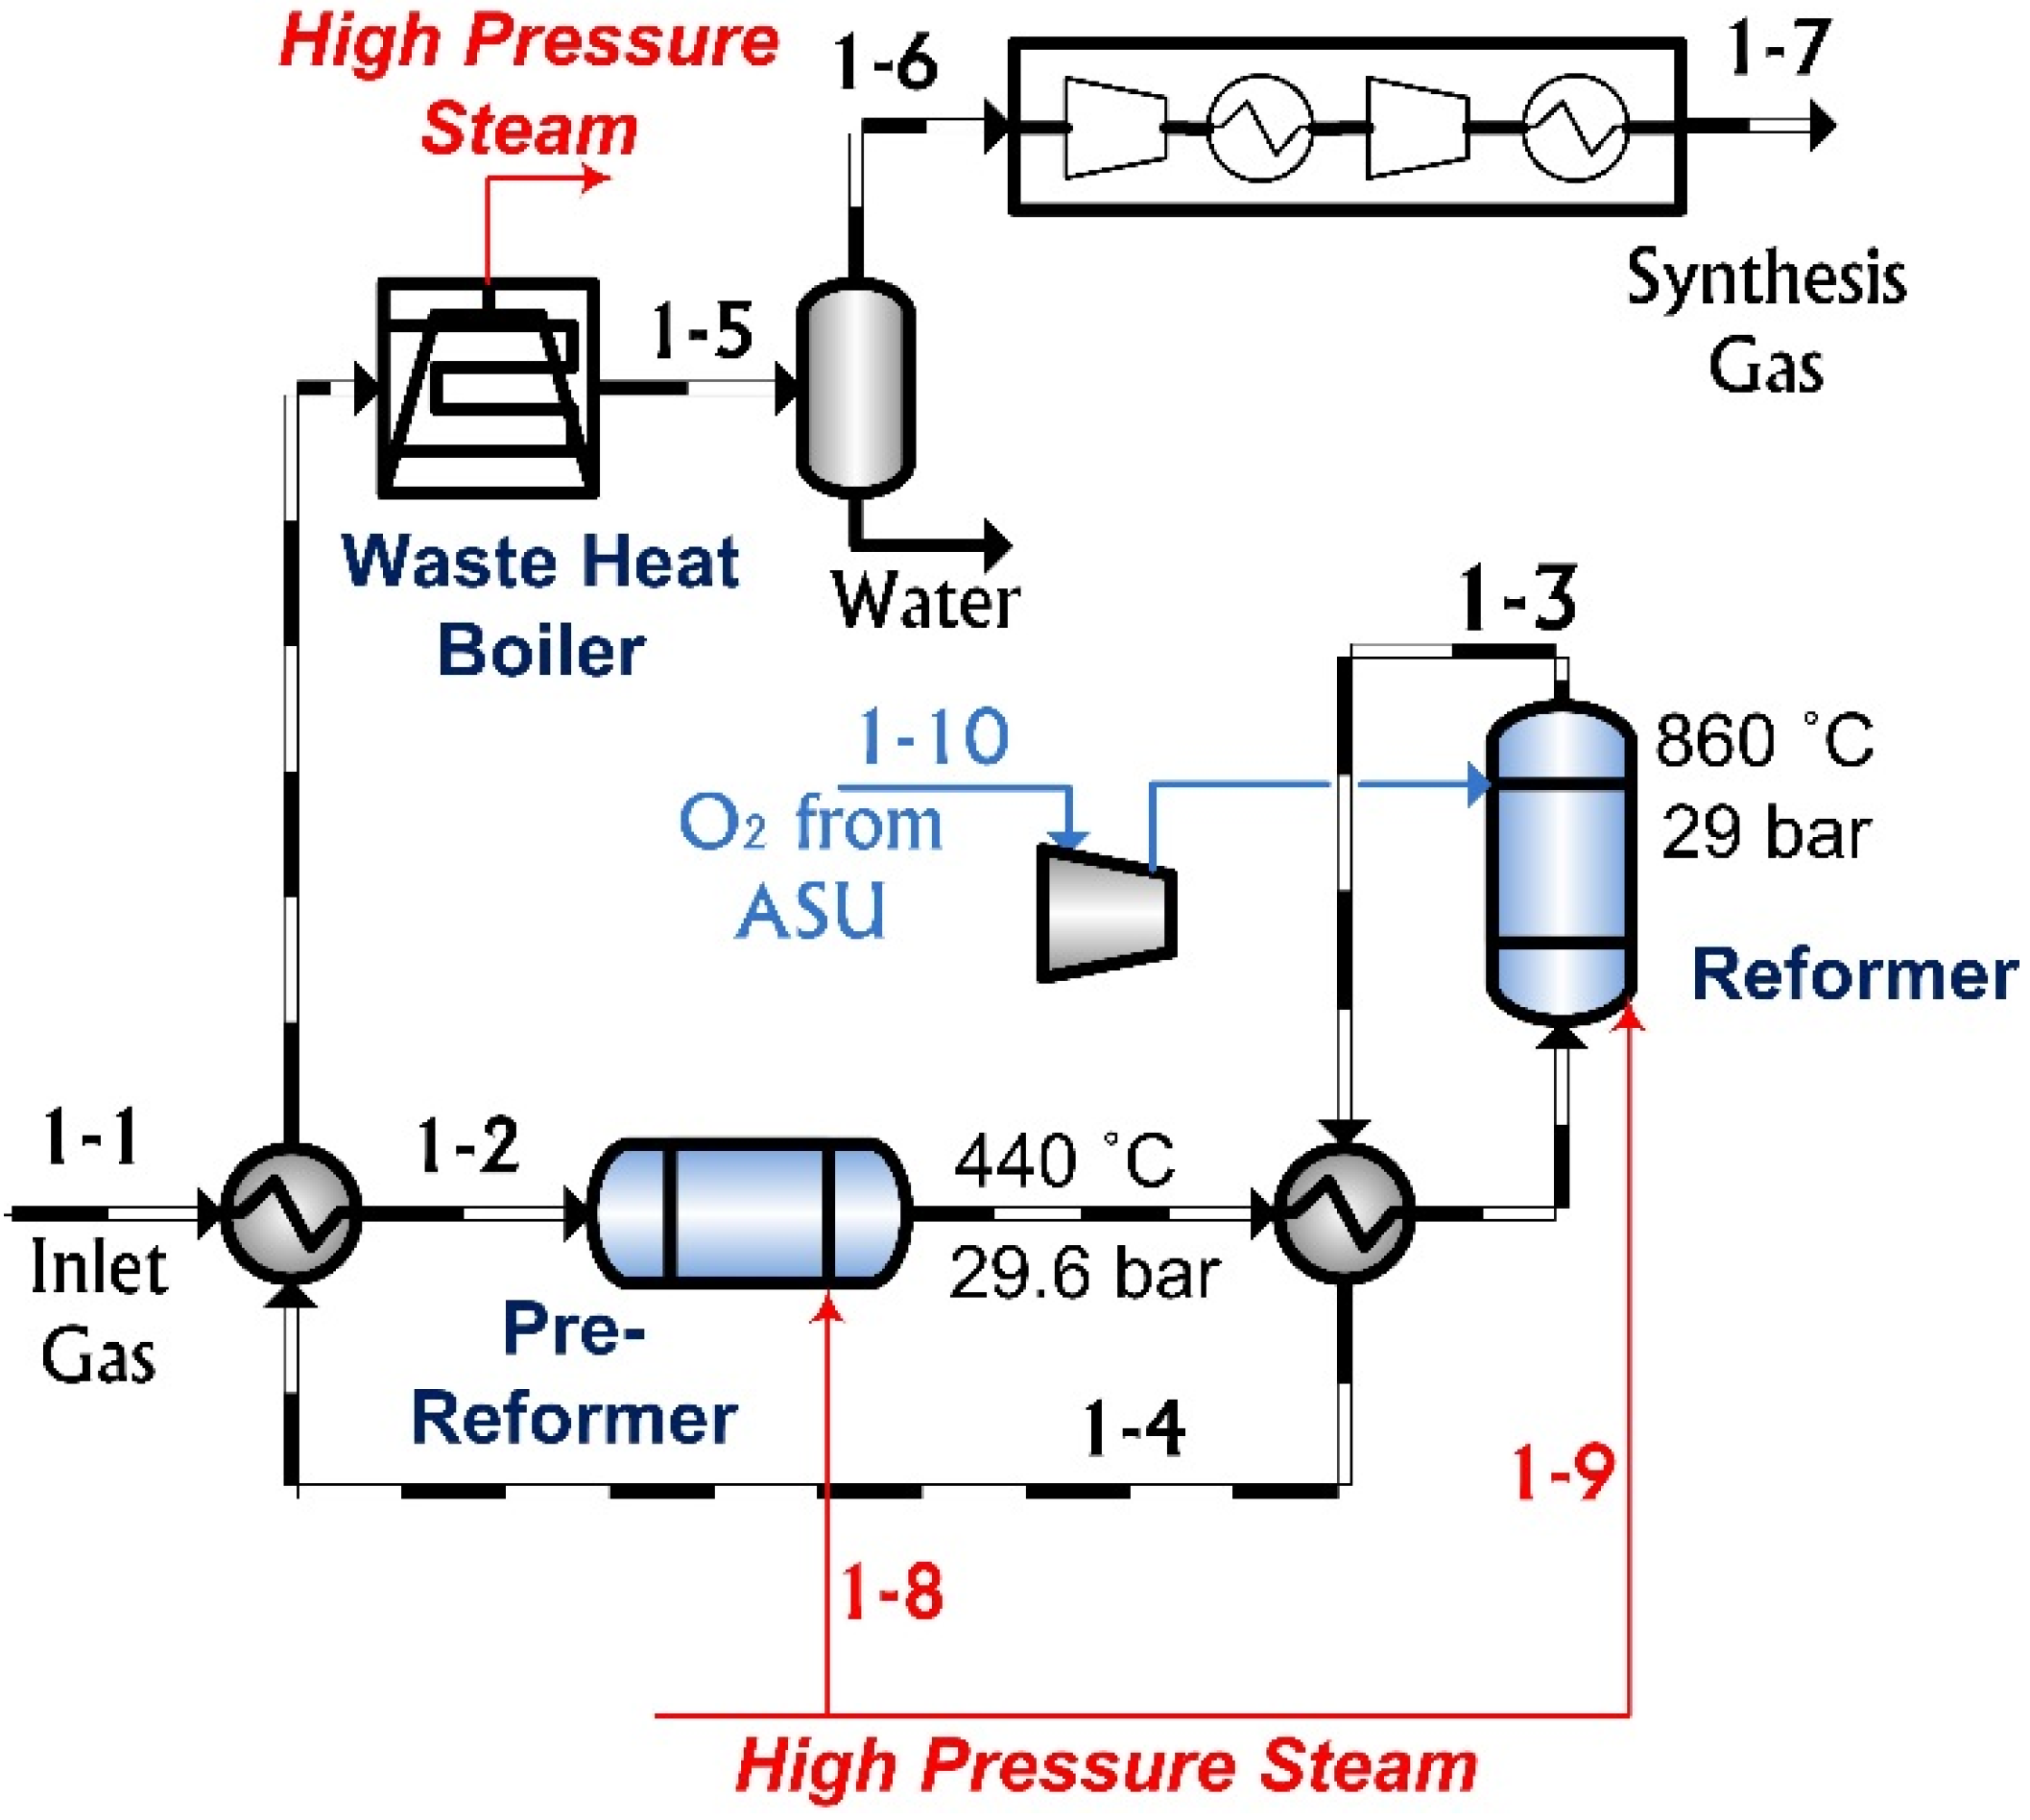
2.1. Natural Gas Reformer

The process of synthesis gas production from gas, called gas reforming, is an endothermic reaction that occurs at high temperature (700–1000 °C). Depending on the reforming temperature and inlet steam-to-gas ratio, the gas conversion varies between 50% to 95% [8]. For this section, the models and optimum operating conditions developed and used in our prior work [8,9,22] were re-used in this simulation, and is briefly described next. As shown in Figure 2, the natural gas is sent to the pre-reformer after being heated by the reformer effluent. In the pre-reformer, ethane and heavier hydrocarbons are converted to syngas. The output stream is sent then to the reformer, where methane is converted to H2, CO and CO2 based on the following equilibrium reactions [22]:
C H 4 + H 2 O   C O + 3 H 2
C O + H 2 O   C O 2 + H 2
C H 4 + C O 2   2 C O + 2 H 2
Figure 2. Section 1: Auto-thermal gas reforming.
Energies 08 03739 g002
In addition, a portion of the methane is simultaneously oxidized with high purity (99.5%) O2 inside the reactor in order to provide the heat requirements of the reforming reactions (the air separation unit (ASU) is not modeled in detail but all costs, parasitic loads, and other relevant mass and energy balances are included in the analysis). After cooling the hot syngas stream, it is dehydrated, compressed, and then sent to the methanol synthesis unit (Stream 1–7). The REquil model was used for the simulation of both reactors.

2.2. Methanol & DME Production Unit

In this unit, the synthesis gas produced in the reforming unit (Stream 1–7) is first mixed with a recycle stream containing unreacted gases and sent to the methanol reactor (Figure 3). The main reactions that occur in the MeOH reactor are [23]:
CO2 + 3H2 ⇌ CH3OH + H2O ∆H25=−49.51 kJ/mol
CO2 + H2 ⇌ CO + H2O ∆H25=41 kJ/mol
with corresponding reaction rate laws:
r 4 = k M 1 p C O 2 p H 2 [ 1 ( 1 / K e q , M 1 ) ( p H 2 O p C H 3 O H / p H 2 3 p C O 2 ) ] ( 1 + K 1 ( p H 2 O / p H 2 ) + K 2 p H 2 + K 3 p H 2 O ) 3 ,   k m o l k g c a t . s e c
r 5 = k M 2 p C O 2 [ 1 ( 1 / K e q , M 2 ) ( p H 2 O p C O / p C O 2 p H 2 ) ] ( 1 + K 1 ( p H 2 O / p H 2 ) + K 2 p H 2 + K 3 p H 2 O ) ,   k m o l k g c a t . s e c
where r 4 and r 5 are the reaction rates, p i is the partial pressure of species i, and the k and K terms are constants shown in Table 2 as suggested by Vanden bussche et al., as well as the operating conditions for the reactor (shown in Table 3) [23]. The reactor dimensions were adjusted to achieve 40% CO conversion.
Figure 3. Section 2: Methanol and DME synthesis.
Energies 08 03739 g003
Table 2. Kinetic values of the MeOH/DME synthesis reactions [23,24].
Parameter ( k i = A e x p ( B R T ) ) AB (kJ/kmol)
K13453.380
K2 (1/bar0.5)0.49917,197
K3 (1/bar)6.62 × 10−11124,119
K4 (m3/kmol)5.39 × 10−470,560.92
K5 (m3/kmol)8.47 × 10−242,151.98
kM1 (kmol/kgcat.bar2.sec)1.07 × 10−336,696
kM2 (kmol/kgcat.bar.sec)1.22 × 107−94,765
kD1 (kmol/kgcat.sec)1.49 × 101°−143,666
Keq,M1 (1/bar2)2.56 × 10−1158,694.56
Keq,M287.57−36,581.6
Table 3. Main design parameters of the Methanol/DME synthesis section.
Unit OperationsParameters
MeOH reactorTemperature: 250 °C, Pressure: 51 bar
RPlug reactor model
MeOH flash drum35 °C, 50.5 bar
DME reactorTemperature: 400 °C, Pressure: 15 bar
RPlug reactor model
Tail gas removal25 stages, 49 bar
MeOH mass recovery: 98%
MeOH purification30 stages, 30 bar, RadFrac model
MeOH mass recovery: 99.5%
MeOH mole purity (industrial grade): 99.5% [25]
DME purification30 stages, 13.5 bar, RadFrac model
DME mass recovery: 99.5%
DME mole purity (fuel grade): 99.9% [26]
Unreacted gases and water are removed from the MeOH product by first cooling the reactor effluent at 35 °C and collecting the liquid in a flash drum. A portion of the vapour product (stream 2–3, mostly unreacted syngas) from the flash drum is recycled to the reactor, and the rest is sent for power generation. The percentage that is recycled is subject to optimization, discussed in part II of this work. Additional gasses still present in the liquid product are removed in a tail gas removal column, leaving primarily MeOH and water in the bottoms product. The bottom is sent to a MeOH purification column in which water is recovered in the bottoms and MeOH is recovered in the distillate. Key design parameters for these columns are shown in Table 3, based on our previous work [27].The MeOH product is then split into three streams: Stream 2–6 which is the feedstock for the DME synthesis reactor (described next); Stream 2–7 which is the feedstock of the MTO unit (see Section 2.3); and Stream 2–8 which is sent to the storage tanks for sale of MeOH as a final product. The split ratio between these streams is subject to optimization and discussed in part II of this work.
The DME synthesis reaction and corresponding rate law is as follows:
2CH3OH ⇌ CH3OCH3 + H2O ∆H25 = −24 kJ/mol
r 8 = k D 1 K 4 2 [ C C H 3 O H 2 ( 1 / K e q , D 1 ) C H 2 O C C H 3 O C H 3 ] ( 1 + 2 K 4 C C H 3 O H + K 5 C H 2 O ) 4 ,   k m o l k g c a t . s e c
l n   ( K e q , D 1 ) = 2835.2 T + 1.675 l n ( T ) 2.39 × 10 4 T 0.21 × 10 6 T 2 13.36
where r 8 is the reaction rate, C i is the concentration of species i, and the k and K terms are constants shown in Table 2 as suggested by Bercic and Levec [24]. Further details of design parameters are summarized in Table 3, based on our previous work [27].
The DME reactor effluent is then sent to the DME purification column to get DME product with 99.9% molar purity (fuel grade), with key design parameters also shown in Table 3, chosen for recovering 99.5% of DME.

2.3. Methanol to Olefins (MTO)

The MTO technology is based on the dehydration of MeOH to light olefins in a catalytic reactor. The main reaction products are [28]:
M e O H { C 2 H 4 / C 2 H 6 C 3 H 6 / C 3 H 8 C 4 H 8 / C 5 H 10 C O 2 / H 2 O C H 4
The SAPO-34 catalyst, which was developed by Union Carbide, is known to have one of the highest selectivity and conversion rates of MeOH-to-olefins and thus is utilized by UOP in its licensed UOP/Hydro MTO process [29,30], shown in more detail Figure 4. In this work, the MTO reactor was modelled based on the experimentally determined selectivities for this catalyst described in detail by Wilson et al. [31]. As such, the model used for the MTO reactor fixes the temperature, pressure, feed conditions and selectivity to those results, as shown in Table 4.
Table 4. Main design parameters of the MTO section.
Unit OperationsParameters
Olefins production methodUOP/Hydro MTO process [32]
MTO reactorRYield reactor model; Temperature: 400 °C, Pressure: 40 bar
 MTO reactor catalystSAPO-34 [31]
 Reactor selectivityExperimental results by Wilson et al. [31]
Molar Selectivity: CH4: 0.013; C2H4: 0.43; C2H6: 0.008; C3H6: 0.418; C3H8: 0.005; C4H8: 0.108; C5H10: 0.017
CO2 removalAmine type: DGA; Elec-NRTL model [19]
 CO2 absorber20 stages, 2 bar
 Amine regenerator20 stages, 1.5 bar
 %CO2 removal99.9
Olefin products recovery
 De-Ethanizer32 stages, 35 bar
 Reflux ratio: 2.6; Boilup ratio: 4
 %Ethane recovery: 99.8
 Power consumption of refrigeration cycle: 0.35 MW/MW [33]
 De-Methanizer35 stages, 34 bar
 Reflux ratio: 3.85; Boilup ratio: 1.03
 %Methane removal: 99.99
 Power consumption of refrigeration cycle: 1.21 MW/MW [33]
 C2 Splitter30 stages, 10 bar
 Reflux ratio: 1.7; Boilup ratio: 29.8
 %Ethylene recovery: 95; Ethylene mole purity (polymer grade): 99.9% [34]
 Power consumption of refrigeration cycle: 0.64 MW/MW [33]
 De-Propanizer30 stages, 25 bar
 Reflux ratio: 6.0; Boilup ratio: 25.6
 %Propylene recovery: 98; Propylene mole purity (polymer grade): 99.2% [35]
Figure 4. Section 3: Methanol-to-olefins process (MTO) based on UOP/Hydro technology [32,36].
Energies 08 03739 g004
Next, the reactor effluent is cooled to 40°C and flashed in order to recover unreacted water and MeOH as a liquid, which is the recycled to the MTO reactor. The vapour product from the flash drum is then sent to the CO2 removal section, which uses a classic absorption/regenerator loop using 70 wt % diglycolamine (DGA)/30 wt % water mixture as the solvent. Note that other solvents are possible, such as MDEA, but for this particular application it was found to outperform MDEA (MDEA model not shown for brevity). The absorber/regenerator cycle was modeled using RadFrac in Aspen Plus and designed to achieve 99.9% CO2 removal. Design parameters are shown in Table 4.
The remaining gases are compressed to 35 bar and cooled to remove the remaining water (some water escapes from the solvent mixture). Then, the dehydrated gas is fed to the De-Ethanizer column to remove ethylene, ethane and other light gases such as CO2 (Stream 3–7) from the propylene and heavier components (Stream 3–8). The De-Propanizer column splits propylene from the heavier hydrocarbons (C3+) which can be sold as unstabilized naphtha or used as fuel for power generation. The light gases are fed to the De-Methanizer column to split the methane and light gases (Stream 3–12) from ethylene and ethane (Stream 3–13). The light gases are sent to the power generation island while the ethylene and ethane are sent to the C2-Splitter. The C2-Splitter is then used to recover ethylene from ethane, noting that in this design, some ethylene remains in the ethylene stream. Ethylene and ethane have close boiling points and a large number of stages and high boilup rates are required to achieve greater yields. This is subject to optimization but is outside of the scope of this work. The design parameters for all of these columns can be found in Table 4.
It should be noted that two refrigeration cycles are required to provide low temperature for the condensers. A three-stage propane refrigeration cycle was used to provide low temperatures for the condenser of De-Ethanizer columns [37]. The De-Methanizer and C2 Splitter columns utilize a two-stage ethylene refrigeration cycle, which is integrated with the propane refrigeration cycle [38]. Please note that these cycles were not individually modeled and have not been shown in Figure 4 for brevity, but their capital costs, operating costs, and parasite power consumption have been considered in thermal and cost analysis, using Aspen Icarus 2006.5 and Gas Processors Suppliers Association (GPSA) [33], discussed in part II.

2.4. Power Island

In this work, four different power generation systems with CO2 capture were investigated for use in the power island, using unreacted syngas (Stream 2–4), off-gas (Stream 3–12) and C3+ (Stream 3–10) as the fuel gas. In conventional pipeline gas cases, streams 2–4, 3–10 and 3–12 are mixed, and in the shale gas cases, a separate power generation island is used for 2–4 (at the upstream location) and 3–10 and 3–12 (at the downstream location). First, a traditional gas combustion turbine system with post-combustion capture was considered with a solvent-based system to recover CO2 from the combustion exhaust. This is a commercially available technology [39]. Second, oxy-fuel combustion was considered, in which the fuel gas is combusted with an oxygen-rich stream instead of air. Since only limited N2 mixes with the fuel CO2 capture is achieved by simply condensing water from the combustion exhaust, leaving a high purity CO2 stream behind. Then, chemical looping combustion with two different metal oxides was considered, which achieves indirect combustion of fuel gas by using a metal oxygen carrier such as iron-oxide (Fe2O3) in option three or nickel-oxide (NiO) in option four [40]. In either process, the combustion reaction takes place in the Fuel reactor with the oxygen provided by metal oxide while N2 is absent. Then the reduced metal is regenerated in Air reactor, and the depleted air sent to the turbine. Both oxy-fuel combustion and chemical looping combustion technologies are in active development, and have been demonstrated at pilot scales [41,42,43]. The main process design assumptions and specifications of each approach are listed in Table 5, and are described in detail in the following subsections.

2.4.1. Option 1: Gas Combustion Turbines with Post-Combustion Capture

In this classic process, shown in Figure 5, the waste gases are combusted with air at high pressure and then expanded through a gas combustion turbine, generating electricity. Additional power is produced in a combined cycle by using the waste heat from the combustion exhaust to generate steam for steam turbines. As shown in Figure 5, Condensing steam turbine is used for the last stage and the vacuum pressure is provided by condensing steam in the condenser. It should be noted that the additional cost of this type of turbine has been considered in the economic analysis of process. In Aspen Plus, standard models for the compressors, turbines, heat exchangers, and pump were used with design assumptions shown in Table 5. As illustrated in Figure 5, a simple train was used for the steam turbines. However, reheating the steam is an alternative that can improve the performance of the power island. The optimal design pressures and temperatures of the steam cycle were chosen using the built-in optimization algorithm in Aspen Plus, considering typical turbine efficiencies [27]. The built-in Aspen Plus model for a gas turbine was not used, but rather used a more accurate, empirical model based on the Siemens V94.3A turbine developed by Wilcock et al. [44,45,46]. This model is more rigorous because it considers the detailed effects of the coolant when predicting the system efficiencies, which in this case is air used with a film-cooling mechanism. This model was implemented inside Microsoft Excel and used within Aspen Plus through the user model interface.
Figure 5. Section 4 option 1: Power generation with post-combustion capture.
Energies 08 03739 g005
Next, CO2 is removed from the exhaust gas of the gas turbine using an amine-based absorption process. Although not commonly used at very high capture rates in current power plants, it is a well-known carbon capture technique. Moreover, the CO2 capture section can be readily retrofitted to a gas turbine power plant after construction [39,47]. This means it is possible to neglect the CO2 capture step and vent the cooled combustion exhaust to the atmosphere instead (noting some small cleanup steps may be needed first), and retrofit the CO2 capture section onto the end of the proposed polygeneration process at some later date only when politically or economically necessary. However, this is outside the scope of this work, and only processes with CO2 capture enabled are considered.
Table 5. Process design specifications of the power island.
Unit OperationsParameters
Gas turbines (options 1, 3, and 4)Model: Siemens V94.3A [46]
Outlet pressure: 1.1 bar
Polytropic efficiency: 0.92, mechanical efficiency: 0.983
Number of turbine stages: 4
Maximum metal surface temperature (Tm,external): 850 °C
Gas turbine model based upon algorithm presented by Wilcock [44] and Young [45]
Steam turbines (all four options)High pressure steam: 470 °C, 40.75 bar
Turbines outlet pressure (HP/IP/LP): 17/5.8/0.07 bar
Turbines outlet temperature (HP/IP/LP): 351/230/42 °C
Isentropic efficiency: 0.875, Mechanical efficiency: 0.983
Post combustion capture (option 1)Amine type: DGA; Elec-NRTL model [19] %CO2 capture: 90
CO2 absorber: 30 actual stages, 1.8 bar, CO2 Murphree efficiency: 0.33 [48]
CO2 stripper: 30 actual stages, 1.3 bar, CO2 Murphree efficiency: 0.5 [48]
Oxy-fuel combustion (option 2)RGibbs reactor model.
 Excess O23% (mole) [49]
 O2/recycle CO2 ratio27% (mole) [49]
 Air Separation UnitOxygen purity (molar): 0.995 [50]
Chemical looping combustion (options 3 and 4)RGibbs model for both Air and Fuel reactors. See [51] for more details on Aspen model setup.
Residence time of Air & Fuel reactors300 s [52,53,54]
Iron oxide (option 3)Air reactor temperature: 960 °C
Air/Solid rate: 1.312 (mole)
Fuel reactor temperature: 710 °C
Fe2O3 in/Fuel gas: 1.81 (mole)
Nickel oxide (option 4)Air reactor temperature: 1250 °C
Air/Ni rate: 2.39 (mole)
Fuel reactor temperature: 700 °C
NiO in/Fuel gas: 1.57 (mole)
CO2 compression (all four options)Compressor outlet pressure: 80 bar
Delivery condition: Temperature: 44 °C, Pressure: 153 bar
For the post-combustion CO2 capture step used in this work, an amine is used to absorb the CO2 component based on a set of electrolyte reactions [55,56]. As shown in Figure 5, the exhaust gas from the gas turbine is cooled first and then contacted with lean amine in the absorption column. The exhaust gas leaving from the absorber is lean in CO2 and can be vented to atmosphere. The CO2-Rich amine stream is pumped into the stripper column, where a reboiler supplies the required heat to break the CO2-amine chemical bound and separate the CO2. Even though there are different kinds of amines that can be applied to this process, primary amines like monoethanolamine (MEA) and diglycolamine (DGA) are more suitable for low-pressure gas streams [57,58]. DGA was chosen for this work since it can be used at higher concentration (50–70 wt % [58]), its circulation rate is less than MEA, which affects the size and energy requirement of the plant. This was verified through simulation of both solvents, although MEA results are not reported here for brevity. An exhaustive comparison of solvent selection is outside the scope of this work. The system is designed to achieve 90% capture with the captured CO2 at 96% purity. The CO2 product stream is then sent to the compression train, where the remaining water impurity is removed and liquid CO2 with high purity (≥98%) is produced.

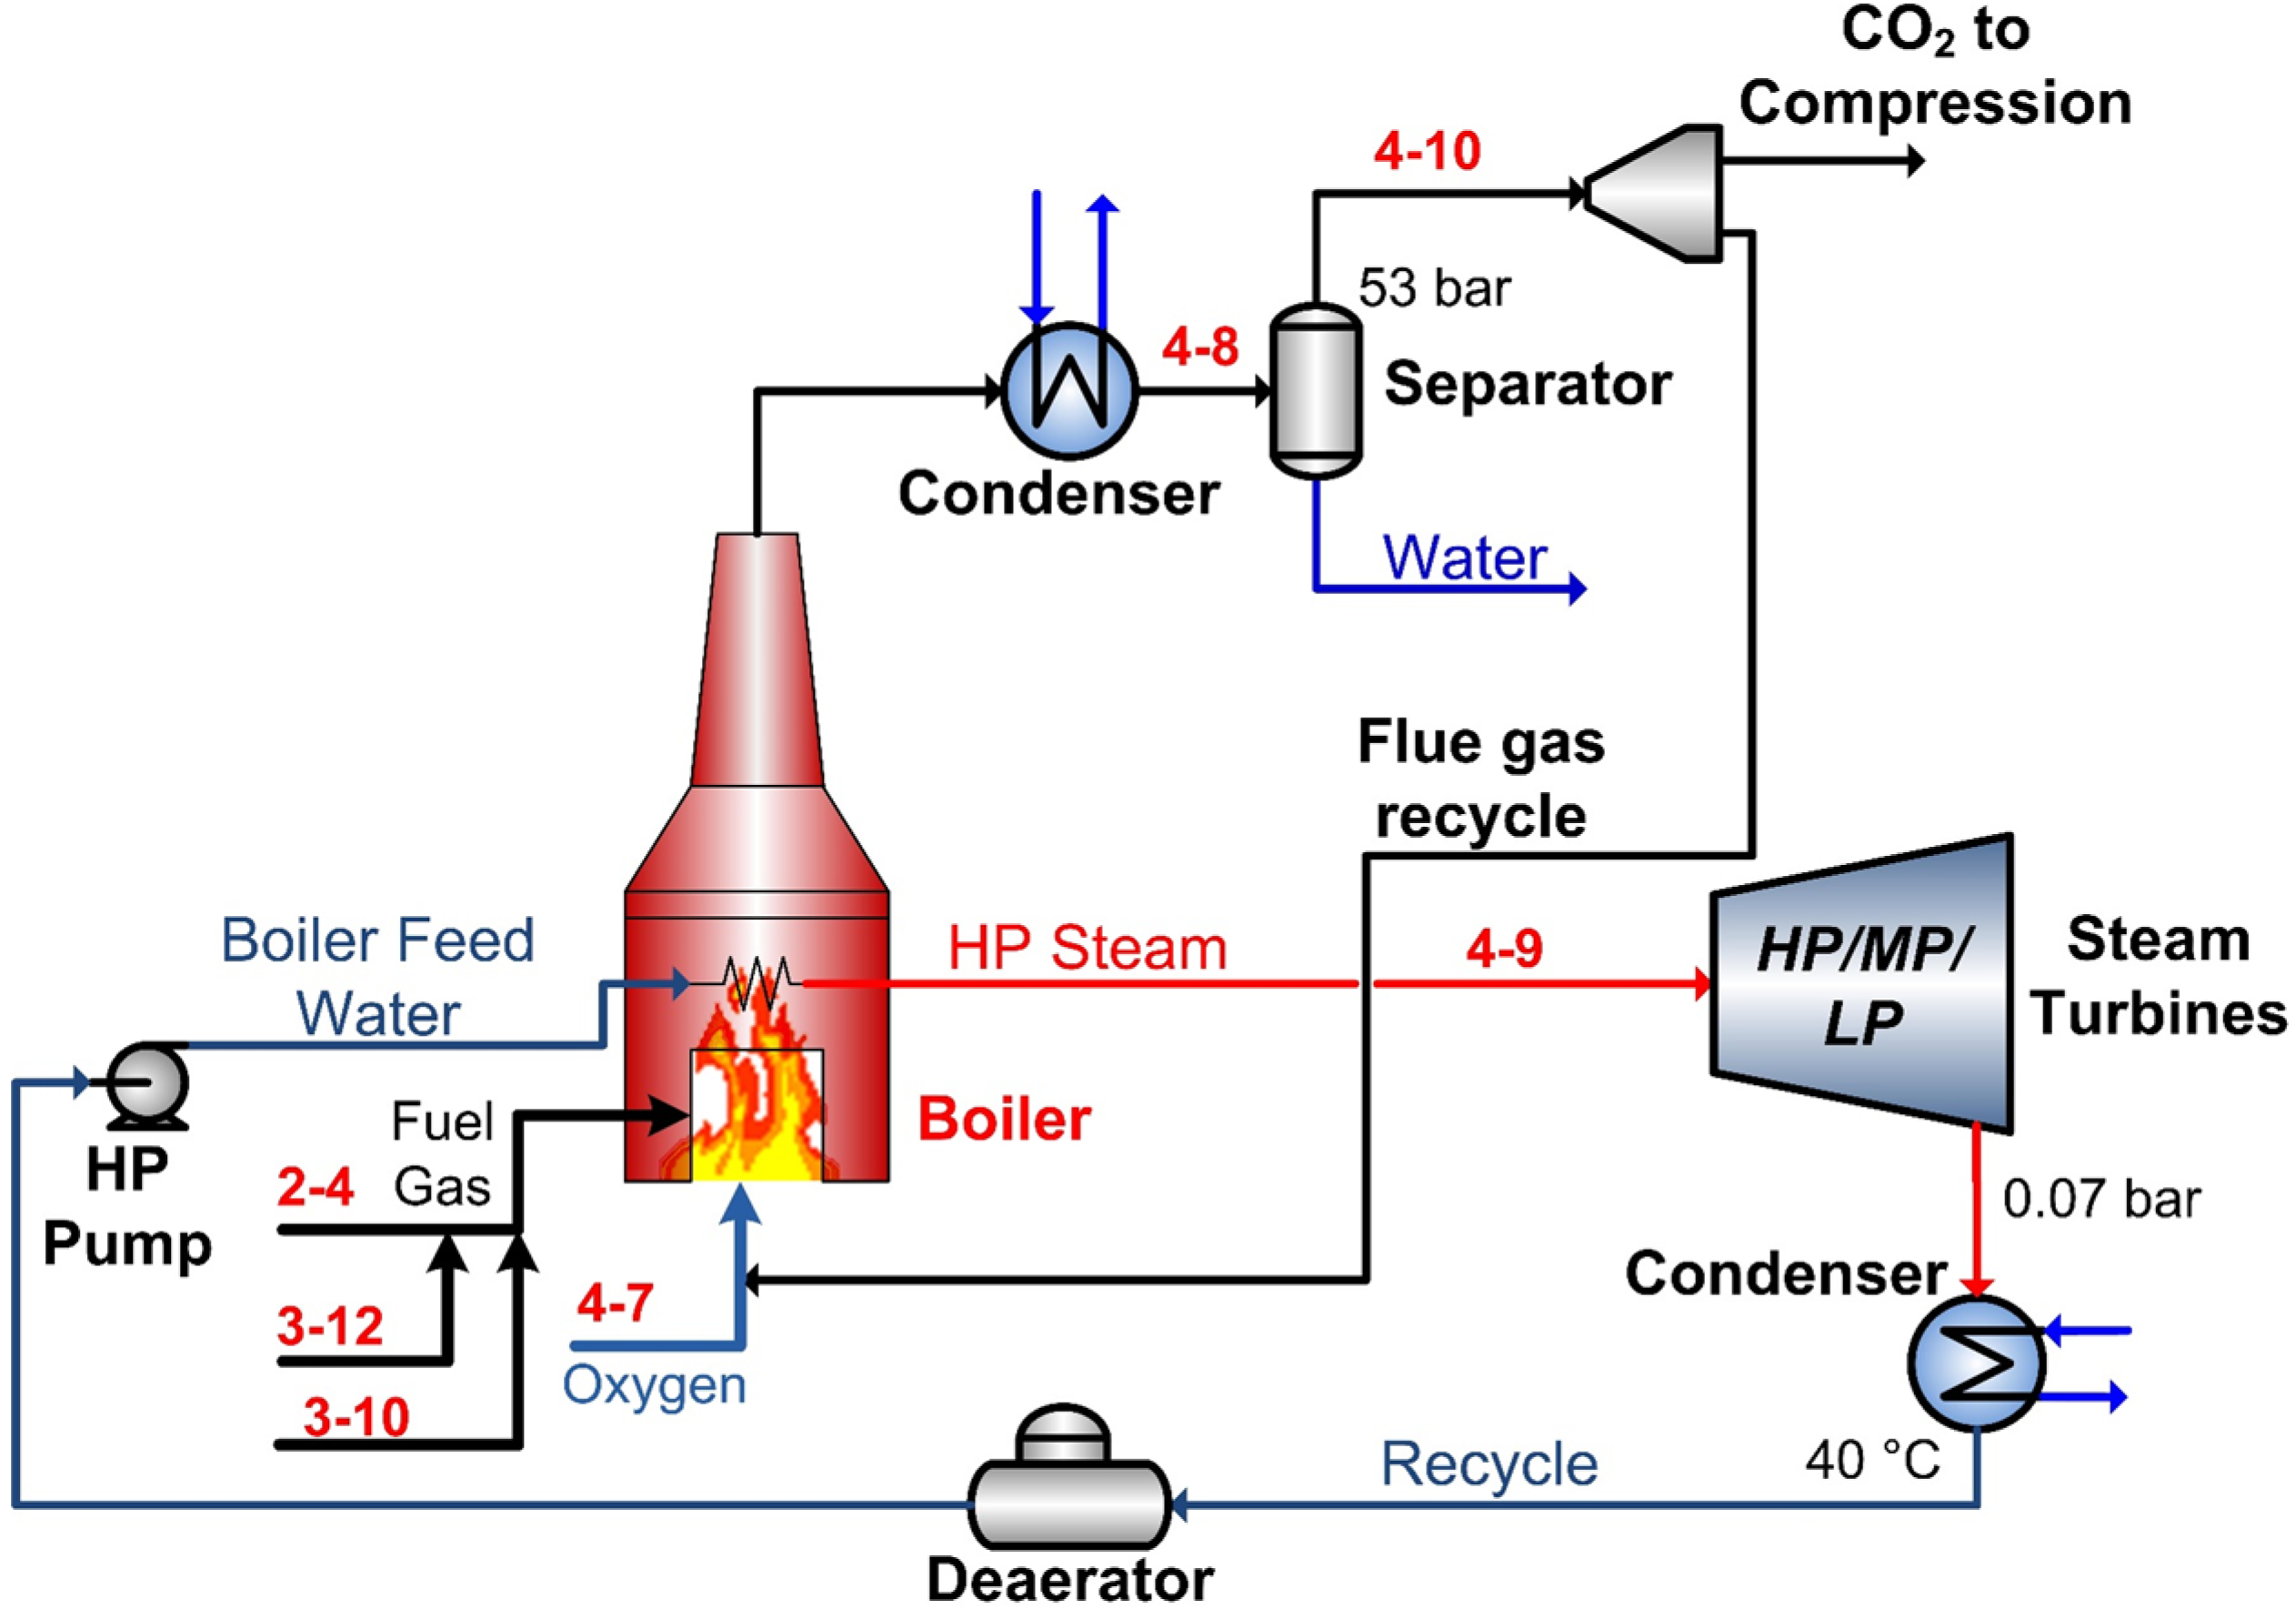
2.4.2. Option 2: Oxy-Fuel Combustion

The primary downside to using the solvent-based post-combustion capture approach is that it has a very high parasitic load, which contributes to significant efficiency loss. One proposed alternative is the oxy-fuel combustion process, in which the fuel is combusted in high-purity oxygen instead of air. An air separation unit is used to remove nitrogen and other impurities from the air and produce the oxygen. Thus, the exhaust gas produced from oxy-combustion consists of mainly CO2 and steam that can be separated in a solvent-free process (by condensing out the water) [59]. Although the ASU is energy intensive, the CO2 capture step requires little energy, and the process as a whole should have a higher efficiency than traditional post-combustion carbon capture.
The oxy-fuel process used in this work (shown in Figure 6 with details in Table 5) is based on the process of Tan et al. [41], who developed a 0.3 MWhth pilot plant constructed in the CANMET energy center. In this process, the oxy-combustion is performed in a boiler where the heat is used to make steam for the steam cycle, the only source of power generation in this scenario. The oxy-combustion is performed at high pressure and is not expanded, such that the CO2 is captured at high pressure, which greatly reduces compression costs. Note that some of the captured CO2 is recycled and used as a diluent, such that the feed oxygen composition and combustion mechanism are similar to traditional air combustion [41,60,61]. In this work, all unit operations are modeled using standard models for the pump, turbines, heat exchangers, and flash drum, and the RGibbs model was used for the combustor (this model assumes chemical equilibrium).
Figure 6. Section 4 Option 2: Power generation with oxy-fuel combustion.
Energies 08 03739 g006

2.4.3. Options 3 and 4: Chemical Looping Combustion

Chemical looping combustion is another power generation alternative that is also designed to avoid the large parasitic energy loads of solvent-based CO2 capture by keeping nitrogen separate from the fuel. However, in this process, oxygen is introduced to the fuel using a solid oxide as an oxygen carrier. The process works as shown in Figure 7 by taking solid metal particles and reacting with air to produce the metal oxide, which is easily separated from the remaining air. The metal oxides are then reacted with the fuel gas in a second reactor, producing heat, the exhaust gas (CO2 and steam), and more solid metals for reuse. The hot, depleted air is expanded in a turbine for power production, and additional waste heat from the hot air and the hot combustion exhaust is used to produce steam in a steam cycle for additional power. Like oxy-fuel combustion, the chemical looping combustion reactors operate at high pressure such that CO2 can also be captured via water condensation in a similar manner, reducing downstream compression costs considerably.
Nickel-oxide and iron-oxide were investigated as two possible oxygen carriers, since it is not immediately obvious which would be better. Prior experimental test results by Cho et al. [62] and Adanez et al. [63] have shown that NiO has one of the highest reaction rates with a relatively high lifespan and low circulation rate. On the other hand, iron-oxide is less expensive than most other metals while having relatively high activity [64]. Lyngfelt tested both Fe and Ni loops successfully for 4000 h of continuous operation with almost 100% CO2 capture [65]. Linderholm et al. [66] and Kolbitsch et al. [52,53] have also analyzed the operability of 10-kW and 120-kW Ni-based demonstration plants respectively and achieved promising results.
Figure 7. Section 4 Options 3 and 4: Power generation with chemical looping combustion based on sub-pilot plant constructed by Ishida et al. [42,43].
Energies 08 03739 g007
The main reactions of the fuel reactor and air reactor for each metal are listed as follows:
  • Nickel oxide [51]:
    • Fuel reactor:
      C x H y + [ ( 4 x + y ) / 2 ] N i O x C O 2 + y / 2 H 2 O + [ ( 4 x + y ) / 2 ] N i
      C O + N i O C O 2 + N i
      H 2 + N i O H 2 O + N i
    • Air reactor:
      2 N i + O 2 2 N i O
  • Iron Oxide [67]:
    • Fuel reactor:
      C x H y + [ ( 6 x + 3 2 y ) / 3 ] F e 2 O 3 x C O 2 + y / 2 H 2 O + [ ( 12 x + 3 y ) / 3 ] F e O
      C O + F e 2 O 3 C O 2 + 2 F e O
      H 2 + F e 2 O 3 H 2 O + 2 F e O
    • Air reactor:
      4 F e O + O 2 2 F e 2 O 3
In this work, Aspen Plus was used to simulate the different unit operations for both metal oxide options. Standard Aspen Plus models for all of the unit operations were used with design conditions shown in Table 5. The two chemical looping reactors were modeled assuming chemical equilibrium (RGibbs). Note that due to a lack of available data and the complexity of the system, the model did not consider leakage of solids or gases from the system or the effects of carrying spent solid particles (unusable) along with the useable ones. However, the different degradation rates and associated replacements costs were reflected in the economic analysis since the rate of catalyst replacement and costs were significantly different for the two oxides considered. If the effects of leakage or inert particles on the mass or energy balances were considered, one would expect the system performance to be slightly lower than the results reported, but should not deviate too significantly such that we can still make useful comparisons with Options 1 and 2 in this study.

3. Thermal Analysis Results

Four different scenarios were considered: maximum DME production, maximum power generation, maximum olefin production, and maximum methanol production. Selected stream and energy conditions of each process section for each scenario for the Fayetteville shale gas case are shown in Table 6. Furthermore, the performance of the chemical looping combustion (both NiO and Fe2O3 oxygen carriers), oxy-fuel combustion and post-combustion technologies for Fayetteville shale gas and the “maximum DME production” scenario are shown in Table 7. Looking at the results, the highest DME rate is obtained by the NiO-CLC system. Although the efficiency of the post-combustion system is relatively high, the maximum DME production is 70% in the post-combustion approach, which is lower than other configurations. This is due to the high energy demand of the reboiler of the CO2 stripper column (Figure 5) which consumes most of the stream generated in the HRSG unit. Therefore, there is not sufficient steam generation to supply the energy demand of the DME purification column (Figure 3) when the MeOH-to-DME ratio is more than 70% without the import of utilities from external sources. Furthermore, this option requires a separate compressor to send the captured CO2 to the CO2 compression unit.
Table 6. Selected results of four different process scenarios (Fayetteville shale gas). The energy output is defined as the electricity produced plus the higher heating values of methanol, DME and olefins produced.
Optimization ScenarioMaximum DME ProductionMaximum Olefin Production
Stream No.1–12–82–103–93–144–6Stream No.1–12–82–103–93–144–6
DescriptionShale GasMeOHDMEPropyleneEthyleneCO2 LiquidDescriptionShale GasMeOHDMEPropyleneEthyleneCO2 Liquid
Temperature (°C)30.0-56.0--30.0Temperature (°C)30.0--35.7−51.830.0
Pressure (bar)30.0-13.5--153.0Pressure (bar)30.0--15.010.0153.0
Total Flow (kg/h)83,363-76,862--72,830Total Flow (kg/h)83,363--8274947472,285
Energy Input, HHV1232 MWEnergy Output, HHV641.77 MWEnergy Input, HHV1232 MWEnergy Output, HHV268.10 MW
Net Power Generation (Upstream of Pipeline)27.0 MWNet Power Generation (Downstream of Pipeline)0 MWNet Power Generation (Upstream of Pipeline)11.2 MWNet Power Generation (Downstream of Pipeline)22.3 MW
Power Consumption (MW)Power Consumption (MW)
Reformer10.3MeOH & DME Synthesis2.4Reformer10.3MeOH & DME Synthesis4.3
MTO process0.0Refrigeration0.0MTO process4.5Refrigeration4.8
Optimization ScenarioMaximum Power GenerationMaximum Methanol Production
Stream No.1–12–82–103–93–144–6Stream No.1–12–82–103–93–144–6
DescriptionShale GasMeOHDMEPropyleneEthyleneCO2 LiquidDescriptionShale GasMeOHDMEPropyleneEthyleneCO2 Liquid
Temperature (°C)30.0-56.0--30.0Temperature (°C)30.030.0---30.0
Pressure (bar)30.0-13.5--153.0Pressure (bar)30.030.0---153.0
Total Flow (kg/h)83,363-25,483--172,386Total Flow (kg/h)83,363121,752---54,583
Energy Input, HHV1232 MWEnergy Output, HHV476.28 MWEnergy Input, HHV1232 MWEnergy Output, HHV686.2 MW
Net Power Generation (Upstream of Pipeline)274.3 MWNet Power Generation (Downstream of Pipeline)0 MWNet Power Generation (Upstream of Pipeline)12.9 MWNet Power Generation (Downstream of Pipeline)0 MW
Power Consumption (MW)Power Consumption (MW)
Reformer10.3MeOH & DME Synthesis1.2Reformer10.3MeOH & DME Synthesis4.4
MTO process0.0Refrigeration0.0MTO process3.4Refrigeration3.6
Table 7. Comparison of the power generation options using Fayetteville shale gas (maximum DME production).
Power Generation OptionChemical LoopingOxy-Fuel CombustionPost Combustion
Iron-OxideNickel-Oxide
Efficiency, %HHV52.552.148.254.5
%CO2 capture10010010090
Process Variables
Recycle ratio of unreacted gases0.9560.9560.9500.950
MeOH ratio to the MTO section0.0000.0000.0000.000
MeOH ratio to the DME section1.0001.0001.0000.700
Product Portfolio (%)
 Net electricity5.04.21.011.1
 MeOH0.00.00.047.2
 DME95.095.899.041.7
 Olefins0.00.00.00.0
Table 8. Comparison of the thermal analysis results of different shale gases with NiO-CLC as the selected power generation approach.
Optimization ScenarioMaximum DMEMaximum Olefin
Gas TypeMarcellusFayettevilleNew AlbanyHaynesvilleConventional GasMarcellusFayettevilleNew AlbanyHaynesvilleConventional Gas
%HHV51.952.151.852.152.521.922.022.522.722.8
Product portfolio
 %Power4.54.24.34.24.314.311.712.512.918.5
 %MeOH0.00.00.00.00.00.00.00.00.00.0
 %DME95.595.895.795.895.70.00.00.00.00.0
 %Olefins0.00.00.00.00.085.788.387.587.181.5
Optimization ScenarioMaximum PowerMaximum MeOH
Gas TypeMarcellusFayettevilleNew AlbanyHaynesvilleConventional GasMarcellusFayettevilleNew AlbanyHaynesvilleConventional Gas
%HHV38.838.838.738.740.355.455.156.857.155.6
Product portfolio
 %Power57.957.456.156.657.54.50.82.32.56.1
 %MeOH0.00.00.00.00.095.599.297.797.593.9
 %DME42.142.643.943.442.50.00.00.00.00.0
 %Olefins0.00.00.00.00.00.00.00.00.00.0

3.1. Different Feed Compositions

The thermal efficiency results of various scenarios are shown in Table 8 for each type of shale gas and conventional pipeline gas using NiO-CLC as the power generation configuration. In addition, the breakdowns of products are shown in this table based on their energy content. In order to have the highest possible efficiency, most of the output must be MeOH for all types of shale gases. However, if the objective is to maximize the DME production instead, the efficiency of the plant decreases by 2–4 percentage points. Furthermore, by maximizing the olefins production ratio, the thermal efficiency of the plant drops to around 22% (HHV). The difference between “maximum DME” and “maximum power” scenarios is that in the latter scenario, all of the unreacted gases (stream 2–4 in Figure 3) are sent to the power island. But in the “maximum DME” option, it was preferred to recycle the unreacted gases to the MeOH reactor.

4. Conclusions

In this work, a process (with many variants) to co-produce some combination of olefins, electricity, DME, and methanol using conventional natural gas or shale gas as the feedstock with little-to-zero direct CO2 emissions was presented. Five different gas compositions, four different power generation options, and a variety of product portfolios were considered. Each process (including upstream and downstream sections for the shale gas cases) is self-sufficient, needing no external import of energy or utilities except for the primary feedstock, air, and water. In addition, 90%–100% of the CO2 produced can be captured from both sections of each process (where applicable) using different techniques depending on the advanced power generation technique. Because no utilities are imported, the direct and indirect emissions associated with each process are very small, except for the recovery and transport of the natural gas itself.
The simulation results showed that the CLC technology with nickel oxide was not only the most efficient choice compared to the other power generation options, but it had essentially zero CO2 emissions as well. The results also showed that the composition of the feed gas had small but measurable effects on the product portfolio, meaning that some types of gas might be more profitable to use than others, but all of those considered were still suitable. It should be noted that selection of the best configuration depends on market prices, the capital cost and the operating cost of the plant, which can be realized only after a comprehensive study on the economic performance of each option. Therefore, in part II of this work, the techno-economic optimization of the plant is presented to determine the profitability of each process variant under various market conditions.

Supplementary Materials

Supplementary materials can be accessed at: https://www.mdpi.com/1996-1073/8/5/3739/s1.

Acknowledgments

We gratefully acknowledge financial support by the Ontario Research Fund: Research Excellence and Ontario Graduate Scholarship programs on this project.

Author Contributions

YKS performed research and wrote the manuscript, and TAAII supervised research, gave the technical advice and edited the manuscript.

Nomenclature

Abbreviations

ASU
Air separation unit
CLC
Chemical looping combustion
DGA
Diglycolamine
DME
Dimethyl ether
HHV
Higher heating value
HRSG
Heat recovery steam generator
LHV
Lower heating value
MDEA
Methyl diethanolamine

Notations

Ci
Concentration of component i, kmol/m3
Keq,i
Equilibrium constant of reaction I
ki
Rate constant of reaction I
Ki
Adsoption constant I
pi
Partial pressure of component i, bar
ri
Rate of reaction i, kmol/kgcat.sec
R
Gas constant, 8.314 kj/kmol.K
T
Temperature, K

Conflicts of Interest

The authors declare no conflict of interest.

References

  1. Bok, J.-K.; Lee, H.; Park, S. Robust investment model for long-range capacity expansion of chemical processing networks under uncertain demand forecast scenarios. Comput. Chem. Eng. 1998, 22, 1037–1049. [Google Scholar] [CrossRef]
  2. Adams, T.A., II. Challenges and opportunities in the design of new energy conversion systems. Comput. Aided Chem. Eng. 2014, 34, 5–14. [Google Scholar]
  3. Ren, T.; Patel, M.K.; Blok, K. Steam cracking and methane to olefins: Energy use, CO2 emissions and production costs. Energy 2008, 33, 817–833. [Google Scholar]
  4. Benchaita, T. Greenhouse Gas Emissions from New Petrochemical Plants; Technical Note No. IDB-TN-562; Inter-American Development Bank: Washington, DC, USA, 2013. [Google Scholar]
  5. Gao, L.; Li, H.; Chen, B.; Jin, H.; Lin, R.; Hong, H. Proposal of a natural gas-based polygeneration system for power and methanol production. Energy 2008, 33, 206–212. [Google Scholar] [CrossRef]
  6. Zhang, X.; Gundersen, T.; Roussanaly, S.; Brunsvold, A.L.; Zhang, S. Carbon chain analysis on a coal IGCC—CCS system with flexible multi-products. Fuel Process. Technol. 2012, 108, 146–153. [Google Scholar] [CrossRef]
  7. Floudas, C.A.; Elia, J.A.; Baliban, R.C. Hybrid and single feedstock energy processes for liquid transportation fuels: A critical review. Comput. Chem. Eng. 2012, 41, 24–51. [Google Scholar] [CrossRef]
  8. Adams, T.A., II; Barton, P.I. Combining coal gasification and natural gas reforming for efficient polygeneration. Fuel Process. Technol. 2011, 92, 639–655. [Google Scholar] [CrossRef]
  9. Adams, T.A., II; Barton, P.I. Combining coal gasification, natural gas reforming, and solid oxide fuel cells for efficient polygeneration with CO2 capture and sequestration. Fuel Process. Technol. 2011, 92, 2105–2115. [Google Scholar] [CrossRef]
  10. Cormos, C.-C. Assessment of flexible energy vectors poly-generation based on coal and biomass/solid wastes co-gasification with carbon capture. Int. J. Hydrog. Energy 2013, 38, 7855–7866. [Google Scholar] [CrossRef]
  11. Man, Y.; Yang, S.; Zhang, J.; Qian, Y. Conceptual design of coke-oven gas assisted coal to olefins process for high energy efficiency and low CO2 emission. Appl. Energ. 2014, 133, 197–205. [Google Scholar] [CrossRef]
  12. Hussain, D.; Dzombak, D.A.; Jaramillo, P.; Lowry, G.V. Comparative lifecycle inventory (LCI) of greenhouse gas (GHG) emissions of enhanced oil recovery (EOR) methods using different CO2 sources. Int. J. Greenh. Gas Control 2013, 16, 129–144. [Google Scholar] [CrossRef]
  13. Ju, F.; Chen, H.; Ding, X.; Yang, H.; Wang, X.; Zhang, S.; Dai, Z. Process simulation of single-step dimethyl ether production via biomass gasification. Biotechnol. Adv. 2009, 27, 599–605. [Google Scholar] [CrossRef] [PubMed]
  14. Semelsberger, T.A.; Borup, R.L. Thermodynamic equilibrium calculations of hydrogen production from the combined processes of dimethyl ether steam reforming and partial oxidation. J. Power Sources 2006, 155, 340–352. [Google Scholar] [CrossRef]
  15. Semelsberger, T.A.; Borup, R.L.; Greene, H.L. Dimethyl ether (DME) as an alternative fuel. J. Power Sources 2006, 156, 497–511. [Google Scholar] [CrossRef]
  16. Pyl, S.P.; Schietekat, C.M.; Reyniers, M.-F.; Abhari, R.; Marin, G.B.; van Geem, K.M. Biomass to olefins: Cracking of renewable naphtha. Chem. Eng. J. 2011, 176–177, 178–187. [Google Scholar] [CrossRef]
  17. Rezaei, P.S.; Shafaghat, H.; Daud, W.M.A.W. Production of green aromatics and olefins by catalytic cracking of oxygenate compounds derived from biomass pyrolysis: A review. Appl. Catal. A 2014, 469, 490–511. [Google Scholar] [CrossRef]
  18. Kaminsky, W.; Schlesselmann, B.; Simon, C. Olefins from polyolefins and mixed plastics by pyrolysis. J. Anal. Appl. Pyrolysis 1995, 32, 19–27. [Google Scholar] [CrossRef]
  19. Chen, C.C.; Mathias, P.M. Applied thermodynamics for process modeling. AlChE J. 2002, 48, 194–200. [Google Scholar] [CrossRef]
  20. Bullin, K.; Krouskop, P. Composition Variety Complicates Processing Plans for U.S. Shale Gas; Bryan Research and Engineering Inc.: Bryan, TX, USA, 2009. [Google Scholar]
  21. Haslbeck, J.L.; Kuehn, N.J.; Lewis, E.G.; Pinkerton, L.L.; Simpson, J.; Turner, M.J.; Varghese, E.; Woods, M.C. Cost and Performance Baseline for Fossil Energy Plants Volume 1: Bituminous Coal and Natural Gas to Electricity; DOE, U.S. Department of Energy: Pittsburgh, PA, USA, 2010. [Google Scholar]
  22. Adams, T.A., II; Barton, P.I. High-efficiency power production from natural gas with carbon capture. J. Power Sources 2010, 195, 1971–1983. [Google Scholar]
  23. Vanden bussche, K.M.; Froment, G.F. A steady-state kinetic model for methanol synthesis and the water gas shift reaction on a commercial Cu/ZnO/Al2O3 catalyst. J. Catal. 1996, 161, 1–10. [Google Scholar]
  24. Bercic, G.; Levec, J. Catalytic dehydration of methanol to dimethyl ether. Kinetic investigation and reactor simulation. Ind. Eng. Chem. Res. 1993, 32, 2478–2484. [Google Scholar] [CrossRef]
  25. Methanol Industrial Grade. Available online: http://www.alibaba.com/product-detail/2012-Methanol-99-5-_551002733.html (accessed on 1 June 2014).
  26. DiMethyl Ether. Available online: http://www.alibaba.com/product-detail/DiMethyl-Ether_1659793013.html (accessed on 1 June 2014).
  27. Khojasteh Salkuyeh, Y.; Adams, T.A., II. A new power, methanol, and DME polygeneration process using integrated chemical looping systems. Energy Convers. Manage. 2014, 88, 411–425. [Google Scholar]
  28. Taheri Najafabadi, A.; Fatemi, S.; Sohrabi, M.; Salmasi, M. Kinetic modeling and optimization of the operating condition of MTO process on SAPO-34 catalyst. J. Ind. Eng. Chem. 2012, 18, 29–37. [Google Scholar]
  29. Lee, Y.-J.; Baek, S.-C.; Jun, K.-W. Methanol conversion on SAPO-34 catalysts prepared by mixed template method. Appl. Catal., A 2007, 329, 130–136. [Google Scholar] [CrossRef]
  30. Chen, J.Q.; Bozzano, A.; Glover, B.; Fuglerud, T.; Kvisle, S. Recent advancements in ethylene and propylene production using the UOP/Hydro MTO process. Catal. Today 2005, 106, 103–107. [Google Scholar] [CrossRef]
  31. Wilson, S.; Barger, P. The characteristics of SAPO-34 which influence the conversion of methanol to light olefins. Microporous Mesoporous Mater. 1999, 29, 117–126. [Google Scholar] [CrossRef]
  32. Bell, D.A.; Towler, B.F.; Fan, M. Coal Gasification and Its Applications; William Andrew Publishing: Boston, MA, USA, 2011. [Google Scholar]
  33. GPSA. Engineering Data Book, 11th ed.; Gas Processors Suppliers Association: Tulsa, OK, USA, 1998. [Google Scholar]
  34. Ethylene, Polymer Purity. Available online: https://www.mathesongas.com/pdfs/products/Ethylene-Pure-Gas.pdf (accessed on 1 June 2014).
  35. Propylene, Polymer Grade. Available online: http://www.dow.com/productsafety/finder/pro.htm (accessed on 1 June 2014).
  36. Keil, F.J. Methanol-to-hydrocarbons: process technology. Microporous Mesoporous Mater. 1999, 29, 49–66. [Google Scholar] [CrossRef]
  37. Bahadori, A.; Mokhatab, S. Estimating design parameters in propane refrigerant systems. Pumps Systems 2007, 68–71. [Google Scholar]
  38. Mafi, M.; Amidpour, M.; Naeynian, S.M.M. Development in mixed refrigerant cycles used in olefin plants. In Proceedings of the 1st Annual Gas Processing Symposium; Elsevier: Amsterdam, The Netherland, 2009; pp. 154–161. [Google Scholar]
  39. Abu-Zahra, M.R.M.; Niederer, J.P.M.; Feron, P.H.M.; Versteeg, G.F. CO2 capture from power plants: Part II. A parametric study of the economical performance based on mono-ethanolamine. Int. J. Greenh. Gas Control 2007, 1, 135–142. [Google Scholar] [CrossRef]
  40. Moghtaderi, B. Review of the recent chemical looping process developments for novel energy and fuel applications. Energy Fuels 2011, 26, 15–40. [Google Scholar] [CrossRef]
  41. Tan, Y.; Douglas, M.A.; Thambimuthu, K.V. CO2 capture using oxygen enhanced combustion strategies for natural gas power plants. Fuel 2002, 81, 1007–1016. [Google Scholar] [CrossRef]
  42. Jin, H.; Ishida, M. A novel gas turbine cycle with hydrogen-fueled chemical-looping combustion. Int. J. Hydrogen Energy 2000, 25, 1209–1215. [Google Scholar] [CrossRef]
  43. Ishida, M.; Yamamoto, M.; Ohba, T. Experimental results of chemical-looping combustion with NiO/NiAl2O4 particle circulation at 1200 °C. Energy Convers. Manag. 2002, 43, 1469–1478. [Google Scholar] [CrossRef]
  44. Wilcock, R.C.; Young, J.B.; Horlock, J.H. The Effect of Turbine Blade Cooling on the Cycle Efficiency of Gas Turbine Power Cycles. J Eng. Gas Turb. Power. 2005, 127, 109–120. [Google Scholar] [CrossRef]
  45. Young, J.B.; Wilcock, R.C. Modeling the Air-Cooled Gas Turbine: Part 2—Coolant Flows and Losses. J. Turbomach. 2002, 124, 214–221. [Google Scholar] [CrossRef]
  46. Zhang, J.; Ma, L.; Li, Z.; Ni, W. Modeling an Air-Cooled Gas Turbine of the Integrated Gasification Combined Cycle in Aspen plus. In International Conference on Future Electrical Power and Energy Systems (ICFEPES); Elsevier Ltd.: Sanya, China, 2012; Volume 9, pp. 425–430. [Google Scholar]
  47. Abu-Zahra, M.R.M.; Schneiders, L.H.J.; Niederer, J.P.M.; Feron, P.H.M.; Versteeg, G.F. CO2 capture from power plants: Part I. A parametric study of the technical performance based on monoethanolamine. Int. J. Greenh. Gas Control 2007, 1, 37–46. [Google Scholar] [CrossRef]
  48. Mackenzie, D.H.; Prambil, F.C.; Daniels, C.A.; Bullin, J.A. Design & operation of a selective sweetening plant using MDEA. Energy Progress 1987, 7, 31–36. [Google Scholar]
  49. Hu, Y. CO2 capture from Oxy-Fuel Combustion Power Plants. Ph.D. Thesis, KTH Royal Institute of Technology: Stockholm, Sweden, 2011. [Google Scholar]
  50. Smith, A.R.; Klosek, J. A review of air separation technologies and their integration with energy conversion processes. Fuel Process. Technol. 2001, 70, 115–134. [Google Scholar] [CrossRef]
  51. Fan, L.S. Chemical Looping Systems For Fossil Energy Conversions; John Wiley & Sons, Inc.: Hoboken, NJ, USA, 2010. [Google Scholar]
  52. Kolbitsch, P.; Bolhàr-Nordenkampf, J.; Pröll, T.; Hofbauer, H. Operating experience with chemical looping combustion in a 120 kW dual circulating fluidized bed (DCFB) unit. Int. J. Greenh. Gas Control 2010, 4, 180–185. [Google Scholar] [CrossRef]
  53. Kolbitsch, P.; Pröll, T.; Bolhar-Nordenkampf, J.; Hofbauer, H. Design of a Chemical Looping Combustor using a Dual Circulating Fluidized Bed (DCFB) Reactor System. Chem. Eng. Technol. 2009, 32, 398–403. [Google Scholar] [CrossRef]
  54. Wolf, J.; Anheden, M.; Yan, J. Comparison of nickel- and iron-based oxygen carriers in chemical looping combustion for CO2 capture in power generation. Fuel 2005, 84, 993–1006. [Google Scholar] [CrossRef]
  55. Naskar, S.; Jana, K.; De, S. Comparative performance study of CO2 capture with Monoethyl and Diethyl Amines using Aspen Plus. Int. J. Emerging Technol. Adv. Eng. 2013, 3, 490–497. [Google Scholar]
  56. Pellegrini, G.; Strube, R.; Manfrida, G. Comparative study of chemical absorbents in postcombustion CO2 capture. Energy 2010, 35, 851–857. [Google Scholar] [CrossRef]
  57. Polasek, J.; Bullin, J. Selecting amines for sweetening units. Energy Prog. 1984, 4, 146–149. [Google Scholar]
  58. Manning, F.S.; Thompson, R.E. Oilfield Processing of Petroleum Volume 1: Natural Gas; Pennwell Books: Tulsa, OK, USA, 1991. [Google Scholar]
  59. Toftegaard, M.B.; Brix, J.; Jensen, P.A.; Glarborg, P.; Jensen, A.D. Oxy-fuel combustion of solid fuels. Prog. Energy Combust. Sci. 2010, 36, 581–625. [Google Scholar] [CrossRef]
  60. Tigges, K.; Klauke, F.; Bergins, C.; Busekrus, K.; Niesbach, J.; Ehmann, M.; Vollmer, B.; Buddenberg, T.; Wu, S.; Kukoski, A. Oxyfuel combustion retrofits for existing power stations. In Proceedings of the 33rd International Technical Conference on Coal Utilization & Fuel Systems, Clearwater, FL, USA, 1–5 June 2008; Sahkestad, B.A., Ed.; Coal Technologies Associates: Red Hook, NY, USA.
  61. Hong, J.; Chaudhry, G.; Brisson, J.G.; Field, R.; Gazzino, M.; Ghoniem, A.F. Analysis of oxy-fuel combustion power cycle utilizing a pressurized coal combustor. Energy 2009, 34, 1332–1340. [Google Scholar] [CrossRef]
  62. Cho, P.; Mattisson, T.; Lyngfelt, A. Comparison of iron-, nickel-, copper- and manganese-based oxygen carriers for chemical-looping combustion. Fuel 2004, 83, 1215–1225. [Google Scholar] [CrossRef]
  63. Adanez, J.; Abad, A.; Garcia-Labiano, F.; Gayan, P.; de Diego, L.F. Progress in Chemical-Looping Combustion and Reforming technologies. Prog. Energy Combust. Sci. 2012, 38, 215–282. [Google Scholar] [CrossRef] [Green Version]
  64. Corbella, B.M.; Palacios, J.M. Titania-supported iron oxide as oxygen carrier for chemical-looping combustion of methane. Fuel 2007, 86, 113–122. [Google Scholar] [CrossRef]
  65. Lyngfelt, A. Oxygen Carriers for Chemical Looping Combustion - 4000 h of Operational Experience. Oil Gas Sci. Technol. – Rev. IFP Energies nouvelles 2011, 66, 161–172. [Google Scholar] [CrossRef]
  66. Linderholm, C.; Abad, A.; Mattisson, T.; Lyngfelt, A. 160 h of chemical-looping combustion in a 10 kW reactor system with a NiO-based oxygen carrier. Int. J. Greenh. Gas Control 2008, 2, 520–530. [Google Scholar] [CrossRef]
  67. Gayán, P.; Pans, M.A.; Ortiz, M.; Abad, A.; de Diego, L.F.; García-Labiano, F.; Adánez, J. Testing of a highly reactive impregnated Fe2O3/Al2O3 oxygen carrier for a SR–CLC system in a continuous CLC unit. Fuel Process. Technol. 2012, 96, 37–47. [Google Scholar] [CrossRef] [Green Version]

