Stand Structure and Abiotic Factors Modulate Karst Forest Biomass in Southwest China


1
Hunan Agricultural Biotechnology Research Institute, Changsha 410125, China
2
Laboratory of Agro-Ecological Processes in Subtropical Region, Institute of Subtropical Agriculture, Chinese Academy of Sciences, Changsha 410125, China
3
Huanjiang Observation and Research Station for Karst Ecosystems, Institute of Subtropical Agriculture, Chinese Academy of Sciences, Huanjiang 547100, China
*
Author to whom correspondence should be addressed.
Forests 2020, 11(4), 443; https://doi.org/10.3390/f11040443
Submission received: 4 March 2020
/
Revised: 7 April 2020
/
Accepted: 11 April 2020
/
Published: 15 April 2020
(This article belongs to the Section Forest Ecology and Management)
Abstract
:Understanding the driving factors of forest biomass are critical for further understanding the forest carbon cycle and carbon storage management in karst forests. This study aimed to investigate the distribution of forest aboveground biomass (AGB) and the effects of stand structural and abiotic factors on AGB in karst forests in Southwest China. We established a 25 ha plot and sampled all trees (≥1 cm diameter) in a subtropical mixed evergreen–deciduous broadleaf forest. We mapped the forest biomass distribution and applied a variation of partitioning analysis to examine the topographic, stand structural, and spatial factors. Furthermore, we used structural equation models (SEM) to test how these variables directly and/or indirectly affect AGB. The average AGB of the 25 ha plot was 73.92 Mg/ha, but that varied from 3.22 to 198.11 Mg/ha in the 20 m × 20 m quadrats. Topographic, stand structural, and spatial factors together explained 67.7% of the variation in AGB distribution. The structural variables (including tree density and the diameter at breast height (DBH) diversity) and topographic factors (including elevation, VDCN (vertical distance to channel network), convexity, and slope) were the most crucial driving factors of AGB in the karst forests. Structural equation models indicated that elevation, tree density, and DBH diversity directly affected AGB, and elevation also indirectly affected AGB through tree density and DBH diversity. Meanwhile, AGB was indirectly influenced by VDCN, convexity, and slope. The evaluation of stand structural and abiotic drivers of AGB provides better insights into the mechanisms that play a role in carbon storage in karst forests, which may assist in improving forest carbon management.
1. Introduction
Forests account for 30% of the earth’s total land area, and contribute to 75% of the terrestrial gross primary production and 80% of the total global plant biomass [1,2]. Previous studies have shown that forests play important roles in the carbon cycle and reducing the greenhouse effect by sequestering carbon dioxide [3,4,5]. Southwest China has the second largest forest region in China [6]. This region also contains the largest karst forest region in China, with an extremely fragile geological background, small environmental carrying capacity, and low tolerance to disturbance [7]. During the past century, a large part of the karst region in southwest China was severely degraded following the destruction of natural vegetation due to human disturbance. Thankfully, most of the degraded land has been undergoing ecological restoration, either through natural regeneration or afforestation, attributed to the implementation of ecological restoration projects (e.g., the “Grain for Green” project, the Karst Rocky Desertification Restoration Project) over the past two decades [8,9]. Therefore, a detailed study on karst forest biomass is important for improving the accuracy of estimating Chinese vegetation carbon storages and sequestration potential.
Southwest China contains one of the largest karst regions in the world [8]. Previous studies have assessed the biomass in this region on small and large scales. For example, the largest biomass increase in the world occurred in the South China karst region between 1999 and 2012 [10]. Other studies reported the biomass in typical karst ecosystems, or along vegetation restoration areas based on surveys of small plots [2,6,11,12,13,14]. However, no biomass investigations have been conducted on a local scale in the karst region, especially in forests. Mapping forest biomass patterns with accurate spatial information for each recorded individual tree can specifically describe biomass variance along a topographic gradient and reveal the fine-scale relationships of potential factors affecting the distribution [15]. This is beneficial for improving the accuracy of the forest ecosystem carbon cycle model.
Forest biomass is a complex property affected by site conditions, forest structure, and ecological processes [1,16,17]. Abiotic factors, such as topography and edaphic conditions, greatly influence the forest biomass because they determine resource availability for plant growth and survival [18]. Topography, as a key factor, maintains the heterogeneity of forest landscapes. Topographic features (e.g., slope, curvature, and terrain relief) greatly influence local scale variation in soil chemistry, hydrology, and microclimate [19]. Not only abiotic factors, but also biotic factors can determine forest biomass. For instance, forest structural attributes (e.g., tree size variance and stem density) play a vital role in regulating the distribution of forest biomass [20]. Stand structural complexity can enhance aboveground biomass directly in tropical forests, and may be a result of the high efficient utilization of light, water, and soil nutrient resources under the action of niche differentiation and facilitation [21]. Additionally, higher stem density may increase tree biomass via greater canopy packing which leads to more light capture [22]. Similarly, tree size variation is linked to biomass in natural forests through better spatial distribution of different tree crowns, and thus, there is more efficient utilization of light [23,24]. However, the influence of abiotic and biotic factors on karst forest biomass has not been well examined.
The objectives of this study were: (1) To estimate the aboveground biomass (AGB) and map the spatial pattern of AGB in the Mulun 25 ha plot; (2) to quantify the contributions of topographic, stand structural, and spatial factors on biomass spatial distribution and select the main driving factors; and (3) to evaluate the direct and indirect effects of the main driving factors on AGB in the karst forest.
2. Materials and Methods
2.1. Study Site
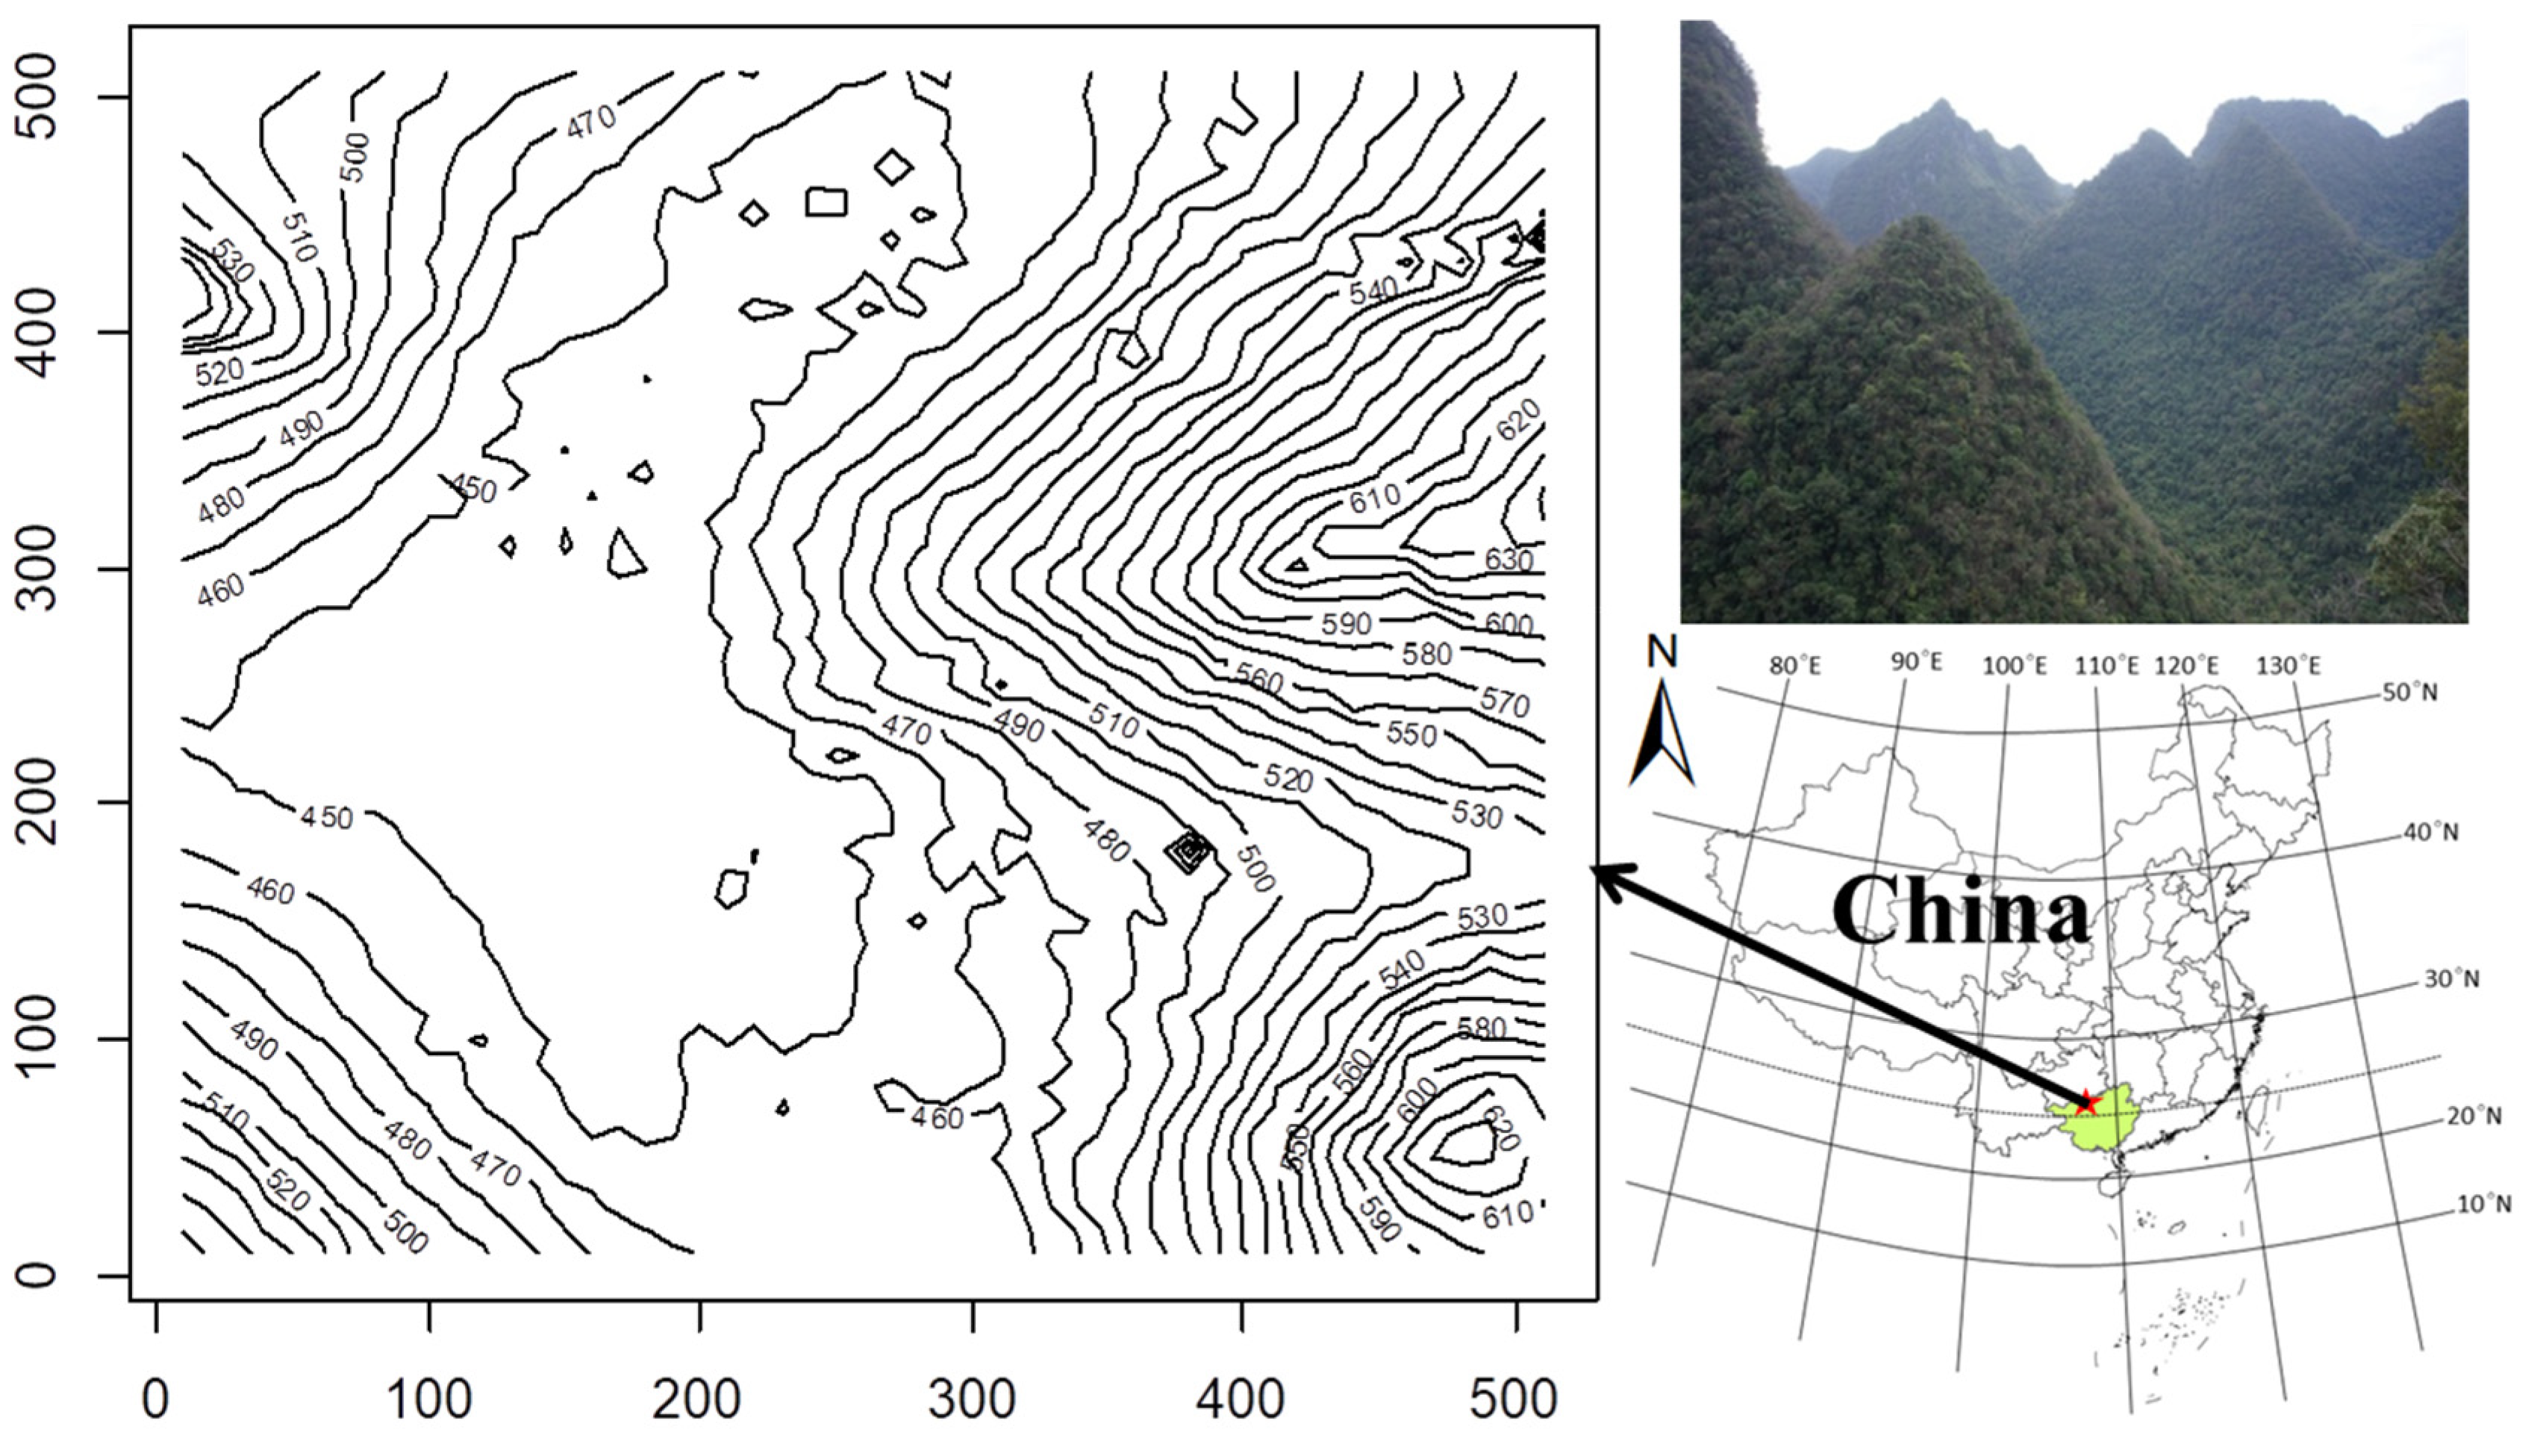
Mulun National Natural Reserve (MNNR) and the adjacent Maolan National Natural Reserve in the Guangxi and Guizhou provinces, respectively, preserve the last undisturbed remnants of karst forests in Southwest China, and possibly in the world [7]. Our study was conducted at MNNR (107°54′01″–108°05′51″ E, 25°07′01″–25°12′22″ N), in the Huanjiang County, northwestern Guangxi Province, China. MNNR was set up in 1991 to protect the subtropical mixed evergreen–deciduous broadleaf forest ecosystem that developed on a limestone substrate. The topography in this reserve is characterized by steep hills separated by lowland depressions with numerous potholes and caves, and extensive underground streams [7]. The average annual temperature is 19.4 °C and the average annual precipitation is 1500 mm in this area [7].
In 2014, a 25 ha (500 m × 500 m) Mulun forest dynamic plot (25°8′ N, 108°0′ E) was established in MNNR as part of Chinese Forest Biodiversity Monitoring Network (CForBio, http://www.cfbiodiv.org/), following the standard field protocol of the Center for Tropic Forest Sciences (CTFS, http://www.ctfs.si.edu, accessed on 18 June 2013). The plot is characterized by rugged terrain (Figure 1); the altitude varies from 442.6 m to 651.4 m and the slope ranges from 0.12° to 66.97° (average of 31.4°). The average rock exposure ratio is greater than 60%. All woody stems with a diameter at breast height (DBH) ≥ 1 cm in this plot were identified, tagged, measured, and georeferenced [7]. Important species included Cryptocarya microcarpa, Itoa orientalis, Platycarya longipes, Lindera communis, and Clausena dunniana.
2.2. Predictor Variables
The Mulun plot was divided into a grid composed of 625 20 m × 20 m quadrats. For each quadrat, seven topographic variables were recorded: elevation, convexity, slope, aspect, rock outcrop ratio (ROR), topographic wetness index (TWI), and vertical distance to channel network (VDCN). The first four topographic factors were computed following the method in Du et al. [7]. ROR is a ratio of the rock coverage area. TWI was calculated as the ratio of the area upslope from any given point on the landscape to the local slope at that point. VDCN was calculated as the vertical distance from the channel network. TWI and VDCN are commonly used to quantify topographical control on hydrological processes [25,26].
For each of the 625 quadrats, we calculated the density of trees. Shannon’s index was used to quantify tree DBH diversity (Equation (1)) [21]. For tree DBH diversity, the discrete classes of 1–5, 5–10, 10–15, 15–20, 20–25, 25–30, 30–35, 35–40, 40–45, 45–50, and ≥50 cm were evaluated.
where Hd is Shannon’s diversity of DBH, and pi is the relative basal area of the ith tree DBH classes in the given plot.
We selected tree density and DBH diversity as the stand structure variables to examine the relationships with AGB.
2.3. Statistical Analysis
For the estimation of AGB of the Mulun plot, we used a mixed allometric equation based on DBH (cm) to calculate the AGB of the trees following Wang et al. [27]. The relative contribution of structure variables and topography in the spatial pattern of AGB were determined by variance partitioning based on multiple regressions [28]. The principal coordinate neighbor matrix (PCNM) eigenfunctions on a 20 m × 20 m scale were computed by performing a principal coordinate analysis based on a truncated Euclidean distance matrix [29]. The negative eigenvalues were filtered, and the positive values were used as predictors. Forward selection was applied to select the significant (p < 0.05 after 999 simulations) structure variables, topographic, and PCNMs. The adjusted R2 was used to explain pure effects and joint effects for each group of factors [15].
In order to assess the complex relationships among the variables, structural equation modeling (SEM) was used to explicitly test the direct and indirect effects of a combination of factors on the AGB including all significant variables from the PCNM analysis. Here, we designed a hypothetical model in which the topographic factors and structural variables could directly influence the AGB. The topographic factors could also directly influence tree density and DBH diversity. These correlations are supported by previous studies [21,30]. We selected the best SEMs based on the fit indices, including a nonsignificant Chi-square (χ2) test statistic (p > 0.05), S SRMR < 0.08, and both GFI and CHI > 0.95 > through removing the nonsignificant variables with the lowest Akaike information criterion (AIC) [21,31].
All statistical analyses were performed in R 3.5.1. The predicted map of AGB was depicted using ordinary kriging in the geoR package [32]. The PCNM analysis was conducted using the PCNM package [33]. Variation partitioning analysis was computed using the ‘varpart’ function in the vegan package [34]. The SEM analysis was performed using the lavaan’ package [35].
3. Results
According to the first census, the plot had 110,203 individuals belonging to 61 families, 147 genera, and 227 species. The average DBH of trees was 4.48 cm. The mean stem density was 4408 individuals per ha and the mean basal area was 17.00 m2/ha. The average forest AGB was 73.92 ± 23.51 Mg/ha (± standard deviation) in the 20 m × 20 m quadrats of the Mulun plot, although AGB ranged widely from 3.22 to 198.11 Mg/ha. AGB among different diameter ranges was submitted to a normal distribution (Shapiro–Wilk test; p = 0.0526), and the biomass of trees in the 5–10 cm DBH range was higher than in the other diameter classes (Figure 2). Trees from 1 to 5 cm DBH accounted for only 14.89% of the biomass, although they accounted for 72.22% of the stems.
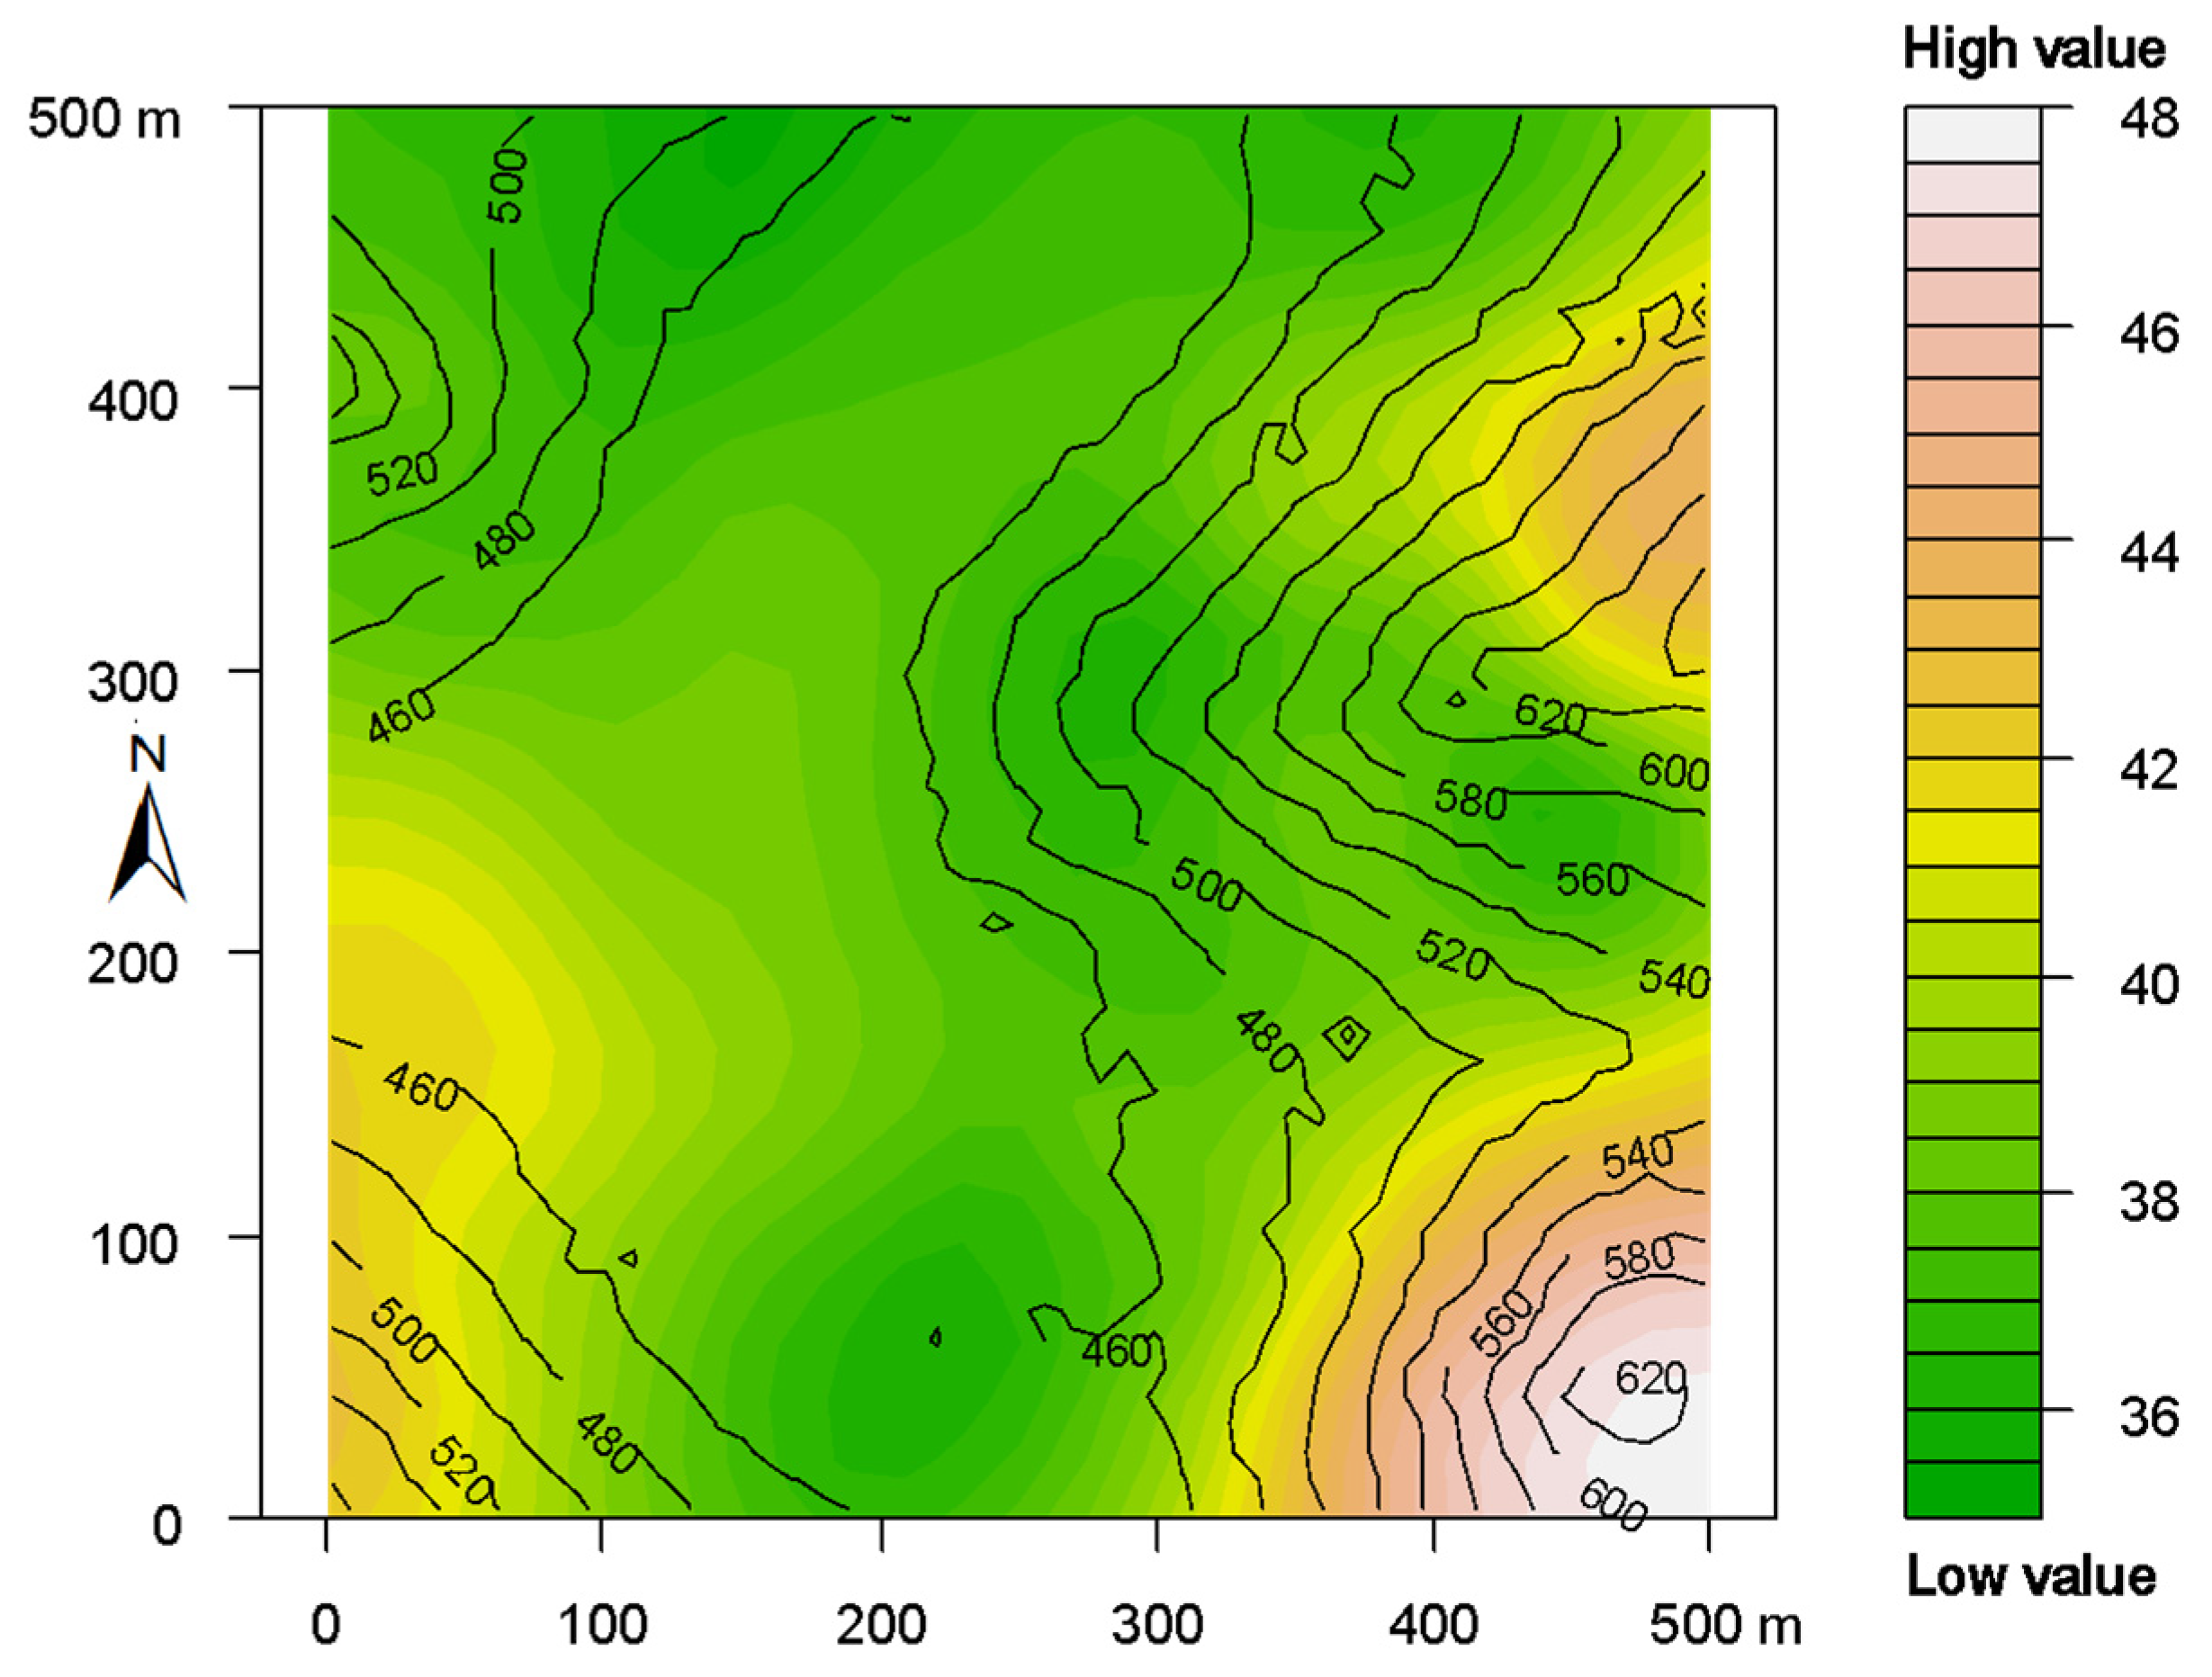
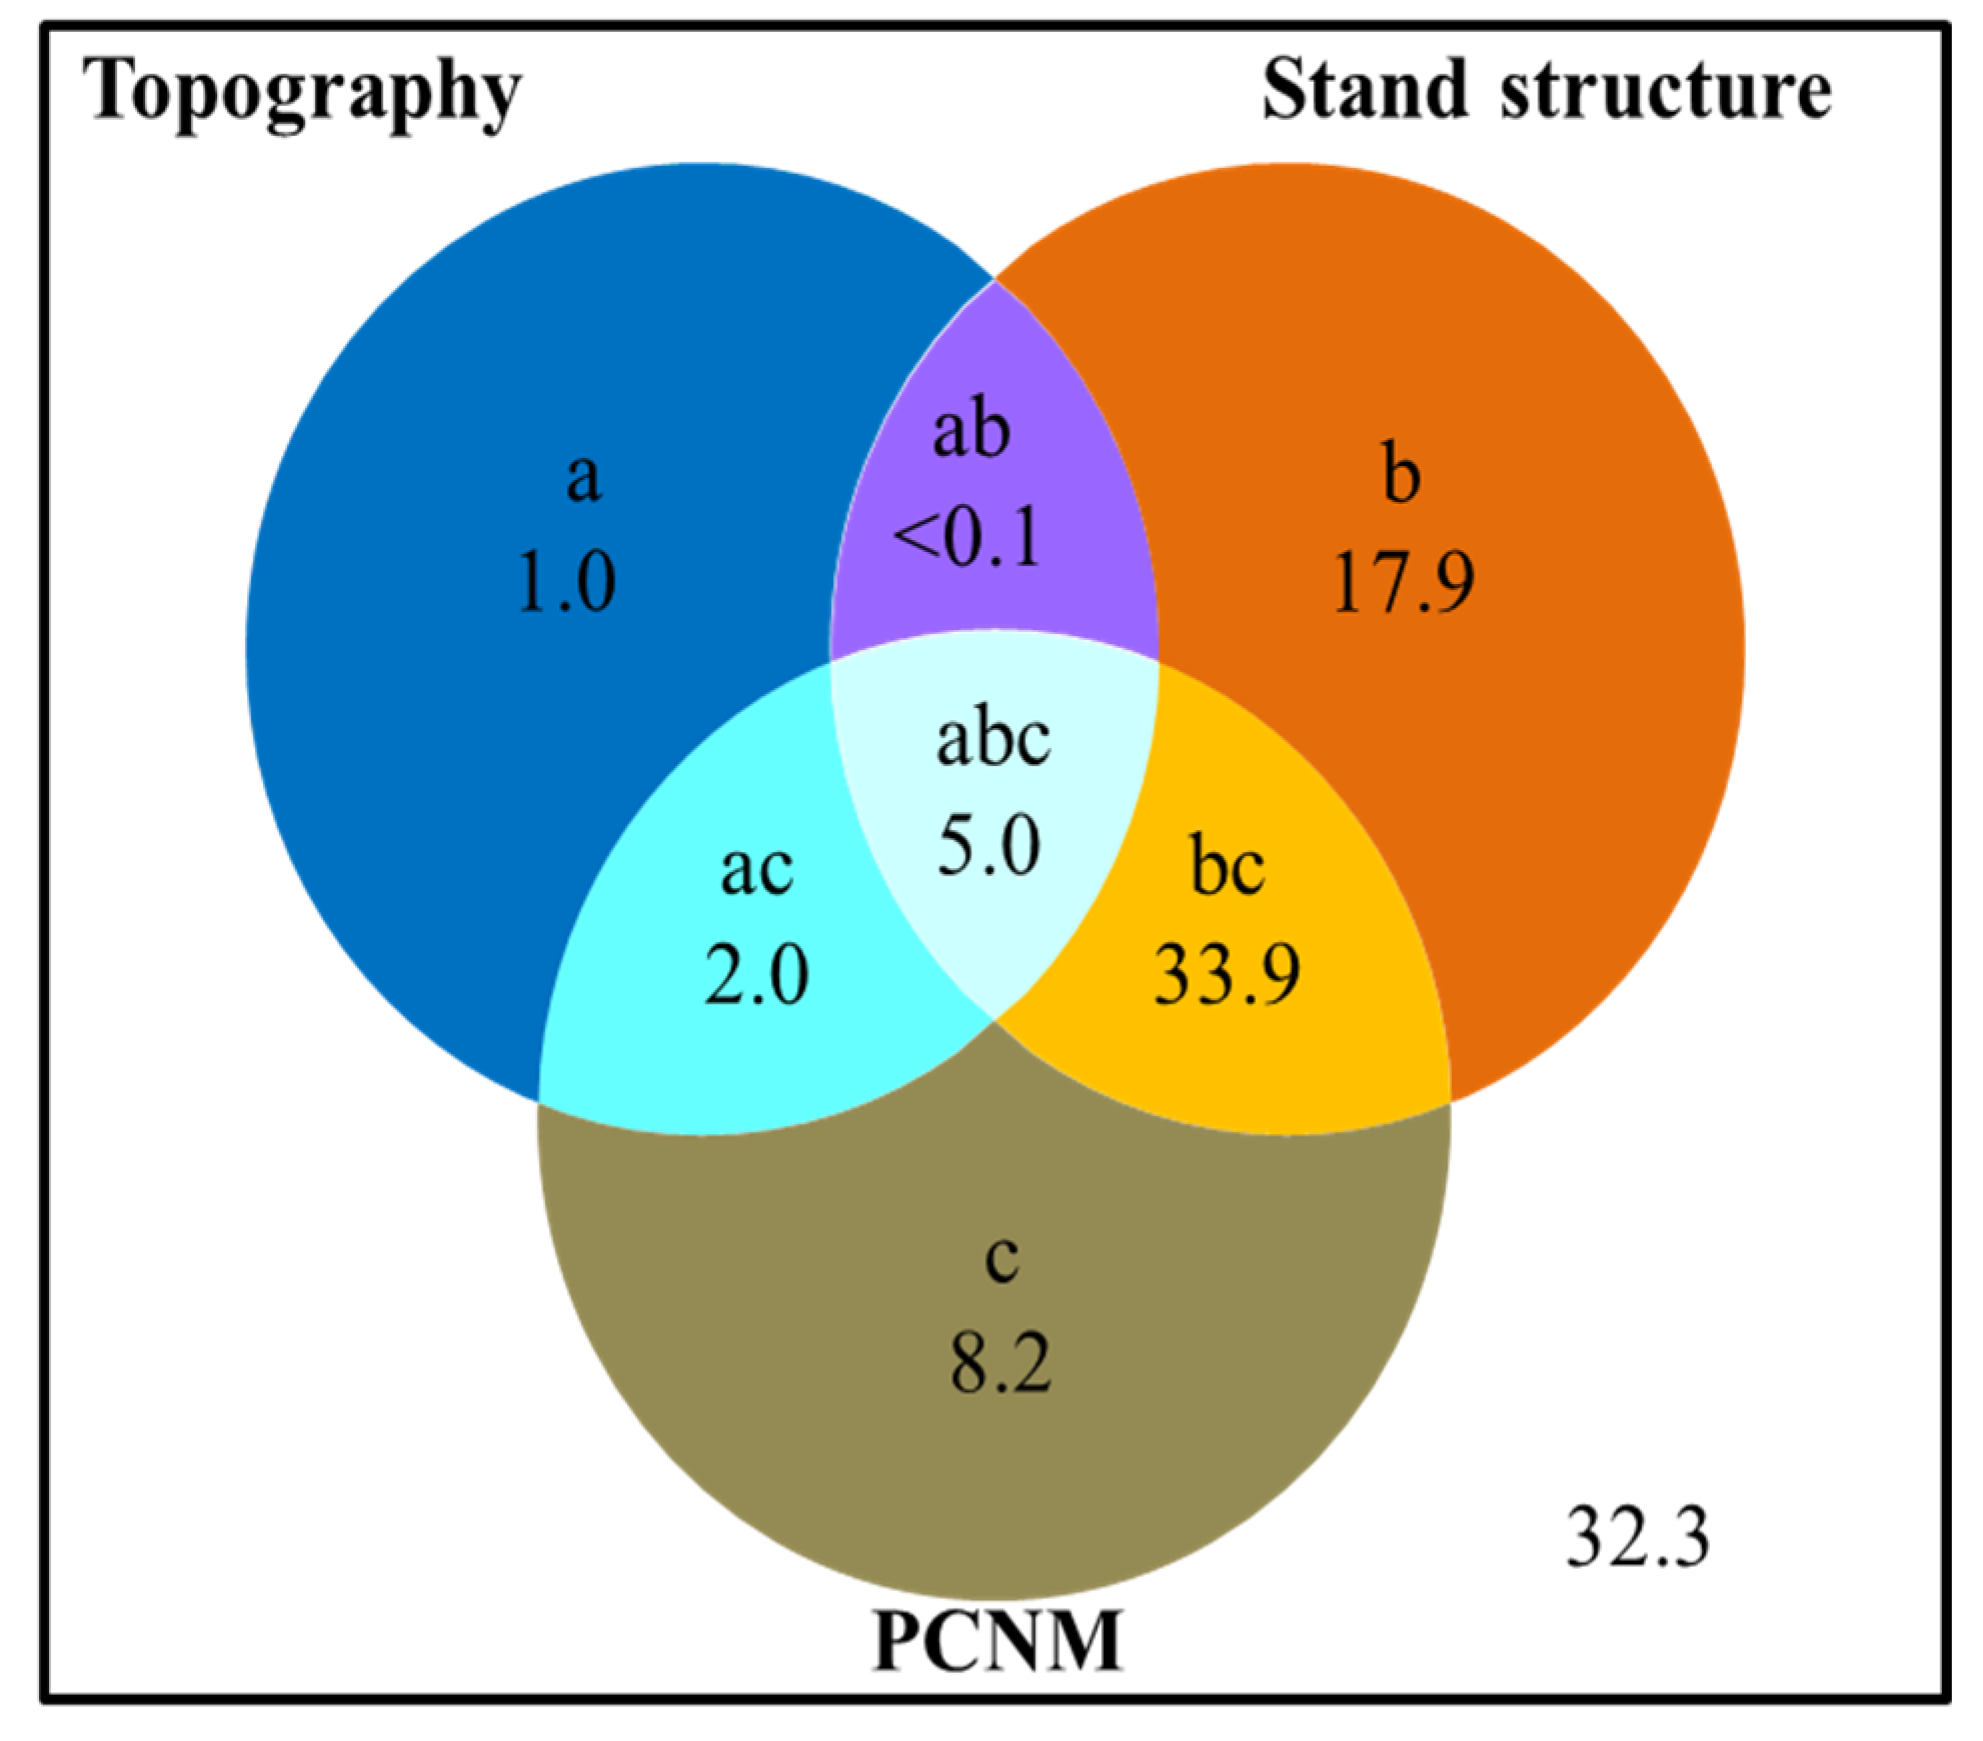
The forest AGB showed obvious spatial heterogeneity in the Mulun plot (Figure 3) where the topography, and especially the elevation, played a vital role in regulating the spatial pattern of AGB. The mountain peak almost had a higher biomass than the low-lying areas. Variance partitioning of AGB showed that 67.7% of the variation was explained by stand structural, topographic, and spatial factors together. Specifically, stand structural complexity explained 56.8% (b+ab+bc+abc) of the variation, topographic variables explained 8.0% (a+ab+ac+abc) of the variation, and spatial variables (70 PCNMs) explained 49.1% (c+ac+bc+abc) of the variation (Figure 4). Among seven topographic variables, elevation and VDCN were significant (p < 0.01), but only explained 5.4% and 1.1% of the AGB spatial variance, respectively. Tree density and DBH diversity were significant (p < 0.001) structural variables that explained 18.2% and 38.3 of the AGB spatial variance, respectively (Table 1).
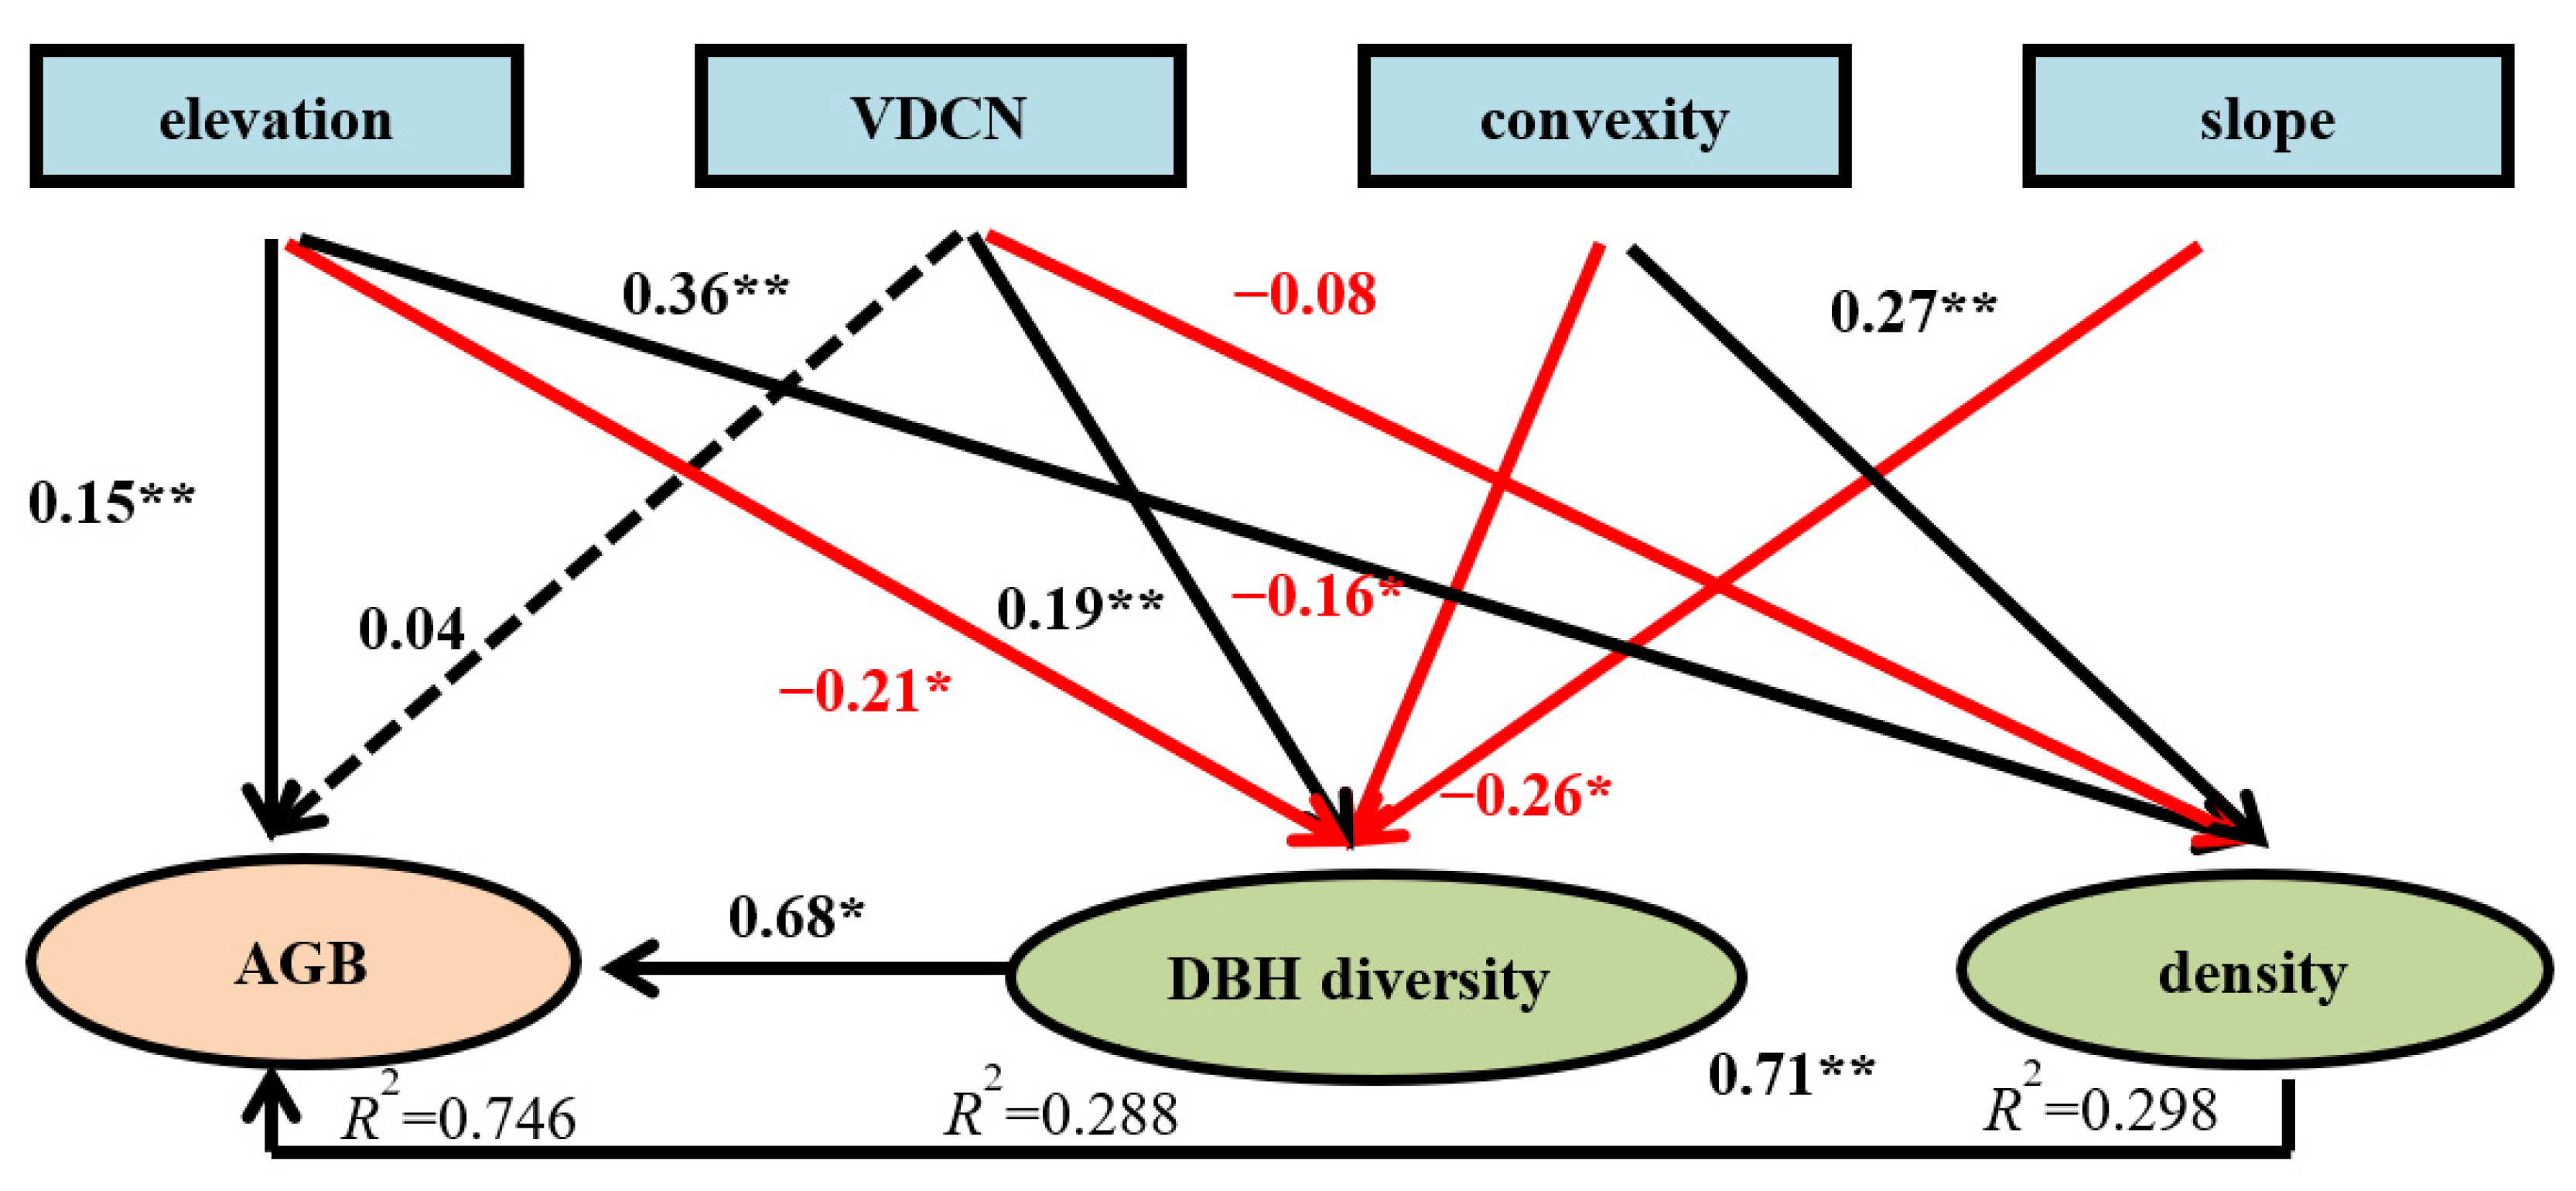
According to the results of PCNM, the topographical properties (elevation, VDCN, convexity, and slope) and structural properties (tree density and DBH diversity) served as two variables for carrying out SEM (Figure 5). This SEM explained 74.6% of the AGB (p < 0.001) in the Mulun plot as follows: elevation (β = 0.15), DBH diversity (β = 0.68), and tree density (β = 0.71) positively influenced AGB. However, DBH diversity was directly affected by VDCN (β = 0.19), and also negatively affected by elevation (β = −0.21), convexity (β = −0.16), and slope (β = −0.26). Tree density was directly affected by elevation (β = 0.36) and slope (β = 0.27), and negatively affected by elevation (β = −0.08).
4. Discussion
In this study, the average AGB (73.92 Mg/ha) of trees in a mixed evergreen–deciduous broadleaf forest was lower than the AGB (136.4 Mg/ha) estimated in the same type of karst forest in the neighboring Guizhou province [13]. The difference may be attributed to differences in the plot areas studied. An investigation using a large plot may allow for greater consideration of spatial variability of community structure. More robust estimates can be achieved with large sampling [15,36]. We also found that the karst forest had lower AGB than typical forests in non-karst regions in the same climate zone [15,36]. However, the highest value of AGB (198.11 Mg/ha) was 22.96 times as large as the lowest one. Therefore, this karst forest still has a certain level of potential for productivity due to the large proportion of small trees. Thus, the specialty of the nonzonal vegetation should be considered in estimating the regional carbon pools. The AGB has great variability with a variation coefficient of 30.80%. Other studies also showed a high variation in AGB at local scales [15,36,37]. The difference in topography, forest structure, light condition, and their interaction are likely to contribute to this variation [37].
The variance partition results demonstrated that DBH diversity and tree density are the crucial stand structural driving factors for AGB, which is consistent with Xu et al. who reported that biomass of a subtropical mountain moist forest was significantly affected by stem density [15]. Ali et al. also reported that stand structural complexity (tree DBH diversity) may affect AGB [21]. We further found that tree density and DBH diversity had significantly positive effects on AGB in a karst forest based on SEM (Figure 5). Many studies indicated that both stem density and tree size variation have stronger direct effects on AGB [17,21,24,38,39]. In the Mulun plot, AGB increased with increasing tree density or DBH diversity, and then decreased (Figure 6). Hui et al. and McEwan et al. also found this unimodal relationship between density and biomass [17,39]. Within a certain range, AGB was also found to increase with DBH variation or diversity [21,24]. Niche differentiation and facilitation allow species complementarity due to variations in individual tree sizes [21], and may improve light capture and light-use efficiency through greater canopy densities, as well as enhancing AGB. Therefore, maintaining the appropriate levels of DBH diversity is an efficient way to improve the carbon sequestration potential of the forest ecosystem [21].
In the Mulun plot, of the seven topographic variables, elevation and VDCN explained the majority of variation, followed by convexity and slope. Generally, it is difficult to establish causal relationships between topography and biomass because topography is a composite variable, which can directly and indirectly affect the forest biomass. On the basis of the result of variance partitioning, we attempted to test the direct effects of topography on AGB and the indirect effects via structural attributes. The SEM results showed that elevation had a direct positive effect on AGB. In the Mulun plot, the relative elevation difference reached 209 m from depression to peak. The karst forest AGB increased with elevation (Figure 6), which is consistent with Hui et al. and de Castilho et al. [17,40]. Additionally, McEwan et al. also found that elevation was significantly related to AGB in a Fushan 25 ha forest plot [39]. However, in some other large plots, AGB seemed to be insensitive to elevation, for example, in the Nouragues and Piste de Saint-Ellie 70 ha plot [41], Barro Colorado Island 50 ha plot [42], and Lienhuachih forest 25 ha plot [39]. This may be due to the differences in species diversity or climatic region. Further work is needed to investigate the causes.
The effect of topography on biomass is largely indirect, with little independent influence on biomass. In our study, topography also had an indirect effect on AGB via tree density and DBH diversity, consistent with previous studies [15,43]. Li et al. noted that environmental conditions strongly influence plant community compositions, and therefore, ecosystem functioning such as biomass [20]. Elevation and convexity had a positive influence on tree density in the Mulun plot. Consistent with our results, Xu et al. suggested that convexity was an important variable in regulating tree density [15]. Yuan et al. also found that altitude significantly correlated with the individual tree number in karst mountain forests in Southwest Guangxi, China [44].
5. Conclusions
We investigated a karst forest biomass and examined stand structural and abiotic factors driving AGB in a 25 ha dynamic forest plot in Southwest China, which provided important information on biomass distribution patterns for a better understanding of karst ecosystems. We found that the mean forest AGB was 73.92 ± 23.51 Mg/ha. The structural, topographic, and spatial factors predominantly contributed to the distribution of AGB. The stand structural complexity (tree density and DBH diversity) and topographic properties (elevation, VDCN, convexity, and slope) most strongly influenced AGB. The SEM suggested that AGB is directly driven by tree density, DBH diversity, and elevation. In addition, topographic factors mainly had indirect influence on AGB. Our work provides the links to understanding and establishing relationships between AGB and the driving factors on karst forests. These results will contribute to provide basic data for global and regional vegetation and carbon models. Further, regional forest carbon models need to consider community structural and topographic parameters.
Author Contributions
Conceptualization, H.D. and F.Z.; methodology, H.D. and T.S.; investigation, H.D. and L.L.; writing—original draft preparation, L.L.; writing—review and editing, K.W.; funding acquisition, H.D., F.Z. and T.S. All authors have read and agreed to the published version of the manuscript.
Funding
This research was supported by the Guangxi Key Research and Development Program (AB17129009), the National Key Research and Development Program of China (2016YFC0502405), the National Natural Science Foundation of China (41701293, 31770495, 31870712, 31971487), and the Guangxi Provincial Program of Distinguished Expert in China supported this research project financially.
Conflicts of Interest
The authors declare no conflict of interest.
References
- Pan, Y.; Birdsey, R.A.; Phillips, O.L.; Jackson, R.B. The structure, distribution, and biomass of the world’s forests. Annu. Rev. Ecol. Evol. Syst. 2013, 44, 593–622. [Google Scholar] [CrossRef] [Green Version]
- Zhang, H.; Song, T.Q.; Wang, K.L.; Yang, H.; Yue, Y.M.; Zeng, Z.X.; Peng, W.X.; Zeng, F.P. Influences of stand characteristics and environmental factors on forest biomass and root–shoot allocation in southwest China. Ecol. Eng. 2016, 91, 7–15. [Google Scholar] [CrossRef]
- Du, H.; Zeng, F.P.; Peng, W.X.; Wang, K.L.; Zhang, H.; Liu, L.; Song, T.Q. Carbon Storage in a Eucalyptus Plantation Chronosequence in Southern China. Forests 2015, 6, 1763–1778. [Google Scholar] [CrossRef] [Green Version]
- Sun, Z.Z.; Peng, S.S.; Li, X.R.; Guo, Z.D.; Piao, S.L. Changes in forest biomass over China during the 2000s and implications for management. For. Ecol. Manag. 2015, 357, 76–83. [Google Scholar] [CrossRef]
- Fang, H.Y.; Ji, B.Y.; Deng, X.; Ying, J.Y.; Zhou, G.M.; Shi, Y.J.; Xu, L.; Tao, J.X.; Zhou, Y.F.; Li, C.; et al. Effects of topographic factors and aboveground vegetation carbon stocks on soil organic carbon in Moso bamboo forests. Plant Soil 2018, 433, 363–376. [Google Scholar] [CrossRef]
- Zhang, H.; Wang, K.L.; Zeng, Z.X.; Zou, Z.G.; Xu, Y.F.; Zeng, F.P. Multiple Factors Drive Variation of Forest Root Biomass in Southwestern China. Forests 2018, 9, 456. [Google Scholar] [CrossRef] [Green Version]
- Du, H.; Hu, F.; Zeng, F.P.; Wang, K.L.; Peng, W.X.; Zhang, H.; Zeng, Z.X.; Zhang, F.; Song, T.Q. Spatial distribution of tree species in evergreen-deciduous broadleaf karst forests in southwest China. Sci. Rep. 2017, 7, 15664. [Google Scholar] [CrossRef] [Green Version]
- Du, H.; Liu, L.; Su, L.; Zeng, F.P.; Wang, K.L.; Peng, W.X.; Zhang, H.; Song, T.Q. Seasonal Changes and Vertical Distribution of Fine Root Biomass During Vegetation Restoration in a Karst Area, Southwest China. Front. Plant Sci. 2019, 9, 2001. [Google Scholar] [CrossRef] [Green Version]
- Tong, X.W.; Brandt, M.; Yue, Y.M.; Horion, S.; Wang, K.L.; Keersmaecker, W.D.; Tian, F.; Schurgers, G.; Xiao, X.M.; Luo, Y.Q.; et al. Increased vegetation growth and carbon stock in China karst via ecological engineering. Nat. Sustain. 2018, 1, 44–50. [Google Scholar] [CrossRef]
- Brandt, M.; Yue, Y.; Wigneron, J.P.; Tong, X.; Tian, F.; Jepsen, M.R.; Xiao, X.; Verger, A.; Mialon, A.; Al-Yaari, A.; et al. Satellite-Observed Major Greening and Biomass Increase in South China Karst During Recent Decade. Earth’s Future 2018, 6, 1017–1028. [Google Scholar] [CrossRef]
- Liu, L.B.; Ni, J.; Zhong, Q.L.; Hu, G.; Zhang, Z.H. High Mortality and Low Net Change in Live Woody Biomass of Karst Evergreen and Deciduous Broad-Leaved Mixed Forest in Southwestern China. Forests 2018, 9, 263. [Google Scholar] [CrossRef] [Green Version]
- Liu, C.C.; Liu, Y.G.; Guo, K.; Wang, S.J.; Liu, H.M.; Zhao, H.W.; Qiao, X.G.; Hou, D.J.; Li, S.B. Aboveground carbon stock, allocation and sequestration potential during vegetation recovery in the karst region of southwestern China: A case study at a watershed scale. Agric. Ecosyst. Environ. 2016, 235, 91–100. [Google Scholar] [CrossRef]
- Liu, L.B.; Wu, Y.Y.; Hu, G.; Zhang, Z.H.; Cheng, A.Y.; Wang, S.J.; Ni, J. Biomass of karst evergreen and deciduous broad-leaved mixed forest in central Guizhou province, southwestern China: A comprehensive inventory of a 2 ha plot. Silva Fenn. 2016, 50, 1492. [Google Scholar] [CrossRef] [Green Version]
- Cheng, J.Z.; Lee, X.Q.; Theng, B.K.G.; Zhang, L.; Fang, B.; Li, F.S. Biomass accumulation and carbon sequestration in an age-sequence of Zanthoxylum bungeanum plantations under the Grain for Green Program in karst regions, Guizhou province. Agric. For. Meteorol. 2015, 203, 88–95. [Google Scholar] [CrossRef]
- Xu, Y.Z.; Franklin, S.B.; Wang, Q.G.; Shi, Z.; Luo, Y.Q.; Lu, Z.J.; Zhang, J.X.; Qiao, X.J.; Jiang, M.X. Topographic and biotic factors determine forest biomass spatial distribution in a subtropical mountain moist forest. For. Ecol. Manag. 2015, 357, 95–103. [Google Scholar] [CrossRef]
- Di Cosmo, L.; Gasparini, P.; Tabacchi, G. A national-scale, stand-level model to predict total above-ground tree biomass from growing stock volume. For. Ecol. Manag. 2016, 361, 269–276. [Google Scholar] [CrossRef]
- Hui, D.F.; Wang, J.; Le, X.; Shen, W.J.; Ren, H. Influences of biotic and abiotic factors on the relationship between tree productivity and biomass in China. For. Ecol. Manag. 2012, 264, 72–80. [Google Scholar] [CrossRef]
- Sande, M.T.; Peñaeñaaros, M.; Ascarrunz, N.; Arets, E.J.; Licona, J.C.; Toledo, M.; Poorter, L. Abiotic and biotic drivers of biomass change in a Neotropical forest. J. Ecol. 2017, 105, 1223–1234. [Google Scholar] [CrossRef] [Green Version]
- Jucker, T.; Bongalov, B.; Burslem, D.; Nilus, R.; Dalponte, M.; Lewis, S.L.; Phillips, O.L.; Qie, L.; Coomes, D.A. Topography shapes the structure, composition and function of tropical forest landscapes. Ecol. Lett. 2018, 21, 989–1000. [Google Scholar] [CrossRef]
- Li, Y.; Bao, W.K.; Bongers, F.; Chen, B.; Chen, G.K.; Guo, K.; Jiang, M.X.; Lai, J.S.; Lin, D.M.; Liu, C.J.; et al. Drivers of tree carbon storage in subtropical forests. Sci. Total Environ. 2018, 654, 684–693. [Google Scholar] [CrossRef]
- Ali, A.; Lin, S.L.; He, J.K.; Kong, F.M.; Yu, J.H.; Jiang, H.S. Climate and soils determine aboveground biomass indirectly via species diversity and stand structural complexity in tropical forests. For. Ecol. Manag. 2019, 432, 823–831. [Google Scholar] [CrossRef]
- Morin, X. Species richness promotes canopy packing: A promising step towards a better understanding of the mechanisms driving the diversity effects on forest functioning. Funct. Ecol. 2015, 29, 993–994. [Google Scholar] [CrossRef] [Green Version]
- Yachi, S.; Loreau, M. Does complementary resource use enhance ecosystem functioning? A model of light competition in plant communities. Ecol. Lett. 2007, 10, 54–62. [Google Scholar] [CrossRef] [PubMed]
- Zhang, Y.; Chen, H.Y.H. Individual size inequality links forest diversity and above-ground biomass. J. Ecol. 2015, 103, 1245–1252. [Google Scholar] [CrossRef]
- Punchi-Manage, R.; Getzin, S.; Wiegand, T.; Kanagaraj, R.; Gunatilleke, C.V.S.; Gunatilleke, I.; Wiegand, K.; Huth, A. Effects of topography on structuring local species assemblages in a Sri Lankan mixed dipterocarp forest. J. Ecol. 2013, 101, 149–160. [Google Scholar] [CrossRef]
- Guo, Y.L.; Wang, B.; Mallik, A.U.; Huang, F.Z.; Xiang, W.S.; Ding, T.; Wen, S.J.; Lu, S.H.; Li, D.X.; He, Y.L.; et al. Topographic species–habitat associations of tree species in a heterogeneous tropical karst seasonal rain forest, China. J. Plant Ecol. 2016, 10, 450–460. [Google Scholar] [CrossRef]
- Wang, Z.C.; Du, H.; Song, T.Q.; Peng, W.X.; Zeng, F.P.; Zeng, Z.X.; Zhang, H. Allometric models of major tree species and forest biomass in Guangxi. Acta Ecol. Sin. 2015, 35, 4462–4472. [Google Scholar]
- Borcard, D.; Legendre, P.; Drapeau, P. Partialling out the Spatial Component of Ecological Variation. Ecology 1992, 73, 1045–1055. [Google Scholar] [CrossRef] [Green Version]
- Wang, Q.G.; Xu, Y.Z.; Lu, Z.J.; Bao, D.C.; Guo, Y.L.; Jun, M.L.; Zhang, K.H.; Liu, H.B.; Meng, H.J.; Qiao, X.J.; et al. Disentangling the effects of topography and space on the distributions of dominant species in a subtropical forest. Chin. Sci. Bull. 2014, 59, 5113–5122. [Google Scholar] [CrossRef]
- Souza, D.G.; Sfair, J.C.; de Paula, A.S.; Barros, M.F.; Rito, K.F.; Tabarelli, M. Multiple drivers of aboveground biomass in a human-modified landscape of the Caatinga dry forest. For. Ecol. Manag. 2019, 435, 57–65. [Google Scholar] [CrossRef]
- Grace, J.B.; Anderson, T.M.; Seabloom, E.W.; Borer, E.T.; Adler, P.B.; Harpole, W.S.; Hautier, Y.; Hillebrand, H.; Lind, E.M.; Pärtel, M.; et al. Integrative modelling reveals mechanisms linking productivity and plant species richness. Nature 2016, 529, 390–393. [Google Scholar] [CrossRef] [PubMed]
- Ribeiro, P.J., Jr.; Diggle, P.J.; Ribeiro, M.P.J., Jr.; Suggests, M. The geoR package. R News 2007, 1, 14–18. [Google Scholar]
- Dray, S.; Legendre, P.; Peres-Neto, P.R. Spatial modelling: A comprehensive framework for principal coordinate analysis of neighbour matrices (PCNM). Ecol. Model. 2006, 196, 483–493. [Google Scholar] [CrossRef]
- Oksanen, J.; Kindt, R.; Legendre, P.; O’Hara, B.; Stevens, M.H.H.; Oksanen, M.J.; Suggests, M.J.C.E.P. The vegan package. Community Ecol. Package 2007, 10, 631–637. [Google Scholar]
- Rosseel, Y. lavaan: An R Package for Structural Equation Modeling. J. Stat. Softw. 2012, 48, 1–36. [Google Scholar] [CrossRef] [Green Version]
- Lin, D.M.; Lai, J.S.; Mi, X.C.; Ren, H.B.; Ma, K.P. Spatial variation in community structure of a subtropical evergreen broad-leaved forest: Implications for sampling design. Chin. Sci. Bull. 2013, 58, 1181–1186. [Google Scholar] [CrossRef] [Green Version]
- Lin, D.M.; Lai, J.S.; Muller-Landau, H.C.; Mi, X.C.; Ma, K.P. Topographic Variation in Aboveground Biomass in a Subtropical Evergreen Broad-Leaved Forest in China. PLoS ONE 2012, 7, e48244. [Google Scholar] [CrossRef]
- Fotis, A.T.; Murphy, S.J.; Ricart, R.D.; Krishnadas, M.; Whitacre, J.; Wenzel, J.W.; Queenborough, S.A.; Comita, L.S. Above-ground biomass is driven by mass-ratio effects and stand structural attributes in a temperate deciduous forest. J. Ecol. 2018, 106, 561–570. [Google Scholar] [CrossRef]
- McEwan, R.W.; Lin, Y.C.; Sun, I.F.; Hsieh, C.F.; Su, S.H.; Chang, L.W.; Song, G.Z.M.; Wang, H.H.; Hwong, J.L.; Lin, K.C.; et al. Topographic and biotic regulation of aboveground carbon storage in subtropical broad-leaved forests of Taiwan. For. Ecol. Manag. 2011, 262, 1817–1825. [Google Scholar] [CrossRef]
- de Castilho, C.V.; Magnusson, W.E.; de Araújo, R.N.O.; Luizão, R.C.C.; Luizão, F.J.; Lima, A.P.; Higuchi, N. Variation in aboveground tree live biomass in a central Amazonian Forest: Effects of soil and topography. For. Ecol. Manag. 2006, 234, 85–96. [Google Scholar] [CrossRef]
- Chave, J.; Riera, B.; Dubois, M.A. Estimation of biomass in a neotropical forest of French Guiana: Spatial and temporal variability. J. Trop. Ecol. 2001, 17, 79–96. [Google Scholar] [CrossRef] [Green Version]
- Chave, J.; Condit, R.; Lao, S.; Caspersen, J.P.; Foster, R.B.; Hubbell, S.P. Spatial and temporal variation of biomass in a tropical forest: Results from a large census plot in Panama. J. Ecol. 2003, 91, 240–252. [Google Scholar] [CrossRef]
- Kubota, Y.; Murata, H.; Kikuzawa, K. Effects of topographic heterogeneity on tree species richness and stand dynamics in a subtropical forest in Okinawa Island, southern Japan. J. Ecol. 2004, 92, 230–240. [Google Scholar]
- Yuan, T.X.; Zhang, H.P.; Ou, Z.Y.; Tan, Y.B. Effects of topography on the diversity and distribution pattern of ground plants in karst montane forests in Southwest Guangxi, China. Chin. J. Appl. Ecol. 2014, 25, 2803–2810. [Google Scholar]
Figure 1.
The 25 ha Mulun forest plot and the contour map of the plot. The numbers in the contour map represent elevation (m).
Figure 1.
The 25 ha Mulun forest plot and the contour map of the plot. The numbers in the contour map represent elevation (m).

Figure 2.
Distribution of forest biomass among diameter classes in the Mulun plot.

Figure 3.
Spatial distribution of forest aboveground biomass (AGB) in the Mulun plot. Contour lines in the map indicate elevation. White indicates values higher than the median, and green indicates values less than the median.
Figure 3.
Spatial distribution of forest aboveground biomass (AGB) in the Mulun plot. Contour lines in the map indicate elevation. White indicates values higher than the median, and green indicates values less than the median.

Figure 4.
Variance partitions of topographic, stand structural, and spatial variables account for the AGB variation (%). The symbols a, b, c represent the independent effects of topography, stand structure, and selected spatial variables, respectively; ab is the interactive effect of topography and stand structure; ac, the interactive effect of topography and selected spatial variables; bc, the interactive effect of stand structure and selected spatial variables; and abc, the interactive effect of topography, stand structure and selected spatial variables.

Figure 5.
The structural equation model (SEM) of AGB, topographical, and structural variables. The standardized estimated coefficient (beta) and significance (* < 0.05, ** < 0.001) are given for the SEM. Red arrows denote negative correlations. Black arrows denote positive correlations. The dotted arrow shows nonsignificant effects. The solid arrows show significant effects. Numbers close to variables (R2) indicate the variance explained by the model.

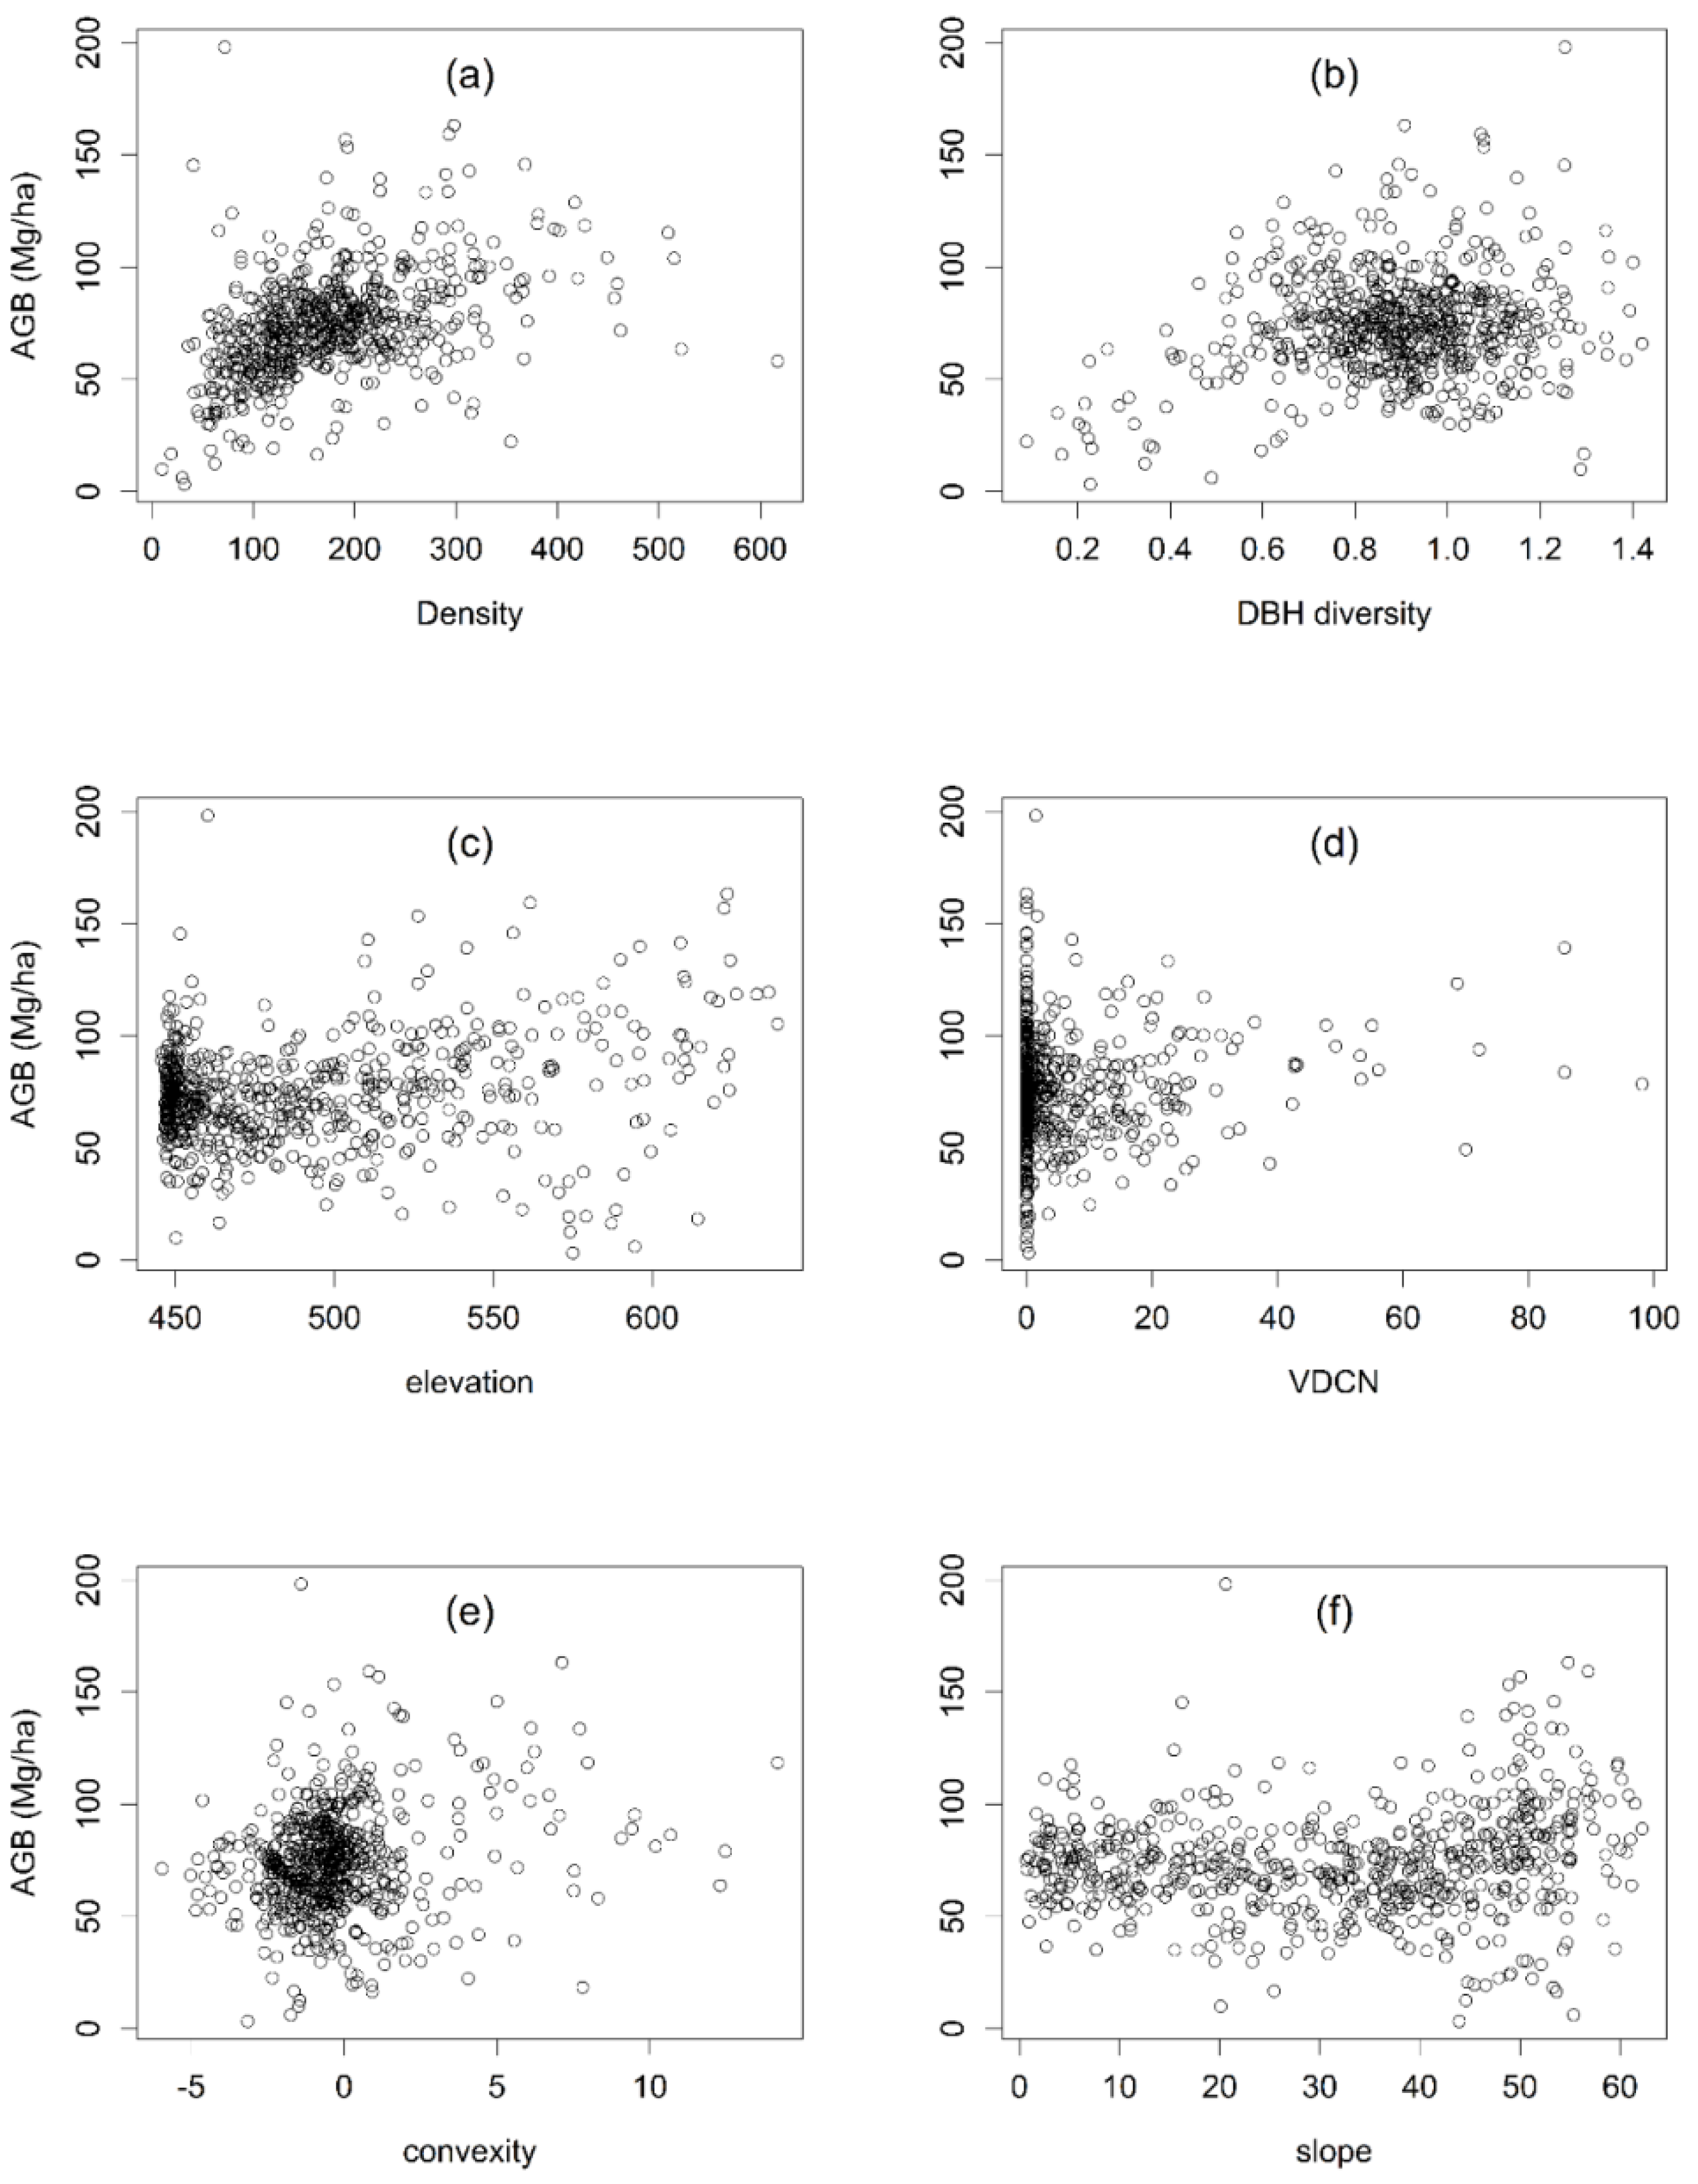
Figure 6.
Scatter plots demonstrating relationships between AGB and six significant predictors (density (a), diameter at breast height (DBH) diversity (b), elevation (c), vertical distance to channel network (VDCN) (d), convexity (e), and slope(f)).
Figure 6.
Scatter plots demonstrating relationships between AGB and six significant predictors (density (a), diameter at breast height (DBH) diversity (b), elevation (c), vertical distance to channel network (VDCN) (d), convexity (e), and slope(f)).


Table 1.
Topographic and stand structures regulated the distribution of aboveground biomass (AGB).
| Factors | R2 | F | p Value |
|---|---|---|---|
| Topography | |||
| Elevation | 0.054 | 35.518 | 0.0001 ** |
| VDCN | 0.011 | 7.095 | 0.0088 ** |
| Convexity | 0.010 | 6.712 | 0.0107 * |
| Slope | 0.007 | 4.574 | 0.0338 * |
| Stand Structure | |||
| Density | 0.182 | 138.614 | <0.0001 ** |
| DBH diversity | 0.383 | 547.031 | <0.0001 ** |
Significance at * p < 0.05; ** p < 0.01.
© 2020 by the authors. Licensee MDPI, Basel, Switzerland. This article is an open access article distributed under the terms and conditions of the Creative Commons Attribution (CC BY) license (http://creativecommons.org/licenses/by/4.0/).
Share and Cite
MDPI and ACS Style
Liu, L.; Zeng, F.; Song, T.; Wang, K.; Du, H. Stand Structure and Abiotic Factors Modulate Karst Forest Biomass in Southwest China. Forests 2020, 11, 443. https://doi.org/10.3390/f11040443
AMA Style
Liu L, Zeng F, Song T, Wang K, Du H. Stand Structure and Abiotic Factors Modulate Karst Forest Biomass in Southwest China. Forests. 2020; 11(4):443. https://doi.org/10.3390/f11040443
Chicago/Turabian StyleLiu, Lu, Fuping Zeng, Tongqing Song, Kelin Wang, and Hu Du. 2020. "Stand Structure and Abiotic Factors Modulate Karst Forest Biomass in Southwest China" Forests 11, no. 4: 443. https://doi.org/10.3390/f11040443
Note that from the first issue of 2016, this journal uses article numbers instead of page numbers. See further details here.