Article

Variations in Physiological and Biochemical Characteristics of Kalidium foliatum Leaves and Roots in Two Saline Habitats in Desert Region

1
College of Ecology and Environment, Xinjiang University, Urumqi 830017, China
2
Key Laboratory of Oasis Ecology of Education Ministry, Xinjiang University, Urumqi 830017, China
3
Farmland Irrigation Research Institute, Xinxiang 453000, China
*
Author to whom correspondence should be addressed.
Forests 2024, 15(1), 148; https://doi.org/10.3390/f15010148
Submission received: 11 November 2023 / Revised: 31 December 2023 / Accepted: 4 January 2024 / Published: 11 January 2024
(This article belongs to the Special Issue Plant Adaptation to Extreme Environments in Drylands—Series II)

Abstract

:
Salt stress is a key environmental factor that has adverse effects on plant growth and development. High salinity induces a series of structural and functional changes in the morphological and anatomical features. The physiological and biochemical changes in K. foliatum in response to salt stress in natural environments are still unclear. Based on this, this study compared and analyzed the differences in the physiological and biochemical indicators between the leaf and root tissues in high-salt and low-salt habitats, selecting K. foliatum as the research object. The results showed that the chlorophyll contents in the leaves of K. foliatum decreased in the high-salt habitat, while the thicknesses of the upper and lower epidermises, as well as the thicknesses of the palisade tissue, significantly increased. The high-salt environment led to decreases in the N and P contents in the leaves and root tissues of K. foliatum, resulting in changes in the stoichiometric ratio of elements. The concentrations of C, N, and P in the roots of K. foliatum were lower than those in the leaves. The accumulation of Na+ in the K. foliatum roots was greater than that in the leaves, and the roots could promote the transport of sodium ions to the leaves. The contents of starch and soluble sugar in the leaves showed higher proportions in the high-salt habitat than in the low-salt habitat, while the changes in the roots and leaves were the opposite. As the salt content increased, the proline contents in the leaves and roots of K. foliatum significantly increased, and the proline contents in the roots of K. foliatum were lower than those in the leaves. The leaves and roots exhibited higher levels of peroxidase and superoxide enzymes in the high-salinity habitat than in the low-salinity habitat. The superoxide dismutase (SOD) activity of the K. foliatum leaves and catalase (CAT) activity of the roots were the “central traits” in the high-salt habitat. In the low-salt habitat, the leaf malondialdehyde (MDA) and root C/N were the central traits of the leaves and roots, indicating that K. foliatum adapts to changes in salt environments in different ways.

1. Introduction

Salinization is one of the most serious environmental problems in the world, affecting the growth, development, and productivity of many plants. More than 6% of the world’s land is affected by salinization, with 20% of the arable land and 33% of the agricultural irrigation area affected by high salinity. By 2050, it is expected that over 50% of the arable land will be salinized [1,2]. The serious impact of salt stress on plants and soil has prompted scholars to conduct extensive research on the response and adaptation mechanisms of plants to salt stress. According to the responses of plants to salt, they can be classified into halophytes and sweet-soil plants [3]. Halophytes can grow in soil environments with salinities greater than 200 mol/L, while sweet-soil plants cannot survive at similar levels of salinity. Halophytes have unique structures, including salt gland structures (vesicular head cells, hairy head cells, stem cells, and basal cells), fleshy tissues, and thick cork layers, to withstand salt stress [3].
Plants exhibit various physiological adaptation mechanisms to cope with salt stress, including the regulation of photosynthesis and energy metabolism, selective ion absorption/elimination, nutrient balance, osmotic regulation, and the accumulation of antioxidant enzymes. Photosynthetic pigments play a crucial role in photosynthesis by converting light energy into chemical energy, but salt stress can lead to severe pigment damage [4]. As the salt concentration increases, both chlorophyll a and chlorophyll b in kidney beans significantly decrease. The decrease in the chlorophyll levels in salt-stressed plants is considered a typical characteristic of oxidative stress [5]. Salt stress significantly increases the thicknesses of the palisade tissue and stratum corneum, while reducing the thickness of the sponge tissue [6]. Salt can affect the absorption of nutrients by roots, such as by increasing the Na+ uptake and reducing the Ca2+ uptake, leading to nutrient imbalance [7]. The limitation of Na+ accumulation in the aboveground parts of rice under salt stress may be related to its own salt stress tolerance [8]. Under high-salt conditions, the Na+/Ca2+ and Na+/K+ ratios in plant cells increase sharply, causing damage to the cell membrane and cell leakage, further exacerbating the passive accumulation of Na+ in the plant body [9]. Rong et al. (2015) found that there is a significant negative correlation between the phosphorus concentration in Tamarix chinensis leaves and soil salinity in the coastal wetland of Laizhou Bay, China [10]. Salt reduced the N contents in mint leaves and the P contents in the roots [11]. Salt stress also limits other biosynthetic functions, including amino acid and protein synthesis [12]. Salt stress leads to starch accumulation in rice leaves and an increase in the soluble sugar content [13]. The increase in starch or sugars in leaves may be an adaptive response to salt stress [14] or a sign of growth arrest (insufficient carbon use) [15,16]. Proline is an amino acid and osmotic protector, and an important signaling molecule. The accumulation of proline under salt stress enhances the plant water absorption and antioxidant capacity, reducing the accumulation of toxic ions [17,18]. Plants under salt stress can produce a large amount of reactive oxygen species (ROS), which cause membrane lipid peroxidation [19]. In order to prevent or reduce the damage caused by reactive oxygen species and enable them to continue their beneficial functions, the plant’s antioxidant defense system plays a role in controlling the content of reactive oxygen species. Superoxide dismutase (SOD), peroxidase (POD), and catalase (CAT) are the main protective enzymes in the enzymatic defense system [18]. Some studies have found that the activities of POD and CAT do not change significantly at low salt concentrations but increase sharply at high salt concentrations. High salinity may stimulate the synthesis of POD and CAT [20], but excessive salt stress can lead to impaired enzyme activity [21]. Based on the concept of green development, cultivating salt-tolerant varieties is an effective way to develop, utilize, and improve saline soil, which contributes to sustainable economic development. Conducting research on the salt tolerance mechanism of plants is of great significance for elucidating the impact of soil salinization on plant growth, as well as for the ecological protection and sustainable development of saline soil.
Kalidium foliatum belongs to the family Chenopodiaceae and the genus Kalidium, and it is a true halophyte. Kalidium foliatum is widely distributed in the arid areas of northwest China. Within a certain range of salt concentration, salt significantly changes the structure of K. foliatum in chloroplasts and nuclei [22], and its rhizosphere exhibits a significant salt island effect, which can significantly enrich multiple ions [23]. Currently, research on the salt tolerance characteristics of K. foliatum mainly focuses on the leaf anatomical structure and physiological characteristics, while there is less research on the physiological adaptation characteristics of K. foliatum in natural salt habitats. Based on this, this study took the typical halophyte K. foliatum in the desert ecosystem as the research object, selected high-salt and low-salt habitats as the sampling sites, and analyzed the salt tolerance adaptation characteristics of K. foliatum in detail with an emphasis on the roots and leaves. It clarifies the internal morphological structures, element and stoichiometric ratios, ion distribution characteristics, and changes in antioxidant substances in the two salt habitats to provide a theoretical basis for cultivating excellent salt-tolerant varieties and for the comprehensive evaluation of the plant salt tolerance.

2. Materials and Methods

2.1. Overview of the Research Area

The Ebinur Lake Wetland National Nature Reserve (ELWNNR) in Xinjiang (44°43′ N–45°12′ N, 82°35′ E–83°40′ E) is the lowest depression and water salt concentration center in the southwest margin of the Junggar Basin. The ELWNNR is centered around the water body of Ebinur Lake, with a total area of 2670.85 km2, of which the desert area accounts for more than 50% of the protected area. The climate in this area belongs to the temperate continental arid climate, with about 170 strong wind days throughout the year and a maximum wind speed of 55.0 m/s. The average annual temperature is 7.8 °C, and the extreme lowest and highest temperatures can reach −36.4 °C and 41.3 °C. The precipitation is scarce and unevenly distributed, with an average annual precipitation of 90.9 mm and an average annual evaporation of 1662 mm [24]. The soil in the watershed is rich in minerals, and the soil types are gray-brown desert soil, gray desert soil, and windblown sand soil. The hidden soil types are meadow soil, saline (saline) soil, and swamp soil, with a high degree of soil salinization and severe changes in the soil water and salt [25]. There are various types of sandy vegetation, mesophytic vegetation, and aquatic vegetation distributed in the area. The main plants in the area are Populus euphratica, Haloxylon ammodendron, Halimoderon halodendron, Alhagi sparsifolia, Reaumuria soongarica, Nitraria roborowskii, K. foliatum, Apocynum venetum, and Phragmites australis [26].

2.2. Sample Site Layout and Sample Collection

2.2.1. Layout of Sample Plots

According to the research results of the previous team, starting from the East Bridge Management and Protection Station of the Ebinur Lake Wetland National Nature Reserve, two 100 m × 100 m plots were set perpendicular to the banks of the Aqikesu River, south of the banks and north of the banks, and meter sample plots were used to determine the salt contents of the two plots. The soil salt contents of plots A and B were 10.15 ± 0.07 g/kg and 3.62 ± 0.08 g/kg, respectively (Figure 1). According to the soil salinity grading index [27] and the results of the soil salinity content measurements, the soil salinity contents in the desert areas are mild salinization at 2.0–4.0 g/kg, moderate salinization at 4.0–6.0 g/kg, and severe salinization at 6.0–20.0 g/kg. Therefore, there is a significant difference in the salt contents between sample plots A and B in this study, which can be divided into two habitats: a high-salt habitat and low-salt habitat. The soil physicochemical properties of the two saline habitats were shown in Table 1. We simultaneously investigated the number of species of K. foliatum in various fields for the random sampling of K. foliatum individuals. The main accompanying species in the high-salt habitat are Tamarix ramosissima, Nitraria tangutorum, Halostachys caspica, Halonemum strobilaceum, and P. australis. In the low-salt habitat, the main accompanying species are H. ammodendron, H. halodendron, R. soongarica, P. australis, and Nitraria roborowskii.

2.2.2. Sample Collection

Plant sample collection: 18 healthy K. foliatum plants with consistent growth and size were selected from each salt habitat. First, the leaf and root tissues of the K. foliatum were collected, and every 3 leaves and roots of the 18 K. foliatum plants from each salt habitat were mixed. A total of 24 plant samples were obtained from each salt habitat, which were quickly placed in liquid nitrogen for the subsequent sequencing of the physiological indicators. We selected 3–5 healthy leaves from each plant and immediately fixed them with FAA fixation solution. We screened the roots of each plant and randomly selected 3 fine roots from them. After washing the fine roots, we fixed them with electron-microscope fixing solution and immediately brought them back to the laboratory after sampling.

2.2.3. Sample Determination

We cut the leaves into thin slices, observed and measured them using an optical microscope, and analyzed the following parameters using an image analysis system: the leaf thickness, upper-epidermis thickness, lower-epidermis thickness, upper-epidermis length, lower-epidermis length, fence tissue thickness, and other indicators. We sliced the leaves and roots into slices, quickly vacuumed them, placed them on an observation platform, opened the scanning electron microscope software (SU 8100), and connected it to the scanning electron microscope device. We set the acceleration voltage and magnification of the scanning electron microscope on the software (SU 8100) interface, and we adjusted them according to the actual needs. We focused the specimen in the electron microscope and adjusted the lens to make the image clear and visible. We performed the necessary calibration, such as adjusting the scanning speed and scanning mode of the electron beam. We clicked the “Start Scanning” button on the software (SU 8100) interface to start observing and taking samples. The details and position of the image were adjusted through the zoom and navigation functions on the software (SU 8100) interface to obtain the desired observation results.
The concentrations of chlorophyll a, chlorophyll b, and carotenoids were determined using the ethanol acetone method, according to the Harmut (1987) method [28]. The content of soluble protein was determined according to Bradford’s (1976) method [29]. According to Khelil et al. (2007), the method was slightly modified to measure the soluble sugar and starch contents [30]. The sample was extracted with ethanol in an 80 °C water bath for 30 min, and the soluble sugar content in the supernatant was determined according to Lepesant et al. (1972) [31]. The residue was extracted with 52% HClO4 and the supernatant was obtained for the starch content [32]. The activity of superoxide dismutase (SOD) was measured using the nitrogen blue tetrazolium photochemical reduction method [33]. The peroxidase (POD) activity was measured using the guaiacol colorimetric method [34]. The activity of catalase (CAT) was determined via the UV absorption method [35]. The content of malondialdehyde (MDA) was determined using the phenobarbitone acid method [36]. The acidic ninhydrin staining method was used to determine the proline (PRO) content [36]. The contents of carbon, nitrogen, and phosphorus in the leaves and roots were determined using potassium dichromate titration, Kjeldahl nitrogen determination, and molybdenum antimony resistance colorimetry [27]. An Inductively Coupled Plasma Emission Spectrometer (ICP-OES) (Thermo, Waltham, MA, USA, iCAP7400) was used to determine the concentrations of Na+, K+, Ca2+, and Mg2+. Cl and sulfate anions were titrated using silver nitrate titration and EDTA complexometric titration, respectively [27].

2.3. Data Analysis Methods

Based on the stats package in R software (R4.1.2), Shapiro–Wilk’s and Levene’s methods were used to test the normality and homogeneity of the variance in the data. An independent-sample t-test (p < 0.05) was used to evaluate the differences in the photosynthetic pigments, leaf anatomical structures, nutrient elements, inorganic ions and their stoichiometric ratios, osmoregulation substances, antioxidant enzyme activities, and malondialdehyde contents between the two saline habitats. The characteristics of plant trait networks can reflect the interaction between plants and the environment from a holistic perspective. The nodes represent the plant traits, and the lines between the nodes represent the correlations between the plant traits [37]. The correlations between the plant traits indicate the interactions between the traits [38]. The igraph package in R software (R4.1.2) was used to calculate the correlations between the root and leaf traits and the characteristics of the network (degree and weighting): the degree (D), which refers to the number of edges on nodes, and the degree weight (Dw), which refers to the sum of significant correlation coefficients of nodes [39]. A correlation coefficient greater than 0.7 and p < 0.05 was considered to be a significant correlation between traits. The trait with the highest degree represented the “central trait” in the network [37]. Finally, Cytoscape software (Cytoscape 3.9.1) was used to visualize the network of plant functional traits. R 4.0.5 was used for statistical analysis and image rendering.

3. Results and Analysis

3.1. Differences in Chlorophyll, Leaf, and Root Anatomical Structures of K. foliatum under Two Saline Habitats

There were significant differences in the chlorophyll a, chlorophyll b, and total chlorophyll contents between the two saline habitats, both of which were higher in low-saline habitats than in high-saline habitats. The carotenoid content in the high-salt habitat was slightly lower than that in the low-salt habitat, and there was no significant difference between the carotenoids in the low-salt habitat (Figure 2).
The thicknesses of the K. foliatum leaves were greater in the high-salinity habitat (1325.82 ± 101.53 μm) than those in the low-salt habitat (1262.14 ± 23.87 μm). There were significant differences in the thicknesses of the upper and lower epidermises, the lengths of the lower epidermises, the thicknesses of the palisade tissue, the vascular bundle apertures, and the thickness ratios of the palisade tissue observed under an optical microscope (Table 2).
The scanning electron microscopy results of the K. foliatum leaves indicate that the stomatal structure was clearly visible on the upper epidermises of the K. foliatum leaves in both saline habitats (Figure 3B,F). In the low-salt habitat, the surfaces of the stomatal guard cells in K. foliatum were smooth with only a few folds (Figure 3F,G), while, in the high-salt habitat, the surfaces of the stomatal guard cells were convex, forming a clear wrinkled structure (Figure 3B,C). A large number of white salt crystals were clearly visible on the upper epidermises of the K. foliatum leaves (Figure 3B), while, in the low-salt habitat, only a few crystals were visible on the upper epidermises of the K. foliatum leaves (Figure 3F).
The epidermal cells, four–five layers of cortical parenchyma cells, a large number of cavities, and central vascular bundle tissue can be seen in the roots of K. foliatum under a scanning electron microscopic (Figure 4). The vascular tissue consists of the primary xylem, primary phloem, and parenchyma cells, with the xylem located at the center of the root (Figure 4). No salt crystals were found on the transverse section of the K. foliatum roots in the high-salt habitat, but a small amount of salt crystals was found in the fine roots of the K. foliatum roots in the low-salt habitat (Figure 4G).

3.2. Differences in Nutrient Contents and Stoichiometric Ratios of K. foliatum Leaves and Roots in Two Saline Habitats

The total carbon content of the K. foliatum leaves in the low-salt habitat was significantly higher than that in the high-salt habitat. The results of the leaf element stoichiometry showed that there were significant differences in the carbon–nitrogen-ratio and carbon–phosphorus-ratio contents of the K. foliatum leaves under the two different salt habitats, which were both greater in the low-salt habitat than in the high-salt habitat (Figure 5).
There was a significant difference in the carbon and phosphorus contents of the K. foliatum roots between the two saline habitats, both showing higher carbon and phosphorus contents in the low-saline habitat than in the high-saline habitat. The results of the elemental stoichiometry of the roots indicated that the carbon–nitrogen ratio and carbon–phosphorus ratio of the K. foliatum roots in both saline habitats were higher in the low-salinity habitat than in the high-salinity habitat, and there was a significant difference in the nitrogen–phosphorus ratios between the two saline habitats (Figure 5).

3.3. Differences in Inorganic Ion Contents and Stoichiometric Ratios between K. foliatum Leaves and Roots under Two Different Salt Habitats

There were significant differences in the potassium and magnesium ion contents in the leaves of K. foliatum under the two different salt habitats, both of which were lower in the low-salt habitat than in the high-salt habitat (Figure 6). The results of the ion content stoichiometry of the leaves showed that there were significant differences in the K+/Na+ and Mg2+/Na+ ratios of the K. foliatum leaves under the two salt habitats, which were both lower in the low-salt habitat than in the high-salt habitat (Figure 7).
There were significant differences in the potassium ion contents, calcium ion contents, magnesium ion contents, and sodium ion contents in the roots of K. foliatum under the two different salt habitats, all of which were lower in the low-salt habitat than in the high-salt habitat (Figure 6). The results of the ion content stoichiometry of the roots indicate that there was a significant difference in the Ca2+/Na+ ratios between the K. foliatum roots in the two saline habitats, with a lower ratio in the lower-salinity habitat than in the higher-salinity habitat (Figure 7).

3.4. Differences in Osmoregulation Substances in K. foliatum Leaves and Roots under Two Different Salt Habitats

The soluble protein expression of the K. foliatum leaves in the two different salt habitats was higher in the low-salt habitat than in the high-salt habitat. The contents of starch, soluble sugar, and proline in the high-salt habitat were higher than those in the low-salt habitat. The soluble sugar and starch contents of the K. foliatum roots in the two different salt habitats showed significantly higher levels in the low-salt habitat than those in the high-salt habitat. The contents of soluble protein and proline in the high-salt habitat were significantly higher than those in the low-salt habitat (Figure 8).

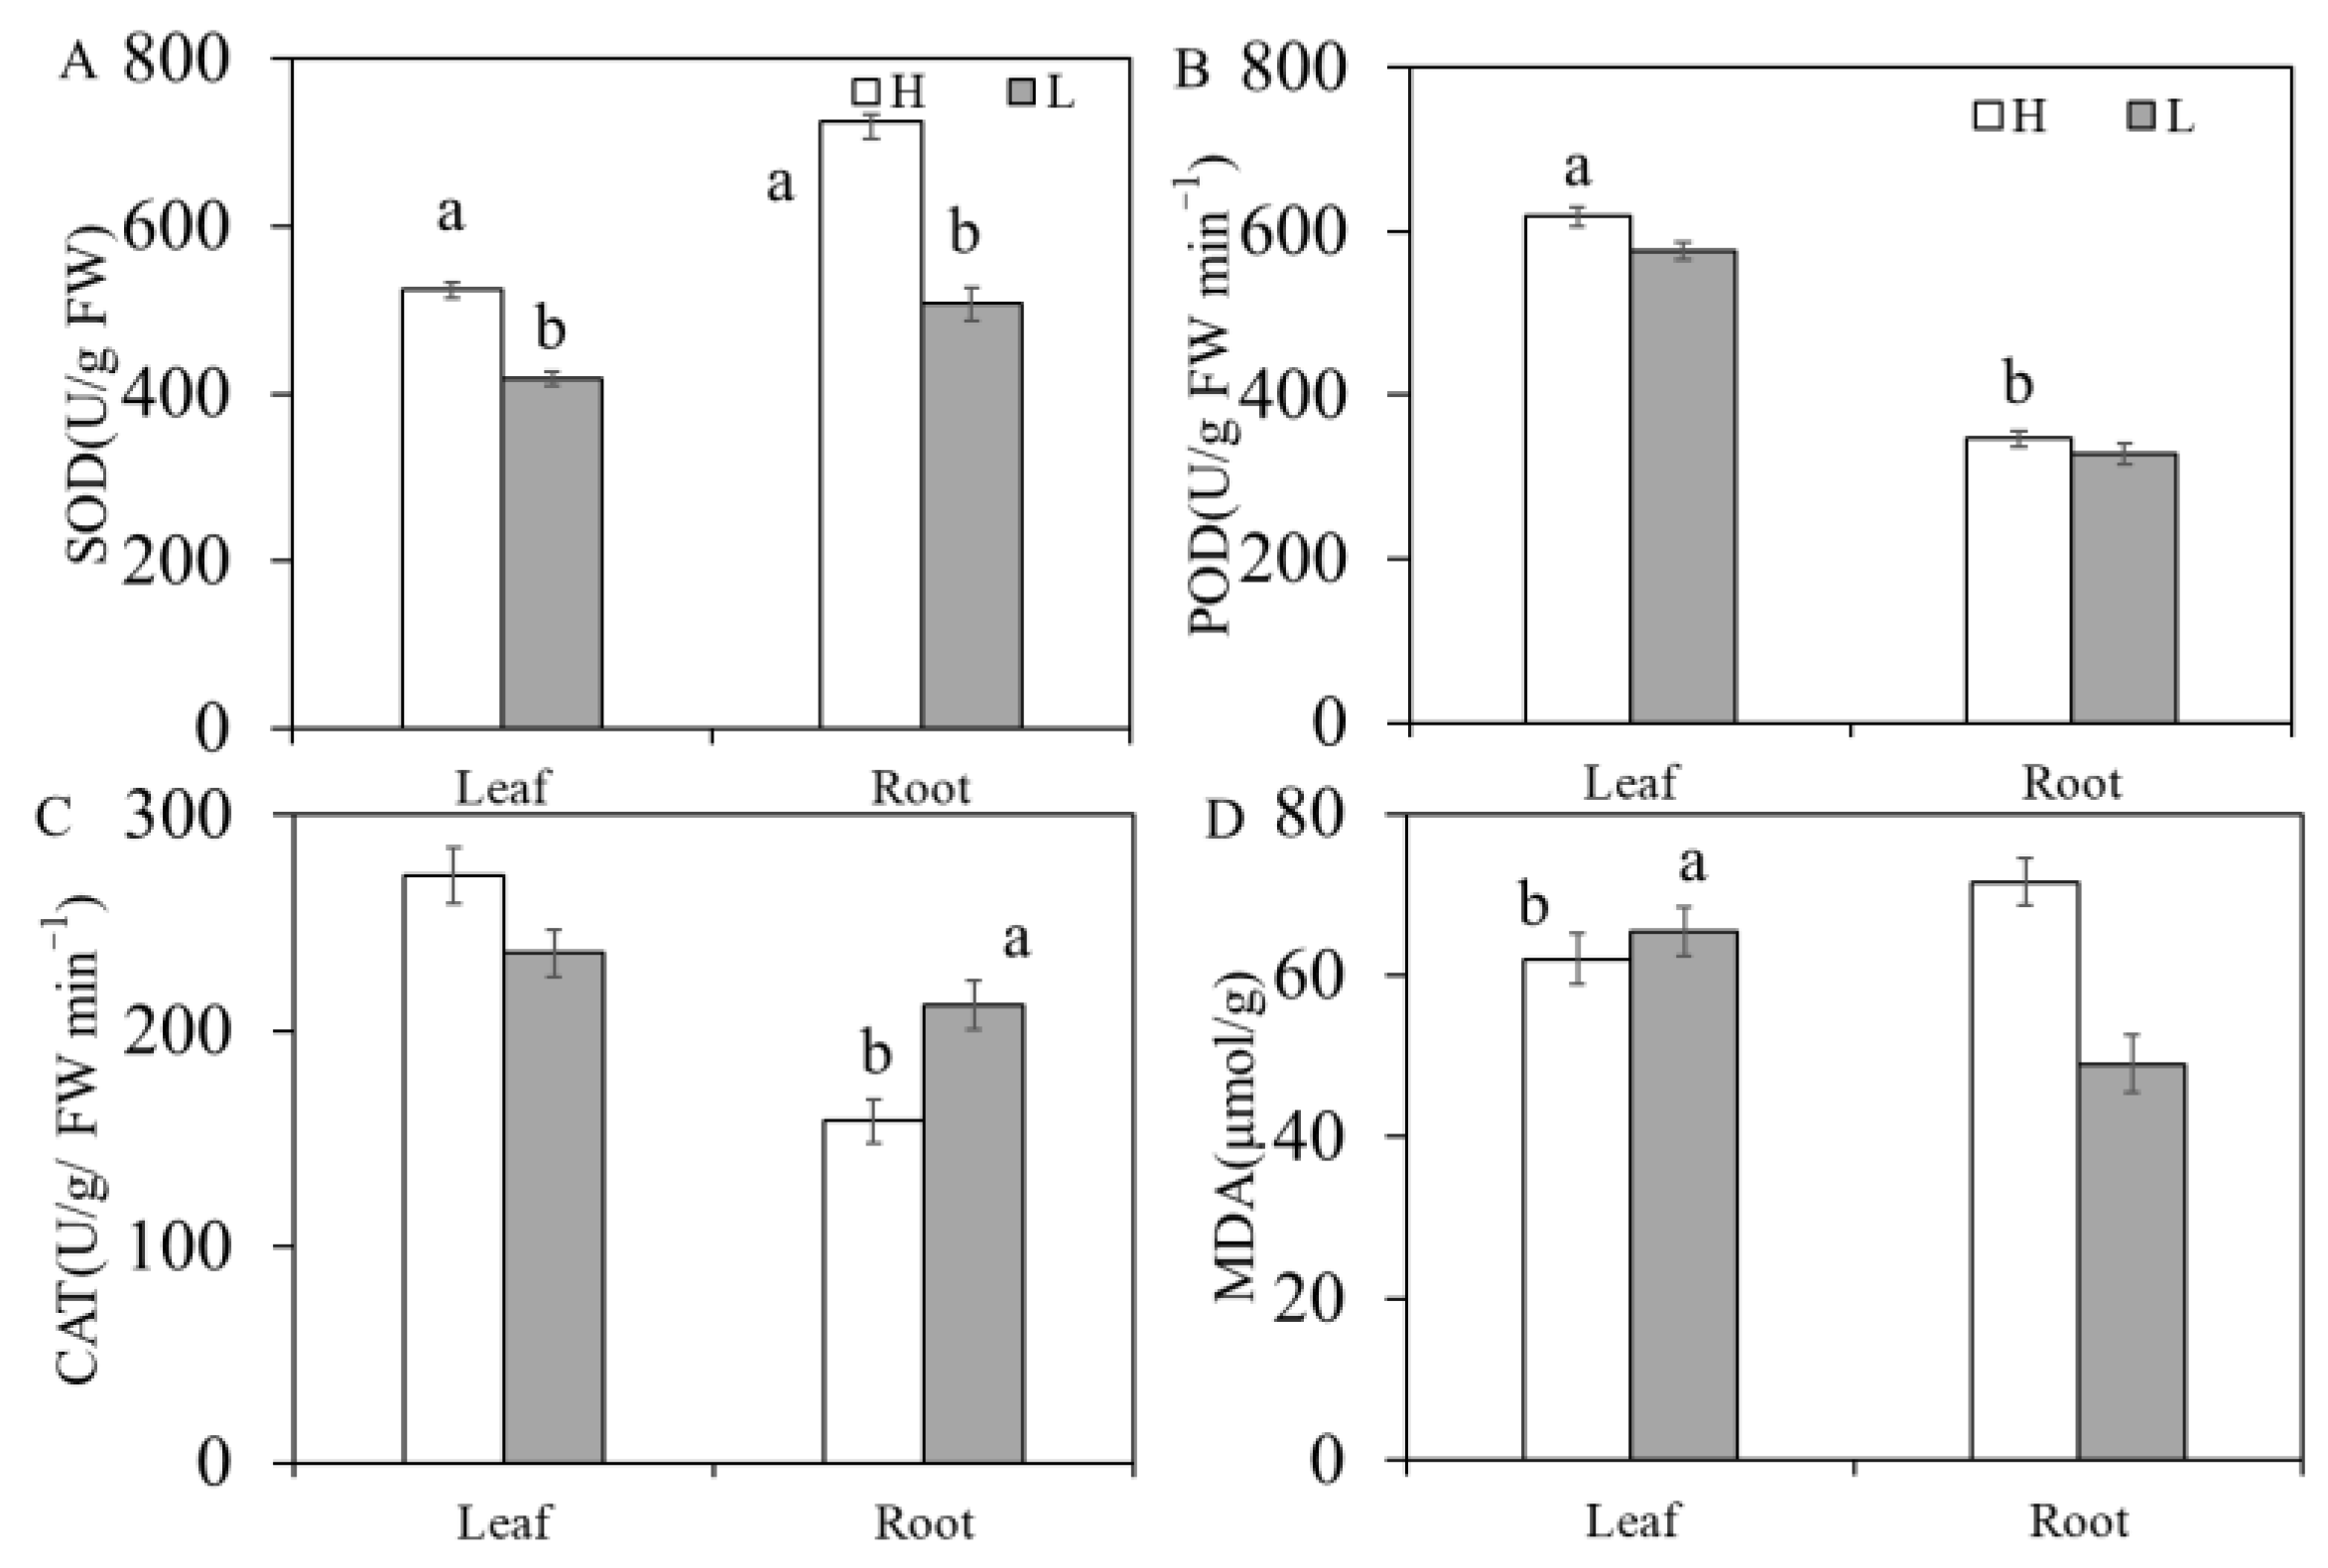
3.5. Differences in Antioxidant and Membrane Lipid Peroxidation Substances in K. foliatum Leaves and Roots under Two Different Salt Habitats

The contents of superoxide dismutase (SOD), peroxidase (POD), and catalase (CAT) in the K. foliatum leaves under the two different salt habitats were higher in the high-salt habitat than in the low-salt habitat. The contents of superoxide dismutase, peroxidase, and malondialdehyde (MDA) in the K. foliatum roots of both saline habitats showed higher levels in the high-saline habitat than in the low-saline habitat. The contents of superoxide dismutase, catalase, and malondialdehyde in the roots showed significant differences between the two habitats (Figure 9).

3.6. Network Association of Physiological Traits of K. foliatum Leaves and Roots in Two Salt Habitats

In the physiological trait network of the K. foliatum leaves and roots in the high-salt habitat, the SOD of the K. foliatum leaves had the highest degree and was the “central trait” of the leaves in the high-salt habitat, while the root CAT activity was the “central trait” of the roots in the high-salt habitat (Figure 10, Table 3 and Table 4). In the physiological trait network of the K. foliatum leaves and roots in the low-salt habitat, the leaf MDA and root C/N were the central traits of the leaves and roots (Figure 10, Table 3 and Table 4). Moreover, there was a greater number of positive correlations between the leaves and roots in the high-salt habitat (Figure 10).

4. Discussion

Salt reduces photosynthetic pigments, such as chlorophyll and carotenoids, by disrupting biosynthetic pathways [40]. Photosynthesis is a prerequisite for maintaining normal plant growth, and its intensity can serve as an indicator of plant growth and resilience, while photosynthetic pigments directly affect the photosynthetic capacity of plants. Chlorophyll is located in the thylakoid membrane and acts as an “antenna”, absorbing red and blue wavelengths of light energy and transferring it to the reaction center of the photosystem [41]. Carotenoids are auxiliary pigments that can absorb light from the blue–green region of the solar spectrum and transfer the absorbed energy to chlorophyll molecules [42]. This study showed that K. foliatum chlorophyll a and chlorophyll b were significantly reduced in the high-salt soil environment (Figure 2), consistent with the research results of other scholars on tomatoes [43]. In indoor control experiments, the contents of chlorophylls and carotenoids were significantly reduced via a higher concentration of NaCl + Na2SO4 under a single salt stress, and their contents increased compared to the control group [44]. The K. foliatum in this study came from natural habitats, and the presence of multiple salts in the soil simultaneously affected its growth. Therefore, the results of this study were consistent with those of indoor mixed salt stress. This study found that, although there was a significant difference in the chlorophyll contents of K. foliatum under the two different salt habitats, the difference in the change was small (Table 2). This may be due to various factors affecting the degree of chlorophyll change, such as the plant species, salt type, and salt concentration. Moreover, the chlorophyll contents of salt-tolerant plants change less than those of salt-sensitive plants [45], so the amplitude of the change was relatively small. Carotenoids are effective antioxidants, so an increase in the carotenoid contents in plants helps protect chloroplasts and maintain higher chlorophyll contents [46]. This study found that, compared to the low-salt habitat, the palisade tissue of the K. foliatum leaves in the high-salt habitat significantly thickened, indicating that K. foliatum can increase the proportion of palisade tissue by regulating the development of mesophyll cells, thereby alleviating the photoinhibition caused by salt stress. The increase in the leaf epidermal thickness in the high-salt habitat may be an adaptation strategy of K. foliatum to salt stress in order to better prevent water loss on the leaf surface and improve the water retention efficiency [47]. In high-salt habitats, a large amount of salt crystals precipitate from K. foliatum leaves, while, in low-salt environments, salt crystals precipitate less, indicating that salt stress promotes an increase in plant salt secretion (Figure 3).
In this study, the concentrations of C, N, and P in the K. foliatum roots were lower than those in the leaves (Figure 5). This is because, compared to leaves, roots typically have relatively lower concentrations of C, N, and P, as their main function is to transport absorbed water and nutrients to the leaves [48]. Secondly, leaves are the assimilation organs for plants to obtain energy and synthesize photosynthesis; therefore, carbohydrates are effectively accumulated in the leaves. The N, P contents and N:P ratio of the K. foliatum leaves were higher than those of the roots (Figure 5), indicating that the two organs allocate available nutrients in different ways to cope with soil environmental changes [49]. For example, under soil salt stress, plants can regulate limited nutrients between organs, especially with a higher proportion of N and P allocated to photosynthetic organs (leaves) than non-photosynthetic organs (roots) to maintain normal carbon assimilation or plant growth [50]. Salt stress causes physiological limitations on plants, including osmotic stress, nutrient imbalance, and interference with photosynthesis, which can affect the plant growth and alter the C:N:P stoichiometric ratio between the plant organs [51]. In this study, in addition to the root carbon contents, the concentrations of N and P in the K. foliatum leaves were lower under high-salinity conditions (Figure 5), indicating that salt stress affects plant growth and development by limiting nutrient acquisition [10]. Under salt stress, plants typically exhibit nutrient metabolism disorders due to the presence of a large number of anions (such as chloride and sulfate ions) in the soil that may compete for nutrients, thereby reducing nutrient absorption and organic matter accumulation [52]. Generally speaking, P is important for the composition of ATPase, which plays a crucial role in plant photosynthesis and energy metabolism [10]. The decrease in the P concentration in K. foliatum leaves in high-salt soil is mainly due to the presence of more anions in the soil, which can affect the P concentration, leading to a decrease in the plant photosynthesis rate and thereby affecting the plant absorption of P [53]. The decrease in the nitrogen content in K. foliatum roots may be due to the reduced nitrogen accumulation in the plants due to increased chloride absorption, resulting in a decrease in the ability of K. foliatum to absorb and utilize nitrogen [54]. Some energy and nutrients are allocated to the osmotic regulation of the roots to maintain an osmotic balance, thereby reducing the absorption of N and P by the roots [51,55]. In the high-salt habitat, the N and P contents of the K. foliatum roots decreased, while the N:P ratio increased. Affected by root osmotic regulation, the nutrient transport from root to leaf is limited, resulting in a decrease in the available nutrients for leaf photosynthesis and a decrease in the photosynthetic capacity [55].
The increases in the Na+ content and K+ exosmosis inhibit the absorption of other mineral elements by plant roots; that is, osmotic pressure and ion stress caused by high concentrations of ions disrupt the normal physiological metabolism of plants, and even cause death. Potassium is an essential nutrient element that plays an important role in enzyme activation, osmotic regulation, expansion generation, membrane potential regulation, and cytoplasmic pH homeostasis [56]. Due to the similarity in the physical and chemical properties between Na+ and K+ (i.e., similar ion radii and ion hydration energies), Na+ and K+ compete in the metabolic process, inhibiting the activities of many enzymes that require K+ to function [57,58]. This study indicated that the accumulation of Na+ in the roots was smaller than in the leaves (Figure 6), which is consistent with the research results of Wang et al. [59], indicating that the roots of this species can promote the transport of sodium ions to the leaves. This can protect the root system with relatively vigorous metabolism, ensuring the absorption of water and other nutrients by the root system, and it can reduce the leaf osmotic potential, promote upward water transport, and reduce the salt concentration in the plant body. At the same time, it can take salt ions out of the body through leaf aging and withering [60,61]. This study indicates that, despite the accumulation of a large amount of Na+ in the leaves, they had no obvious symptoms of salt damage. Previous studies have shown that a large amount of Na+ in plant leaves enters the vacuoles during salt stress, leading to regionalization. This reduces the salt concentration in the cytoplasm to maintain normal metabolic activity, and it increases the ion concentration in the vacuoles to reduce the cell’s water potential and ensure normal water absorption. Some people believe that the survival of plants under salt stress requires a high K+/Na+ ratio in the cytoplasm. This study found that the K+/Na+ ratio of the roots and leaves significantly increased in the high-salt habitat (Figure 7). In addition, this study also found that the K+ contents in the leaves increased in the high-salt habitat, indicating that the roots can specifically transport K+ from the roots to the leaves, thereby maintaining a low K+/Na+ ratio in the leaves to reduce ion toxicity caused by salt stress. Although Cl has an auxiliary effect on promoting chlorophyll synthesis, high concentrations of Cl can affect photosynthesis and disrupt the cell expansion balance [62]. In this study, the Cl concentrations in the leaves in the high-salt habitat were higher than those in the low-salt habitat, which is consistent with Ehsan et al. (2010)’s finding that the Cl content in broad bean leaves increases with the increasing salt content [63]. Moreover, a high chloride ion concentration can reduce the photosynthetic capacity and photon yield, damaging the PSII structure.
In plants, sugar, as a metabolic resource and structural component of cells, participates in cell osmotic regulation in salt stress environments [64,65]. In this study, the soluble sugar content of the K. foliatum leaves increased in the high-salt habitat (Figure 8), which is consistent with the research results of Wang et al. [66]. Salt stress will first affect the plant roots, and the excessive ROS induced by salt stress seriously affect the root growth [67]. Proline is an important osmoregulation substance that plays an important role in plant responses to osmotic and salt stress by protecting the plant cell membranes and proteins, and it serves as a reactive oxygen species scavenger [68]. Proline synthesis is considered the main pathway for plant metabolite accumulation under abiotic stress [69]. The changes in the proline contents of different species under salt stress may vary. Proline rapidly accumulates in mangroves and Australian wild rice under salt stress [70,71], but it decreases in both pearl millet and wheat [72]. This study found that, with the increase in the salt content, the proline contents in the leaves and roots of the K. foliatum significantly increased (Figure 8), and the proline contents in the K. foliatum roots were lower than those in the leaves, which is consistent with the research results on Populus euphratica. Similarly, the proline contents of the K. foliatum leaves grown in the desert saline alkali land of the Hexi Corridor in Gansu Province significantly increased with the increase in the soil salinity [73]. Under NaCl stress, the content of proline in P. euphratica roots is low, but it is high in the branches and leaves [74]. This may be because plants can adjust the proportion of proline in their roots and leaves appropriately through low levels of proline accumulation. Under salt stress, the balance between ROS production and clearance is disrupted, leading to the accumulation of ROS in plant cells and inducing oxidative damage [75]. Plants have antioxidant enzyme systems to alleviate oxidative damage caused by ROS under salt stress. This study found that the activity of antioxidant enzymes (SOD and POD) in the leaves and roots of K. foliatum increased under the high-salt condition (Figure 9), indicating that K. foliatum can increase the activity of antioxidant enzyme systems to alleviate oxidative damage caused by ROS under salt stress. The enhancement of the antioxidant enzyme system activity also alleviates the ion toxicity caused by high Na+ contents in roots under salt stress. The SOD content decreased with the increase in the NaCl + Na2SO4 concentration, and it gradually increased after reaching the minimum at a salt concentration of 250 mM. Under a single salt stress, the SOD activity reached its maximum at a salt concentration of 250 mM. This indicated that the response of K. foliatum in natural habitats to salt stress was different from that of K. foliatum cultured indoors [44]. This study found that the activities of SOD and CAT in the leaves were higher than those in the roots, which is consistent with the results obtained by Daccord et al. for legumes [76]. As a product of lipid peroxidation, MDA is a good indicator for measuring oxidative membrane damage. MDA is an indicator of plant oxidative stress [77], and it accumulates continuously to form oxidative stress [20], commonly used to evaluate the degree of plant oxidative damage [78]. This study found that, under salt stress, the salt content increased and the MDA content in the roots significantly increased, promoting the production of reactive oxygen species in the roots and enhancing lipid peroxidation. Some studies have also found that excessive salt content can significantly reduce the MDA content, which may be attributed to the role of antioxidants in plants [79], triggering antioxidant reactions.
Research on the correlation between the leaf traits and root traits has been ongoing, and it has been found that there is indeed a certain correlation between the two within a certain region [80]. The number of positive correlations between the roots and leaves in the high-salt habitat is greater than that in the low-salt habitat (Figure 10), indicating that salt can alter the interaction between the plant roots and leaves. This is consistent with Yang’s finding that the correlation between the leaf chemical traits in high-salt habitats is higher, and the network is more complex [81]. Numerous studies have shown that higher correlations between the traits enable plants to effectively acquire resources [81], while plants in desert areas may face stronger environmental pressures, often resulting in closer trait correlations and trade-offs [82]. The SOD activity in the leaves and CAT activity in roots of medium K. foliatum are the “central traits” in high-salt habitats. In low-salt habitats, the leaf MDA and root C/N are the central traits of the leaves and roots (Table 3 and Table 4), indicating that K. foliatum adapts to changes in salt environments in different ways. There are many insignificant correlations in the parts not shown in this study, which may be due to greater variability in and uncertainty about the plant root traits or lead to insignificant correlations. In summary, the correlation between the leaf and root traits is relatively complex [83], so the specific correlation between the two needs further exploration.

5. Conclusions

The results of this study indicate that K. foliatum can adapt to high-salinity habitats by regulating the development of the mesophyll cells in the leaves and increasing the proportion of palisade tissue in the mesophyll. In high-salt habitats, large amounts of salt crystals precipitate from K. foliatum leaves, while, in low-salt environments, salt crystals precipitate less, indicating that salt stress promotes an increase in plant salt secretion. The salt content leads to changes in the distribution ratio of the carbon, nitrogen, and phosphorus elements in the leaves and roots of K. foliatum. The soluble protein of the K. foliatum leaves of the two different salt habitats showed higher levels in the low-salt habitat than in the high-salt habitat, while the protein changes in the roots were the opposite to those in the leaves. The leaves respond to salt stress by reducing soluble proteins, while the roots exhibit the opposite trend. The leaves respond to salt stress by increasing starch and soluble sugars, while the changes in the roots are the opposite to those in the leaves. K. foliatum leaves and roots adapt to high-salt stress by increasing their proline contents and SOD and POD activities. The plant trait network indicates that the key quantitative traits of K. foliatum leaves and roots in high-salt and low-salt habitats are significantly different.

Author Contributions

Investigation, L.J., D.W., W.L., Y.L., E.L., X.L. and G.Y.; conceptualization, L.J. and X.H.; methodology, L.J.; software, L.J., D.W. and W.L.; writing—original draft preparation, L.J.; writing—review and editing, L.J.; supervision, X.H.; funding acquisition, X.H. All authors have read and agreed to the published version of the manuscript.

Funding

This research was financially supported by the National Natural Science Foundation of China (32260266), Special project of central government guiding local science and technology development (ZYYD2023A03) and the National Natural Science Foundation of China (32101360).

Institutional Review Board Statement

Not applicable.

Informed Consent Statement

Not applicable.

Data Availability Statement

Data are contained within the article.

Conflicts of Interest

The authors declare that they have no conflicts of interest.

References

  1. Jamil, A.; Riaz, S.; Ashraf, M.; Foolad, M.R. Gene expression profiling of plants under salt stress. Crit. Rev. Plant Sci. 2011, 30, 435–458. [Google Scholar] [CrossRef]
  2. Kumar, P.; Sharma, P.K. Soil salinity and food security in India. Front. Sustain. Food Syst. 2020, 4, 533781. [Google Scholar] [CrossRef]
  3. Flowers, T.J.; Colmer, T.D. Salinity tolerance in halophytes. New Phytol. 2008, 179, 945–963. [Google Scholar] [CrossRef]
  4. Rao, Y.; Peng, T.; Xue, S. Mechanisms of plant saline-alkaline tolerance. J. Plant Physiol. 2023, 281, 153916. [Google Scholar] [CrossRef]
  5. Taïbi, K.; Taïbi, F.; Abderrahim, L.A.; Ennajah, A.; Belkhodja, M.; Mulet, J.M. Effect of salt stress on growth, chlorophyll content, lipid peroxidation and antioxidant defence systems in Phaseolus vulgaris L. S. Afr. J. Bot. 2016, 105, 306–312. [Google Scholar] [CrossRef]
  6. Ghazali, G.E. Suaeda vermiculata Forssk. ex J.F. Gmel.: Structural characteristics and adaptations to salinity and drought: A review. Int. J. Sci. 2020, 9, 28–33. [Google Scholar]
  7. Neel, J.P.S.; Alloush, G.A.; Belesky, D.P.; Clapham, W.M. Influence of rhizosphere ionic strength on mineral composition, dry matter yield and nutritive value of forage chicory. J. Agron. Crop Sci. 2002, 188, 398–407. [Google Scholar] [CrossRef]
  8. Teng, X.X.; Cao, W.L.; Lan, H.X.; Tang, H.J.; Bao, Y.M.; Zhang, H.S. OsNHX2, an Na+/H+ antiporter gene, can enhance salt tolerance in rice plants through more effective accumulation of toxic Na in leaf mesophyll and bundle sheath cells. Acta Physiol. Plant. 2017, 39, 113. [Google Scholar] [CrossRef]
  9. Liu, J.; Gao, H.; Wang, X.; Zheng, Q.; Wang, C.; Wang, X.; Wang, Q. Effects of 24-epibrassinolide on plant growth, osmotic regulation and ion homeostasis of salt-stressed canola. Plant Biol. 2014, 16, 440–450. [Google Scholar] [CrossRef]
  10. Rong, Q.; Liu, J.; Cai, Y.; Lu, Z.; Zhao, Z.; Yue, W.; Xia, J. Leaf carbon, nitrogen and phosphorus stoichiometry of Tamarix chinensis Lour. in the Laizhou Bay coastal wetland, China. Ecol. Eng. J. Ecotechnol. 2015, 76, 57–65. [Google Scholar] [CrossRef]
  11. Chrysargyris, A.; Papakyriakou, E.; Petropoulos, S.A.; Tzortzakis, N. The combined and single effect of salinity and copper stress on growth and quality of Mentha spicata plants. J. Hazard. Mater. 2019, 368, 584–593. [Google Scholar] [CrossRef]
  12. Seki, M.; Ishida, J.; Narusaka, M.; Fujita, M.; Nanjo, T.; Umezawa, T.; Kamiya, A.; Nakajima, M.; Enju, A.; Sakurai, T. Monitoring the expression pattern of around 7000 Arabidopsis genes under aba treatments using a full-length cDNA microarray. Funct. Integr. Genom. 2002, 2, 282–291. [Google Scholar] [CrossRef]
  13. Theerawitaya, C.; Boriboonkaset, T.; Cha-Um, S.; Supaibulwatana, K.; Kirdmanee, C. Transcriptional regulations of the genes of starch metabolism and physiological changes in response to salt stress rice (Oryza sativa L.) seedlings. Physiol. Mol. Biol. Plants 2012, 18, 197–208. [Google Scholar] [CrossRef]
  14. Thalmann, M.; Santelia, D. Starch as a determinant of plant fitness under abiotic stress. New Phytol. 2017, 214, 943–951. [Google Scholar] [CrossRef]
  15. Henry, C.; Bledsoe, S.W.; Griffiths, C.A.; Paul, M.J.; Kollman, A.; SAKR, S.; Lagrimini, M. Differential role for trehalose metabolism in salt-stressed maize. Plant Physiol. 2015, 169, 1072–1089. [Google Scholar] [CrossRef]
  16. Oury, V.; Caldeira, C.F.; Prodhomme, D.; Pichon, J.-P.; Gibon, Y.; Tardieu, F.; Turc, O. Is change in ovary carbon status a cause or a consequence of maize ovary abortion in water deficit during flowering? Plant Physiol. 2016, 171, 997–1008. [Google Scholar] [CrossRef]
  17. Tang, X.; Mu, X.; Shao, H.; Wang, H.; Brestic, M. Global plant-responding mechanisms to salt stress: Physiological and molecular levels and implications in biotechnology. Crit. Rev. Biotechnol. 2015, 35, 425–437. [Google Scholar] [CrossRef]
  18. Zhang, Q.; Dai, W. Plant Response to Salinity Stress. In Stress Physiology of Woody Plants; Dai, W., Ed.; CRC Press: Boca Raton, FL, USA, 2019. [Google Scholar]
  19. Demidchik, V. Mechanisms of oxidative stress in plants: From classical chemistry to cell biology. Environ. Exp. Bot. 2015, 109, 212–228. [Google Scholar] [CrossRef]
  20. Kaya, C.; Akram, N.A.; Ashraf, M.; Sonmez, O. Exogenous application of humic acid mitigates salinity stress in maize (Zea mays L.) plants by improving some key physico-biochemical attributes. Cereal Res. Commun. 2018, 46, 67–78. [Google Scholar] [CrossRef]
  21. Grebosz, J.; Badowiec, A.; Weidner, S. Changes in the root proteome of Triticosecale grains germinating under osmotic stress. Acta Physiol. Plant. 2014, 36, 825–835. [Google Scholar] [CrossRef]
  22. Wang, G.; Jin, J. Effects of NaCl on physiology and leaf ultrastructure in the halophyte Kalidium foliatum. Nord. J. Bot. 2015, 33, 232–238. [Google Scholar] [CrossRef]
  23. Zhang, Z.D.; Gu, M.Y.; Tang, Q.Y.; Chu, M.; Zhu, J.; Sun, J.; Yang, R.; Xu, W.L. Screening of Salt-tolerant and Growth-promoting Bacteria in the rhizosphere of Kalidium foliatum and the Functional Identification in Pot Experiments. J. Agric. Sci. Technol. 2021, 23, 186–192. [Google Scholar]
  24. Yang, X.-D.; Anwar, E.; Zhou, J.; He, D.; Gao, Y.-C.; Lv, G.-H.; Cao, Y.-E. Higher association and integration among functional traits in small tree than shrub in resisting drought stress in an arid desert. Environ. Exp. Bot. 2022, 201, 104993. [Google Scholar] [CrossRef]
  25. Gong, Y.; Ling, H.; Lv, G.; Chen, Y.; Guo, Z.; Cao, J. Disentangling the influence of aridity and salinity on community functional and phylogenetic diversity in local dryland vegetation. Sci. Total. Environ. 2019, 653, 409–422. [Google Scholar] [CrossRef]
  26. Jiang, L.; Hu, D.; Wang, H.F.; Lv, G. Discriminating ecological processes affecting different dimensions of α- and β-diversity in desert plant communities. Ecol. Evol. 2022, 12, e8710. [Google Scholar] [CrossRef]
  27. Lu, R.K. Soil Agrochemical Analysis Methods; China Agricultural Science and Technology Press: Beijing, China, 2000. [Google Scholar]
  28. Harmut, A.J.M.E. Chlorophylls and carotenoids: Pigments of photosynthetic membranes. Methods Enzymol. 1987, 148, 350–383. [Google Scholar]
  29. Bradford, M.M. A rapid and sensitive method for the quantitation of microgram quantities of protein utilizing the principle of protein-dye binding. Anal. Biochem. 1976, 72, 248–254. [Google Scholar] [CrossRef]
  30. Khelil, A.; Menu, T.; Ricard, B. Adaptive response to salt involving carbohydrate metabolism in leaves of a salt-sensitive tomato cultivar. Plant Physiol. Biochem. 2007, 45, 551–559. [Google Scholar] [CrossRef]
  31. Lepesant, J.A.; Kunst, F.; Lepesant-Kejzlarová, J.; Dedonder, R. Chromosomal location of mutations affecting sucrose metabolism in Bacillus subtilis Marburg. Mol. Gen. Genet. 1972, 118, 135–160. [Google Scholar] [CrossRef]
  32. Gomes, H.T.; Bartos, P.M.C.; Silva, C.O.; Amaral, L.I.V.D.; Scherwinskipereira, J.E. Comparative biochemical profiling during the stages of acquisition and development of somatic embryogenesis in African oil palm (Elaeis guineensis Jacq.). Plant Growth Regul. 2014, 74, 199–208. [Google Scholar] [CrossRef]
  33. Stewart, R.R.; Bewley, J.D. Lipid peroxidation associated with accelerated aging of soybean axes. Plant Physiol. 1980, 65, 245–248. [Google Scholar] [CrossRef]
  34. Hammerschmidt, R.; Nuckles, E.M.; Kuć, J. Association of enhanced peroxidase activity with induced systemic resistance of cucumber to Colletotrichum lagenarium. Physiol. Plant Pathol. 1982, 20, 73–82. [Google Scholar] [CrossRef]
  35. Panda, A.; Rangani, J.; Kumari, A.; Parida, A.K. Efficient regulation of arsenic translocation to shoot tissue and modulation of phytochelatin levels and antioxidative defense system confers salinity and arsenic tolerance in the Halophyte Suaeda maritima. Environ. Exp. Bot. 2017, 143, 49–171. [Google Scholar] [CrossRef]
  36. Hodges, D.M.; DeLong, J.M.; Forney, C.F.; Prange, R.K. Improving the thiobarbituric acid-reactive-substances assay for estimating lipid peroxidation in plant tissues containing anthocyanin and other interfering compounds. Planta 1999, 207, 604–611. [Google Scholar] [CrossRef]
  37. Yang, J.F.; Zhang, X.N.; Song, D.H.; Tian, J.Y. Interspecific Integration of Chemical Traits in Desert Plant Leaves with Variations in Soil Water and Salinity Habitats. Forest 2023, 14, 1963. [Google Scholar] [CrossRef]
  38. Li, Y.; Liu, C.; Sack, L.; Xu, L.I.; Li, M.; Zhang, J.; He, N.; Penuelas, J. Leaf trait network architecture shifts with species-richness and climate across forests at continental scale. Ecol. Lett. 2022, 25, 1442–1457. [Google Scholar] [CrossRef]
  39. Rosas, T.; Mencuccini, M.; Barba, J.; Cochard, H.; Saura-Mas, S.; Martinez-Vilalta, J. Adjustments and coordination of hydraulic, leaf and stem traits along a water availability gradient. New Phytol. 2019, 223, 632–646. [Google Scholar] [CrossRef]
  40. Kiani-Pouya, A.; Rasouli, F. The potential of leaf chlorophyll content to screen bread-wheat genotypes in saline condition. Photosynthetica 2014, 52, 288–300. [Google Scholar] [CrossRef]
  41. Wu, S.; Wang, J.; Yan, Z.; Wu, J. Monitoring tree-crown scale autumn leaf phenology in a temperate forest with an integration of Planet Scope and drone remote sensing observations. ISPRS J. Photogramm. Remote Sens. 2021, 171, 36–48. [Google Scholar] [CrossRef]
  42. Larcher, W. Photosynthesis as a tool for indicating temperature stress events. In Ecophysiology of Photosynthesis; Schulze, E.D., Caldwell, M.M., Eds.; Springer: Berlin/Heidelberg, Germany, 1995. [Google Scholar]
  43. Parvin, K.; Hasanuzzaman, M.; Bhuyan, M.B.; Nahar, K.; Mohsin, S.M.; Fujita, M. Comparative physiological and biochemical changes in tomato (Solanum lycopersicum L.) under salt stress and recovery: Role of antioxidant defense and glyoxalase systems. Antioxidants 2019, 8, 350. [Google Scholar] [CrossRef]
  44. Gong, D.H.; Wang, G.Z.; Si, W.T.; Zhou, Y.; Liu, Y.; Jia, J. Effects of salt stress on photosynthetic pigments and activity of ribulose-1,5-bisphosphate carboxylase/oxygenase in Kalidium foliatum. Russ. J. Plant Physiol. 2018, 65, 98–103. [Google Scholar] [CrossRef]
  45. Rao, G.C.; Rao, G.R. Pigment composition and chlorophyllase activity in pigeon pea (Cajanus indicus Spreng) and Gingelley (Sesamum indicum L.) under NaCl salinity. Indian J. Exp. Biol. 1981, 19, 768–770. [Google Scholar]
  46. Kacharava, N.; Chanishvili, S.; Badridze, G.; Chkhubianishvili, E.; Janukashvili, N. Effect of seed irradiation on the content of antioxidants in leaves of Kidney bean, Cabbage and Beet cultivars. Aust. J. Crop Sci. 2009, 3, 137. [Google Scholar]
  47. Ashraf, M.; Ozturk, M.; Ahmad, M.S.A. Plant Adaptation and Phytoremediation: Structural and Functional Adaptations in Plants for Salinity Tolerance; Springer: Berlin/Heidelberg, Germany, 2010. [Google Scholar]
  48. Luo, Y.; Peng, Q.; Li, K.; Gong, Y.; Han, W. Patterns of nitrogen and phosphorus stoichiometry among leaf, stem and root of desert plants and responses to climate and soil factors in Xinjiang, China. Catena 2021, 199, 105100. [Google Scholar] [CrossRef]
  49. He, M.Z.; Zhang, K.; Tan, H.J.; Hu, R.; Su, J.Q.; Wang, J.; Huang, L.; Zhang, Y.F.; Li, X.R. Nutrient levels within leaves, stems, and roots of the xeric species Reaumuria soongoricain relation to geographical, climatic, and soil conditions. Ecol. Evol. 2015, 5, 1494–1503. [Google Scholar] [CrossRef]
  50. Thompson, K.E.N.; Parkinson, J.A.; Band, S.R.; Spencer, R.E. A comparative study of leaf nutrient concentrations in a regional herbaceous flora. New Phytol. 1997, 36, 679–689. [Google Scholar] [CrossRef]
  51. Sun, X.; Gao, Y.; Wang, D.; Chen, J.; Zhang, F.; Zhou, J.; Yan, X.; Li, Y.; Luo, Z.B. Stoichiometric variation of halophytes in response to changes in soil salinity. Plant Biol. 2017, 19, 360–367. [Google Scholar] [CrossRef]
  52. Balba, M.A. Management of Problem Soils in Arid Ecosystems; CRC Press: Boca Raton, FL, USA, 1995. [Google Scholar]
  53. Joshi, S.S. Effect of salinity stress on organic and mineral constituents in the leaves of pigeonpea (Cajanus cajan L. var C-11). Plant Soil 1984, 82, 69–76. [Google Scholar] [CrossRef]
  54. Ramoliya, P.J.; Patel, H.M.; Joshi, J.B.; Pandey, A.N. Effect of salinization of soil on growth and nutrient accumulation in seedlings of Prosopis cineraria. J. Plant Nutr. 2006, 29, 283–303. [Google Scholar] [CrossRef]
  55. Azzeme, A.M.; Abdullah, S.; Aziz, M.A.; Wahab, P.E.M. Oil palm leaves and roots differ in physiological response, antioxidant enzyme activities and expression of stress-responsive genes upon exposure to drought stress. Acta Physiol. Plant. 2016, 38, 52. [Google Scholar] [CrossRef]
  56. Barragan, V.; Leidi, E.O.; Andrés, Z.; LRubio Luca, A.D.; Fernandez, J.A.; Cubero, B.; Pardo, J.M. Ion exchangers NHX1 and NHX2 mediate active potassium uptake into vacuoles to regulate cell turgor and stomatal function in Arabidopsis. Plant Cell 2012, 24, 1127–1142. [Google Scholar] [CrossRef] [PubMed]
  57. Mansour, M.M.F. Plasma membrane permeability as an indicator of salt tolerance in plants. Biol. Plant. 2012, 57, 1–10. [Google Scholar] [CrossRef]
  58. Patade, V.Y.; Bhargava, S.; Suprasanna, P. Effects of NaCl and iso-osmotic peg stress on growth, osmolytes accumulation and antioxidant defense in cultured sugarcane cells. Plant Cell Tissue Organ. Cult. 2012, 108, 279–286. [Google Scholar] [CrossRef]
  59. Wang, X.J.; Yang, D.; Yi, F.Y.; Zhang, Y.Y.; Saixiyala, B.S.; Sun, H.L. Research Progress on the Halophyte Kalidium foliatum and Its Resources Characteristics. Anim. Husb. Feed. Sci. 2015, 36, 64–67. [Google Scholar]
  60. Luo, D.; Wu, Z.B.; Shi, Y.J. Effects of salt stress on leaf analomical structure and ion absorption, transportation and distribution of three Ping’ ou hybrid hazelnut seedlings. Acta Ecol. Sin. 2022, 42, 1876–1888. [Google Scholar]
  61. Tang, X.Q.; Li, H.Y.; Yang, X.Y.; Liu, Z.X.; Zhang, H.X. Effects of short-time salt stress on distribution and balance of Na+ and K+ in Nitraria sibirica Pall. seedlings. For. Res. 2017, 30, 1022–1027. [Google Scholar]
  62. Lekklar, C.; Chadchawan, S.; Boon-Long, P.; Pfeiffer, W.; Chaidee, A. Salt stress in rice: Multivariate analysis separates four components of beneficial silicon action. Protoplasma 2019, 256, 331–347. [Google Scholar] [CrossRef]
  63. Ehsan, T.; Pichu, R.; Mcdonald, G.K. High concentrations of Na+ and Cl ions in soil solution have simultaneous detrimental effects on growth of faba bean under salinity stress. J. Exp. Bot. 2010, 61, 4449–4459. [Google Scholar]
  64. Kaplan, F.; Kopka, J.; Haskell, D.W.; Zhao, W.; Schiller, K.C.; Gatzke, N.; Sung, D.Y.; Guy, C.L. Exploring the temperature-stress metabolome of Arabidopsis. Plant Physiol. 2004, 1364, 4159–4168. [Google Scholar] [CrossRef]
  65. Rosa, M.; Prado, C.; Podazza, G.; Interdonato, R.; Prado, F.E. Soluble sugars-metabolism, sensing and abiotic stress: A complex network in the life of plants. Plant Signal. Behav. 2009, 4, 388. [Google Scholar] [CrossRef]
  66. Wang, Y.; Stevanato, P.; Yu, L.; Zhao, H.J.; Sun, X.W.; Sun, F.; Li, J.; Geng, G. The physiological and metabolic changes in sugar beet seedlings under different levels of salt stress. J. Plant Res. 2017, 1306, 1079–1093. [Google Scholar] [CrossRef] [PubMed]
  67. Wang, C.; Bi, S.T.; Liu, C.Y.; Li, M.; He, M. Arabidopsis ADF7 inhibits VLN1 to regulate actin filament dynamics and ROS accumulation in root hair development responses to osmotic stress. Authorea 2021, 2. [Google Scholar] [CrossRef]
  68. Guo, R.; Yang, Z.Z.; Li, F.; Yan, C.; Zhong, X.; Qi, L.; Xu, X.; Li, H.; Long, Z. Comparative metabolic responses and adaptive strategies of wheat (Triticum aestivum) to salt and alkali stress. BMC Plant Biol. 2015, 15, 170. [Google Scholar] [CrossRef]
  69. Kishor, P.B.K.; Sreenivasulu, N. Is proline accumulation per se correlated with stress tolerance or is proline homeostasis a more critical issue? Plant Cell Environ. 2014, 37, 300–311. [Google Scholar] [CrossRef] [PubMed]
  70. Afefe, A.A.; Khedr, A.; Abbas, M.S.; Soliman, A. Responses and tolerance mechanisms of mangrove trees to the ambient salinity along the Egyptian red sea coast. Limnol. Rev. 2021, 21, 3–13. [Google Scholar] [CrossRef]
  71. Nguyen, H.T.; Bhowmik, S.D.; Long, H.; Cheng, Y.; Mundree, S.; Mundree, S.; Hoang, L.T.M. Rapid accumulation of proline enhances salinity tolerance in Australian wild rice Oryza australiensis domin. Plants 2021, 10, 2044. [Google Scholar] [CrossRef] [PubMed]
  72. Yadav, T.; Kumar, A.; Yadav, R.K.; Yadav, T.; Kushwaha, M. Salicylic acid and thiourea mitigate the salinity and drought stress on physiological traits governing yield in pearl millet-wheat. Saudi J. Biol. Sci. 2020, 27, 2010–2017. [Google Scholar] [CrossRef] [PubMed]
  73. Zhang, Y.F.; Chen, T.S.; Fei, G.Q.; Zhang, M.X.; An, L.Z. Effects of Salinity on the Contents of Osmotica of Three Desert Plants. J. Desert Res. 2007, 27, 787–790. [Google Scholar]
  74. Watanabe, S.; Kojima, K.; Ide, Y.; Sasaki, S. Effects of saline and osmotic stress on proline and sugar accumulation in Populus euphratica in vitro. Plant Cell Tissue Organ. Cult. 2000, 63, 199–206. [Google Scholar] [CrossRef]
  75. Liu, S.G.; Zhu, D.Z.; Chen, G.H.; Gao, X.Q.; Zhang, X.S. Disrupted actin dynamics trigger an increment in the reactive oxygen species levels in the Arabidopsis root under salt stress. Plant Cell Rep. 2012, 31, 1219–1226. [Google Scholar] [CrossRef]
  76. Daccord, N.; Celton, J.M.; Linsmith, G.; Becker, C.; Choisne, N.; Schijlen, E.; Van de Geest, H.; Bianco, L.; Micheletti, D.; Velasco, R. High-quality de novo assembly of the apple genome and methylome dynamics of early fruit development. Nat. Genet. 2017, 49, 1099–1106. [Google Scholar] [CrossRef] [PubMed]
  77. Shi, Y.; Wen, Z.N.; Cong, S.H. Comparisons of relationships between leaf and fine root traits in hilly are of the loess Plateau, Yanne Biver basin. Acta Ecol. Sin. 2011, 31, 6805–6814. [Google Scholar]
  78. Wang, Q.; Wu, C.; Xie, B.; Liu, Y.; Cui, J.; Chen, G.; Zhang, Y. Model analysing the antioxidant responses of leaves and roots of switchgrass to NaCl-salinity stress. Plant Physiol. Biochem. 2012, 58, 288–296. [Google Scholar] [CrossRef]
  79. Jithesh, M.N.; Prashanth, S.R.; Sivaprakash, K.R.; Parida, A.K. Antioxidative response mechanisms in halophytes: Their role in stress defence. J. Genet. 2006, 85, 237–254. [Google Scholar] [CrossRef] [PubMed]
  80. Withington, J.M.; Reich, P.B.; Oleksyn, J.; Eissenstat, D.M. Compari-sons of structure and life span in roots and leaves amongtemperate trees. Ecol. Monogr. 2006, 76, 381–397. [Google Scholar] [CrossRef]
  81. Flores-Moreno, H.; Fazayeli, F.; Banerjee, A.; Datta, A.; Kattge, J.; Butler, E.E.; Atkin, O.K.; Wythers, K.; Chen, M.; Anand, M.; et al. Robustness of trait connections across environmental gradients and growth forms. Glob. Ecol. Biogeogr. 2019, 28, 1806–1826. [Google Scholar] [CrossRef]
  82. Liu, C.C.; Li, Y.; Xu, L.; Chen, Z.; He, N.P. Variation in leaf morphological, stomatal, and anatomical traits and their relationships in temperate and subtropical forests. Sci. Rep. 2019, 9, 5803. [Google Scholar] [CrossRef]
  83. Laughlin D, C. The intrinsic dimensionality of plant traits and its relevance to community assembly. J. Ecol. 2014, 102, 186–193. [Google Scholar] [CrossRef]
Figure 1. Schematic diagram of plot layout and plant morphology (A and B represent high-salt and low-salt sample plots).
Forests 15 00148 g001
Figure 2. Differences in chlorophyll content of K. foliatum under two saline habitats (difference lowercase indicates significant difference between the high salt and lower salt).
Forests 15 00148 g002
Figure 3. Scanning electron microscopic images of K. foliatum leaf in high-salt habitat showing (AD) overall appearance structure, guard cell and stomata morphology of the upper epidermis of the leaf, and (EH) overall appearance structure, guard cell, and stomata morphology of the lower epidermis of the leaf.
Forests 15 00148 g003
Figure 4. Scanning electron microscopic structure of K. foliatum leaf in low-salt habitat ((AD) represent the overall appearance of the structure, vessel, and thin-wall cell morphology of fine roots (<0.2 mm) in high-salt habitats, while (EH) represent the overall appearance of the structure, vessel, and thin-wall cell morphology of fine roots (<0.2 mm) in low-salt habitats).
Forests 15 00148 g004
Figure 5. Differences in nutrient contents and stoichiometric ratios of K. foliatum leaves and roots under two saline habitats (H and L represent high-salt and low-salt habitats. (AF) Plant carbon contents (PCCs), nitrogen contents (PNCs), phosphorus contents (PPCs), and stochiometric ratios of C-N (C:N), N-P (N:P), and C-P (C:P). Different lowercase letters represent significant differences between leaves and roots in different saline habitats, while unlabeled letters represent insignificant differences. The number of repeats was six).
Forests 15 00148 g005
Figure 6. Differences in inorganic ion contents of K. foliatum leaves and roots under two saline habitats (H and L represent high-salt and low-salt habitats. Different lowercase letters represent significant differences in inorganic ion contents of K. foliatum leaves and roots in different saline habitats, while unlabeled letters represent insignificant differences. (AF) Concentrations of Na+, K+, Ca2+, Mg2+, Cl, and sulfate anions. The number of repeats was six).
Forests 15 00148 g006
Figure 7. Differences in the stoichiometries of inorganic ion contents of K. foliatum leaves and roots under two saline habitats (H and L represent high-salt and low-salt habitats. Different lowercase letters represent significant differences in inorganic ion contents of K. foliatum leaves and roots in different saline habitats, while unlabeled letters represent insignificant differences. (AC) The ratios of K+/Na+, Ca2+/Na+, and Mg2+/Na+. The number of repeats was six).
Forests 15 00148 g007
Figure 8. Differences in osmoregulation substance of K. foliatum leaves and roots under two saline habitats (H and L represent high-salt and low-salt habitats. Different lowercase letters represent significant differences in inorganic ion contents of K. foliatum leaves and roots in different saline habitats, while unlabeled letters represent insignificant differences. (AD) Soluble protein content, starch content, soluble sugar content, and proline content. The number of repeats was six).
Forests 15 00148 g008
Figure 9. Differences in antioxidant and membrane lipid peroxidation substances under two saline habitats (H and L represent high-salt and low-salt habitats. Different lowercase letters represent significant differences in inorganic ion contents of K. foliatum leaves and roots in different saline habitats, while unlabeled letters represent insignificant differences. (AD) Contents of SOD, POD, CAT, and MDA. The number of repeats was six).
Forests 15 00148 g009
Figure 10. Physiological character networks of K. foliatum leaves and roots in two salt habitats ((A,B) represent high-salt habitat and low-salt habitat, respectively. The orange circles represent leaf traits, the blue circles represent root traits, the red lines represent significant positive correlations, and the green lines represent significant negative correlations. SUG, prot, and STA represent soluble sugar, soluble protein, and starch contents).
Forests 15 00148 g010
Table 1. The physical and chemical characteristics of soil in two habits.
HL
Soil water content (%)15.25 ± 0.6112.05 ± 0.18
Soil Organic carbon content (g/kg)3.93 ± 0.192.84 ± 0.13
Soil total nitrogen content (g/kg)0.64 ± 0.160.48 ± 0.02
Soil total phosphorus content (g/kg)0.53 ± 0.010.51 ± 0.01
pH8.33 ± 0.048.00 ± 0.03
Soil ammonium nitrogen content (mg/kg)4.47 ± 0.145.03 ± 0.17
Soil nitrate nitrogen content (mg/kg)28.33 ± 0.8034.24 ± 0.63
Soil available phosphorus content (mg/kg)23.96 ± 0.8622.57 ± 1.04
Table 2. Differences in anatomical indicators of K. foliatum leaves under two saline habitats.
IndexHigh-Salt HabitatLow-Salt Habitat
Leaf thickness (μm)1325.82 ± 101.53 a1262.14 ± 23.87 a
Upper-epidermis thickness (μm)44.53 ± 2.38 a33.48 ± 1.69 b
Lower-epidermis thickness (μm)46.42 ± 1.59 a35.44 ± 2.1 b
Length of upper epidermis (μm)44.34 ± 3.79 a38.31 ± 3.29 a
Length of lower epidermis (μm)53.87 ± 4.90 a41.36 ± 3.17 b
Palisade tissue thickness (μm)23.40 ± 1.24 a17.11 ± 1.20 b
Vascular bundle aperture (μm)7.71 ± 0.40 a5.97 ± 0.31 b
Thickness ratio of palisade (%)3.60 ± 0.15 a2.83 ± 0.24 b
Note: Different lowercase letters indicate significant differences in indicators, while the same letter indicates insignificant differences.
Table 3. Network parameters of leaf and root physiological traits in high-salt habitat.
NameTypeDegreeWeight Degree
C/Nleaf32.600
C/Pleaf10.829
CATleaf10.886
protleaf11.000
Nleaf10.829
Pleaf10.829
PODleaf21.771
PROleaf32.657
SODleaf43.543
CATroot43.600
C/Nroot10.886
C/Proot21.714
STAroot10.943
MDAroot10.886
Nroot10.886
N/Proot10.886
Proot21.710
PODroot32.486
SUGroot10.943
Note: SUG, prot, and STA represent soluble sugar, soluble protein, and starch content.
Table 4. Network parameters of leaf and root physiological traits in low-salt habitat.
NameTypeDegreeWeight Degree
C/Nleaf10.829
C/Pleaf21.714
protleaf10.829
STAleaf10.829
MDAleaf43.599
Nleaf10.829
Pleaf21.714
PODleaf21.771
PROleaf10.886
SUGleaf21.829
CATroot21.771
C/Nroot43.314
CProot21.771
proteinroot10.942
STAroot10.886
Nroot10.886
N/Proot10.829
Proot21.829
PODroot10.829
PROroot10.943
SODroot10.829
Note: SUG, prot, and STA represent soluble sugar, soluble protein, and starch contents.
Disclaimer/Publisher’s Note: The statements, opinions and data contained in all publications are solely those of the individual author(s) and contributor(s) and not of MDPI and/or the editor(s). MDPI and/or the editor(s) disclaim responsibility for any injury to people or property resulting from any ideas, methods, instructions or products referred to in the content.

